Chapter 5 Imaging the Chest
The Chest Radiograph
Chest radiograph or x-ray is one of the most commonly performed imaging tests. It is a high-yield test, providing significant clinical information rapidly, at low cost, and with low radiation exposure, but many examinations are nonetheless unnecessary. In this chapter, we discuss the indications for chest x-ray, features of the chest x-ray technique and their effect on the resulting image, basic principles of chest x-ray interpretation, and a systematic algorithm for image interpretation. Following this, we present extensive figures with chest x-ray images depicting a spectrum of emergency findings. When available, corresponding computed tomography (CT) images are shown. These clarify chest x-ray findings, demonstrate the limitations of plain chest radiography, and illustrate the occasional need for advanced imaging for further delineation of pathology. This chapter focuses on chest x-ray in the nontrauma patient, although the principles also apply to patients with traumatic injuries, discussed in detail in Chapter 6.
Chest CT, ventilation–perfusion (VQ) scan, and thoracic ultrasound are discussed in detail in additional chapters focused on chest trauma (see Chapter 6), pulmonary embolism and aortic disease (see Chapter 7), and cardiac imaging (see Chapter 8).
Chest Imaging Modalities
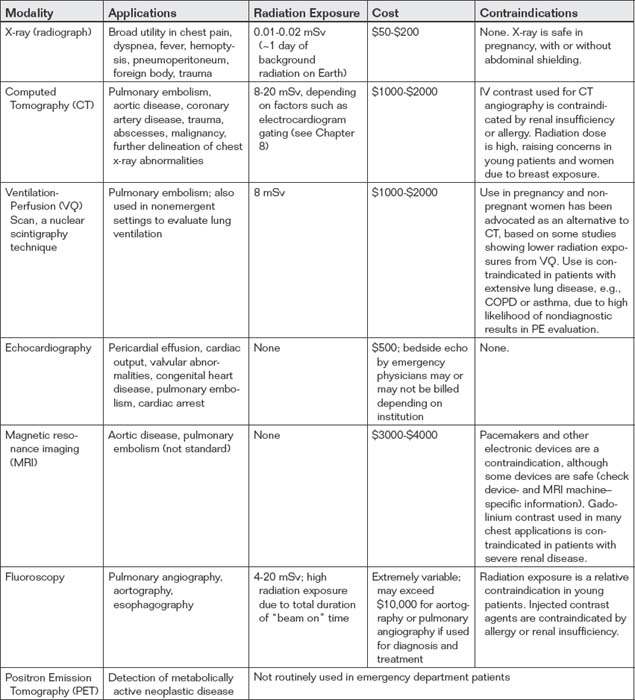
Modalities for thoracic imaging include chest radiograph (x-ray), CT, VQ scan, echocardiography, magnetic resonance (MR), fluoroscopy (used for pulmonary angiography, aortography, and upper gastrointestinal imaging), and positron emission tomography (PET). MR has a limited role in the emergency department currently, largely because of issues of cost and availability, but is used in selected patients in diagnosis of conditions such as pulmonary embolism and aortic disease. PET scanning is used primarily in detection of metabolically active neoplastic disease and is therefore not routinely used in the emergency department. Characteristics of these imaging modalities are shown in Table 5-1. Issues related to CT and MR such as iodinated contrast nephropathy and allergy, radiation, and gadolinium-associated nephrogenic systemic fibrosis are discussed in Chapters 6, 7, 8, and 15.
Cost of Chest X-ray
Chest x-ray is one of the most cost-effective imaging examinations, with the cost to patients being between $50 and $220 in many medical systems.1 However, charges for chest x-ray vary considerably, even in the same geographic region. According to data provided by health care facilities, the U.S. national average cost of chest x-ray was $370 in 2010.2 Evidence-based guidelines for imaging should be followed when available and applicable, as the total cost of common, individually inexpensive tests such as chest radiography to the U.S. medical system is enormous.
Radiation Exposure From Chest X-ray
Chest x-ray provides minimal radiation exposure, around 0.01 to 0.02 mSv.3 This is the equivalent of approximately a single day’s background radiation exposure at most locations on the Earth. It equals the additional radiation exposure incurred by taking a commercial airline flight at 35,000 feet from New York to Los Angeles. The radiation exposure is focused and is quite safe in pregnant patients, with negligible scatter radiation to the abdomen and pelvis. Abdominal shielding has not been shown to be necessary to reduce fetal exposure substantially, though it remains a recommended action for the psychological well-being of the pregnant patient.4-5 Radiation exposures from chest CT are far greater, by as much as 500 fold, and are discussed in detail in Chapters 7 and 8.
Are Health Care Workers at Risk From Chest X-ray Radiation Exposure?
The exposure to health care workers from portable chest x-rays is very low if simple precautions are taken; at a distance of 15 inches from the x-ray beam, the scatter radiation exposure is minimal (around 0.0008 mSv), requiring exposure to more than 1200 radiographs to equal annual background radiation exposure.6 Multiple other studies suggest trivial exposures to health care workers using simple precautions to distance themselves from the x-ray source.6-9 If an appropriate safe distance cannot be achieved because of patient care requirements, simple shielding devices such as thyroid and torso aprons should be used.
Clinical Indications for Chest X-ray
For reasons of time, cost, and radiation exposure as described earlier, best-evidence guidelines should be applied when possible to guide the use of chest x-ray. Chest x-ray is useful in evaluation of a multitude of patient presentations, including cough and fever, chest pain, dyspnea, hemoptysis, weight loss, hypoxia, suspected subdiaphragmatic pneumoperitoneum, even Horner’s syndrome. Given the incredible range of possible patient presentations, no single clinical decision rule can govern chest x-ray use for all cases, and the emergency physician must make clinical decisions for radiography based on the individual patient presentation. However, the value of chest x-ray in common clinical scenarios has been reviewed extensively by the American College of Radiology (ACR) in its appropriateness criteria. These criteria, published on the ACR website, are expert consensus guidelines based on review of medical literature by radiologists and experts from other medical specialties. Summaries of ACR guidelines relevant to thoracic imaging are presented in Tables 5-2 and 5-3. The ACR rates imaging studies using a 1-to-9 scale, with 9 being “most appropriate” and 1 being “least appropriate.” Although the use of plain chest radiography may appear “harmless” given its speed, relatively low cost and low radiation exposure, collective costs of unnecessary radiographs and other preoperative tests are believed to total in the billions of dollars in the United States annually.10 Other potential harms from unnecessary radiography include delays in surgery prompted by the detection of incidental findings such as pulmonary nodules and costs and morbidity of additional diagnostic procedures triggered by chest x-ray findings. Consequently, chest x-ray should be ordered with attention to the evidence supporting its use for a given clinical presentation. Unfortunately, as we will review, high quality evidence to guide clinical decisions is lacking for many potential indications for chest x-ray.
TABLE 5-2 American College of Radiology Appropriateness Criteria for Chest X-ray or Computed Tomography in Common Clinical Scenarios
| Clinical Scenario | ACR Rating for X-ray Chest | ACR Rating for CT Chest |
|---|---|---|
| Acute chest pain | ||
| 9 | CTA chest (noncoronary): 6—Useful in ruling out other causes of chest pain such as aortic dissection, pulmonary embolism, pneumothorax, pneumonia. | |
| 9—Should be performed if readily available at the bedside and does not cause delay in obtaining a CT or MRI. Alternative causes of chest pain may be discovered. Not the definitive test for aortic dissection. | CTA chest and abdomen: 9—Recommended as the definitive test in most patients with suspicion of aortic dissection. | |
| 9—to exclude other causes of chest pain | CTA chest (noncoronary): 9—Current standard of care for detection of PE. | |
| Chronic chest pain | ||
| 3—Usual initial imaging study in cardiac patients. Although used frequently, chest radiographs can neither establish nor exclude chronic ischemic heart disease. Insensitive for detecting coronary arterial calcification. Limited value in patients with high risk of CAD. | CTA coronary arteries: 7—Very good accuracy and negative predictive value in low to intermediate risk groups. However, may have false negatives in high-risk group, and negative studies may still require further diagnostic testing. Coronary calcification often found in older high-risk patients (especially males) can limit coronary luminal assessment. | |
| 9 | CTA chest (noncoronary) with contrast: 8— Important examination for pulmonary embolism and thoracic aortic aneurysm/dissection. To rule out PE and evaluate lung pathology. Appropriate for chronic anginal chest pain.CTA coronary arteries with contrast: 8—Can be used to assess for coronary atherosclerosis,anomalous coronary artery, and pericardial disease. High negative predictive value will exclude coronary artery disease and allow triage management to focus on more likely diagnoses. To eliminate unnecessary catheterizations. | |
| CHF | ||
| 9 | 2—readily diagnosed on CT obtained for other indications | |
| 4 | ||
| Dyspnea—suspected cardiac origin | 8 | CTA coronary arteries: 6CTA coronary arteries with advanced low dose techniques: 6CTA chest (noncoronary): 6 |
| Suspected bacterial endocarditis | 9 | CT heart function and morphology with contrast: 6—Multidetector with maximal temporal and spatial resolution. Probably indicated to rule out paravalvular abscess and/or psedoaneurysm. Emerging technology. |
| Known or Suspected congenital heart disease in the adult | 7 | CT heart function and morphology with contrast: 7. May be alternative to MRI and TTE/TEE. High spatial resolution to evaluate small and tortuous vessels. For evaluation of airway. CTA coronary arteries with contrast: 6. When there is a high index of suspicion for fistula or anomalous coronaries.CTA coronary arteries with contrast with advanced low dose techniques: 6. Important in young to middle-age adults because of reduced radiation dose. |
| Acute respiratory illness | Varies—see Table 5-3 | Varies |
| Acute respiratory illness in HIV-positive patients | 9 | CT chest without contrast: 8—When negative, equivocal, or nonspecific chest radiograph. |
| Chronic dyspnea—suspected pulmonary origin | 8-9—depends on age and examination | Any age, nonrevealing or nondiagnostic clinical, standard radiography, and laboratory studies. In the setting of chronic dyspnea, the most appropriate imaging study is a thin section high resolution chest CT: 9. If a patient has dyspnea not clearly of pulmonary origin, other entities such as chronic or acute pulmonary embolism may need to be excluded. In that setting, a thin section chest CT with intravenous contrast is appropriate. See the ACR Appropriateness Criteria® topic on “Acute Chest Pain–Suspected Pulmonary Embolism”. |
| Hemoptysis,Two risk factors (>40 years old and >40 pack-year history) | 9 | without contrast: 6 (useful for patients with renal failure or contrast allergy.); with contrast: 8 (optimal study shows enhancement of the systemic arteries.) |
| Rib fractures, adult < 65 years of age | 8—PA view. Rib views are given a rating of 2. | 2—with or without contrast |
| Routine admission and preoperative chest radiography | NA | |
| 2 (preoperative or routine) | ||
| 9 (preoperative or routine) | ||
| 6 (preoperative), 4 (routine admission) | ||
| 8 (preoperative or routine) | ||
| Routine chest radiographs in uncomplicated hypertension (asymptomatic) | NA | |
| 1 | NA | |
| 5 | NA | |
| Screening for pulmonary metastases | 8-9—depends on malignancy type | 7-9—depends on malignancy type; noncontrast CT |
| Solitary pulmonary nodule | NA—chest x-ray presumably already performed, demonstrating lesion | CT chest with contrast: 6CT chest without contrast: 8 |
| Staging of bronchogenic carcinoma | CT chest with or without contrast (including upper abdomen): 9—CT with contrast is preferred if there are no strong contraindications. | |
| Blunt chest trauma—suspected aortic injury | 9 |
This table integrates information relevant to the practice of emergency medicine from multiple ACR Appropriateness Criteria topics, and does not represent all information included in these topics. Refer to the ACR website at www.acr.org/ac for the most current and complete version of the ACR Appropriateness Criteria®.”
Reprinted with permission of the American College of Radiology, Reston, VA. No other representation of this material is authorized without expressed, written permission from the American College of Radiology. Rating scale: 1, 2, 3: Usually not appropriate; 4, 5, 6: may be appropriate; 7, 8, 9: Usually appropriate.
From American College of Radiology. ACR appropriateness criteria. (Accessed at http://www.acr.org/secondarymainmenucategories/quality_safety/app_criteria.aspx) (Access date: 3-21-2011)
TABLE 5-3 American College of Radiology Appropriateness Criteria: Acute Respiratory Illness∗†
| Clinical Variant | ACR Rating for X-ray Chest |
|---|---|
| >Age 40 | 8 |
| Dementia, any age | 8 |
| <Age 40, negative physical exam, and no other signs, symptoms, or risk factors | 4 |
| <Age 40, positive physical exam or other risk factors | 9 |
| Complicated pneumonia | 9 |
| Suspected severe acute respiratory syndrome | 9 |
| Suspected anthrax | 9 |
| Febrile, neutropenic | 9 |
| Acute asthma | |
| 4 | |
| 9 | |
| Acute exacerbation of COPD | |
| 4 | |
| 9 |
∗ This is a truncated version of the full ACR Appropriateness Criteria, which also includes ratings for chest CT in each of the Clinical Variants.Reprinted with permission of the American College of Radiology, Reston, VA. No other representation of this material is authorized without expressed, written permission from the American College of Radiology. Refer to the ACR website at www.acr.org/ac for the most current and complete version of the ACR Appropriateness Criteria.
† Acute respiratory illness is defined by the presence of one or more factors including cough, sputum production, chest pain, and dyspnea, with or without fever.
American College of Radiology: ACR Appropriateness Criteria: Acute Respiratory Illness. Available at: http://www.acr.org/SecondaryMainMenuCategories/quality_safety/app_criteria/pdf/ExpertPanelonThoracicImaging/AcuteRespiratoryIllnessDoc1.aspx. Accessed 3-21-2011. Rating Scale: 1,2,3 Usually not appropriate; 4,5,6 May be appropriate; 7,8,9 Usually appropriate
Is a Chest X-ray Routinely Indicated for Chest Pain?
A multitude of causes can result in chest pain, including a number of abnormalities visible on chest x-ray. Pneumonia, pneumothorax, pneumomediastinum, neoplasms, rib fractures, and aortic dissection are just a few of the disease processes that can result in chest pain and that the chest x-ray may diagnose or suggest. Pulmonary embolism may have associated chest x-ray abnormalities such as pleural effusion or pulmonary infarct, although sensitivity and specificity of chest x-ray are too poor for clinical diagnosis of this entity. The ACR recommends chest radiography as the initial imaging study for patients with chest pain and a low probability of cardiac ischemia, given the range of possible diagnoses and the low cost and radiation exposure of chest x-ray.11 The American College of Emergency Physicians (ACEP) recommended chest x-ray for many scenarios described in its 1995 “Clinical Policy for the Initial Approach to Adults Presenting With a Chief Complaint of Chest Pain, With No History of Trauma,” which has since been retired (all ACEP clinical policies are subject to retirement if a new review of the literature is not conducted within a prescribed time frame).12 Systematic prospective studies on the value of chest x-ray in undifferentiated chest pain are limited. In a retrospective study of 5000 portable or posterior–anterior (PA) and lateral chest radiographs performed on emergency department patients, Buenger et al.13 discovered that “serious disease” was found in 35% of those with chest symptoms, based on the x-ray requisition. Requisition information may not reliably characterize a patient’s symptoms, so the validity of this study remains in doubt.
Is a Chest X-ray Routinely Indicated for Stroke?
Sagar et al.14 performed a retrospective review of 435 patients admitted with a diagnosis of acute stroke. They found that 86% had an admission chest x-ray performed and 77.5% of radiographs were technically inadequate, mostly because of poor patient positioning and poor inspiratory effort. Radiographic abnormalities were seen in 61 patients (16.4% of those undergoing radiography), and clinical management appeared to have been altered in 14 patients (3.8% of those undergoing radiography). The authors conclude that chest radiography is not routinely indicated for patients with acute stroke in the absence of suggestive clinical findings or complaints. As with many other clinical presentations, prospective studies for chest x-ray in stroke are lacking, and little evidence exists regarding the role of chest x-ray in presentations such as altered mental status (rather than obvious stroke syndromes such as hemiparesis).
Is a Chest X-ray Routinely Indicated for Gastrointestinal Bleeding?
Tobin et al.15 reviewed 202 adult patients admitted to intensive care units for gastrointestinal hemorrhage. They found that 161 (80%) underwent admission chest x-ray. Review of radiographs by a radiologist blinded to the study purpose found 14.3% with minor radiographic abnormalities, none of which resulted in a therapeutic or diagnostic intervention. Major radiographic abnormalities were found in 13% of patients, with an intervention in only 5.6% of patients. Predictors of major abnormalities included history of lung disease and abnormal lung physical examination at presentation (sensitivity = 79%, negative predictive value = 96%). These variables also predicted major radiographic abnormalities associated with interventions (sensitivity 89%, negative predictive value = 99%). The authors found that selective radiography based on these criteria would have reduced the charges from chest radiography by more than $500 per major abnormality detected and by more than $1000 per major abnormality associated with an intervention. These findings have not been externally validated in a separate population but do suggest that routine chest x-ray is unnecessary for this clinical presentation.
Is a Chest X-ray Routinely Indicated for Acute Respiratory Illness With Features Such as Productive Cough?
Acute respiratory illness is defined by the presence of one or more factors, including cough, sputum production, chest pain, and dyspnea, with or without fever. A multitude of studies have examined the role of chest x-ray, examining varying populations including healthy hosts, immunocompromised patients, the elderly, and patients with asthma and chronic obstructive pulmonary disease (COPD). The ACR divides its recommendations based on these and other patient factors as shown in Table 5-3.17 Benacerraf et al.16 studied 1102 outpatients with acute respiratory illness and found that in patients below 40 years 96% of chest radiographs had no acute abnormalities. Limiting radiography in patients below age 40 to those with abnormal physical examination or hemoptysis would have reduced radiography by 58% and missed only 2.3% of acute abnormalities. Fever, cough, and the presence of even purulent sputum were not predictive of chest x-ray abnormalities in patients under the age of 40.16-17 Patients above the age of 40 and immunocompromised patients, such as those with HIV or neutropenia, represent higher risk groups for which radiography is recommended by the ACR for signs and symptoms of acute respiratory illness.17 The emergency physician should incorporate other factors into the decision to obtain radiography and to treat the patient, including access to care, contacts with high-risk (immunocompromised) patients, endemic or epidemic disease, and risk factors for tuberculosis or undiagnosed HIV.
Is a Chest X-ray Routinely Indicated for Suspected Pneumonia?
When the emergency physician specifically suspects pneumonia, is radiography warranted? As discussed earlier, patients below the age of 40 with normal physical examination and no hemoptysis have a very low rate of radiographic abnormalities and should not routinely undergo chest x-ray. Does this mean that patients not meeting these “low risk” criteria must undergo chest x-ray? The ACR points out in its appropriateness criteria for acute respiratory illness some important disparities between clinical practice and professional society recommendations in the diagnosis of pneumonia. The Infectious Diseases Society of America and the American Thoracic Society recommend that chest radiography be obtained when pneumonia is suspected in adults to assist in distinguishing community-acquired pneumonia from other common causes of cough and fever, such as acute bronchitis. However, some clinicians may choose to treat patients empirically for pneumonia, without obtaining radiography, when a high clinical suspicion exists. This is an appropriate evidence-based strategy, as a negative chest x-ray does not rule out pneumonia. When a high pretest probability exists, a negative chest x-ray is inadequate to exclude pneumonia and should not be used as the sole basis to determine management.17
Is a Chest X-ray Routinely Indicated for Asthma?
In patients with asthma without features suggesting complications such as pneumonia or pneumothorax, x-ray likely has little role.17 Findley and Sahn18 studied 90 adult patients with asthma undergoing chest radiograph and found only 1 patient with an acute infiltrate; normal (55%), hyperinflation (37%), and unchanged minimal interstitial infiltrates (7%) were common patterns. Chest x-ray interpretation did not correlate with admission, suggesting that radiographs in asthma play little role in management. Gershel et al.19 studied 371 consecutive children over the age of 1 year with first-time wheezing and found that 94.3% had x-ray findings compatible with uncomplicated asthma (negative). Of the 371 patients studied, 21 (5.7%) had positive chest x-ray findings, including atelectasis and pneumonia in 7, segmental atelectasis in 6, pneumonia in 5, multiple areas of subsegmental atelectasis in 2, and pneumomediastinum in 1. Although the authors call this 5.7% “positive,” it is not clear that findings of atelectasis or even pneumomediastinum alter management in a clinically beneficial way, as no specific therapy is required for these abnormalities. When only pneumonia is considered a positive finding, only 3.9% of first-time wheezing children had positive chest x-rays. The authors found that 95% of abnormal x-rays could be predicted based on the presence of tachypnea greater than 60 breaths per minute, pulse greater than 160 beats per minute, and localized rales or diminished breath sounds, before or after treatment—suggesting that even in first-time pediatric wheezing, routine x-ray may not be necessary. Aronson et al.20 reported on 125 consecutive adult asthma admissions and found no chest x-ray abnormalities in 81 patients characterized as uncomplicated, defined as having a prior history of asthma, presenting with dyspnea and wheezing, and having no history of fever or chills, immunosuppression, cancer, intravenous (IV) drug abuse, prior thoracic surgery, cardiac disease, or pulmonary disease such as COPD or granulomatous disease.
Is a Chest X-ray Routinely Indicated for Chronic Obstructive Pulmonary Disease?
In COPD, the ACR recommendations are somewhat at odds with work published in the emergency medicine literature. According to the ACR, in COPD patients without fever, leukocytosis, chest pain, or history of congestive heart failure (CHF) or coronary artery disease (CAD), chest x-ray has a low diagnostic utility, with an appropriateness rating of four out of nine.17 These recommendations are concordant with the work of Sherman et al., who retrospectively reviewed 242 patients with admission chest x-rays for COPD. Although 14% had radiographic abnormalities, the authors concluded that only 4.5% had appropriate and clinically important management changes resulting from chest x-ray findings. They found that leukocytosis (white blood cell count >15 × 109 per liter and neutrophil count >8 × 10⁹ per liter), history of CHF or CAD, chest pain, and extremity edema were a “high risk” criteria predictive of important acute radiographic abnormalities.
Emerman and Cydulka21 attempted to validate these high-risk criteria in a retrospective series of 685 emergency department visits for acute COPD in which a chest x-ray was performed. In this series, 16% of patients had significant chest x-ray abnormalities: 88 with new infiltrates, 2 with new lung masses, 1 with pneumothorax, and 20 with evidence of pulmonary edema. Abnormalities were associated with history of CHF, fever, rales, pedal edema, and jugular venous distension. In contrast, white blood cell count, temperature in the emergency department, history of CAD, and complaints of chest pain or sputum production were not associated with chest x-ray abnormalities. The sensitivity of the high-risk criteria was only 76%, with a specificity of only 41%. The authors recommended routine x-ray in patients with apparent acute COPD.
Is a Chest X-ray Routinely Indicated for Asymptomatic Hypertension?
According to the ACR reviews, patients with asymptomatic hypertension should not routinely undergo chest x-ray, although debate remains about the value of radiography with rising levels of hypertension. In theory, chest x-ray might be of value in patients with asymptomatic hypertension by revealing cardiomegaly or left ventricular hypertrophy, aortic enlargement or coarctation, or pulmonary vascular congestion. Although a number of authors have suggested these benefits, others have argued that the management of hypertension is not positively influenced by chest x-ray findings; regardless of the presence or absence of chest x-ray abnormalities, blood pressure control should be attempted. Moreover, studies indicate that chest x-ray is insensitive and nonspecific for detection of left ventricular hypertrophy, which is better assessed with echocardiography.22
Is a Chest X-ray Routinely Indicated for Admitted Patients?
The ACR found that routine admission or preoperative chest x-ray is not indicated in the patient with no cardiopulmonary findings by history or physical examination, with an appropriateness of two out of nine.10 In patients with acute cardiopulmonary findings by history or physical, chest x-ray is highly appropriate, with a rating of nine. Because of a lack of evidence against the use of routine chest x-ray, in elderly patients (70 years or older) with chronic cardiopulmonary disease, the ACR rates chest x-ray as appropriate (eight of nine), even in the absence of history or physical findings, when a chest x-ray has not been performed within the past 6 months. The value of chest x-ray is less clear in this asymptomatic group when a recent chest x-ray (within 6 months) is available for review (ACR rating four to six of nine).
What is the basis for the ACR recommendations in these cases? The ACR cites multiple studies addressing the utility of routine chest x-ray in patients admitted for gastrointestinal hemorrhage, acute stroke, and other conditions affecting the elderly. Gupta, Gibbins, and Sen23 prospectively studied 1000 consecutive admissions to an acute geriatric ward and found that 35% to 50% of patients had no apparent indication for chest x-ray. In this group without chest x-ray indications, 5.5% had radiographic abnormalities but less than 1% had clinically important findings. In an exhaustive systematic review, Munro, Booth, and Nicholl24 found that no randomized controlled trials of the effectiveness of routine preadmission or preoperative chest x-rays had been published, and most studies do not (or cannot, because of study design) assess the effect on clinical management of detected radiographic abnormalities. Estimates of the frequency of changes in clinical management suggest patient benefit in fewer than 5% of cases.10
We have discussed some common evidence-based indications for chest x-ray. Now we consider basic principles of chest x-ray technique relevant to emergency medicine and key principles of image interpretation. We finish with findings of specific pathology and a systematic approach to the interpretation of chest x-ray.
Interpretation of Chest X-ray: Basic Principles
Interpretation of chest x-ray requires several elements:
We start with some basic principles. If you are already familiar with basic radiographic concepts and the normal appearance of the chest x-ray, move on to the section on pathology. But a few minutes familiarizing yourself with the ideas in this section can pay big dividends some day when you encounter an unfamiliar chest x-ray that does not fit any of the patterns of common pathology discussed in this chapter. Understanding basic principles may allow you to deduce the nature of the abnormality and avoid common pitfalls. A number of outstanding texts are devoted entirely to chest radiography.25-26 We have drawn on numerous sources for the following discussion.
Chest X-ray Techniques and Effects on Resulting Images
Familiarity with the chest x-ray technique is important for the emergency physician because it can affect the appearance of important diagnostic findings and the sensitivity and specificity of a chest x-ray for these diagnoses. In some cases, a given chest x-ray technique may falsely simulate pathology; in other cases, the technique many hide important abnormalities. Here, we describe the most common chest x-ray techniques, along with pitfalls of each. The most common variations of the frontal chest x-ray used in the emergency department are the anterior–posterior (AP) view and the PA view. The AP view is commonly performed as a portable study in the patient’s room, and it may be performed with the patient in a supine or upright position. The PA frontal view is performed in the radiology suite, and often a lateral projection PA chest x-ray is obtained at the same time.
Chest x-rays can be characterized by the following:
Each of these variables has important effects on the resulting image. In some cases, the technique is manipulated intentionally to achieve a desired diagnostic effect. In other cases, the patient’s clinical condition limits the x-ray technique, and we are forced to accept a suboptimal diagnostic image. Understanding the effects of the x-ray technique on the resulting image is invaluable in helping the emergency physician to avoid misinterpretation of the image and misdiagnosis of the patient.
Direction of the X-ray Beam With Respect to the Detector: Posterior–Anterior Versus Anterior–Posterior Technique
When a frontal projection chest x-ray is obtained, the direction of the x-ray beam as it passes through the patient to the detector can be from patient posterior to anterior or from patient anterior to posterior (Figure 5-1). To restate this another way:
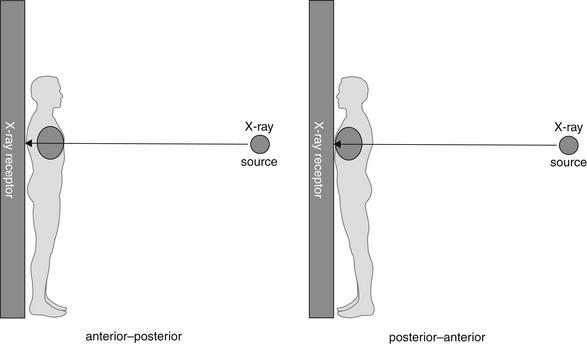
Figure 5-1 Anterior–posterior and posterior–anterior chest x-rays.
The designation refers to the direction of passage of the x-ray beam through the patient to the receptor.
In the case of the PA x-ray, the patient is oriented with the x-ray film or detector in contact with the anterior surface of the thorax. The x-ray beam passes through the patient’s posterior thorax to the detector. The patient faces toward the detector, away from the x-ray source (Figure 5-1).
In the case of the AP x-ray, the patient is oriented with the x-ray film or detector, in contact with the posterior surface of the thorax. The x-ray beam passes through the patient’s anterior thorax to the detector. The patient faces toward the x-ray source, away from the detector.
Why does the direction of the x-ray beam through the patient to the x-ray detector matter? We return to this question in a moment, but first we describe a characteristic difference in the PA and AP x-ray techniques, which contributes to differences in the resulting image.
The PA chest x-ray is typically acquired in a radiology suite, with the x-ray source positioned 6 feet from the x-ray detector. In comparison, the AP chest x-ray is typically acquired as a portable examination, with only 3 feet separating the x-ray source and the detector.
Distance of the X-ray Beam With Respect to the Detector: Posterior–Anterior Versus Anterior–Posterior Technique
Why does the distance from the x-ray source to the detector matter? The answer becomes obvious if we consider the analogy of the children’s game of creating shadows on a wall with a light source (Figures 5-2 and 5-3). You can try our example at home (use a light, not an x-ray) if it is unclear. Place a lamp 6 feet from a wall. Position your hand close to the lamp, and the shadow on the wall appears larger than the actual size of your hand, though rather indistinct at its edges. Most people have used this trick for their amusement, making a hand appear as large as a head, for example. Without moving the lamp, move your hand closer to the wall; the resulting shadow becomes smaller (closer to its actual size), denser (darker), and sharper at its edges. We have now defined one of the two variables: with a light (or x-ray) source a fixed distance from a detector, positioning the object to be imaged close to the detector results in a sharper, truer image without false magnification. Therefore, when performing medical imaging, we should place the body part to be imaged as close to the detector as possible to achieve a sharp, unmagnified image. Now consider the same scenario, with a twist. Imagine that you cannot put your hand close to the wall because of furniture obstructing your path. How can you sharpen the image and reduce magnification? The answer is simple: move the lamp farther from your hand and the wall. Try this experiment, and you will find that the shadow of your hand becomes sharper and less magnified, truer to its actual size. Why would this scenario occur with medical imaging? Imagine placing your thorax against the wall; your ribs prevent you from moving your internal organs closer to the wall, although by facing toward or away from the wall you can position your heart (anterior in your chest) closer to the wall. However, you can easily control the distance of the light source from the wall to reduce magnification and improve the image sharpness. Therefore, when performing medical imaging, we should position the x-ray source as far as possible (within reason) from the body part to be imaged, to improve sharpness and reduce magnification.
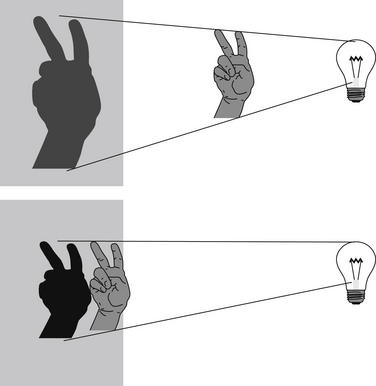
Figure 5-2 A shadow experiment to illustrate principles of chest x-ray technique.
When the light source is a fixed distance from the wall, moving the hand closer to the wall results in a less magnified and sharper image.
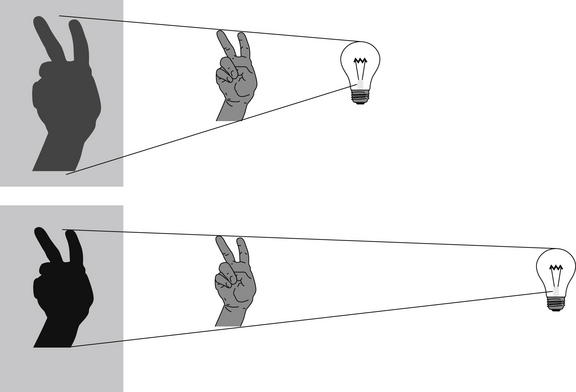
Figure 5-3 A shadow experiment to illustrate principles of chest x-ray technique.
When the hand is a fixed distance from the wall, moving the light source farther from the hand and wall results in a less magnified and sharper image.
Magnification: Asset or Artifact?
Although magnification may sound advantageous, it can introduce clinically deceptive artifacts if some body parts are magnified to a greater degree than others. The most clinically accurate x-ray has no magnification. Why would we not want magnification? Wouldn’t magnification potentially assist in identifying pathology? The problem again can be resolved by considering the shadow experiment. In medicine, we need an accurate estimate of the actual size of body parts and an accurate measure of their size relative to one another. Consider the example of the hand shadow and the shadow of the human head. Although it may be amusing to have your hand mimic a giant dog biting a head, this scenario of varying magnification is highly undesirable in medical imaging. We need to know whether a mass has increased in size or if the heart and mediastinum are enlarged relative to the surrounding thoracic cavity. Our imaging technique must avoid false magnification, particularly when differential magnification of objects in the same image might occur.
Hopefully, we have convincingly demonstrated how the distances from the body part to the detector (assuming a fixed light source) and from the light source to the body part (assuming a fixed distance from body part to detector) affect the resulting images. Let’s briefly consider why this is the case. Figures 5-4 through 5-6 illustrate the effect of distance on object magnification. The angle created between the x-ray source and an object’s edges is determined by the distance from the x-ray source to the object. The shorter the distance from the x-ray source to the object, the greater the angle. Greater angles lead to greater magnification; therefore, a shorter distance from the x-ray source to the imaged object leads to increased magnification. Although increased magnification may appear to be a benefit, in most clinical scenarios this can lead to a false appearance of cardiomegaly or a widened mediastinum. This is particularly a problem if very short distances are employed, as thoracic structures nearer to the x-ray source will be magnified to a greater degree than structures farther from the source. Positioning the x-ray source at a greater distance from the object to be imaged reduces this relative magnification, leading to a truer representation of the object. The AP portable examination places the x-ray source 3 feet from the patient, rather than the 6 feet usually used for a PA examination. Consequently, the AP portable chest x-ray examination typically has a greater degree of false magnification of the heart and mediastinum compared with the PA technique.
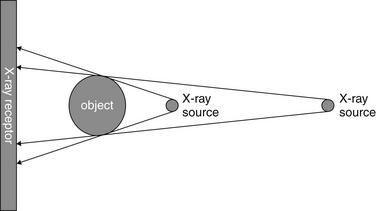
Figure 5-4 Magnification and chest x-ray.
The degree of magnification is influenced by the distance of the x-ray source from the object being imaged. A more distant x-ray source results in a less magnified image.
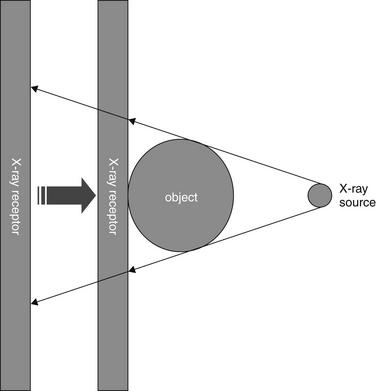
Figure 5-5 Magnification and chest x-ray.
The degree of magnification is influenced by the distance of the x-ray receptor from the object being imaged. A more distant x-ray receptor results in a more magnified image. Moving the x-ray receptor closer to the object being imaged results in a less magnified image.
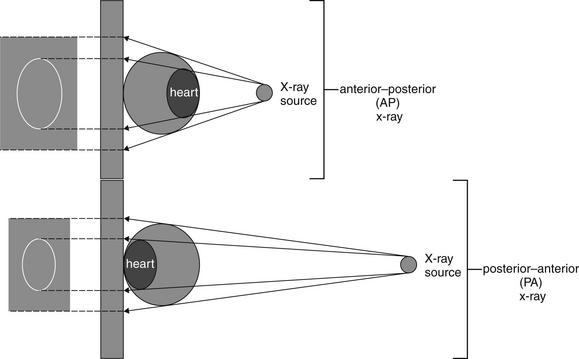
Figure 5-6 Chest x-ray technique and magnification.
An anterior–posterior chest x-ray technique results in greater magnification of the heart. A posterior–anterior chest x-ray positions the x-ray source farther from the heart, and the x-ray receptor closer to the heart, resulting in less magnification of the cardiac silhouette relative to the thorax.
We asked earlier why the direction of the beam (AP vs. PA) matters to the resulting image. As we described in our shadow experiment earlier, sometimes we cannot fully control the location of objects relative to the x-ray detector. We cannot change the anterior location of the heart in the chest; however, by positioning the detector on the anterior aspect of the chest, we bring the heart and the detector closer together, reducing magnification of the heart. Consequently, the PA x-ray technique results in less magnification of anterior structures compared with the AP technique. Remember this when viewing AP portable chest x-rays, which are more prone to false appearance of cardiomegaly or mediastinal widening (Figure 5-7).
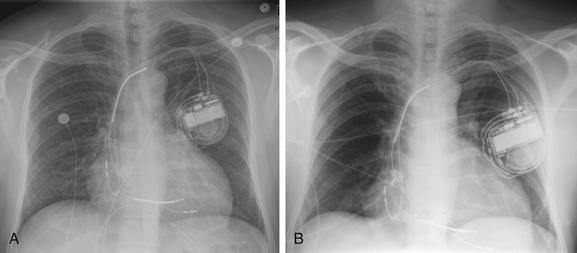
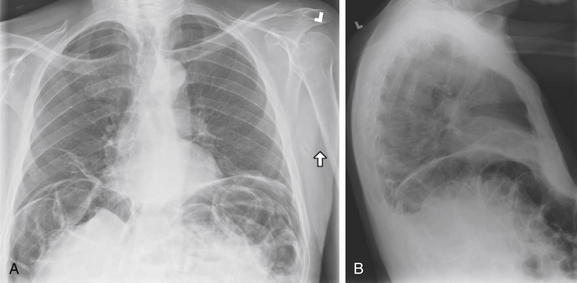
Figure 5-7 Differences between anterior–posterior (AP) and posterior–anterior (PA) chest x-rays and upright or supine positioning.
As discussed in Figures 5-2 through 5-6, a PA chest x-ray results in a less magnified appearance of the heart, whereas an AP x-ray results in false magnification that can simulate or exaggerate cardiomegaly. Upright positioning typically results in better lung expansion. Supine positioning typically results in poorer lung expansion and clumping of pulmonary vessels in poorly expanded lungs, with an appearance that can simulate or exaggerate the appearance of pulmonary edema. Supine positioning also exaggerates the mediastinal width. A, An upright PA chest x-ray. B, A supine AP chest x-ray obtained a short time later in the same patient. The cardiac silhouette is enlarged in both but appears larger in B.
Patient Positioning for Chest X-ray: Supine Versus Upright Technique
Now let’s also consider the differences among a true upright, a supine, and an intermediate lordotic x-ray (Table 5-4). Although occasionally other positions of the patient are desirable in specific clinical scenarios, for most applications, a perfectly upright patient position is desirable during chest x-ray acquisition. When the patient is positioned perfectly upright and perpendicular to the direction of the x-ray source, thoracic structures are positioned equal distances from the x-ray source, ensuring equal magnification on the resulting x-ray image. In comparison, if the patient is positioned in a lordotic position with the upper and lower thorax at different distances from the x-ray source, the magnification of superior thoracic structures will differ from that of the lower thoracic structures.
TABLE 5-4 Artifacts of Supine Chest X-ray Technique That Can Lead to Misdiagnosis
| Supine Chest X-ray Finding | Possible Misdiagnosis |
|---|---|
| Heart appears large | Simulates cardiomegaly |
| Mediastinum appears wide | Simulates aortic or mediastinal abnormality |
| Increased vascular markings in upper lung zones | Simulates pulmonary edema |
| Poor inspiration | Simulates pulmonary edema and may hide small nodules |
| Layering of fluid in plane of x-ray detector | May prevent recognition of pleural fluid |
| Distribution of air to anterior chest and abdomen | May prevent recognition of pneumoperitoneum or pneumothorax |
When the patient is positioned in a fully upright position, fluid within structures of the chest will generally reside due to gravity in a dependent position, forming fluid levels. In comparison, if the patient is positioned supine, the horizontal plane in which fluid will spread is parallel to the x-ray film or detector beneath the patient, and no fluid levels will be seen. (see Chapter 6, Figure 6-2). The resulting appearance may be a diffuse increase in the density of the entire affected thorax, sometimes called a “veiling opacity.” This may be mistaken for an increased parenchymal density, rather than being recognized as a broadly layered pleural effusion.
Pleural fluid and fluid within collections such as lung abscesses typically are not visible on an image obtained with a supine patient but are visible on an image obtained with an upright position. In a patient positioned upright, the upper surface of fluid within the potential pleural space usually forms a curved line, higher along the lateral chest wall than at its intersection with the mediastinum. This appearance is termed the meniscus sign (Figures 5-8 and 5-9). In contrast, fluid within an air-filled cavity usually forms a straight horizontal line without a lateral meniscus. Examples include fluid within an air-filled abscess cavity or fluid within a hemopneumothorax (Figure 5-10; see also Figure 5-8).
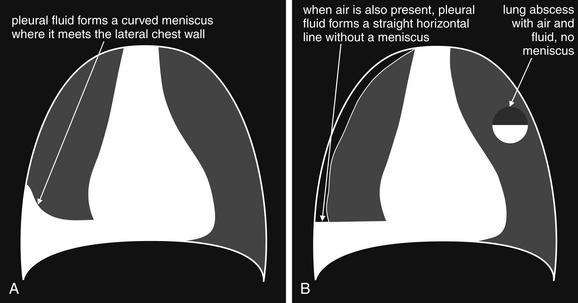
A, On an upright chest x-ray, fluid in the pleural space typically layers with gravity, forming a dependent collection. The upper surface of that collection usually forms a curve that is higher along the lateral chest wall than at its intersection with the mediastinum. This appearance is called the meniscus sign. B, In contrast, fluid within an air-filled cavity does not usually form a prominent meniscus and has a straight, horizontal upper surface. Examples include fluid within a pneumothorax and fluid within a lung abscess.
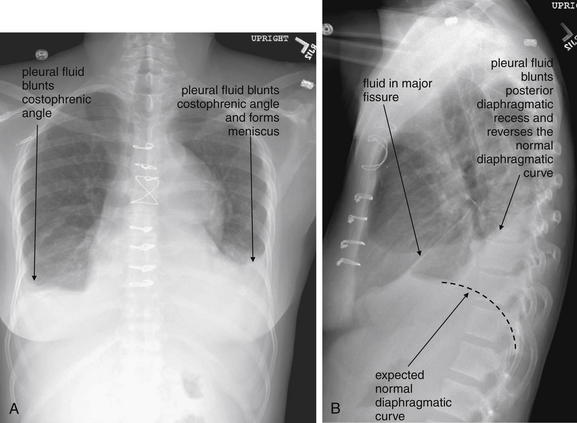
Figure 5-9 Pleural effusions: Posterior–anterior (PA) and lateral upright views.
A, A PA upright view, where a pleural effusion is most evident on this patient’s left side. Both costophrenic angles are blunted. The pleural effusion forms a meniscus against the left lateral chest wall. B, The lateral upright view shows two meniscus densities, suggesting bilateral pleural effusions. The posterior diaphragmatic recess is filled with pleural fluid, which forms a meniscus with the posterior chest wall. Compare with Figure 5-8 and 5-10.
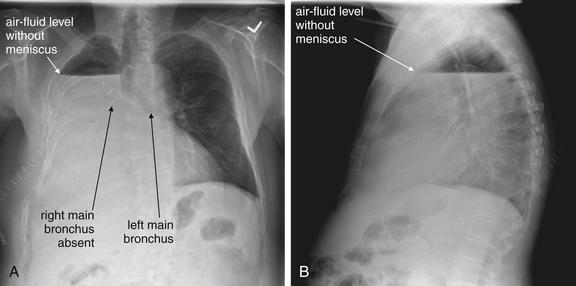
Figure 5-10 Pleural effusion with air–fluid level.
A, Posterior-anterior (PA) upright x-ray. B, Lateral upright x-ray. This patient has a large fluid collection in the right pleural space following a pneumonectomy. The appearance is somewhat different from that of even a large typical pleural effusion because of the absence of a lung and the presence of air in the pleural space. Normally, an effusion collecting in the pleural space forms a meniscus with the lung margin, coming to a “beak” or sharp point along the lateral chest wall. No air–fluid level is seen in a typical pleural effusion, because the pleural space is a potential space that contains no air. An exception would be a hemopneumothorax, where blood and air would coexist in the pleural space. An air–fluid level might also be seen in an empyema, if gas-forming organisms are present. In this case, air was introduced into the pleural space during the pneumonectomy, and reactive pleural fluid has accumulated. The x-ray alone cannot rule out infection. A, Look carefully in the apex of the right thorax and note the absence of lung markings. Also note the absence of the right main bronchus, which has been surgically removed. Its silhouette is missing, whereas that of the left main bronchus remains. Another possible cause of an absent bronchus silhouette would be a bronchus filled with fluid or tumor, which are both of water density. Compare with Figure 5-8 and 5-9.
In an upright patient, air within the peritoneal cavity collects beneath the diaphragm, making it visible on x-ray because of the contrast between the density of air and diaphragmatic soft tissue. (Figures 5-11 through 5-14). In a supine patient, air within the peritoneal cavity may collect in the midline anterior abdomen rather than in a subdiaphragmatic position and in addition will spread in the same horizontal plane as the x-ray detector beneath the patient, preventing the air from being visible. An x-ray obtained with an upright patient position is therefore more sensitive for detection of pneumoperitoneum.
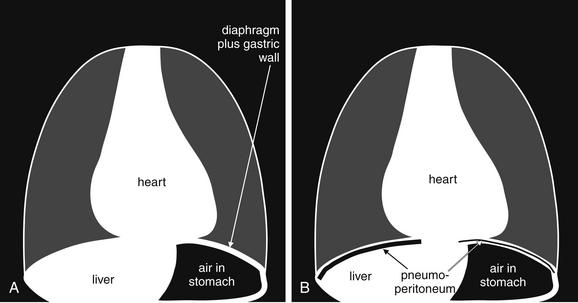
Figure 5-11 Free air (pneumoperitoneum).
Free air (pneumoperitoneum) can be recognized on upright chest x-ray. This finding relies on the silhouette sign described later in this chapter (see Figure 5-26): air density is readily seen when in direct contact with water (soft-tissue) density. A, The normal appearance of the upright chest x-ray in the absence of pneumoperitoneum. B, The appearance of the upright chest x-ray in the presence of pneumoperitoneum. On an upright chest x-ray, normally the inferior surface of the right diaphragm is not seen, as the liver (water or soft-tissue density) is in direct contact with the inferior border of the diaphragm (also water density). When air is present within the peritoneal cavity, it may collect inferior to the right diaphragm, superior to the liver. This air may be recognized as a black line or collection, making the inferior border of the diaphragm visible. On the patient’s left side, the normal gastric air bubble can simulate intraperitoneal air, as it is normal for the stomach to contain air. Fortunately, usually the gastric wall and adjacent diaphragm are thicker than the diaphragm alone would be, allowing the normal gastric bubble to be distinguished from subdiaphragmic pneumoperitoneum. In some cases, pneumoperitoneum may extend beneath the central diaphragm, in which case the inferior border of the heart may be partially visible. Normally, the heart, diaphragm, and liver are in contact, with no visible line separating them. Compare with Figures 5-12 through 5-14.
Pneumoperitoneum is a critical finding requiring recognition on chest x-ray. Occasionally, it may be an unanticipated finding on chest x-ray in a patient who cannot provide an adequate history. Remember that normally the inferior surface of the diaphragm cannot be seen, as it is contiguous with a solid organ sharing the same water density on chest x-ray: the liver on the right, the spleen on the left. On the left, the interior surface of the stomach may be shown in relief by air within it. It may be difficult to distinguish this inner surface of the stomach from the inferior surface of the diaphragm, although the diaphragm alone should be thinner than the combined thickness of diaphragm and stomach. Within the abdomen, the external surface of the bowel wall should not be seen, again because of its contiguity with other soft-tissue structures. Air within the bowel is readily seen and makes the internal surface of the bowel wall quite apparent. When pneumoperitoneum exists, the external surface of the bowel can be seen. A normal finding that may simulate this is the presence of two adjacent loops of bowel with their walls abutting. In this case, the internal surface of both walls may be seen, and it may appear that air is present on both sides of the wall of a single loop. In A (upright PA x-ray) and B (upright lateral x-ray), copious free air is present. A, Both diaphragms are outlined, and several bowel loops can be seen with air on both sides of their walls. B, The lateral x-ray also demonstrates this finding. Compare with the CT from the same patient in Figure 5-13.
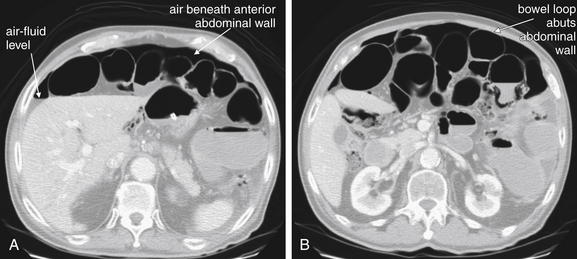
Figure 5-13 Free air, abdominal CT.
Same patient as in Figure 5-12. A and B are shown on lung windows to highlight the contrast between air and other soft tissues. In these axial CT images, free air is seen outlining loops of bowel. Note how both sides of the bowel wall are clearly visible when contrasted with air. B, Notice that where a loop of bowel abuts the anterior abdominal wall, only the internal surface of the bowel wall is visible. This is because the bowel wall and the abdominal wall share the same soft-tissue density. On CT, air may accumulate along the anterior abdominal wall, as this is the highest point in the abdomen when the patient lies supine for CT. In contrast, in an upright patient undergoing chest x-ray, air accumulates under the diaphragm. Air is an outstanding contrast agent because of its much lower density than abdominal tissues, so no administered contrast agents are required to detect it.
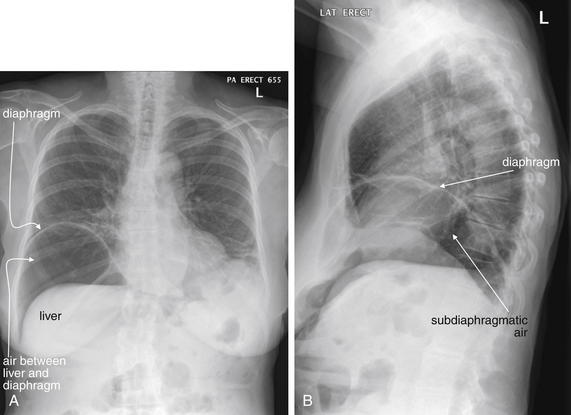
This patient presented with epigastric pain and has dramatic free air (pneumoperitoneum) visible under the right diaphragm on this upright chest x-ray. The inferior surface of the diaphragm is readily visible because of air separating it from the liver. Normally, these two structures are indistinguishable. In a more subtle case, the only clue to free air might be a thin black line separating the diaphragm and liver. On a supine x-ray, air might not collect in a subdiaphragmatic position and might not be visible. This patient was found to have a perforated gastric ulcer at laparotomy.
Another advantage of the upright chest x-ray is that the patient typically is able to accomplish a greater degree of inspiration. With greater inspiration, blood vessels become more widely spaced, allowing other abnormalities to be recognized. Radiologists have sometimes compared this with seeing a bird in a tree, which is more easily accomplished in a tree with widely spaced branches. Small lung masses can be more easily seen as a result. A well-expanded chest on an upright view also gives a truer estimate of the heart size. Rarely, a chest x-ray obtained at end-expiration provides diagnostic benefits, which we will review later.
In comparison, a supine chest x-ray is usually characterized by higher diaphragms, with poorer lung expansion and clumping of pulmonary vessels. In addition, blood flow to the upper lung is relatively increased by gravity, and the heart appears larger than on an upright x-ray. This is due to the portable AP technique but also because of the relatively unexpanded chest, which makes the heart appear comparatively larger. In combination, these findings may mimic CHF (see Figure 5-7).
Supine and semilordotic views are often obtained in emergency department patients not by design but because patient condition prohibits the desired technique. Trauma patients, unstable medical patients, and intoxicated or neurologically disabled patients are just a few examples of patients who often undergo imaging in supine or semilordotic positions because of their inability to be positioned upright. The emergency physician must be aware of the limitations of these examinations and should recognize the patient position when interpreting the resulting images.
Lordotic and decubitus positions are sometimes obtained intentionally for specific diagnostic purposes, described later under “Additional Chest X-ray Views.”
Normal Appearance of a Chest X-ray
Recognizing pathology requires a strong familiarity with the normal appearance of the chest x-ray. Classic abnormalities are often recognized by their distinct differences from the normal chest x-ray appearance. More subtle abnormalities may be missed by an inexperienced observer, but an experienced reader may immediately recognize that the chest x-ray differs from the norm even before characterizing and articulating the abnormality. Radiologists understand that recognizing familiar patterns of normal and abnormal requires constant exposure, much like recognizing a familiar relative. This pattern recognition approach has been dubbed the “Aunt Minnie” effect for this similarity. We briefly describe the appearance of a normal chest x-ray here. In the sections that follow, we present numerous examples of important pathology. Even with several examples of each type, you will only begin the exposure required to “recognize Aunt Minnie.” Make a habit of looking at your patients’ chest x-rays, even if the radiologist has already rendered an interpretation.
Frontal (Posterior–Anterior or Anterior–Posterior) Upright Chest X-ray View
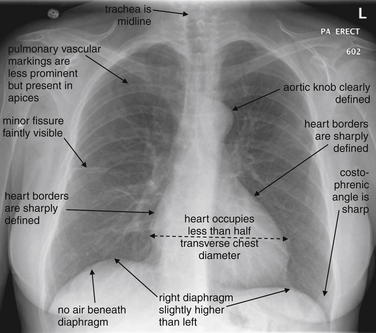
The normal frontal upright chest x-ray (Figure 5-15) has the following features:
Lateral Upright Chest X-ray View: Retrosternal Space, Retrocardiac Space, and the Spine Sign
The lateral chest x-ray provides important diagnostic information. Unfortunately, this view is usually not obtained when a portable x-ray examination is performed—another good reason to send the patient to the radiology suite for imaging if the clinical condition permits this. The lateral view (Figure 5-16) reveals the retrosternal space, which overlies the heart and mediastinum on a frontal projection. This space is usually quite lucent (black) because of the presence of a low-density epicardial fat pad and sometimes lung segments—but when occupied by a soft-tissue mass, this space may appear radiodense (white) (Figure 5-17). The lateral chest x-ray also reveals the retrocardiac space. This space normally should be quite lucent (black) (see Figure 5-16). Lower lobe pneumonias may be evident on the lateral view as an abnormally dense retrocardiac region (Figure 5-18). On the lateral view, the diaphragms usually form smooth curves descending from anterior to posterior. The space above the diaphragms is usually lucent (black), as it contains low-density lung tissue. Pleural effusions may be evident on lateral view as dense (white) layering opacities replacing the normal curve of the diaphragm in this space (see Figure 5-9). Sometimes pleural effusions form a meniscus against the posterior wall of the thorax, actually reversing the normal curve of the diaphragm. In addition, air beneath the diaphragm (pneumoperitoneum) may be visible on the lateral view (see Figure 5-14).
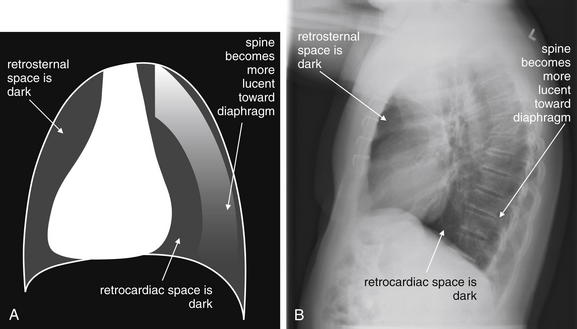
Figure 5-16 The normal appearance of the lateral chest x-ray.
The normal lateral chest x-ray shows progressive lucency (darkening) of the thoracic spine as it approaches the diaphragm. This normal finding is called the “spine sign.” Failure of the spine to become progressively more lucent as it approaches the diaphragm suggests an overlying opacity such as an infectious infiltrate or pleural effusion. The retrocardiac space should appear lucent (dark) as well, and the posterior diaphragmatic recess is dark and deep. The retrosternal space should be lucent (dark). A, A schematic representation. B, A patient with a normal spine sign and retrosternal and retrocardiac spaces.
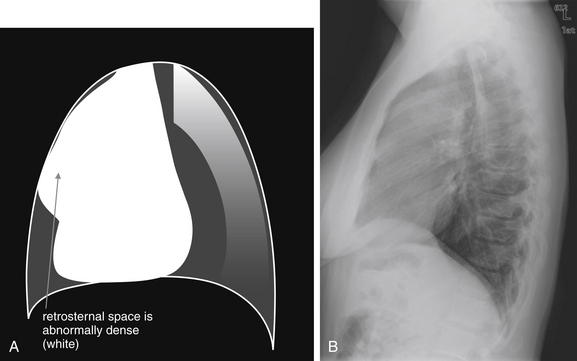
Figure 5-17 Abnormal retrosternal space, suggesting anterior mediastinal mass.
The abnormal lateral chest x-ray shows loss of the normal lucent retrosternal space. This abnormality is easily missed but indicates soft-tissue density in the anterior mediastinum. The differential diagnosis includes the five terrible Ts: thyroid mass (goiter or malignancy), thymoma, teratoma, “terrible” lymphoma, and thoracic aortic aneurysm. A, A schematic representation. B, A patient with a retrosternal density, suggesting anterior mediastinal mass.
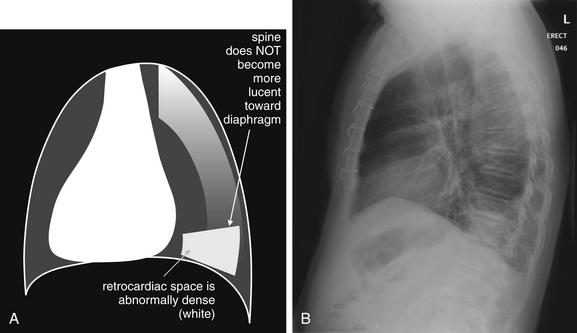
The abnormal lateral chest x-ray shows loss of the normal progressive lucency of the thoracic spine as it approaches the diaphragm, called the spine sign. In addition, the retrocardiac space may be less lucent than normal, and the posterior diaphragmatic recess may appear shallow or less lucent than usual, indicating pleural effusion or infiltrate. A, A schematic representation. B, A patient with a retrocardiac infiltrate, illustrating a pathologic spine sign.
The thoracic spine also is visible on a lateral chest x-ray. The normal appearance of the spine is a gradually more lucent (blacker) appearance moving from cephalad to caudad (see Figure 5-16). This is not a result of decreasing spinal density but rather is a normal artifact of the examination technique. When this progressively more lucent appearance is lost, it implies the presence of an abnormal density in the retrocardiac space. This is called the spine sign and is a pathologic abnormality that can be a clue to disease. Remember that the increasing density has a differential diagnosis, including infectious infiltrate, pulmonary edema, pleural effusion, mass, and atelectasis. Other radiographic findings and the patient’s clinical presentation must be used to sort through this differential diagnosis, and additional imaging may be necessary. Nonetheless, this finding can confirm a pneumonia not seen on the frontal projection x-ray. The lateral x-ray is often neglected but is a key additional view that should be obtained whenever possible and carefully reviewed.
Additional Chest X-ray Views
Early radiologists became extremely skilled at deducing clinically relevant information from additional chest x-ray views. The advent of cross-sectional imaging with CT scan has made some of these views less common, as CT imaging is able to determine the three-dimensional location of objects with high accuracy. However, in some cases, the detailed information provided by CT is unnecessary, and more limited information from x-ray may be sufficient for clinical action such as draining a pleural effusion. Although CT could be used in this scenario, the radiation dose from CT is approximately 500 times that of a single additional chest radiograph, and the cost is approximately 10 times higher. In addition, for chest angiography protocols, chest CT requires IV contrast administration, with risks of allergy or contrast nephropathy. X-ray avoids these issues. On an individual basis, the emergency physician should consider the information needed for clinical decision-making. If it is obvious that CT will be required for specific information, such as evaluation of pulmonary embolism or aortic pathology, additional x-rays should generally not be obtained. However, if the information required can be provided by radiographs, these are a better choice for reasons of cost, radiation, and contrast exposure.
Lateral Decubitus Views
Lateral decubitus views allow assessment of radiographically visible mobile fluid collections and foreign bodies, as well as inferences about the presence of radiographically invisible foreign bodies. In a lateral decubitus view, the patient is positioned with one side of the thorax (right or left) in a dependent position (Figures 5-19 and 5-20). The view is labeled based on the side of the chest that is dependent. Thus an x-ray obtained with the patient positioned with the left side of the thorax in a dependent position is a “left lateral decubitus” view. Usually, an x-ray is then obtained using an AP projection, as described earlier.
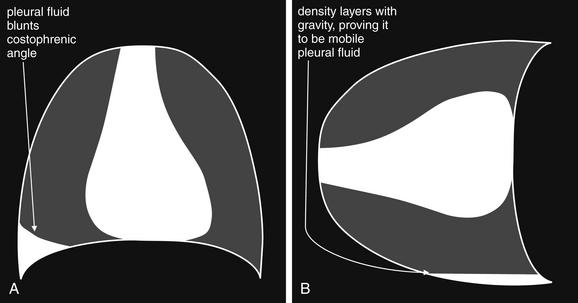
Figure 5-19 Lateral decubitus x-rays and pleural effusions.
A density seen on an upright chest x-ray can be pleural fluid, atelectasis, or a parenchymal opacity. When these conditions cannot be differentiated on the upright view, a lateral decubitus x-ray can sometimes prove the opacity to be mobile pleural fluid, which layers with gravity. A parenchymal opacity, atelectatic lung segment, or loculated pleural fluid maintains its position and does not layer with gravity on a lateral decubitus view. A, Schematic upright chest x-ray. B, Schematic right lateral decubitus x-ray, showing mobile pleural fluid layering in a dependent position.
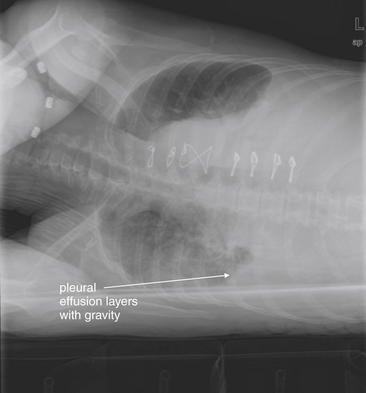
Figure 5-20 Lateral decubitus x-rays and pleural effusions.
Same patient as in Figure 5-9. In this patient with a pleural effusion, a decubitus view reveals the effusion to be mobile. A right lateral decubitus view (right side down) shows fluid to layer with gravity in the right chest, emphasizing the quantity and mobility of the right pleural fluid. If the density seen on the posterior–anterior upright x-ray had been a parenchymal infiltrate, atelectasis, or a loculated pleural effusion, it would not have moved with this change in the patient’s position. Compare with Figure 5-9 and Figure 5-19, A and B.
Decubitus views can be useful in the following scenarios:
Lordotic Views
In a lordotic view, the patient is positioned in a semiupright position relative to the x-ray source. The resulting image provides more detail of upper thoracic structures by altering the position of upper ribs and clavicles relative to the upper lung. Normally, these bony structures obstruct the view of the upper lung; a lordotic position can allow assessment of upper lung masses, infiltrates, or apical abnormalities such as pneumothoraces. The ribs appear more horizontal on a lordotic view. Although lordotic positioning is sometimes used for intentional diagnostic benefit, often lordotic positioning is an undesired effect in an emergency department patient undergoing an AP portable chest x-ray. Artifacts of this technique include magnification of the heart and mediastinum, simulating cardiomegaly, mediastinal mass, or aortic aneurysm. In addition, lordotic positioning may increase the amount of soft tissue projected over the lower abdomen, resulting in increased apparent opacity at the lung bases. This may be mistaken for basilar infectious infiltrates, atelectasis, or pulmonary edema.
Oblique Views
Oblique views, though rarely used in the emergency department, use parallax to identify the location of objects or structures within the lung. Two structures that overlie each other on lateral or frontal projection views can be distinguished by an oblique view. More often in the emergency department, an oblique view is inadvertently obtained because of rotation of the patient. This commonly occurs when AP x-rays are obtained in patients with kyphosis, contractures, or neurologic deficits. Rotated or oblique views can introduce a number of artifacts. Among them, the mediastinum often appears artifactually widened, and the heart and mediastinum may appear shifted (Figure 5-21). Opacities in the lung bases may be hidden if the cardiac silhouette is projected over them because of rotation.
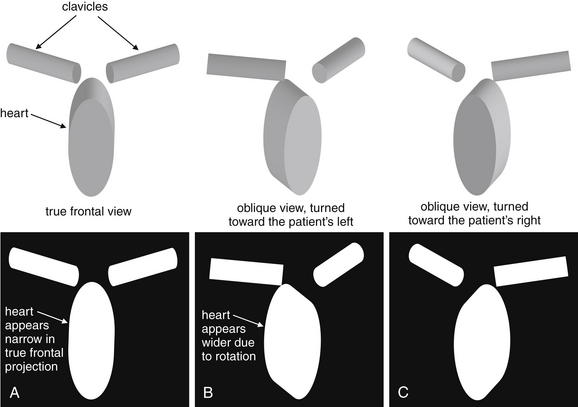
A good-quality chest x-ray should be obtained in a true frontal projection (A), free of rotation. An oblique film alters the apparent width and position of the mediastinum. Assess for this by checking the position of the clavicular heads, which should be symmetrically arrayed about the midline. Rotation of the patient shifts the position of the clavicular heads. Notice how the three-dimensional figures in the upper part of this diagram appear when rotated and then projected in two dimensions, as happens in a chest x-ray. The “heart” (ellipse) appears wider in the rotated views (B and C).
Phase of Respiration: Inspiratory and Expiratory Views
Normally, a chest x-ray is obtained at full inspiration, although in many cases patients may fail to inspire deeply because of chest pain or may be unable to hold their breath in this position because of dyspnea. The chest x-ray captures a frozen, static moment in time, but thoracic structures are actually in motion with patient respiration and cardiac activity. The apparent density of lung tissue varies with the phase of respiration. At end-expiration, lung volumes are very low, the diaphragms appear high, and lung tissue appears dense (whiter). Blood vessels in the lungs appear crowded together, contributing to the apparent density of lung tissue. If the phase of respiration is not considered, this appearance may be mistaken for pulmonary edema. In contrast, a chest x-ray obtained at end-inspiration shows well-inflated lungs, diaphragms that have descended fully, and widely spaced pulmonary vessels. Lung parenchyma under these conditions appears less dense. A clue to the phase of respiration is the number of ribs visible. A rule of thumb is that the diaphragm should lie at the level of the posterior 8th to 10th rib for an adequate respiratory effort in a good-quality chest x-ray. Abnormally dense lung parenchyma such as seen with pneumonia is more visible against the backdrop of fully inflated and lucent (black) lungs. Patients with COPD or asthma may have hyperexpanded lungs with low-density parenchyma and more than 10 ribs visible.
Occasionally, chest x-rays are intentionally obtained in other phases of respiration. Examples include:
Chest X-ray Exposure (Penetration)
The exposure of chest x-ray is particularly critical, as the chest contains structures across a wide range of densities, from air to bone. A fully exposed x-ray film or detector results in a completely black image. For example, x-ray passes readily through air outside the patient, making the background around the patient appear black. Lungs are normally composed mostly of air, with a small density contribution from pulmonary blood vessels, and appear nearly black with a good exposure. A pneumothorax is even less dense, like air outside of the patient, and appears almost completely black. Metals and bones prevent transmission of much x-ray to the detector with a normal exposure; consequently, the detector is not exposed and the image appears white.
From these principles, we can extrapolate that an overexposed chest x-ray will appear black (the entire detector is fully exposed). An underexposed chest x-ray will appear nearly white, as the detector is not exposed. Although the appearance of tissues can be adjusted (brightness and contrast) on a digital picture archiving and communication system (PACS) display, no amount of image manipulation can overcome a badly over- or underexposed image. For example, in a badly overexposed image, the entire detector is fully exposed, and all pixels are completely black. Adjusting the contrast and brightness simply makes the entire image blacker or whiter, without revealing tissue detail. In a badly underexposed image, the entire detector fails to be exposed, and all pixels are completely white. Adjustment of brightness and contrast is not useful in this case, either. As the exposure level is increased above an “optimal exposure,” lung tissue becomes “burned out” (black), and fine details of lung architecture, such as bulla, fissures, pulmonary vascularity, and pneumothorax, are lost. This loss comes with a gain in the visibility of bony detail, as x-ray can now penetrate through less dense regions of bone, including fracture zones. If exposure is lower than an “optimal level,” detail of bone is lost, as no x-ray can penetrate through dense bone. At the same time, soft tissues become more visible, as the lower exposure prevents x-ray from fully exposing the detector behind them. Depending on the clinical presentation, overexposure- or underexposure may be intentionally performed to highlight either bone or soft-tissue detail.
Beware of some common scenarios in which poor exposure can simulate pathology:
Artifacts Outside of the Patient
Opacities and lucencies on the x-ray image may not originate within the patient (Figures 5-22 through 5-25). Overlying skin folds and clothing can create lines simulating pathology such as the pleural line of pneumothorax. Foreign bodies may appear to lie within the patient but may be discerned to be outside of the patient if a lateral view is obtained. Two orthogonal views are needed to confirm an object’s location. Whenever possible, extraneous external foreign bodies should be removed before obtaining x-ray to prevent them from obscuring internal anatomy or being mistaken for objects within the patient. Sometimes surface anatomy such as nipples can simulate internal pathology such as lung nodules. When this is in doubt, marking the surface anatomy with a radiopaque tag can clarify the source of the chest x-ray finding.
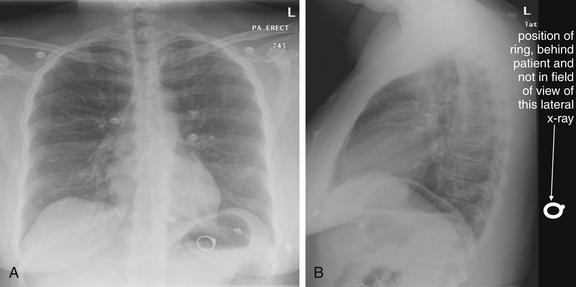
Figure 5-22 Assessing for artifacts: Ring outside body.
A, Upright posterior-anterior (PA) x-ray. B, Upright lateral x-ray. This 39-year-old presented with shortness of breath. Chest x-ray was obtained and revealed an unexpected finding—a ring overlying the patient’s gastric air bubble. The patient then reported having lost her wedding ring some days prior, after removing her shirt. Ingested foreign bodies are a frequent complaint in the emergency department. Plain x-rays can assist in localizing these, in identifying the ingested item, and in predicting the likelihood of passage and need for intervention. When an ingested foreign body is suspected, two orthogonal views (posterior–anterior or anterior–posterior and lateral) are needed to localize the object. In this case, the object was not seen on the lateral view, suggesting that it was not within the patient. On reexamination of the patient, the ring was found in a skin fold on the patient’s back.
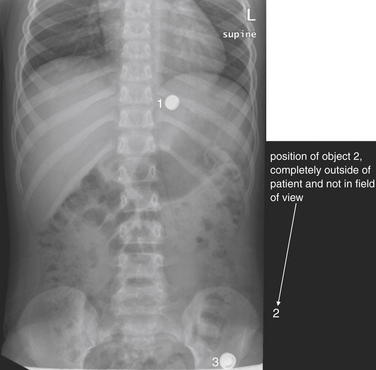
Figure 5-23 Assessing for artifacts: Button battery ingestion.
This 7-year-old child was “washing” a button battery in her mouth in an effort to fix her electric toy when she reported accidentally swallowing the battery. Parents were uncertain whether any ingestion had occurred. When an ingested foreign body is suspected, two orthogonal views (PA or AP and lateral) are needed to localize the object. The anterior–posterior (AP) supine view shown here reveals two radiopaque objects, labeled 1 and 3 on this image. The lateral view (Figure 5-24) reveals 3 radiopaque objects, including an object not seen on this AP image but whose position is labeled 2. Did the patient ingest multiple batteries? Only object 1 is projected in a consistent location overlying the abdomen on both AP and lateral views and is intraabdominal. The other two objects are external to the patient. Object 3 on the lateral view (see Figure 5-24) corresponds to the caudad object on the AP view. Object 2 on the lateral view is so far lateral that it is not visible on the AP view. The patient underwent upper endoscopy, but the battery had moved beyond the pylorus and could not be retrieved. X-rays obtained 24 hours later confirmed passage of the battery.
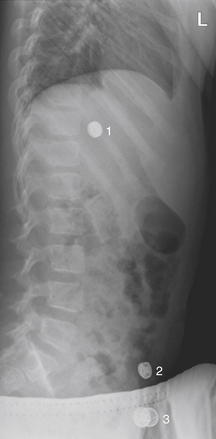
Figure 5-24 Assessing for artifacts: Button battery ingestion.
Same patient as Figure 5-23. The lateral view shown here reveals the three radiopaque objects. (See also Figure 5-23.)
Figure 5-25 Assessing for artifacts.
This adult male presented in cardiac arrest and was successfully resuscitated. Chest x-ray was obtained and shows popcorn-like densities in the neck and right axilla. Are they a sign of a disease process? Could these be calcifications in lymph nodes related to metastatic disease? No, they are due to ice in bags placed outside the patient for postresuscitation neuroprotective cooling. Densities on x-ray must be considered in clinical context. Not all opacities are caused by pathology within the patient.
Tissue Densities and Chest X-ray
On chest x-ray, only four basic tissue densities are present (Box 5-1): air, fat, water (typical of both fluids and most solid body organs, such as liver and muscle, which are more than 90% water), and metal. This includes calcium, which you will recall from chemistry class is actually a metal. Some texts distinguish bone from metal. A key principle of chest x-ray interpretation is that two tissues in direct physical contact with each other and sharing the same basic density are indistinguishable. For this reason, the diaphragm cannot normally be discerned from the abutting liver, because both are of water density. Similarly, blood (water density) cannot be seen within the heart (also water density). Pericardial fluid cannot be distinguished from myocardium, because both are of water density, but pericardial air can be distinguished from myocardium. A pleural effusion lying above the diaphragm shares the same density with the subjacent diaphragm and liver and cannot be directly distinguished.
Normal lung tissue (air density) can be distinguished readily from adjacent normal soft tissues (water density), because the two tissues do not share the same density. However, when normally air-filled alveoli become filled with water density, the border between that lung tissue and the adjacent heart disappears. The cause of the alveolar water density does not matter: pneumonia, hemorrhage, and aspirated material all have the same effect, increasing the density of the lung from air to water. Consequently, if the abnormal lung abuts another water density structure such as the heart or diaphragm, the junction between the two tissues cannot be discerned. A little anatomy illustrates the clinical utility of this fact. The right middle lobe abuts the lower right heart border, and the right lower lobe abuts the diaphragm. For this reason, a right middle lobe pneumonia obscures the lower right heart border, and a right lower lobe pneumonia obscures the diaphragm. On the left side, the lingula abuts the lower left heart border, and the left lower lobe abuts the diaphragm. Pneumonias in these areas obscure the left heart border and left diaphragm, respectively.
Silhouette Sign
As we have just discussed, two objects with the same basic chest x-ray density (air, fat, water, or metal/bone) abutting one another cannot be distinguished. The corollary of this is that when two structures of different basic density abut each other, their junction can be discerned on x-ray. This is called the silhouette sign (Figure 5-26).27 Loss of the normal silhouette sign along the heart borders or diaphragm is an important pathologic finding, though it does not always signify pneumonia, as we explore further. Any change that causes the abnormal juxtaposition of two tissues of the same density results in loss of the silhouette sign. Examples include a solid lung mass adjacent to the heart, a pleural effusion adjacent to the heart or diaphragm, dense pulmonary edema, or atelectasis of lung adjacent to the heart or diaphragm, in which case the “collapse” of lung tissue results in it taking on a solid organ density (water density). Box 5-2 outlines the differential diagnosis of increased lung parenchymal opacity.
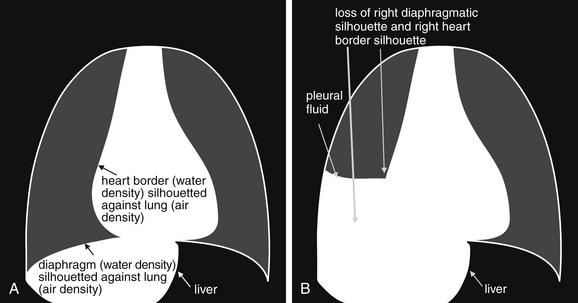
Figure 5-26 The silhouette sign.
On chest x-ray, four densities are visible: air, fat, water (fluid, or soft tissues), and metal (bone). When two immediately adjacent organs or tissues share the same density, they cannot be distinguished. In contrast, when a tissue abuts another tissue of different density, it is silhouetted against the other tissue density. Loss of this normal silhouette, or the development of an unexpected silhouette at the interface of two tissues of similar density, is called the silhouette sign and indicates a pathologic change in tissue density. Normal examples of tissues that cannot be distinguished because they share the same density include the diaphragm and liver and the heart and intracardiac blood. Pathologic examples of the silhouette sign include the liver, the diaphragm and an adjacent subpulmonic pleural effusion; or a pleural effusion adjacent to the right heart. A, Normal chest. B, Pathologic chest with subpulmonic pleural effusion, which obscures the diaphragm and the right heart border.
In other cases, the pathologic change is not the loss of the silhouette sign but rather the introduction of a silhouette sign when one is not normally present. This occurs when a new, abnormal tissue density becomes interposed between two adjacent tissues that share the same density and normally are not distinguishable. For example, the junction between the liver and the diaphragm is not normally visible, as the two tissues are in direct physical contact and share the same density (water or soft-tissue density). If pneumoperitoneum develops, air can become interposed between the liver and the diaphragm, making this interface visible (see Figure 5-11). Air can also cause a pathologic silhouette sign when it is present within the pericardium (between the soft tissues of the heart and the pericardial sac) or in the abdomen when air is visible between two adjacent loops of bowel, making the external surface of the bowel wall visible.
Air Bronchograms: A Manifestation of the Silhouette Sign
The silhouette sign can sometimes be used to distinguish otherwise similar-appearing chest x-ray findings. For example, a pleural effusion and a dense pulmonary infiltrate may have similar appearances on upright chest x-ray. Because both conditions are water density and both may abut the heart and mediastinum, both may cause loss of the normal silhouette sign. However, a pleural effusion appears uniformly dense, whereas a pulmonary alveolar infiltrate may result in the appearance of a new, abnormal silhouette called an air bronchogram (Figure 5-27). Normally, bronchi within the lung parenchyma are not visible on chest x-ray. This is because the bronchi contain air and immediately abut alveoli, which also contain air. The bronchial wall itself is too thin to attenuate x-ray to a significant degree and is therefore invisible, except when it is seen end-on. In these cases, it may be visible as a small, circular density with a hollow, lucent (black) center. This normal scenario is disrupted when alveolar fluid is present—whether that fluid is pus (pneumonia), serous fluid (pulmonary edema), blood (pulmonary hemorrhage), or lunch (aspirated food material). Under these conditions, fluid-filled alveoli become visible as water density immediately adjacent to air-filled bronchi, and the silhouette of air-filled bronchi may be seen. At extremes of the conditions described, pus, pulmonary edema fluid, blood, or aspirated material may fill bronchi as well, in which case air bronchograms may not be seen. When present, air bronchograms prove alveolar opacification. When air bronchograms are absent, either pleural fluid or alveolar and bronchial fluid may be present.
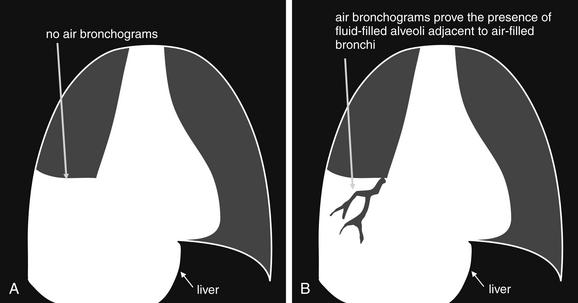
Figure 5-27 Air bronchograms prove the presence of air-space consolidation.
Normally, air-filled bronchi are not visible because they are immediately adjacent to air-filled alveoli. The bronchial wall is too thin to be visible except when seen end-on. When alveoli fill with fluid (pus, edema, blood, or aspirated gastric material), they may silhouette the adjacent air-filled bronchi. A, The absence of air bronchograms is compatible with a pleural effusion or with both alveoli and adjacent bronchi having been filled with fluid, as may occur with massive aspiration or pulmonary hemorrhage, severe pneumonia, or extremes of pulmonary edema. In other words, when air bronchograms are absent in an opacified lung field, the explanation may be pleural fluid, infectious parenchymal infiltrate, aspiration, parenchymal hemorrhage, or pulmonary edema. B, When air bronchograms are present, they prove that alveolar fluid is present and that the adjacent bronchi remain air-filled. Thus a pleural effusion does not create an air bronchogram, which is by definition a finding of air-space disease. A differential diagnosis remains for air-space disease, including infectious infiltrate, aspiration, hemorrhage, and pulmonary edema. Therefore, air bronchograms are not pathognomonic for infection.
Silhouette Sign and Lateral Chest X-ray
We discussed the lateral chest x-ray earlier in some detail in the section on x-ray technique and views. However, this topic is important enough to revisit in the context of the silhouette sign.
Retrosternal Space
The retrosternal space is invisible on the frontal chest x-ray, as it lies directly anterior to the soft tissues of the heart and upper mediastinum. On the lateral x-ray, this space is normally lucent (black) because of the presence of aerated lung tissue and epicardial fat; it forms a normal silhouette against the soft tissues of the heart and upper mediastinum. A
Box 5-2 Causes of Apparent Lung Parenchymal Opacity, Leading to Loss of Normal Silhouette Sign
Normally, the heart and diaphragm (water density) abut low density lung tissue (air density) and thus are silhouetted against it. Loss of this silhouette implies that lung density has been replaced by water density. Causes include:
soft-tissue mass in this location abuts the soft tissues of the heart and mediastinum and thus is not discernible as a discrete structure, according to the principles of the silhouette sign discussed earlier. Thus loss of the normal lucent retrocardiac space and replacement with water density attenuation is evidence of an anterior mediastinal mass (see Figure 5-17). The differential diagnosis includes the five terrible “T”s (Box 5-3).
Retrocardiac Space
The normal retrocardiac space is lucent (black) on the lateral chest x-ray because of aerated lung in this location; it forms a normal silhouette with the soft tissues of the heart anteriorly, the diaphragm inferiorly, and the bones of the thoracic spine posteriorly. The space is hidden on the frontal projection by the presence of the heart. When tissue increases in density in this area, the appearance is a brighter white—a possible indication of a retrocardiac infectious infiltrate or other cause of increased parenchymal or pleural opacity, such as mass or edema. Inspection of the retrocardiac space on the lateral chest x-ray is therefore an important step in assessing the x-ray. Loss of the normal silhouette sign in this location, or the presence of an abnormal density, is evidence of pneumonia, mass, pulmonary edema, or pleural effusion (see Figures 5-16 and 5-18).
Fissures
The major and minor fissures can provide anatomic landmarks, revealing important disease when present (Figures 5-28 through 5-30). The fissures represent pleural boundaries and are actually a “sandwich” composed of the distinct pleura lining two adjacent pulmonary lobes and the potential space between. Thickening of a fissure on chest x-ray can be the result of thickening of the pleura itself, fluid accumulating in the potential space between the two pleural layers, or disease such as malignancy. The minor fissure (also called the transverse fissure) is usually visible as a thin horizontal line on both frontal (PA or AP) and lateral chest x-ray projections. It separates the upper and middle lobes of the right lung. The major fissure is not visible on the frontal chest x-ray projection. On the lateral projection, it is visible as a thin line running from the inferior portion of the anterior thorax to the superior aspect of the posterior thorax. It is actually composed of two fissures, superimposed on the lateral projection. On the left, it divides the upper and lower lobes of the left lung. On the right, it divides the upper and middle lobes from the lower lobe of the right lung.
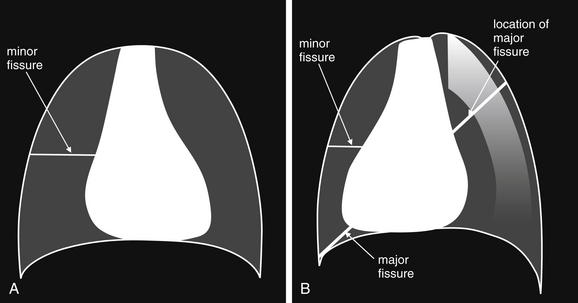
The major and minor fissures are important landmarks on chest x-ray. They represent potential spaces that can fill with fluid in disease states such as pulmonary edema. They are anatomic boundaries that can bound pathologic processes such as pneumonias, masses, and infarctions. Deviations of the fissures from their normal positions can indicate changes in the volumes of lung segments. The minor fissure is visible as a horizontal line on both frontal (A) (posterior–anterior or anterior–posterior) and lateral (B) projections, as it lies in a transverse plane that is perpendicular to both chest x-ray projections. The major fissure is invisible on the frontal projection, as it lies in a plane oblique to that projection. It is visible on the lateral projection, as it lies perpendicular to this projection. In many normal cases, the major and minor fissures may be subtle or invisible.
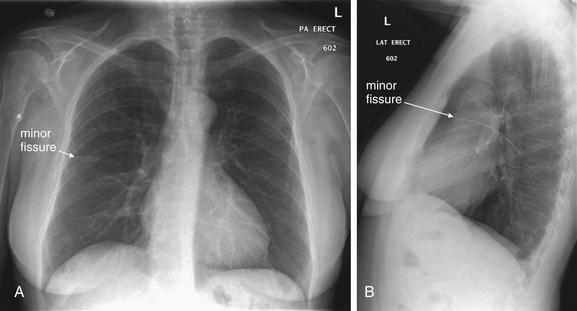
Figure 5-29 Visible minor fissure.
This patient has a visible minor fissure (also called a transverse fissure), the horizontal fissure separating the upper and middle lobes of the right lung. Because it is perpendicular to the coronal plane and to the sagittal plane, the minor fissure is often visible on both the frontal chest x-ray (A) (whether posterior–anterior as in this case or anterior–posterior) and on the lateral chest x-ray (B). When the fissure contains fluid or is thickened by pleural abnormalities, is appears as a thin horizontal line on the frontal chest x-ray and as a horizontal line curving inferiorly and posteriorly on the lateral x-ray. Why should an emergency physician care about the minor fissure? This is a landmark that can hint at other pathology. Movement of the minor fissure away from its normal position suggests lobar collapse—the fissure moves toward the collapsing lobe as volume is lost. In addition, infiltrates, pulmonary infarcts, and sometimes tumors abruptly stop above or below this fissure. Sometimes a large amount of fluid in the fissure may simulate a mass. During the remainder of this chapter, we give examples of abnormalities expressed through changes in the minor fissure. Compare with Figure 5-28.
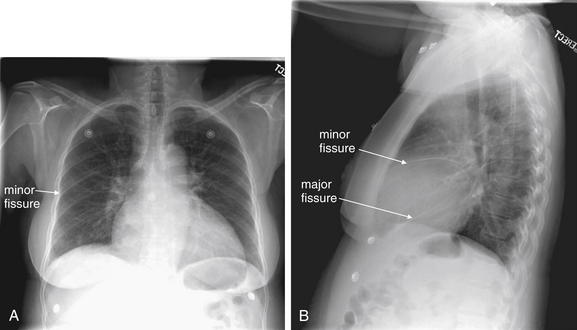
Figure 5-30 Prominent fissures.
The major fissure is not visible on the frontal chest x-ray, as it lies in an oblique plane from anterior–inferior to posterior–superior. On the lateral chest x-ray, the major fissure is visible as a diagonal line from the anterior diaphragm to the posterior midthoracic spine. Like the minor fissure, the major fissure is not itself a sign of pathology, but knowing its usual appearance can help the emergency physician to recognize pathology impinging on the major fissure. In this patient, the minor and major fissures are visible on the lateral chest x-ray (B). The minor fissure is faintly visible on the frontal chest x-ray (A). Notice how the major fissure is not seen on the frontal x-ray because of its orientation. Compare with Figure 5-28.
Box 5-3 Differential Diagnosis of Anterior Mediastinal Mass in Retrosternal Space on Lateral Chest X-ray
Fissures can change rapidly in their appearance (Figures 5-31 through 5-34). Thickening of fissures can develop or disappear in a matter of hours, sometimes giving clues to the cause. Rapidly changing fissures generally indicate fluid within the fissure, rather than pleural thickening. Changes can be dramatic; fluid in the minor fissure can assume a rounded appearance mimicking a mass lesion but disappearing within days or hours. This has been called the “vanishing tumor” or “pseudotumor.”
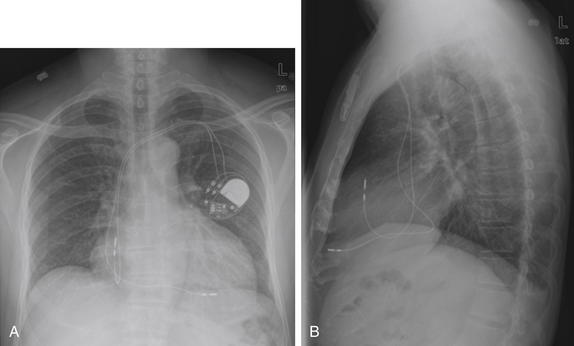
Figure 5-31 Fissures come and fissures go.
In a normal patient, the minor and major fissures can be extremely subtle or even invisible. With the development of pleural fluid from any cause, the fissures can change dramatically in appearance in a short time frame. Consider this patient with heart failure. A and B, The patient has nearly invisible minor and major fissures. Follow the appearance of the fissures in the next three figures (Figures 5-32 through 5-34).
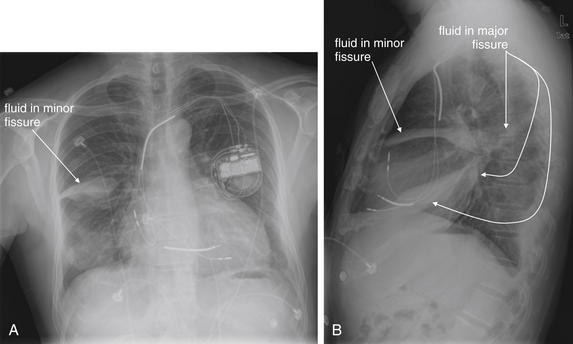
Figure 5-32 Fissures come and fissures go.
Same patient as Figure 5-31, now, with worsened heart failure. The fluid in the minor and major fissures is prominent, marking the locations of the previously invisible fissures. Also compare with Figures 5-33 and 5-34.
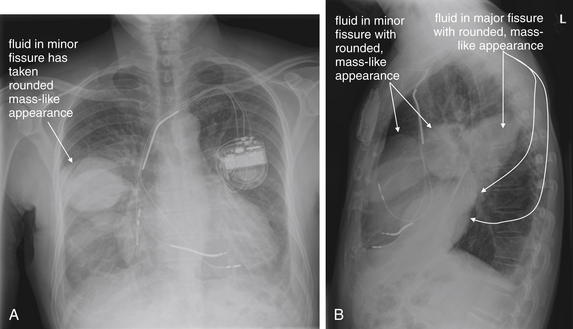
Figure 5-33 Fissures come and fissures go.
Same patient as in Figures 5-31 and 5-32, now with progressively worsening heart failure. The fluid in the minor and major fissures is prominent and rounded, with a masslike appearance. Without prior and future chest x-rays to monitor the appearance, a mass cannot be excluded. Rapidly resolving fluid in the major and minor fissures has sometimes been termed “vanishing tumor” or “pseudotumor” because of this remarkable ability to simulate a mass lesion. Compare also with Figure 5-34.
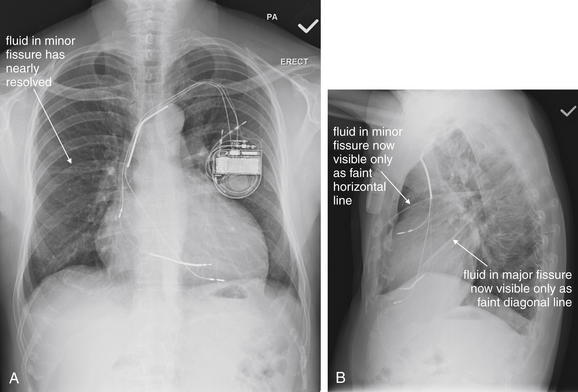
Figure 5-34 Fissures come and fissures go.
Same patient as in Figures 5-31 through 5-33, now after treatment for heart failure. The fluid in the minor and major fissures, which had previously assumed a rounded, masslike appearance, is nearly gone, in keeping with the term “vanishing tumor.”
Changes in Volume and Pressure on Chest X-ray
Changes in volume and pressure can be seen on frontal chest x-ray and can indicate immediately life-threatening pathology (Figure 5-35). Mediastinal shift is seen with both increased and decreased pressure and volume. Increased pressure and volume on the side with pathology push the mediastinum away from the abnormal side. Decreased pressure and volume pull the mediastinum toward the abnormal side. In both cases, tracheal deviation may be seen, in the same direction as the mediastinal shift.
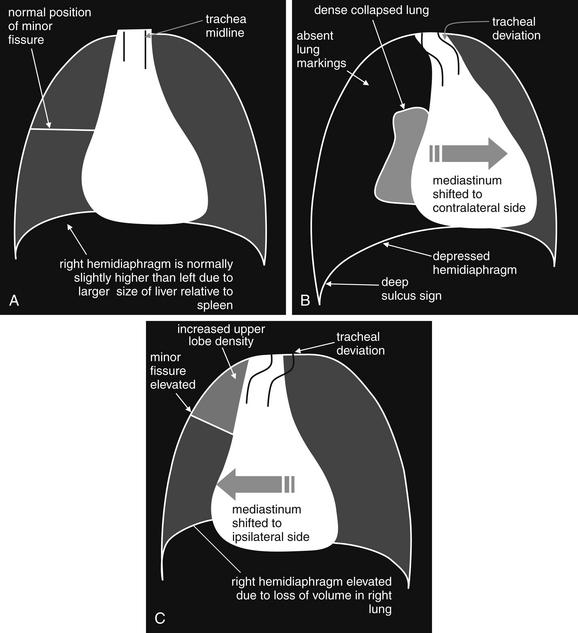
Figure 5-35 Changes in pressure and volume on chest x-ray.
A, The lungs and mediastinum under normal conditions of pressure and volume. The heart and airway are near the midline. The minor fissure is in normal position. The right diaphragm is usually slightly higher than the left, because of the larger size of the liver relative to the spleen. B, Increased pressure results in mediastinal shift and tracheal deviation to the opposite side. In the case of a right-sided tension pneumothorax, the right hemidiaphragm may be displaced in a caudad direction and may be lower than the left hemidiaphragm—the reverse of their normal positions. In addition, in any tension pneumothorax, the costophrenic angle may be extremely deep on the abnormal side due to a hyperinflated pleural space—the “deep sulcus sign.” C, Decreased pressure and volume, such as is seen with lobar collapse, results in mediastinal and tracheal shift toward the affected side. The diaphragm may be elevated because of decreased lung volume. The minor fissure may move in the direction of the collapsed lobe. In addition, the collapsed lobe may be visible as an increased density. If the collapsed lobe abuts the heart, a pathological silhouette sign may be present.
Increased Pressure and Volume
Increased pressure and volume, as seen in a tension pneumothorax (Figure 5-36; see also Figure 5-35), result in the diaphragm on the abnormal side being pushed down. A tension pneumothorax on the right side may be notable for the right hemidiaphragm being lower than the left—a reversal of the normal pattern. Normally, the right hemidiaphragm is higher than the left because of the liver (right side) being larger than the spleen (left side) and displacing the diaphragm upward. In tension pneumothorax, a deep sulcus sign can be seen (see Figures 5-35 and 5-36), with the costophrenic angle on the affected side being deeper than on the unaffected side. In some extreme cases, the sulcus may be so deep that its inferior extent is not visible on the chest x-ray. Tension pneumothorax is discussed in detail in Chapter 6. We discuss pneumothoraces in more detail later, but naturally a pneumothorax is distinguished by an absence of lung markings on the affected side. Purists argue that tension pneumothorax is a clinical diagnosis, marked by hypotension and shock, and never to be found on chest x-ray. Nonetheless, chest x-rays sometimes record these findings, and an emergency physician must immediately recognize chest x-ray findings suggestive of tension pneumothorax and respond appropriately.
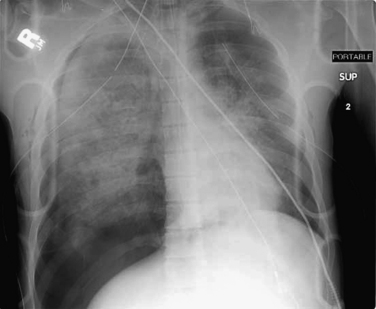
Figure 5-36 A case of increased pressure and volume: Tension pneumothorax.
This example shows mediastinal shift to the patient’s left, as well as depression of the right hemidiaphragm and a deep sulcus sign (the right costophrenic angle is pushed below the lower margin of the image). Absence of lung markings indicates the pneumothorax, whereas the lung shows increased density, likely from a combination of collapse and pulmonary contusion. In this particular case, bilateral chest tubes have already been placed without resolution of the pneumothorax, suggesting large airway disruption. The rate of air leak from the bronchus defect exceeds the rate at which air is being removed through the thoracostomy tube. Compare with Figure 5-35.
Decreased Pressure and Volume
Decreased pressure and volume (see Figure 5-35) may result in the diaphragm appearing higher than usual—because of the absence of aerated lung pushing it down into its normal position. In addition, the normal position of the minor fissure may be changed on the frontal x-ray. The minor fissure is usually visible as a thin horizontal line roughly at the midpoint of the cephalad–caudad diameter of the thorax. When upper lobe collapse occurs, the minor fissure is elevated, whereas lower lobe collapse may result in the minor fissure assuming a lower-than-normal position. Think of lobar collapse as resulting in an accordion-like compression of the involved lung segment, with the minor fissure following in the direction of collapse and volume loss. In addition, the collapsed lobe may be visible as an increased density. If the collapsed lobe abuts the heart, abnormal loss of the silhouette sign may occur. Common scenarios leading to lobar collapse include basilar atelectasis (Figure 5-37), bronchial mucus plugging (Figure 5-38), iatrogenic right main bronchus intubation (Figure 5-39), obstructing endobronchial lesion (e.g., carcinoma), and extrinsic compression of a bronchus from a mass lesion. Patients who have undergone pneumonectomy also have significant volume loss (Figures 5-40 and 5-41).
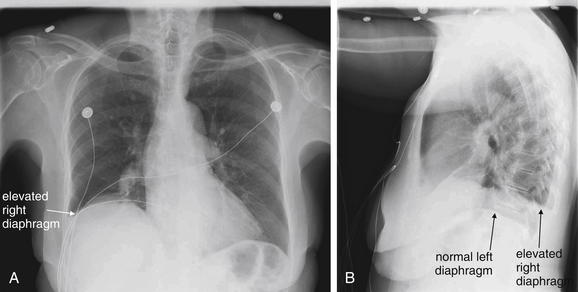
Figure 5-37 Atelectasis with elevated diaphragm: An example of volume loss.
The right hemidiaphragm in this patient appears elevated on both the posterior–anterior (A) and the lateral (B) views. Is this the correct interpretation of the x-ray, and if so, what is the cause? Consider the alterative interpretations. A subpulmonic pleural effusion would appear similar, as it would have the same density as liver, heart, and diaphragm and would layer over the diaphragm with the patient upright. This appears less likely in that a meniscus might be seen along the lateral chest wall with a pleural effusion but is not present here. In addition, a pleural effusion occupies space and might be expected to push the heart to the left, whereas in this case the heart may be slightly deviated to the right. Atelectasis of the lower right lung would result in volume loss, pulling the heart and hemidiaphragm into the space normally occupied by lung. This is consistent with the observed features. An infiltrate in this location could explain the x-ray findings but appears less likely for similar reasons to those cited for effusion. Some simple maneuvers could narrow the differential diagnosis. Chest ultrasound, decubitus x-ray views, or CT could identify an effusion.
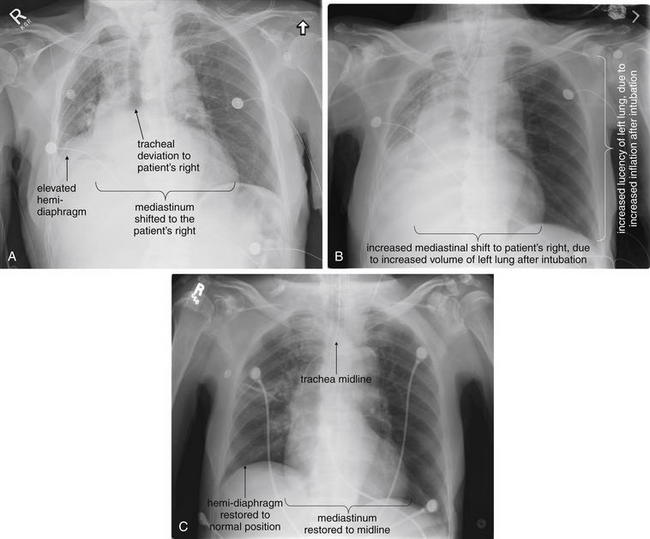
Figure 5-38 Lobar collapse and volume loss with mediastinal shift. This 70-year-old male presented with hypoxia, hypotension, and altered mental status. A, Initial chest x-ray before intubation. B, Chest x-ray after intubation was performed. The patient’s vital signs did not improve. C, Chest x-ray minutes later, after an intervention was performed and the patient’s vital signs improved. The initial chest x-ray (A) shows evidence of “volume loss.” Volume loss refers to a decrease in the size of the contents of a portion of the thoracic cavity. In contrast to tension pneumothorax, where an increase in the volume of one hemithorax displaces the mediastinum away from the affected side, volume loss means decrease in volume and causes mediastinal shift toward the affected side. Three signs point to volume loss in this patient: the mediastinum is shifted toward the patient’s right, tracheal deviation is present toward the patient’s right, and the right hemidiaphragm is elevated. In this case, the patient had volume loss resulting from lobar collapse because of mucous plugging. Intubation initially worsened the patient’s condition, because the normal (left) lung readily inflated under positive pressure. This increased the degree of mediastinal shift toward the patient’s right (B), further compressing the left lung. Adjusting the ventilator to increase positive pressure ventilation and positive end-expiratory pressure resulted in reinflation of the collapsed lobe, resolving the chest x-ray abnormalities and improving the patient’s clinical condition (C). In some patients, such as those with collapse because of an obstructing bronchial mass, this intervention might not be helpful. Bronchoscopy with stenting of the obstructed airway might be necessary to restore lobar inflation. Avoid mistaking volume loss for pleural effusion. A pleural effusion might appear similar to the elevated right hemidiaphragm, but pleural effusion occupies volume and thus should not cause mediastinal shift or tracheal deviation toward the affected side. Bedside ultrasound may help to discriminate between the two conditions. In this case, no effusion was present, and the patient’s liver was visible on ultrasound, at the level of the nipple viewed through the right axilla. Compare with Figure 5-35.
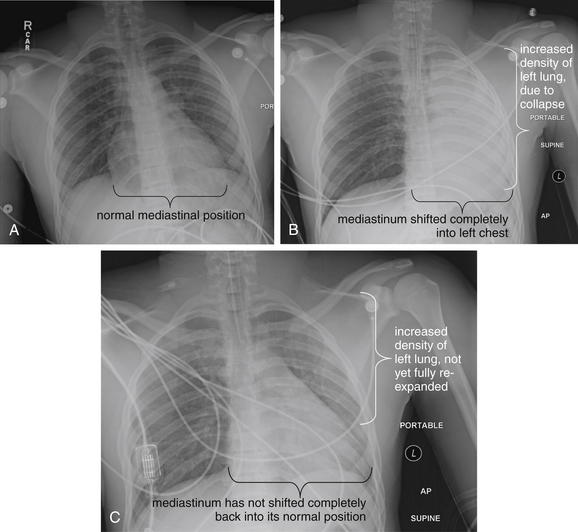
Figure 5-39 Volume loss resulting from right main bronchus intubation.
This figure demonstrates another common cause of volume loss—iatrogenic right main bronchus intubation. A, The patient has not yet been intubated. B, The patient has been intubated and the left lung appears completely collapsed (opacified). One clue to volume loss here is that the entire mediastinum has shifted into the left chest and is not visible against the background of collapsed lung. This is an example of the pathologic silhouette sign. The scenario in B may present without the benefit of the comparison x-ray A, if the patient is intubated before a chest x-ray can be obtained. The emergency physician must recognize right main-stem intubation as a possible cause, rather than mistaking this for a left pleural effusion or dense pneumonia. C, The endotracheal tube has been repositioned at a shallower depth, and the left lung is partially reexpanded. The left lung parenchyma appears slightly denser than the right, as it has not yet fully reinflated. The mediastinum has not yet shifted back to its usual position because of hypoinflation of the left lung.
The appearance in B can also be seen in a patient with a pneumonectomy, as mediastinal shift into the empty hemithorax occurs (see Figure 5-10, 5-40, 5-41). Compare also with Figures 5-35 and 5-38.
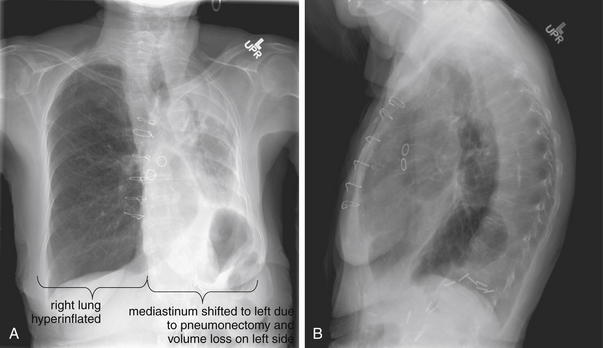
Figure 5-40 Pneumonectomy: Another cause of volume loss.
A, Posterior-anterior (PA) upright chest x-ray. B, Lateral upright chest x-ray. This 86-year-old female has a history of lung cancer treated with left pneumonectomy. As a consequence, there is significant loss of volume in the left chest, and the heart, mediastinum, and trachea have shifted to the left to fill the void. The right lung appears hyperinflated, which is typical in cases of contralateral volume loss. This is due to the extra space created in the right thorax by shift of the heart and mediastinum to the left.
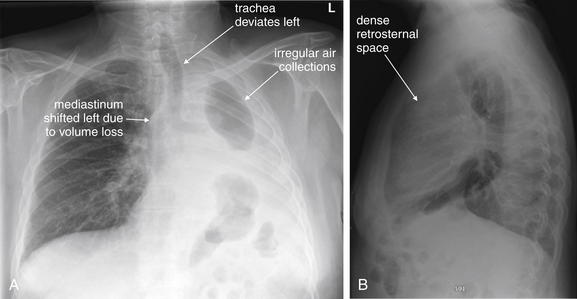
A, Posterior-anterior (PA) chest x-ray. B, Lateral chest x-ray. This 60-year-old male underwent left pneumonectomy for non–small cell lung cancer months prior and presented with hypotension. A, His chest x-ray shows an irregular opacification of the left chest, with rounded air densities and fluid. The mediastinum has shifted into the left chest because of the expected volume loss from pneumonectomy. We have seen this appearance previously with lobar collapse. Notice how the trachea deviates left as well. This patient’s chest x-ray appearance was unchanged from priors, but two additional diagnoses should have been considered if increased air had been seen. One is abscess with gas-producing organisms in the pleural space. The second is bronchopleural fistula, which would allow air to escape from the residual left bronchus. This would also pose a risk of infection, as nonsterile air would enter the poorly defended pleural space. B, The patient also has a dense retrosternal space, concerning for an anterior mediastinal mass.
Specific Pathologic Diagnoses
So far, we have reviewed many key principles of chest x-ray interpretation, with little discussion of the specific radiographic appearance of any acute pathology. With these basic principles in mind, we now discuss key findings of common and serious emergency medical conditions. The remainder of this chapter includes nearly 200 cases of key emergency diagnoses, with case descriptions and annotated figures displaying radiographic findings. To guide you through these figures, we have summarized the content of figures (Table 5-5).
TABLE 5-5 Arrangement of Figures
| Figure content | Figure number |
|---|---|
| acute chest syndrome | 91 |
| air bronchograms | 27, 53-54 |
| aortic pathology | see Chapter 7 |
| aspiration pneumonitis | 88-90 |
| asthma | 42 |
| atelectasis | 37 |
| cardiac CT | see Chapter 8 |
| cardiomegaly | 104-115, 131-135 |
| cavitary lesions/tuberculosis | 92-96 |
| central venous catheter | 188 |
| changes in pressure and volume | 35 |
| chest x-ray technique | 1,2,3,4, 5, 6,7 |
| congestive heart failure/pulmonary edema | 116-122 |
| chronicity of chest x-ray findings | 52 |
| chronic obstructive pulmonary disease | 43-48 |
| cystic fibrosis | 49 |
| dextrocardia | 198 |
| esophageal foreign body | 187 |
| esophageal rupture | 157 |
| external objects | 22, 25 |
| fissures | 28, 29-34 |
| hiatal hernia | 185-6 |
| hilar adenopathy | 183-184 |
| idiopathic pulmonary fibrosis | 50 |
| internal foreign bodies | 23, 24 |
| lateral decubitus x-ray | 19, 20 |
| lobar collapse | 38, 39 |
| lung abscess | 97-101 |
| lung masses | 159-175 |
| mediastinal widening | 176-178 |
| meniscus sign | 8 |
| nasogastric tube | 189 |
| normal chest x-ray | 15, 16 |
| pacemaker complications | 190-197 |
| pericardial effusion | 123-130 |
| pertussis | 86-87 |
| pleural effusions | 9-10, 136-152 |
| pneumonectomy | 40, 41 |
| pneumonia | 55-85 |
| pneumopericardium | 153-156 |
| pneumoperitoneum | 11, 12, 13, 14 |
| pulmonary embolism | see Chapter 7 |
| retrosternal space | 17 |
| right main bronchus intubation | 39 |
| rotation artifact on chest x-ray | 21 |
| septic emboli | 102-103 |
| silhouette sign | 26 |
| smoke inhalation | 51 |
| spine sign | 18 |
| subcutaneous emphysema | 158 |
| superior vena cava syndrome | 179-182 |
| tension pneumothorax | 36 |
| traumatic injuries | see Chapter 6 |
Findings of Common and Serious Emergency Pathology
Asthma and Chronic Obstructive Pulmonary Disease
Both asthma and COPD (Figures 5-42 and 5-43) are disease processes characterized by air trapping and lung hyperinflation. Consequently, they often share the findings of flattened diaphragms (because of hyperinflated lungs pushing the diaphragms down) and increased lung volumes, AP chest diameter, and retrosternal space. The lateral view is useful for assessment of the latter findings and may show the diaphragms to be flattened to a greater extent than was visible on the frontal projection. On the frontal view, the heart may appear small because of the hyperinflated lung fields. In patients with COPD, bullae (also called blebs) may develop (Figures 5-44 through 5-48). These regions are devoid of lung markings and must be carefully distinguished from pneumothorax, as large peripheral bullae can have a similar appearance. Bullae can displace normal pulmonary blood vessels, sometimes crowding these vessels together. Patients with COPD and asthma can suffer barotrauma—spontaneously or because of mechanical ventilation. The chest x-ray should be inspected carefully for pneumothorax and pneumopericardium.
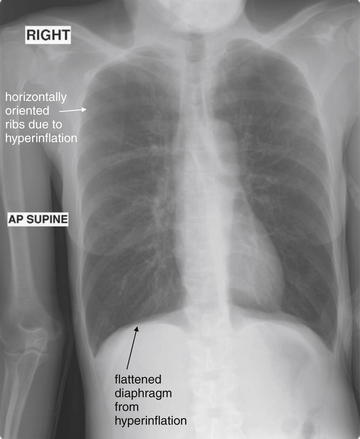
Figure 5-42 Asthma with hyperinflation.
X-rays are not routinely needed for the evaluation of patients with asthma, although they should be considered if pneumonia or barotrauma such as pneumothorax is suspected. Common findings include hyperinflated and thus very lucent lung fields. Hyperinflation flattens the diaphragms as well. An overexpanded thorax often has ribs oriented more horizontally than usual. A good-quality inspiratory film in a normal patient should reveal lungs inflated to the 10th rib. This patient, a 46-year-old asthmatic with multiple prior intubations, has 11 visible ribs even on this supine x-ray. Supine position normally raises the diaphragm because of the pressure of abdominal contents, whereas upright position lowers the diaphragm by gravity.
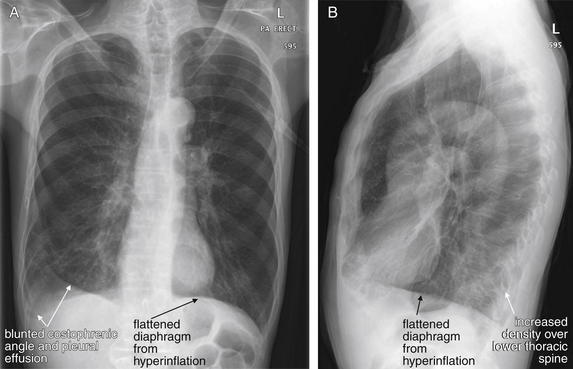
Figure 5-43 Chronic obstructive pulmonary disease (COPD).
A, Posterior-anterior (PA) upright chest x-ray. B, Lateral upright chest x-ray. This 63-year-old male with a history of COPD presented with 2 weeks of worsening cough with yellow sputum and dyspnea. His oxygen saturation was 87% in the emergency department. As in Figure 5-42, this patient has evidence of hyperinflation, with flat diaphragms (particularly evident on the lateral x-ray, B). The patient also has a blunted right costophrenic angle with an apparent effusion and increased densities in both the right and the left lung base (A). The lateral x-ray also shows increased density overlying the inferior thoracic spine, an abnormal spine sign. Findings of pleural effusions and pneumonia are discussed in detail in other figures.
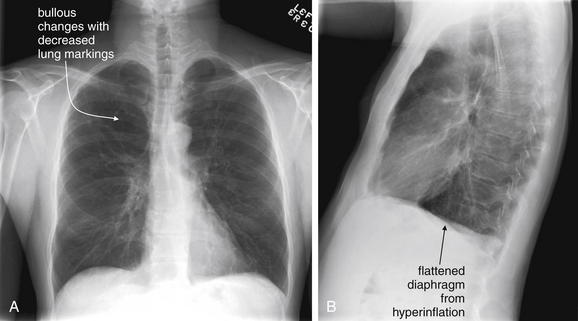
Figure 5-44 Bullae in chronic obstructive pulmonary disease (COPD).
A, Posterior-anterior (PA) upright chest x-ray. B, Lateral upright chest x-ray. In emphysema, destruction of alveoli results in formation of bullae, which may have an appearance similar to pneumothorax with a paucity of lung markings. Bullae may be single or multiple. As disease progresses, they may coalesce into a single, large bulla. Asymmetry from left to right and even within a single lung is common. This 46-year-old male with COPD presented with cough and increased shortness of breath over a 3-week period. A, His chest x-ray shows large bullae in the right upper lobe. B, His lateral x-ray also shows flattened diaphragms typical of COPD. See close-up from the same patient in Figure 5-45.
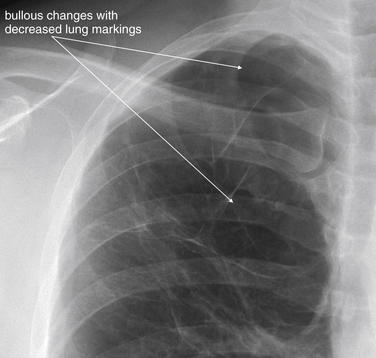
Figure 5-45 Bullae in chronic obstructive pulmonary disease.
Close-up of bullous changes from the same patient as Figure 5-44. The walls of the large bullae are visible, and a paucity of lung markings makes these regions appear abnormally lucent (black).
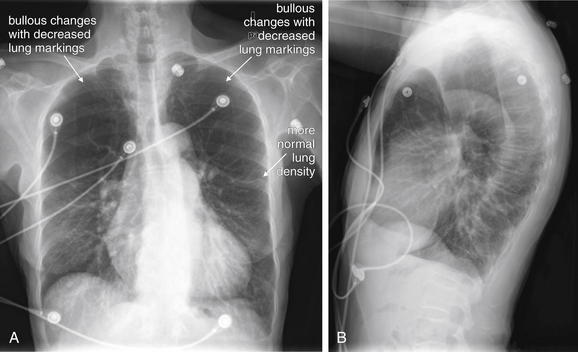
Figure 5-46 Bullae in chronic obstructive pulmonary disease (COPD).
A, Posterior-anterior (PA) chest x-ray. B, Lateral chest x-ray. This 77-year-old female has severe COPD with extensive bullous changes of both upper lungs. A, Note how lucent (black) the upper lungs appear compared with the lower lungs. Figures 5-47 and 5-48 show a close-up of this finding and then a CT scan from the same patient.
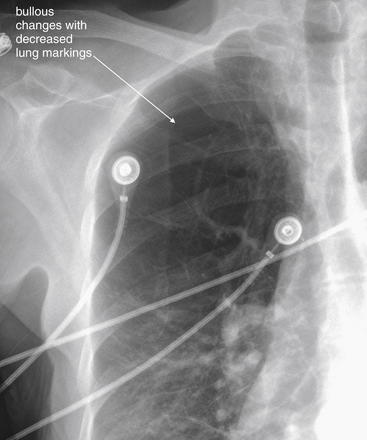
Figure 5-47 Bullae in chronic obstructive pulmonary disease (COPD).
Same patient as Figure 5-46. In the lung apex, the normal lung has been replaced by large bullae, which are air-containing regions lacking the normal parenchymal supporting structures and blood vessels. Consequently, these areas do not attenuate the x-ray beam and look blacker than normal lung on chest x-ray. Compare with the CT scan from the same patient in Figure 5-48.
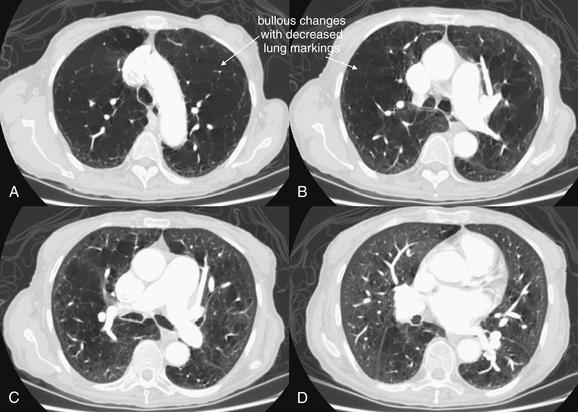
Figure 5-48 Bullae in chronic obstructive pulmonary disease (COPD).
CT scan from the same patient as Figures 5-46 and 5-47, viewed on lung windows. Slice at the level of the aortic arch (A), through the pulmonary artery (B and C), and through the level of the left atrium (D). Note the severe bullous changes in the more cephalad slices. D, The lung parenchyma appears nearly normal in this more caudad slice.
Other Forms of Chronic Lung Disease
Chronic lung diseases such as cystic fibrosis (Figure 5-49), idiopathic pulmonary fibrosis (Figure 5-50), and chronic injuries from smoke inhalation (Figure 5-51) have a similar appearance on chest x-ray. Dense interstitial markings may be seen, and air space disease may be chronically present. Bullae such as those seen in COPD may be present. Often, the appearance is quite abnormal, and comparison with prior chest x-rays is essential to distinguish new opacities suggesting acute infection from chronic disease. These diseases serve as an important reminder that chest x-ray findings should not be assumed to be acute and to explain new symptoms. Comparison with prior x-rays should always be performed when possible (Figure 5-52).
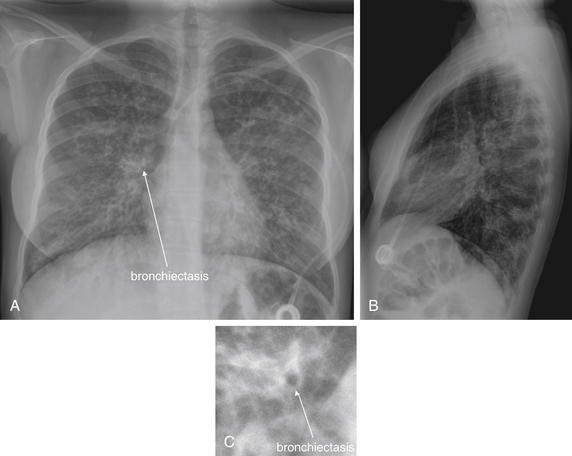
Cystic fibrosis is aptly named. Chest x-ray findings include increased interstitial density of fibrosis and cystic changes of lung parenchyma similar to chronic obstructive pulmonary disease. Bronchiectasis (dilatation of bronchi, potentially eroding into bronchial arteries and presenting with hemoptysis) may be visible on chest x-ray as large and thickened bronchioles, particularly when viewed in short axis (when bronchioles are oriented perpendicular to the frontal plane). This 15-year-old with cystic fibrosis presented with cough and dyspnea. Does she have pneumonia? Comparison with prior x-rays showed no changes. A, Posterior-anterior (PA) chest x-ray. B, Lateral chest x-ray. C, Close-up from A showing bronchiectasis.
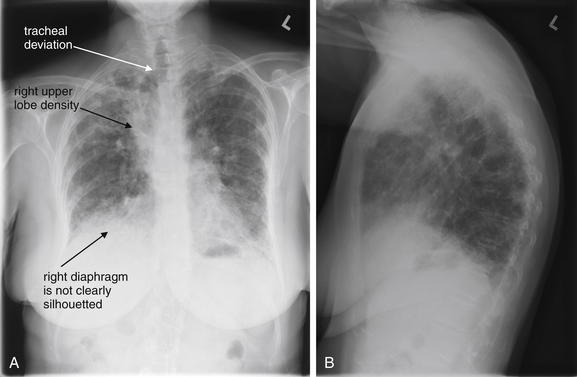
Figure 5-50 Idiopathic pulmonary fibrosis.
This patient with idiopathic pulmonary fibrosis presented with increased dyspnea. The x-ray shows diffuse predominantly peripheral irregular and reticular opacities. The trachea is deviated to the right, suggesting volume loss on the right side, although a mediastinal mass such as adenopathy could also cause this deviation. Both diaphragmatic silhouettes are obscured—raising the possibility of bibasilar infiltrates or atelectasis. The right upper lobe appears dense along the right upper border of the mediastinum—with the possibility of a mass, lobar collapse, or an infectious infiltrate. Patients with such chronically abnormal chest x-rays can be difficult to evaluate. Comparison with prior x-rays to assess chronicity of findings is essential. A, Posterior–anterior view. B, Lateral view.
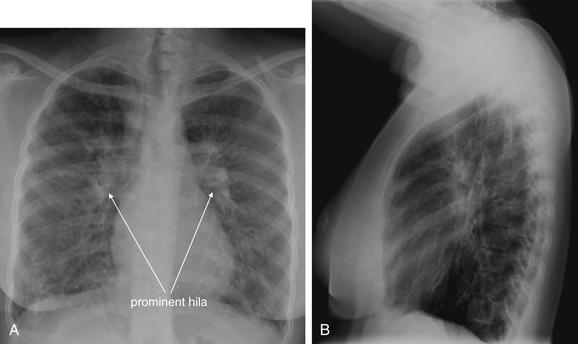
Figure 5-51 Chronic smoke inhalation.
A, Posterior-anterior (PA) chest x-ray. B, Lateral chest x-ray. This 25-year-old female suffered a severe smoke inhalation injury when she was 12 years old and is oxygen dependent. She presented with increased dyspnea and an oxygen saturation of 81%. Her chest x-ray shows coarse reticular opacities throughout the lungs bilaterally. The hila are prominent bilaterally, suggesting possible secondary pulmonary hypertension from chronic hypoxia. Another cause of prominent hila is lymphadenopathy. Compare with the x-ray of cystic fibrosis in Figure 5-49 and that of idiopathic pulmonary fibrosis in Fiure 5-50. These chronic lung diseases share similar radiographic appearances and mandate comparison with prior x-rays whenever possible to determine the acuity of findings.
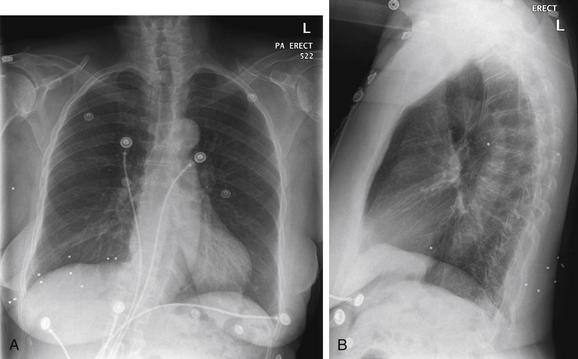
Figure 5-52 Chronicity of chest x-ray findings.
A, Posterior-anterior (PA) upright chest x-ray. B, Lateral upright chest x-ray. This 80-year-old female presented with sudden dyspnea and syncope. Her workup revealed pulmonary embolism. Incidentally, her chest x-ray shows buckshot from a remote prior injury. Remember that chest x-ray findings are not necessarily acute and do not always explain acute symptoms. Comparison with prior x-rays can assist in determining chronicity.
Pneumonia
Pneumonia can follow several common patterns on chest x-ray. First, air space opacification may be present, if alveolar fluid and cellular debris develops. This pattern is common in patients with “typical” bacterial infections such as Streptococcus pneumoniae. Air bronchograms (Figures 5-53 and 5-54; see also Figure 5-27) may be present, as described in earlier sections. Often, the increased density of lung parenchyma obscures the margins of adjacent solid organs such as the heart or diaphragm, resulting in a pathologic loss of the silhouette sign as described earlier. On a frontal projection, a right middle lobe pneumonia obscures the lower right heart border, and a right lower lobe pneumonia obscures the right diaphragm. A left lower lobe pneumonia obscures the left diaphragm, and an infiltrate in the lingula obscures the left heart border (remember that the left lung does not have a middle lobe). Upper lobe pneumonias may obscure the borders of the upper heart and mediastinum. On the lateral view, a pathologic spine sign (described earlier) may be seen, with increased density in the retrocardiac space and overlying the lower thoracic spine. A pleural effusion may be present with pneumonia. If infection is confined to a lobe, the increased density may extend to, but not beyond, a fissure (described earlier) on the frontal or lateral views. Volume loss (described earlier) may occur if mucous plugging is present, with resulting findings including deviation of fissures, elevation of the diaphragm, or mediastinal and tracheal shift. Figures 5-55 through 5-85 depict pneumonias with air space disease in patients of varying ages, and with varying lung regions involved. Pneumonia remains a key diagnosis because of its mortality in patients at extremes of age. The appearance can be highly variable, and chest x-ray is not always diagnostic. Review the figures to gain perspective on the potential appearance of infiltrates.
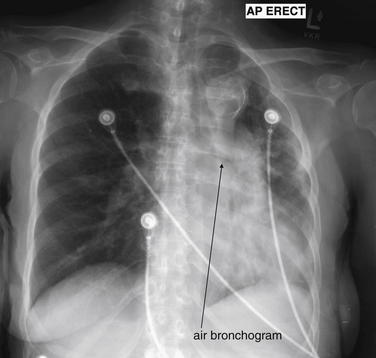
Pulmonary alveolar fluid accumulation results in air bronchograms—the silhouetting of the air-filled (normal) bronchi by fluid-filled (abnormal) alveoli. Normally bronchi are not seen except when they are directly oriented perpendicular to the plane of the x-ray. The reason is simple; as described in the discussion of chest x-ray in the text, the borders of two tissues will not be seen on chest x-ray if they are immediately adjacent and share the same tissue density. Normally, bronchi (air density) and alveoli (air density) cannot be distinguished. The thin walls of bronchi do not attenuate the x-ray beam sufficiently to be visible unless a long segment is oriented perpendicular to the x-ray plane, which leads to the occasional appearance of a circular bronchiole. Compare with Figure 5-27.
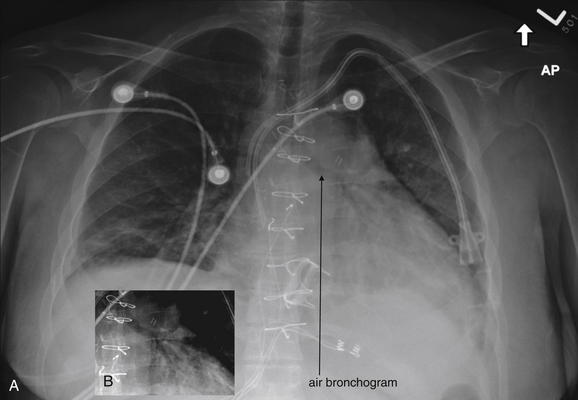
This patient again has a visible air bronchogram (A), with the left main bronchus and its branches silhouetted like a tree turned on its side. The cropped view (B) has been contrast adjusted to make this even more evident. The appearance of air bronchograms is not specific for pneumonia but indicates that alveoli adjacent to an air-filled bronchus have filled with fluid, resulting in a difference in tissue density of two adjacent tissues. Look for air bronchograms in a dense chest, as these identify alveolar fluid. A pleural effusion would not give this appearance, as air-filled alveoli would persist next to the air-filled bronchi.
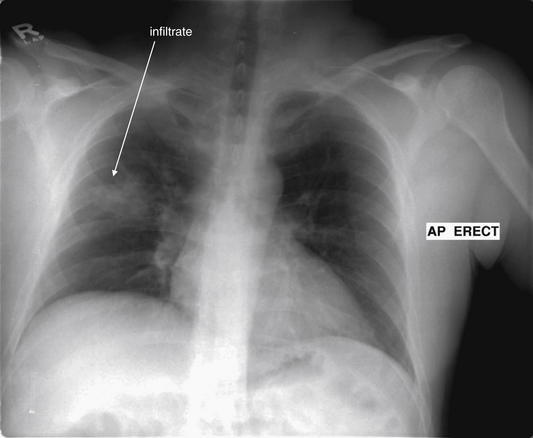
This 37-year-old patient with Crohn’s disease presented with fever, tachycardia, and increased abdominal pain. Abdominal CT showed no evidence of acute pathology, but chest x-ray showed a right midlung opacity consistent with pneumonia.
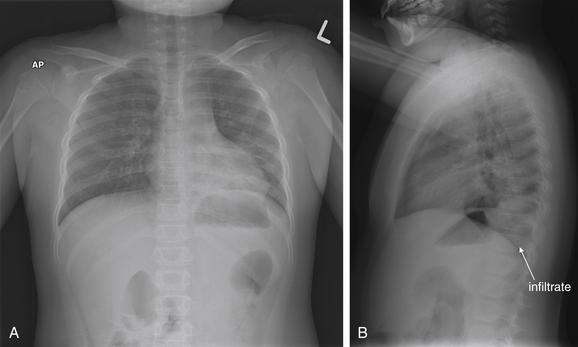
Figure 5-56 Pneumonia: Pediatric, left lower lobe.
A, Anterior-posterior (AP) chest x-ray. B, Lateral chest x-ray. This 7-year-old presented with fever and 5 days of productive cough, now with orange sputum. A, Chest x-ray shows increased subtle density in the left lower lobe on the anterior–posterior (AP) x-ray. B, The lateral x-ray shows a definite increased density overlying the lower thoracic spine—a left lower lobe pneumonia. Recall that the thoracic spine normally appears progressively more lucent as it approaches the diaphragm, a finding called the spine sign. Lack of this progressive lucency suggests an overlying infiltrate. Returning to the AP x-ray, recall that a lingular pneumonia normally would obscure the left heart border because the lingula lies immediately adjacent to the lower heart. An upper lobe pneumonia would obscure the border of the upper left mediastinum, to which it is adjacent.
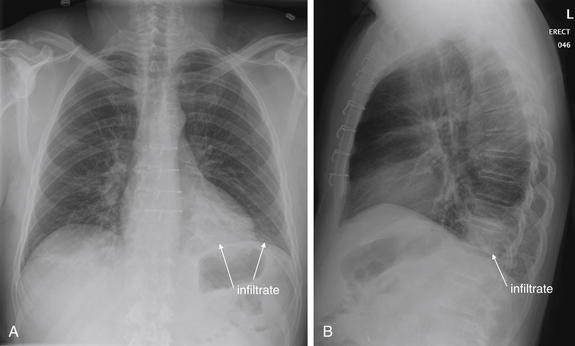
Figure 5-57 Pneumonia: Left lower lobe infiltrate with retrocardiac location.
A, Posterior-anterior (PA) upright chest x-ray. B, Lateral upright chest x-ray. This 53-year-old male with a history of heart transplant presented with 1 week of fever, productive cough, dyspnea, and left-sided chest pain. He was febrile in the emergency department. A, His posterior–anterior (PA) chest x-ray appears fairly normal at first glance. Look at the lateral x-ray (B), however. A dense infiltrate overlies the thoracic spine in the retrocardiac space, interrupting the normal progressive lucency of the spine approaching the diaphragm. Looking back at the PA chest image, the heart appears quite dense in this location, and faint increased density is seen above the left diaphragm. This is a left lower lobe pneumonia.
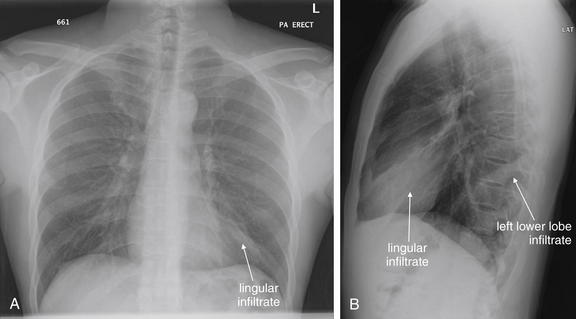
Figure 5-58 Pneumonia: Lingula and left lower lobe.
A, Posterior-anterior (PA) upright chest x-ray. B, Lateral upright chest x-ray. This 27-year-old male presented with chills, nausea, and anterior inferior left chest pain. His chest x-ray shows a lingular and left lower lobe pneumonia. Remember that the lingula lies anterior and abuts the left heart border—an infiltrate is seen in this location on both the posterior–anterior (PA) (A) and lateral (B) views. Note how the left heart border is indistinct because of the infiltrate on the PA view. On the lateral view, the lingular infiltrate has the appearance of a dense wedge with discrete borders. Also on the lateral view, a second area of increased density is seen, indicating a left lower lobe infiltrate. It overlies the spine, again interrupting the normal increased lucency as the spine approaches the diaphragm. The importance of the lateral x-ray for diagnosing pneumonia cannot be overemphasized. Figure 5-59 shows the same patient 5 days later.
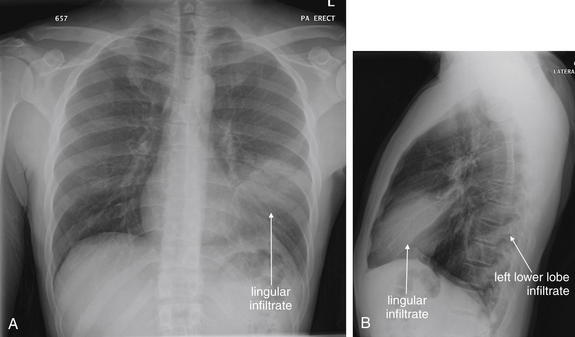
Figure 5-59 Pneumonia: Lingula and left lower lobe.
A, Posterior-anterior (PA) upright chest x-ray. B, Lateral upright chest x-ray. Same patient as Figure 5-58, now 5 days later. The patient returned with worsened symptoms. A, Note how the lingular infiltrate has now significantly hidden the left heart border. B, The retrocardiac left lower lobe infiltrate persists.
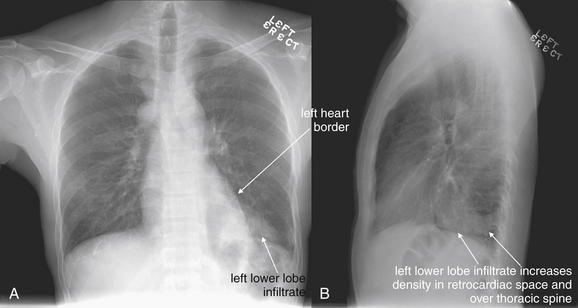
Figure 5-60 Pneumonia: Left lower lobe.
This 35-year-old male with a history of renal transplantation presented with dyspnea, fever, and chest pain. His posterior–anterior (PA) upright chest x-ray (A) shows a left lower lobe density, also seen as a retrocardiac density on the lateral x-ray (B). Note on the PA view how the left heart border can still be seen, as the infiltrate does not directly abut that border but rather lies posterior to it. Remember that the retrocardiac space is usually quite black, and the thoracic spine should be progressive more lucent (black) as it approaches the diaphragm on lateral chest x-ray. Both of these rules are violated in this case because of the left lower lobe infiltrate. Always inspect the lateral x-ray for these features. Also compare this lateral x-ray to the lateral x-ray in Figure 5-59, which showed a density in the lingula. The immediate retrocardiac space in that x-ray was clear.
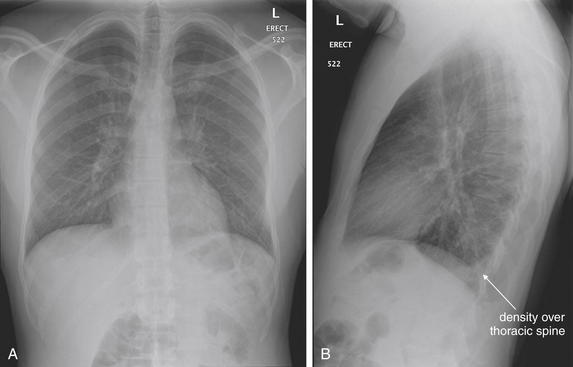
Figure 5-61 Pneumonia, visible on lateral x-ray.
This 27-year-old male presented with 2 days of myalgias, fever, and productive cough. Look first at the posterior–anterior chest x-ray (A). Do you see an infiltrate? The right and left heart borders and diaphragms are clear. The lung fields do not show an infiltrate. Now look at the lateral x-ray (B). An abnormal density overlies the inferior thoracic spine, interrupting the normal progressive darkening as the spine approaches the diaphragm. This is the only sign of pneumonia. Always inspect the lateral chest x-ray for the spine sign.
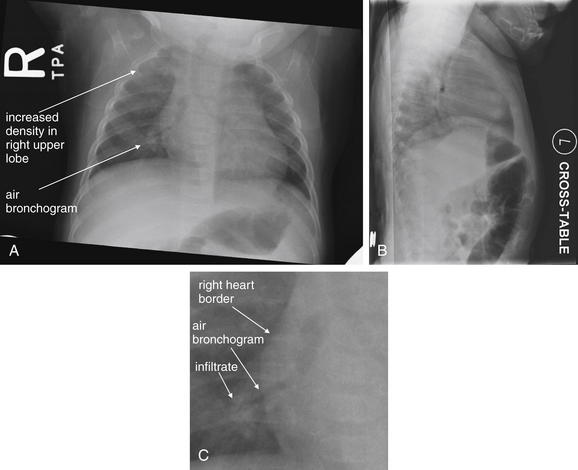
Figure 5-62 Pneumonia: Pediatric.
A, Posterior-anterior (PA) chest x-ray. B, Cross-table lateral chest x-ray. C, close-up from A. This 5-month-old was born at 27 weeks of gestation and presented with cough. A, The posterior–anterior chest x-ray shows increased density in the right upper lobe, consistent with pneumonia. In addition, an air bronchogram is visible along the right heart border (see C, close-up from A).
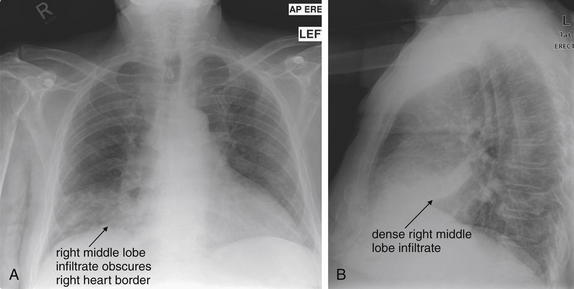
Figure 5-63 Pneumonia: Right middle lobe.
A, Anterior-posterior (AP) chest x-ray. B, Lateral chest x-ray. This 73-year-old male presented with cough with yellow sputum, fever 39.3°C, tachycardia, and oxygen saturation of 93% on room air. His chest x-ray shows a classic right middle lobe pneumonia. A, This opacity obscures the right heart border, which lies immediately adjacent. B, On the lateral x-ray, this appears as a more circumscribed density overlying the heart.
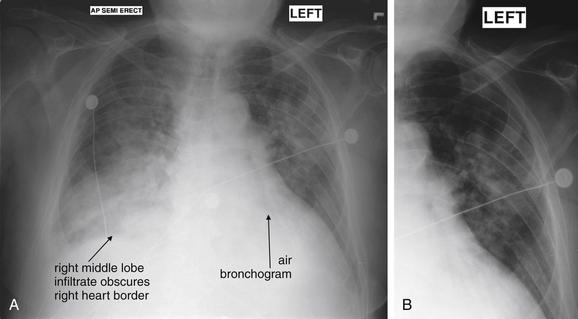
Figure 5-64 Pneumonia: Right middle lobe and left upper lobe.
A, Anterior-posterior (AP) chest x-ray. B, Close-up from A. Same patient as Figure 5-63, where his initial chest x-ray showed a classic right middle lobe pneumonia. This x-ray was obtained one week later, with a progressive density appearing to involve the entire right middle lobe. A, The right heart border remains obscured, and the right diaphragm is also partially hidden, which may indicate right lower lobe involvement or an associated pleural effusion. Increased density is also seen in the bilateral upper lungs. B, An air bronchogram is faintly visible behind the left heart.
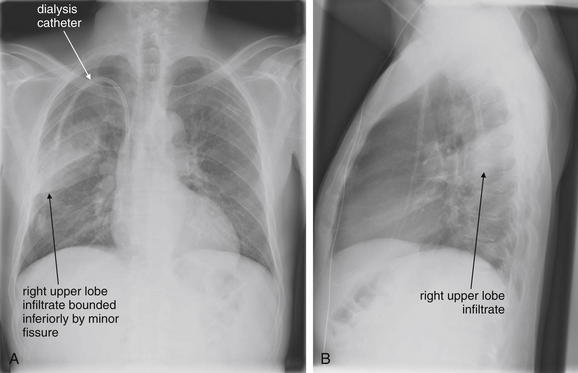
Figure 5-65 Pneumonia: Right upper lobe.
A, Posterior-anterior (PA) chest x-ray. B, Lateral chest x-ray. This 46-year-old male with human immunodeficiency virus and end-stage renal disease presented with fever to 39.1°C, cough, and right chest pain. A, His PA chest x-ray shows a dense infiltrate in the right upper lobe, bounded inferiorly by the minor fissure. B, On the lateral x-ray, this appears bounded superiorly as well—this boundary identifies this as a right posterior segment upper lobe infiltrate, though this level of anatomic localization is not necessary to the emergency physician. A, The curved density in the right chest is the patient’s dialysis catheter.
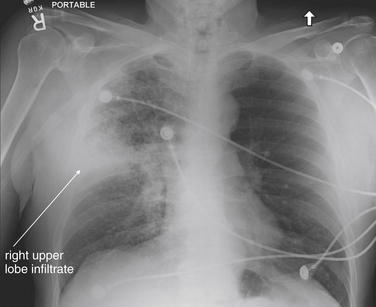
Figure 5-66 Pneumonia: Right upper lobe.
This 71-year-old male with a history of prostate cancer presented with dyspnea, hemoptysis, and right-sided chest pain. His chest x-ray shows a wedge-shaped right upper lobe infiltrate, consistent with pneumonia. The patient grew Haemophilus influenza from blood cultures. This radiographic appearance can also be seen with pulmonary infarction from pulmonary embolism. Computed tomography was performed because of the patient’s history of cancer and hemoptysis but was negative for pulmonary embolism.
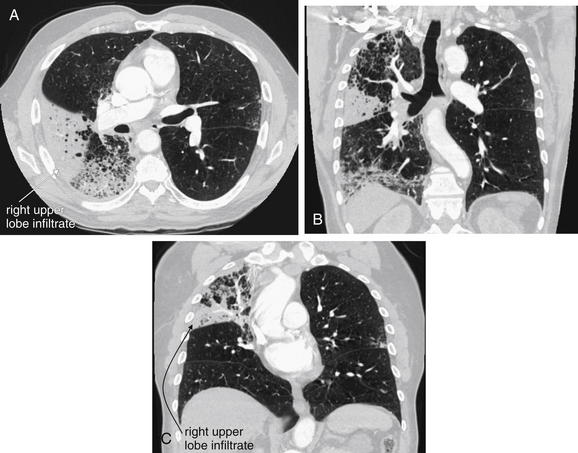
Figure 5-67 Pneumonia: Right upper lobe on computed tomography (CT) with IV contrast.
Same patient as Figure 5-66. CT images show the extent of parenchymal opacification. Lung windows are shown; the soft-tissue windows were negative for pulmonary embolism. A, Axial CT lung window image. B and C, Coronal CT lung window images.
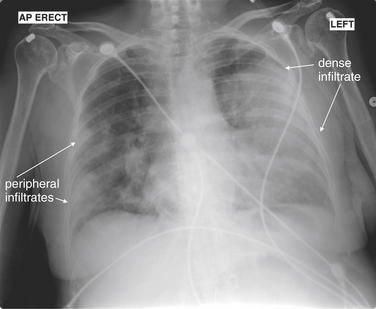
Figure 5-68 Pneumonia: Bilateral (Streptococcus pneumoniae).
This 58-year-old female with a history of multiple myeloma presented with back pain and dyspnea, as well as a temperature of 38.5°C and tachycardia to 150 beats per minute. Her chest x-ray shows bilateral infiltrates, including nearly complete opacification of the left chest with an obscured left heart border. Pulmonary embolism was suspected, as the patient had just returned from a long flight, but renal insufficiency allowed only noncontrast computed tomography (Figure 5-69), which cannot rule out thromboembolic disease. Her urine antigen test was positive for S. pneumoniae, which also grew from blood cultures. The patient died of septic shock.
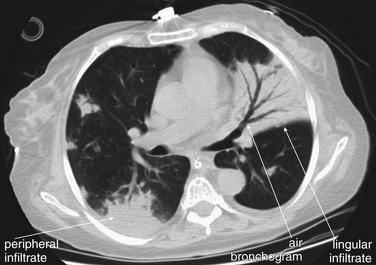
Figure 5-69 Pneumonia: Bilateral (Streptococcus pneumoniae) on computed tomography (CT) lung windows.
Same patient as Figure 5-68. On lung windows, dense infiltrates are seen in the right posterior lung and lingula. Note how, even on CT, a lingular infiltrate hides the left heart border. A clear air bronchogram with a treelike form is seen because of adjacent alveoli filled with fluid. See how the lingular infiltrate is tightly circumscribed along its posterior border by a pleural boundary.
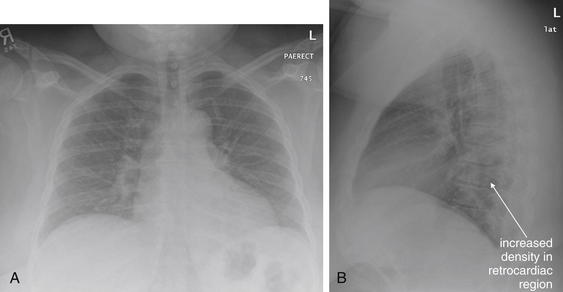
Figure 5-70 Pneumonia: Left lower lobe.
A, Posterior-anterior (PA) chest x-ray. B, Lateral chest x-ray. This 41-year-old female presented with productive cough, dyspnea, subjective fever, and chills for 2 days. A, Her posterior–anterior chest x-ray appears essentially normal, although breast tissue overlies the lower lung fields, increasing their density. The heart and diaphragm borders are clear. B, On the lateral x-ray, increased density is seen in the retrocardiac region, consistent with left lower lobe pneumonia. The lateral chest x-ray may hold the only clues to diagnosis in some cases. Obtain a lateral x-ray when possible, and always inspect it carefully. The thoracic spine should become progressively more lucent as it approaches the diagram. Absence of this normal finding should suggest an infiltrate.
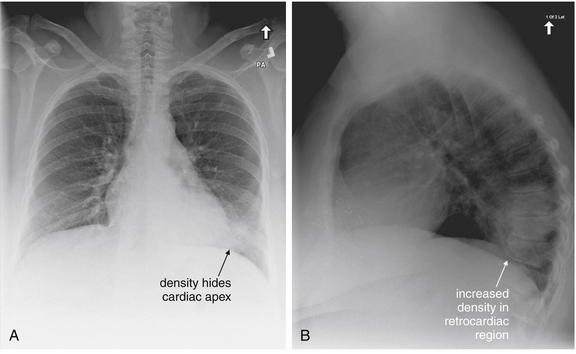
Figure 5-71 Pneumonia: Left lower lobe infiltrate (Streptococcus pneumoniae).
A, Posterior-anterior (PA) chest x-ray. B, Lateral chest x-ray. This 51-year-old female with a history of chronic obstructive pulmonary disease presented with 2 days of cough with yellow sputum, fever (38.0°C), and chills. Her chest x-ray shows a density in the left lower lung. A, On posterior–anterior chest x-ray, all but the most inferior heart border (apex) is visible, with clear diaphragms. B, The lateral chest x-ray unequivocally shows a density in the retrocardiac space overlying the thoracic spine. The thoracic spine should become progressively more lucent as it approaches the diagram. Absence of this normal finding should suggest an infiltrate. The patient tested positive for S. pneumoniae by urine antigen and blood cultures.
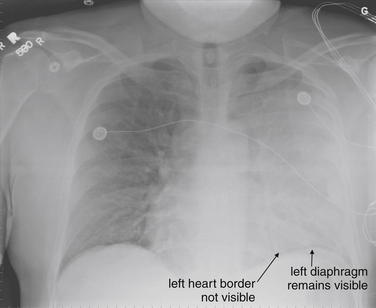
Figure 5-72 Pneumonia: Left upper lobe.
This 41-year-old male with a history of hypertension and asthma failed outpatient pneumonia therapy. He presented with 6 days of fever, chills, and dyspnea with a rising white blood cell count to 31,000 per cubic millimeter despite oral azithromycin. His left chest appears almost completely opacified. The left heart border cannot be seen, although the left diaphragm is still faintly visible. A dense infiltrate or possible pleural effusion was considered. In the upright position, a pleural effusion would be expected to hide the diaphragm, as pleural fluid shares the same density with the diaphragm. Additional imaging was performed to evaluate further (Figures 5-73 and 5-74).
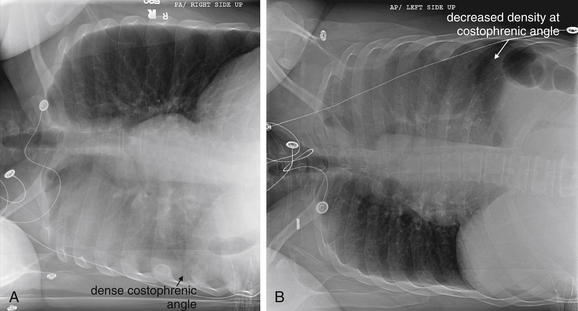
Figure 5-73 Pneumonia: Left upper lobe.
Same patient as in Figure 5-72. A, Left lateral decubitus x-ray. B, Right lateral decubitus x-ray. Decubitus views were obtained in an attempt to identify an effusion if present. No significant change is seen in the density of the left lung with these positional changes. The left costophrenic angle appears slightly more lucent when the left chest is positioned higher, suggesting that a small effusion may have contributed to its density when the left chest is down. Computed tomography was performed to further evaluate this (Figure 5-74).
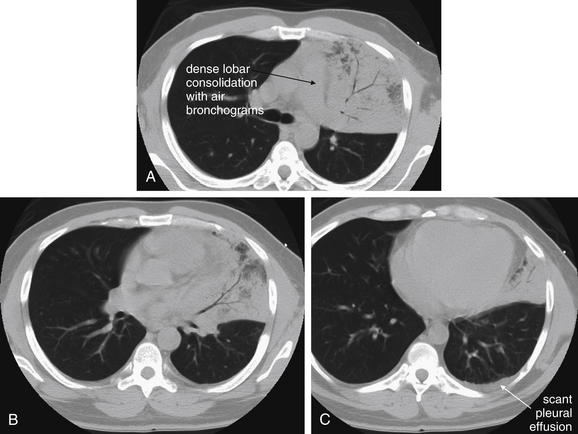
Figure 5-74 Pneumonia: Left upper lobe on computed tomography (CT) lung windows.
CT demonstrated dense consolidation of the left upper lobe and lingula with air bronchograms. Only trace pleural fluid was seen. A, An axial slice at the level of the superior mediastinum. B, A slice through the middle of the heart. C, A slice through the lower heart.
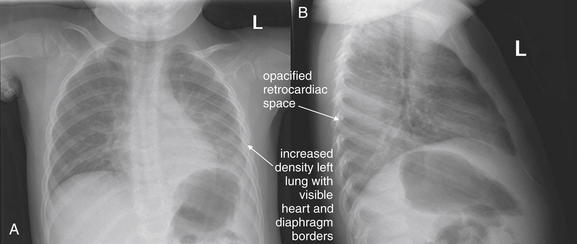
Figure 5-75 Pneumonia: Left lower lobe infiltrate.
A, Posterior-anterior (PA) chest x-ray. B, Lateral chest x-ray. This previously healthy 2-year-old presented with increased work of breathing. A, His chest x-ray shows increased density in the left chest, although the diaphragm and left heart border remain visible on the posterior–anterior x-ray. This suggests a left lower lobe pneumonia. This is confirmed by the lateral x-ray (B), which shows dense opacification in the entire retrocardiac space. The thoracic spine is completely hidden by this opacity.
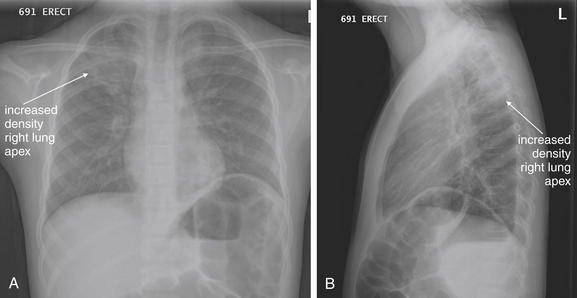
Figure 5-76 Pneumonia: Pediatric, right upper lobe.
This 9-year-old female presented with fever to 39.0°C and 4 days of cough with tachypnea. Her posterior–anterior chest x-ray (A) shows increased density in the right upper lobe, more impressive on the lateral view (B).
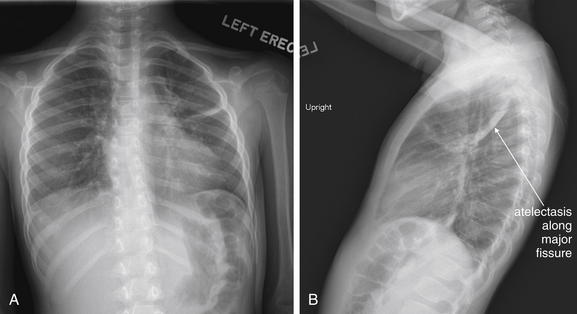
Figure 5-77 Pneumonia: Pediatric, bilateral versus asthma.
A, Posterior-anterior (PA) chest x-ray. B, Lateral chest x-ray. This 6-year-old female with a history of asthma had been admitted recently for an asthma exacerbation and returned with hypoxia to 80% on room air. B, Her lateral chest x-ray shows an area of increased density along the major fissure, interpreted by the radiologist as atelectasis. She has other streaky opacities on posterior–anterior x-ray (A). She improved with albuterol and steroids and was not treated with antibiotics, so presumably this was not a case of bacterial pneumonia.
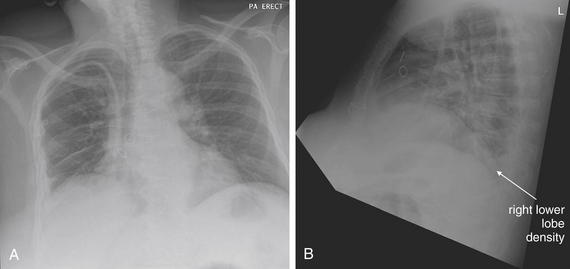
Figure 5-78 Pneumonia: Right lower lobe.
A, Posterior-anterior (PA) chest x-ray. B, Lateral chest x-ray. This 66-year-old female with end-stage renal disease presented with fever and right upper abdominal pain. Her chest x-ray shows a right lower lobe opacity, best seen on the lateral x-ray as a density in the retrocardiac space. Is this real? A CT scan (Figure 5-79) confirmed the finding. Does it represent pneumonia or atelectasis? We lack an independent gold standard. The patient’s blood cultures grew Staphylococcus aureus, and she improved with antibiotic therapy.
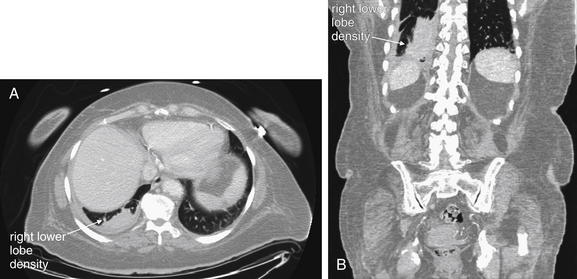
Figure 5-79 Pneumonia: Right lower lobe on CT lung windows.
Same patient as Figure 5-78. CT was performed because of concern for abscess, as the patient had abdominal pain and an indwelling dialysis catheter that could be a source for bacteremia. On lung windows, an area of increased density is visible in the right lower lobe, corresponding to the area of increased density on her lateral chest x-ray (Figure 5-78). This is likely pneumonia—the patient’s blood cultures grew Staphylococcus aureus. A, Axial view. B, Coronal view.
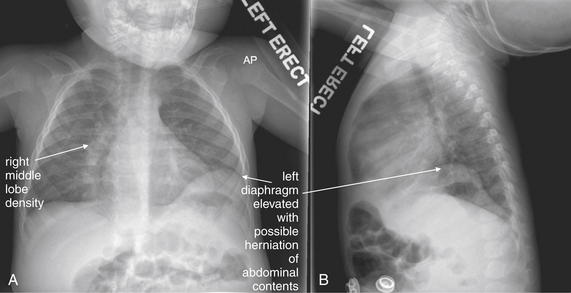
Figure 5-80 Pneumonia: Pediatric, right middle lobe.
A, Anterior-posterior (AP) chest x-ray. B, Lateral chest x-ray. This 12-month-old was born at 31 weeks and presented with cough, tachypnea, and hypoxia to 85% when sleeping. The chest x-ray shows an irregular right heart border, likely indicating an infiltrate in this region. A, On frontal projection, the right middle lobe abuts the heart, and an infiltrate in this location obscures the right heart border. Incidentally, the left diaphragm appears elevated, with the possibility of herniated abdominal contents. This is also seen on the lateral view (B).
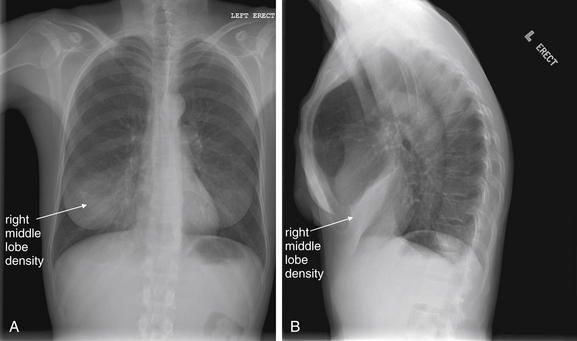
Figure 5-81 Pneumonia: Right middle lobe.
This 39-year-old presented with right-sided chest pain, fever, chills, and a productive cough. A, Her posterior–anterior chest x-ray shows a right middle lobe opacity, even more impressive on the lateral view (B) as a dense, wedge-shaped opacity overlying the heart. This is a right middle lobe pneumonia. Notice how on the PA view this might be mistaken for a breast shadow, but the lateral view confirms the abnormality.
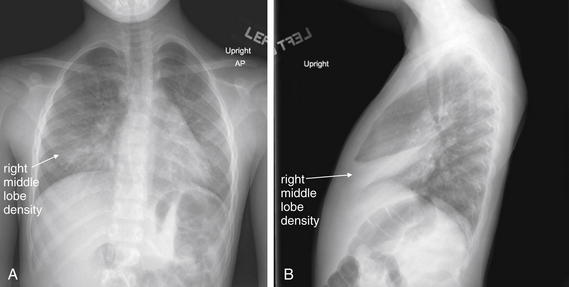
Figure 5-82 Pneumonia: Pediatric, right middle lobe.
This 4-year-old female presented with 3 days of cough and upper abdominal pain. She was febrile and tachypneic in the emergency department. Her chest x-ray shows bilateral densities. A, On the anterior–posterior view, the right heart border is obscured by a right middle lobe opacity, and air bronchograms are visible just right of the thoracic spine. B, On the lateral view, the right middle lobe infiltrate is evident as a wedge-shaped density overlying the heart.
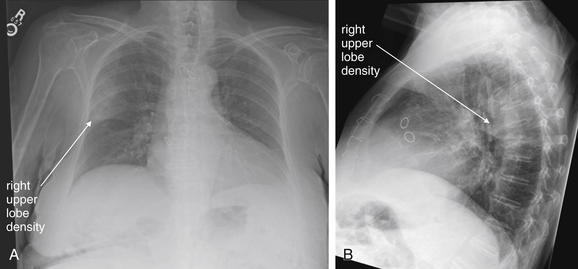
Figure 5-83 Pneumonia: Right upper lobe.
This 87-year-old female presented for placement of a peripherally inserted central catheter (PICC) for treatment of a resistant Escherichia coli urinary tract infection. The patient had dementia and denied any complaints. Her chest x-ray, performed to assess the position of the PICC, showed a right upper lobe opacity, bounded inferiorly by the minor fissure. This is visible on both the frontal projection (A) and the lateral (B) x-rays.
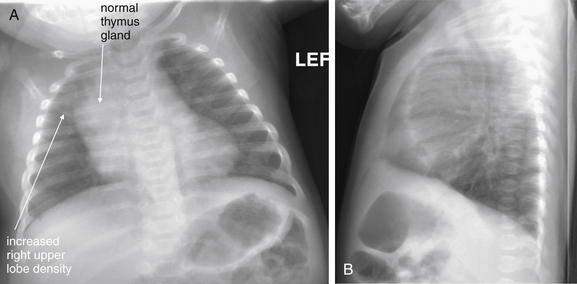
Figure 5-84 Pneumonia: Pediatric, right upper lobe.
A, Frontal projection chest x-ray. B, Lateral chest x-ray. This 5-month-old female was born at 23 weeks. She presented with respiratory distress and hypoxia to 84% on room air. Her x-ray shows increased density in the right lung apex. Conservatively, this was interpreted and treated as pneumonia. The interpretation is made more complex by the normal broad mediastinum of young infants, which is due to the residual thymus. The increased density in the upper lobe may indicate upper lobe collapse as well. Note the increased upper chest density on the lateral x-ray.
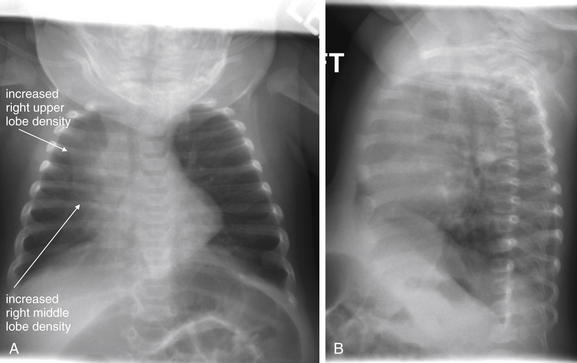
Figure 5-85 Pneumonia: Pediatric, right upper lobe.
A, Frontal projection chest x-ray. B, Lateral chest x-ray. Same patient as Figure 5-84. Follow-up x-rays the next day showed increased density along the right heart border, suggesting progression of pneumonia. Note the increased upper chest density on the lateral x-ray as well. On the lateral view, the retrosternal space appears dense because of the presence of the normal thymus.
A second common pattern of pneumonia is an interstitial pattern, often seen with “atypical” pathogens such as Bordetella pertussis (Figure 5-86), Chlamydia pneumonia, and Mycoplasma. In this circumstance, fluid becomes evident in the interstitial connective tissues of the lung, rather than within alveoli. Air bronchograms should not be seen as a result of an interstitial pneumonia. Peribronchial cuffing may be seen. Peribronchial cuffing (Figure 5-87) is a thickened appearance of bronchioles when viewed end-on on chest x-ray. Normal bronchioles are not visible when oriented in the plane of the x-ray but are visible as small black circles (air within the bronchiole) surrounded by a thin white line (the bronchial wall) when they are oriented perpendicular to the plane of the chest x-ray. With the development of interstitial edema, this thin white line thickens and is then called peribronchial cuffing. Peribronchial cuffing is not specific to bacterial infection and is seen in other disease states, including pulmonary edema, asthma, pneumocystis pneumonia (PCP), viral pneumonitis, and bronchiolitis such as that from respiratory syncitial virus. Other findings of interstitial pneumonia can include fluid in the minor and major fissures.
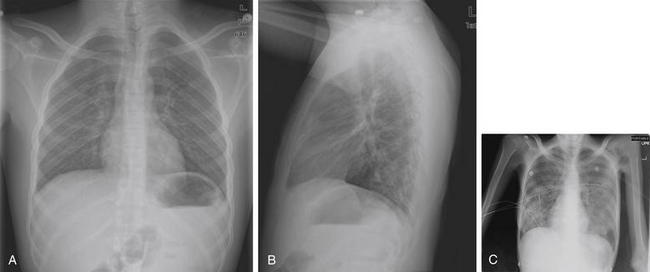
Figure 5-86 Pertussis and PCP.
Both pertussis and PCP can present with a predominantly interstitial pattern of pneumonia with peribronchial cuffing. A and B, PA and lateral chest x-rays in a patient with pertussis. This 19-year-old male with sickle cell trait and short gut syndrome presented with cough and emesis. He had been seen multiple times in the emergency department over the past 3 weeks for moderately productive cough, diagnosed with bronchitis, and treated with azithromycin. His current presentation included 5 days of post-tussive emesis. His chest x-ray showed peribronchial cuffing and prominent interstitial markings but otherwise was near normal. His polymerase chain reaction test and cultures were positive for Bordetella pertussis, which does not typically cause a focal infiltrate on chest x-ray. Perhaps the most important point is to consider pertussis even with normal imaging findings when the clinical history is suggestive. Peribronchial cuffing is discussed in more detail in Figure 5-87. C, This 30 year old male with advanced AIDS presented with nonproductive cough and hypoxia. His chest x-ray shows a bilateral mixed alveolar and intertitial infiltrate pattern classic for PCP. Unfortunately, even a normal chest x-ray cannot exclude PCP.
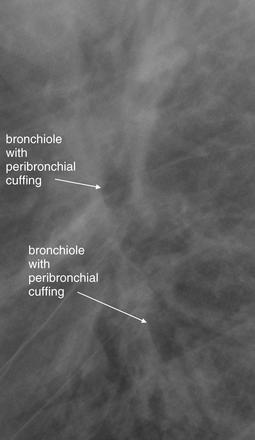
Figure 5-87 Pertussis and peribronchial cuffing.
Close-up from Figure 5-86, B. What is peribronchial cuffing? Peribronchial cuffing is edema of bronchioles, resulting from diverse causes including asthma, viral illnesses, heart failure, and pertussis. The bronchial wall becomes thickened and denser from edema fluid. Like an air bronchogram, this creates contrast with the air-filled bronchiole lumen, making it more visible. Normally, bronchioles are visible only when they are oriented perpendicular to the image plane. They are thin-walled and appear as discrete circles in short-axis cross section. When edema is present, the bronchiolar wall is thickened in cross section, and bronchioles may be seen in other orientations, such as long-axis cross section, because of their increased density. Look at the close-up of the hilum, taken from the lateral x-ray in the prior figure. You will see one bronchiole in short-axis cross section and several others in long-axis cross section. The density surrounding the air-filled lumen is the edematous bronchial wall.
Pneumonia Differential Diagnosis
It is essential to remember that a differential diagnosis exists for increased lung parenchymal density (see Box 5-2). Any process that results in fluid and solid material accumulating within alveoli can have this x-ray appearance. This includes not only infectious pneumonitis (pneumonia) but also physical aspiration of noninfectious material (Figures 5-88 through 5-90), pulmonary hemorrhage, pulmonary infarction in the setting of pulmonary embolism (see Chapter 7) or sickle cell anemia acute chest syndrome (Figure 5-91), atelectasis, mucous plugging with segmental collapse, mass lesion, and pulmonary edema. A pleural effusion can resemble parenchymal opacity, with some differences as outlined in earlier sections. When a parenchymal opacity is seen, the emergency physician must resist the temptation to conclude that “the chest x-ray shows pneumonia.” Instead, the physician must determine that “the chest x-ray shows increased parenchymal opacity.” This finding should be considered with other clinical data to reach the correct diagnosis. In the words of a radiologist, clinical correlation is required.
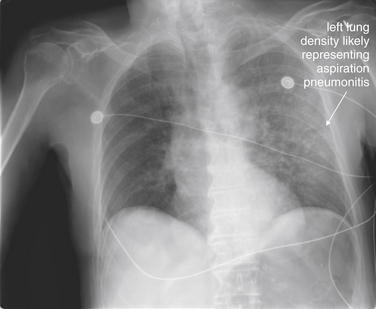
Figure 5-88 Aspiration pneumonitis: Reuben sandwich.
This elderly male patient was eating a Reuben sandwich when he had sudden respiratory distress. Friends attempted cardiopulmonary resuscitation and the Heimlich maneuver and called 911. On emergency department arrival, the patient was in extremis. A Magill forceps was used to withdraw a large piece of roast beef from the patient’s airway, with immediate improvement in the patient’s cyanosis and mental status. However, the patient remained hypoxic. His chest x-ray shows an infiltrate, which is undoubtedly aspirated material, not an infectious process this soon after his event. Does aspiration have a unique appearance on chest x-ray? No, as we have discussed throughout this chapter, the appearance of tissues on x-ray is a function of density. Aspirated food material usually has soft-tissue density (fluid or water density), and the inflammatory response results in fluid and white blood cells moving into affected alveolar air spaces. The appearance ultimately is no different from that of a bacterial infection of the same lung segment. Classically, gravity leads aspiration to affect the right lower lobe when it occurs in the upright position and the posterior segments of upper lobes and superior segments of lower lobes if the patient is supine. Aspiration in the prone position involves the right upper lobe—a classic feature in patients with severe alcohol intoxication. In reality, any lobe can be affected.
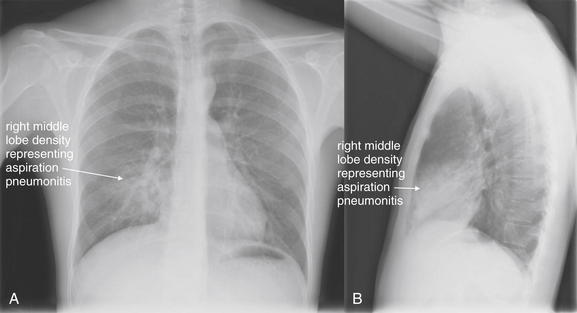
Figure 5-89 Aspiration: Gasoline.
A, Posterior-anterior (PA) chest x-ray. B, Lateral chest x-ray. This 23-year-old male was siphoning gasoline by mouth when he swallowed a mouthful of gasoline with some inhalation. He coughed for approximately 1 minute afterward and presented with right-sided chest pain. His chest x-ray shows a right middle lobe opacity that obscures the right heart border on the posterior–anterior view (A). On the lateral x-ray (B), some increased density overlies the heart. Figure 5-90 shows progression on chest x-ray 24 hours later.
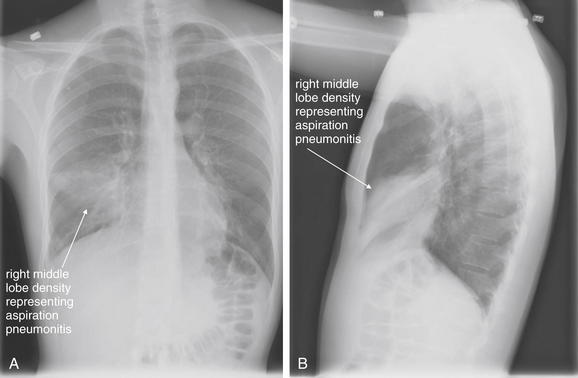
Figure 5-90 Aspiration: Gasoline.
Same patient as Figure 5-89. In a chest x-ray obtained 24 hours after presentation, his right middle lobe infiltrate has progressed. A, Posterior-anterior (PA) chest x-ray. B, Lateral chest x-ray.
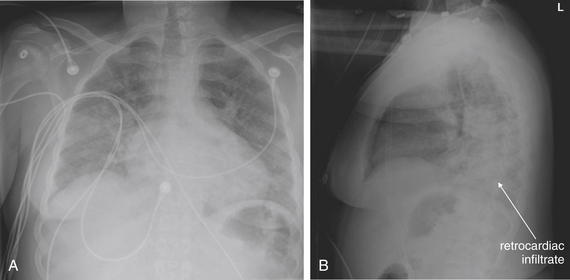
Figure 5-91 Acute chest syndrome: Sickle cell anemia.
Acute chest syndrome of sickle cell anemia does not have a single pathognomonic appearance on chest x-ray. The condition is caused by microvascular sludging of sickled red blood cells, resulting in infarction of the lung from small vessel occlusion. In the face of parenchymal necrosis, fluid accumulates within alveoli, increasing the density of lung tissue from air density to soft-tissue density (fluid density). The radiographic appearance is indistinguishable from that of other pneumonias. Because the infarction occurs in small vessels, the distribution of infarction is not in the territory of a large vessel as might be seen with pulmonary embolism, where infarction of an entire lung segment distal to the point of thrombotic occlusion may be seen. Thus the distribution of lung infiltrates in acute chest syndrome may be patchy or may follow a lobar distribution. Because alveoli fill with fluid, air bronchograms may be seen, as in bacterial pneumonia. Making the diagnosis even more indistinct, patients with sickle cell anemia may have bacterial pneumonia with negative blood and sputum cultures, so a pulmonary infection may be wrongly labeled as acute chest syndrome. With these caveats, this x-ray is from a 24-year-old male with sickle cell anemia disease, presenting with fever and an oxygen saturation of 60% on room air. He improved with oxygen, fluids, and antibiotic administration, although antigen testing for Streptococcus pneumoniae, Legionella, and influenza were negative, as were cultures. A, The posterior-anterior (PA) chest x-ray demonstrates patchy bilateral infiltrates. The right lower lobe shows particular density, and increased density is seen in the retrocardiac space on the lateral x-ray (B)—note the absence of the usual decrease in density toward the diaphragm (see text introduction to chest x-ray and text section on the spine sign).
Cavitary Lesions
Some pulmonary infections characteristically produce cavitary lesions on chest x-ray. These include tuberculosis and lung abscesses from pathogens such as Staphylococcus aureus or aspirated anaerobes. Necrotic neoplastic lung masses may cavitate. Bullae resulting from emphysema can become secondarily infected, sometimes with fungal pathogens. A typical cavitary lesion may have an air–fluid level on an upright chest x-ray. This may not be visible on a supine image, as fluid within the cavity layers in the same plane as the x-ray detector. As with other chest x-ray findings, a differential diagnosis should be considered based on appearance and other clinical data. Figures 5-92 through 5-101 show cavitary lesions worrisome for tuberculosis or abscess.
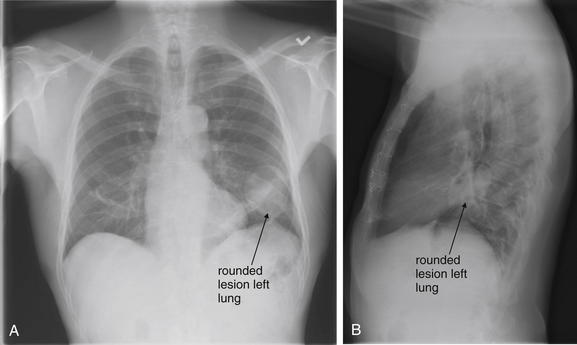
Figure 5-92 Possible tuberculosis or cavitary lesion.
A, Posterior-anterior (PA) chest x-ray. B, Lateral chest x-ray. This 72-year-old male with a history of heart transplant presented with cough and 30-pound weight loss. His chest x-ray shows a rounded lesion in his left lung on posterior–anterior view (A). On the lateral view (B), this appears as increased density near the hilum. Given his immunosuppressed status, the differential diagnosis included tuberculosis, lung abscess, neoplasm, and fungal infection. He was readmitted for video-assisted thorascopic surgery and left upper lobe wedge resection. Pathology revealed only an organizing hematoma. Compare this x-ray with his CT in Figure 5-93.
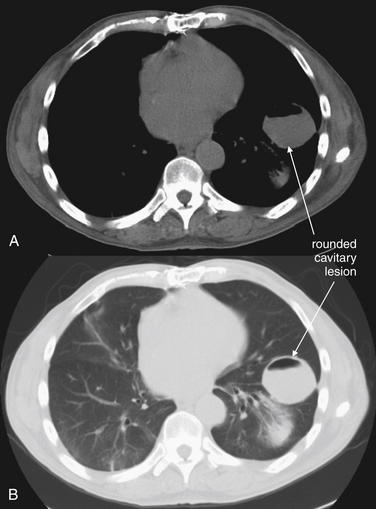
Figure 5-93 Tuberculosis or cavitary lesion.
Chest CT without IV contrast from the same patient as Figure 5-92. Soft-tissue (A) and lung (B) windows show a well-circumscribed rounded lesion 4 cm in diameter with an air–fluid level. Given his immunosuppressed status, the differential diagnosis included tuberculosis, lung abscess, neoplasm, and fungal infection. He was readmitted for video-assisted thorascopic surgery and left upper lobe wedge resection. Pathology revealed only an organizing hematoma.
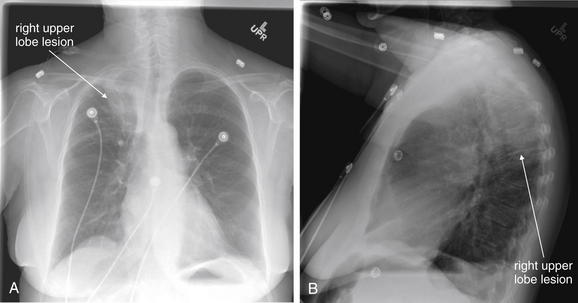
Figure 5-94 Tuberculosis or cavitary lesion.
A, Posterior-anterior (PA) chest x-ray. B, Lateral chest x-ray. This 63-year-old female presented with weakness and hypotension. Her chest x-ray shows a right upper lobe infiltrate or mass—suspicious for malignancy or tuberculosis. The patient underwent bronchoscopy, but initial acid-fast bacilli (AFB) cultures and cytology were negative. She refused further workup and was lost to follow-up.
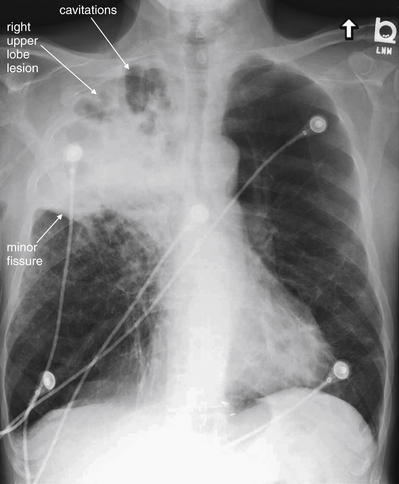
Figure 5-95 Tuberculosis or cavitary lesion.
This 70-year-old male with chronic obstructive pulmonary disease presented with increasing dyspnea and cough with sputum production. He had a history of incarceration 15 years prior. His chest x-ray shows a dense right upper lobe infiltrate with areas of cavitation, concerning for abscess, tuberculosis, or malignancy. Note how the lesion stops sharply at the minor fissure inferiorly. Computed tomography was performed (Figure 5-96). The patient’s purified protein derivative test and acid-fast bacilli (AFB) cultures were negative.
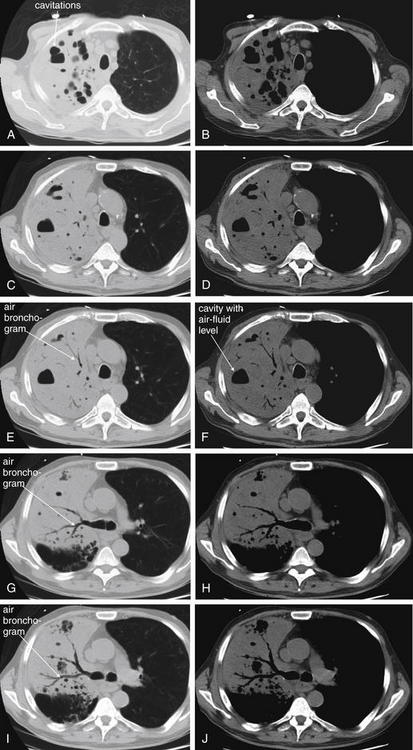
Figure 5-96 Tuberculosis or cavitary lesion.
Same patient as Figure 5-95. Chest CT without IV contrast shows dense consolidation of the right upper lobe, with air bronchograms and multiple cavitary regions with air–fluid levels. These may represent infected bullae, areas of necrotizing pneumonia and abscess formation, or tuberculous cavitation. CT cannot discriminate among these causes. Left column (A, C, E, G, I), axial slices viewed on lung windows, progressing from cephalad to caudad. Right column (B, D, F, H, J), axial slices at the same anatomic levels as A, C, E, G, and I viewed on soft tissue windows.
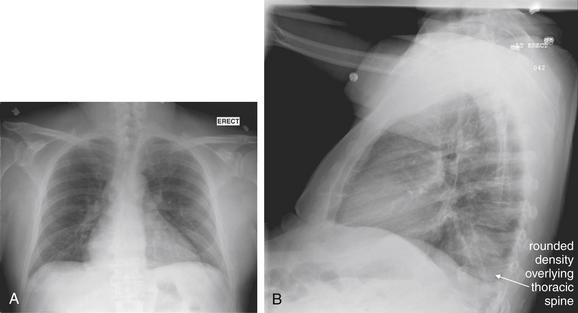
A, Posterior-anterior (PA) chest x-ray. B, Lateral chest x-ray. This 58-year-old male complained of 2 weeks of abdominal pain and fever. He noted pleuritic back pain with deep inspiration. A, His posterior–anterior chest x-ray appears normal, and once again the lateral x-ray provides important information. B, On the lateral view, a rounded density overlies the lower thoracic spine. The patient also grew methicillin sensitive Staphylococcus aureus from blood cultures, and chest computed tomography was performed to further evaluate the lesion (Figure 5-98).
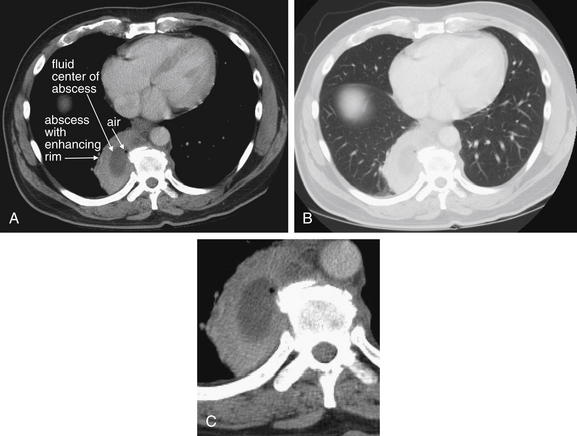
Same patient as Figure 5-97. Chest CT with intravenous contrast shows a lung abscess located immediately right of the thoracic spine. The thick rim enhances with contrast, giving it a brighter white appearance. The center of the abscess contains fluid density (dark gray) with a tiny focus of air. This abscess corresponds to the retrocardiac density seen on the patient’s chest x-ray. No air–fluid level was seen on chest x-ray because the abscess contains only small gas bubbles. A, Axial slice viewed on soft-tissue windows. B, The same slice viewed on lung windows. C, Close-up from A.
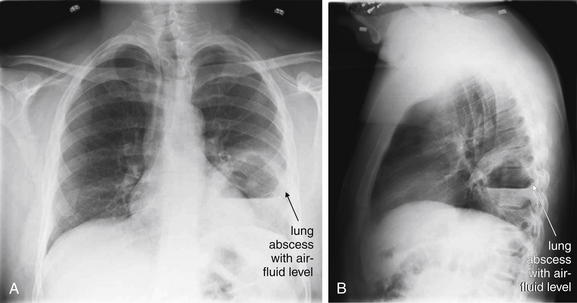
A, Posterior-anterior (PA) upright chest x-ray. B, Lateral upright chest x-ray. This 39-year-old patient presented with cough, fever, and left-sided chest pain for the past 3 days, despite 5 days of antibiotic therapy for pneumonia. He admitted to daily alcohol use. His chest x-ray shows a definite left lung cavitary lesion with an air–fluid level, consistent with lung abscess. He underwent computed tomography (Figure 5-100) to further characterize this lesion. The patient was found to be human immunodeficiency virus positive with a CD4 count of 800. Two weeks after this presentation, the abscess began to drain spontaneously, with the patient coughing up grossly purulent material. Testing for tuberculosis was negative.
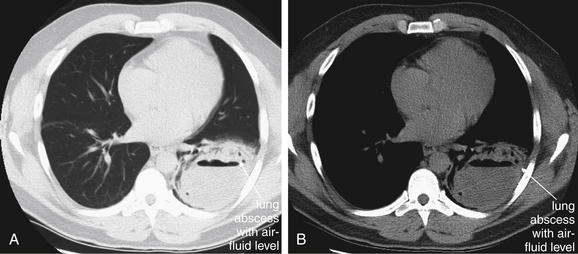
Same patient as Figure 5-99. Chest CT without IV contrast. A, Lung windows. B, Same slice viewed on soft-tissue windows. This 9-cm left lung abscess has a thick rind and an air–fluid level. The patient was treated with antibiotics and 2 weeks later began to cough up grossly purulent sputum. Repeat CT showed a decreased air–fluid level suggesting spontaneous drainage of the abscess (Figure 5-101).
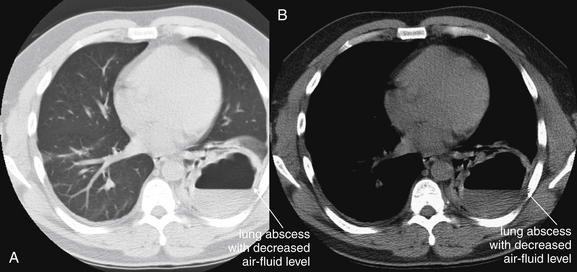
Same patient as Figures 5-99 and 5-100. Chest CT without IV contrast. A, Lung windows, B, Soft-tissue windows. This chest CT was performed after 2 weeks of antibiotic therapy and showed a decreased air–fluid level suggesting spontaneous drainage of the abscess (compare with prior figure).
Embolic Pneumonia
In the case of endocarditis, septic emboli may be distributed throughout the lungs. The typical appearance is of numerous or innumerable nodules, often bilaterally distributed (Figures 5-102 and 5-103). The chest x-ray appearance is indistinguishable from metastatic disease.
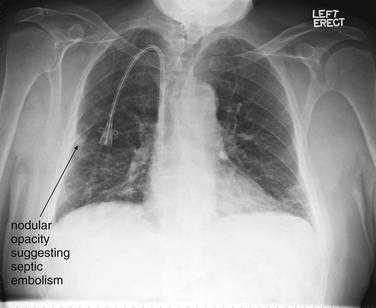
This 72-year-old male with end-stage renal disease requiring hemodialysis presented with fever and 3 days of right axillary chest pain. A rounded nodular opacity is seen near the periphery of the right lung. Endocarditis with septic emboli was suspected, and chest computed tomography was performed (Figure 5-103).
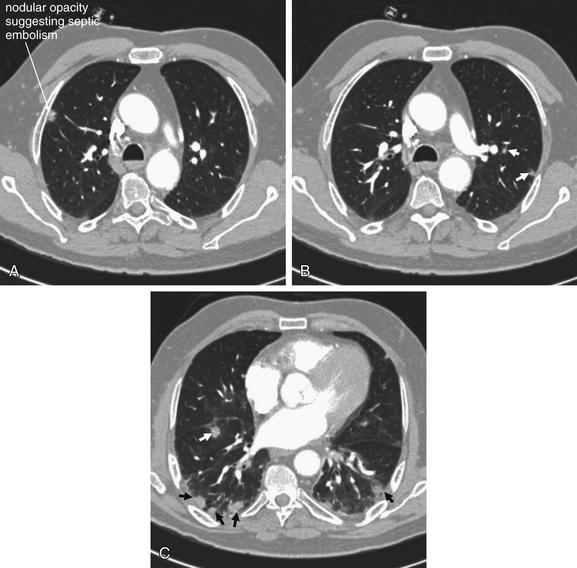
Chest CT with IV contrast from the same patient as Figure 5-102, viewed on lung windows. A, B, Adjacent axial slices at the level of the proximal aorta and pulmonary artery. C, A more caudad slice through the heart. Multiple peripheral nodules are seen in the slices shown, labeled with small arrows. This is consistent with septic emboli, although metastatic disease could have the same appearance and cannot be differentiated on CT. However, the patient had no known primary malignancy, and his clinic course suggests that these were indeed septic emboli. The patient’s blood cultures became positive for coagulase-negative Staphylococcus epidermidis and Enterococcus faecalis. He subsequently developed a septic ankle requiring washout in the operating room. His echocardiogram showed no valvular vegetations, and his dialysis catheter was removed, as it was the suspected source of infection.
Pulmonary Edema and Heart Failure
Chest x-ray findings of pulmonary edema follow a sequential pattern from early or mild findings to late or advanced findings (Table 5-6). A number of artifacts can simulate these findings and should be recognized to avoid misdiagnosis (Table 5-7). In general, early findings include pulmonary venous congestion, which is associated with cephalization, and cardiomegaly. Cephalization (Figures 5-104 and 5-105) refers to the redistribution of visible pulmonary vessels into the upper lung fields as pulmonary vascular volume and pressures increase. On a normal upright chest x-ray, the upper lung fields are relatively sparsely populated with visible pulmonary vessels compared to the lung bases because of the effect of gravity in preferentially filling dependent vascular beds. Remember that cephalization can be simulated by a supine chest x-ray, in which the upper pulmonary vessels are filled because of the patient’s supine position. An underpenetrated (underexposed) chest x-ray may simulate this appearance as well, as all blood vessels and soft tissues appear more prominent. A poor inspiratory effort also increases the apparent density of lung tissue, simulating pulmonary edema. In a poorly expanded lung (because of poor inspiratory effort at the moment of the x-ray), pulmonary blood vessels appear more closely spaced and may be mistaken for edema.
TABLE 5-6 Chest X-ray Findings of Pulmonary Edema
| Finding | Description |
|---|---|
| Cephalization | Pulmonary vascular markings are redistributed to upper lung zones on an upright x-ray. |
| Cardiomegaly | The ratio of the heart to the greatest transverse rib cage has a diameter >0.5. |
| Pericardial effusion | This may simulate cardiomegaly, but a water-bottle appearance is classically present. |
| Interstitial edema | Fluid appears in interstitial regions of the lung. |
| Thickening of the walls of bronchioles is seen when viewed end-on, perpendicular to the chest x-ray plane. | |
| Parallel fine lines extend from the pleural surface into the subpleural lung, especially in lung bases, thought to result from thickened interlobular septa. | |
| Alveolar fluid with or without air bronchograms | Air bronchograms prove the presence of alveolar fluid. Their absence does not disprove the presence of alveolar fluid. Air bronchograms do not result from pleural effusion alone. |
| Pleural effusion, including fluid within lung fissures | Right-sided pleural fluid is more common than left when a unilateral effusion occurs from heart failure. |
TABLE 5-7 Chest X-ray Techniques and Artifacts That May Simulate Pulmonary Edema
| Technique or Artifact | Effect |
|---|---|
| Supine technique | Mimics cephalization and cardiomegaly |
| AP technique | Mimics cardiomegaly |
| Poor inspiratory effort or hypoinflated lungs | Mimics interstitial edema and prominent pulmonary vascularity |
| Underexposure, e.g., in the obese patient | Mimics interstitial edema and pulmonary vascular congestion |
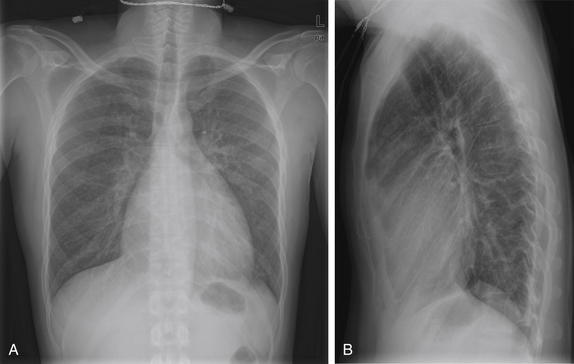
A, Posterior-anterior (PA) chest x-ray. B, Lateral chest x-ray. This previously healthy 40-year-old male presented with 2 weeks of cough, sputum production, subjective fever, and mild dyspnea. His chest x-ray was interpreted by the radiologist as showing borderline cardiomegaly, mild left suprahilar opacity, and questionable retrocardiac opacity. He was treated with moxifloxacin and discharged home. Is this chest x-ray remarkable? Is cardiomegaly really present? The heart occupies slightly more than half of the right-to-left diameter of the chest on posterior–anterior view. Compare with Figures 5-105 through 5-109. When available, always compare the chest x-ray with prior images to detect subtle changes.
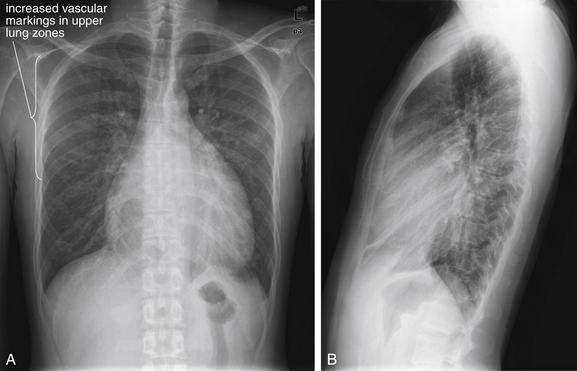
Figure 5-105 Cardiomegaly with cephalization.
Same patient as Figure 5-104. A, Posterior-anterior (PA) chest x-ray. B, Lateral chest x-ray. The patient returned to the emergency department for similar symptoms 13 days after his initial visit. He was diagnosed by the emergency physician with bronchitis and discharged. The radiology report notes stable cardiomegaly and mild pulmonary edema. Is the heart size really unchanged? Notice how the pulmonary vascular markings are prominent in the upper lung fields. This redistribution of vascular markings is called cephalization and is an early finding of pulmonary edema.
Cardiomegaly (Figures 5-106 through 5-109; see also Figures 5-104 and 5-105) is another frequent finding in cases of pulmonary edema, though not all patients with heart failure will have an enlarged cardiac silhouette. Heart size is measured on chest x-ray using the cardiothoracic ratio, which equals the ratio of the transverse heart to the greatest internal diameter of the thoracic cage. A normal value is less than or equal to 0.5 for adults, and cardiomegaly is radiographically defined by values exceeding this. Poor inspiration, supine positioning, or magnification from an AP portable x-ray all may falsely elevate the cardiothoracic ratio, simulating cardiomegaly. Figures 5-110 through 5-122 show cardiomegaly, often in association with other findings of pulmonary edema.
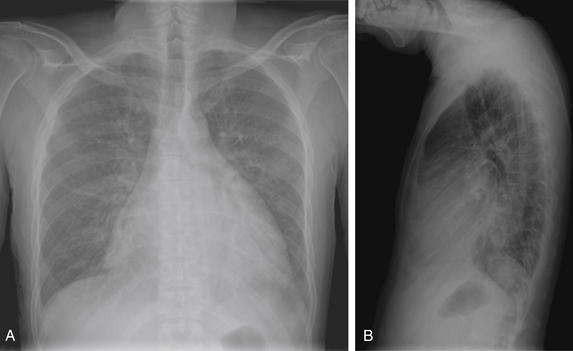
Same patient as Figures 5-104 and 5-105. A, Posterior-anterior (PA) chest x-ray. B, Lateral chest x-ray. The patient returned again 7 days later (20 days after his initial presentation). He continued to complain of cough, and his vital signs were notable for tachycardia to 130 and a temperature of 38.3°C. An interval increase in heart size was noted by the emergency physician, and a viral cardiomyopathy was suspected. The x-ray shows increased cardiomegaly with some increased vascular markings, suggesting mild pulmonary edema with cephvalization.
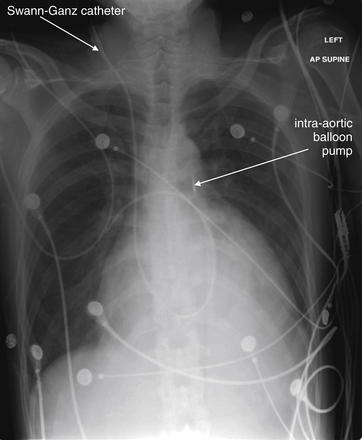
Two days after Figure 5-106, the patient is in the cardiac intensive care unit. The heart appears slightly larger on this view, although the supine anterior–posterior technique may exaggerate any difference. Notably, the patient has a right internal jugular catheter that curls into the right pulmonary artery—a Swann-Ganz catheter for measurement of pulmonary capillary wedge pressures. In addition, a radiopaque marker below the aortic knob marks an intra-aortic balloon pump.
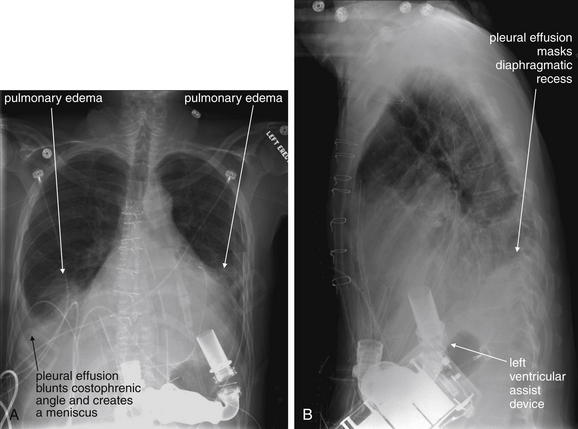
Same patient as Figure 5-107, 6 days later. A, Frontal projection chest x-ray. B, Lateral chest x-ray. The patient now has a left ventricular assist device implanted in the abdomen. This device pumps blood from the left ventricle to the ascending aorta. Bilateral pleural effusions are present, masking the diaphragms. Infiltrates representing edema are also present. Remarkably, the patient received a heart transplant 6 weeks later and did well. Review Figure 5-109.
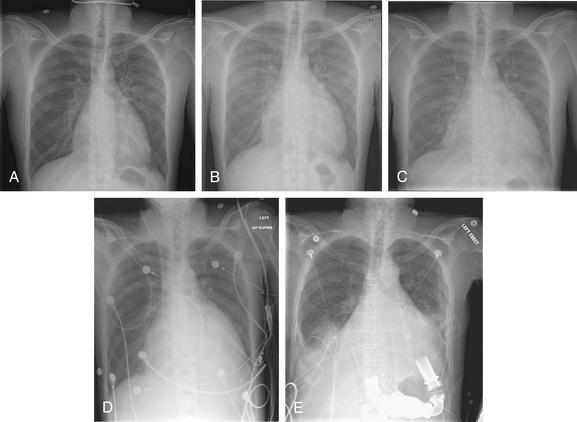
Figure 5-109 Cardiomegaly progression.
This series illustrates the progression of cardiomegaly in the same patient as Figures 5-104 through 5-108 over a period of 30 days. Notice the increase in heart size over this period, the increased cephalization of vascular markings, and the development of bilateral effusions and frank pulmonary edema as you move from A to E. When interpreting a chest x-ray, always compare with prior x-rays if available. A finding on the most recent x-ray may turn out to be old and thus unlikely to be the cause of acute symptoms. Or a subtle finding on the current x-ray may represent a significant change from prior x-rays and thus be important.
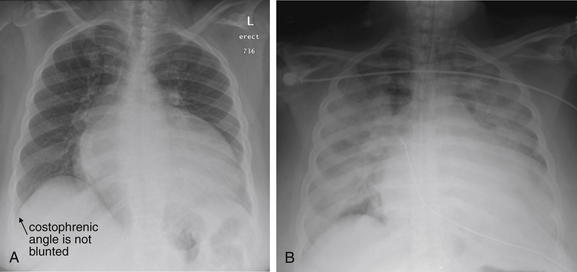
Figure 5-110 Cardiomegaly: Ejection fraction of less than 15% and no pericardial effusion.
This 40-year-old woman with a known dilated cardiomyopathy and an ejection fraction of less than 15% presented with 1 week of fatigue and orthopnea. A, Her chest x-ray on the day of her emergency department presentation. The heart is massively enlarged, occupying more than two thirds of the lateral diameter of the chest. Her lung fields appear relatively clear. Her right costophrenic angle is not blunted, though her left is difficult to evaluate because of the overlying heart. Does she have a pericardial effusion? Chest x-ray cannot firmly discriminate cardiomegaly from pericardial effusion, but none was seen on echocardiogram the same day. B, Days later, the patient was intubated in the cardiac intensive care unit with gross pulmonary edema. The chest x-ray shows diffuse bilateral opacities. Notice how the left and right heart borders, as well as both hemidiaphragms, are obscured. During this hospitalization, the patient required placement of a left ventricular assist device.
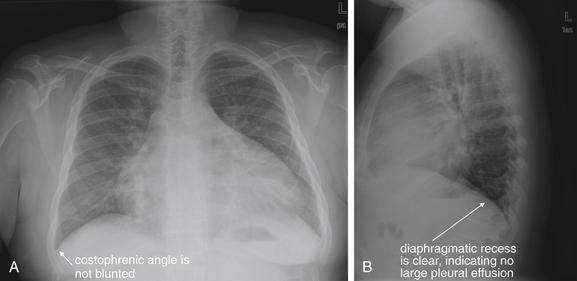
Figure 5-111 Cardiomegaly: Mild pulmonary edema.
A, Posterior-anterior (PA) chest x-ray. B, Lateral chest x-ray. This 25-year-old male with end-stage renal disease presented with mild dyspnea. His chest x-ray shows a markedly enlarged cardiac silhouette. No significant pulmonary edema is present—notice that the costophrenic angles are not blunted and the heart borders are fairly clear. Some densities at the right lung base may be atelectasis or mild edema. Notice how these intermittently mask the right heart border in A. Echocardiogram the same day showed moderate left ventricular hypertrophy, no pericardial effusion, and an ejection fraction greater than 55%. An enlarged cardiac silhouette on chest x-ray can be compatible with cardiomegaly, pericardial effusion, or a combination of both. Because pericardial fluid, myocardium, and blood within the heart share the same fluid density on x-ray, they cannot be distinguished. Sometimes pericardial fluid gives the heart a globular “water bottle” appearance, but this is unreliable. Echocardiography can reliably identify pericardial fluid. In addition, an enlarged heart on chest x-ray does not always correlate with a depressed ejection fraction on echocardiogram, as was the case with this patient.
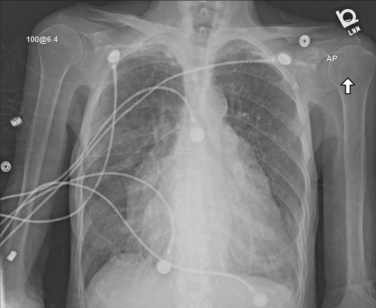
Figure 5-112 Cardiomegaly: Bilateral atrial enlargement and ejection fraction greater than 55%.
This 89-year-old female with a history of heart failure and atrial fibrillation presented with 2 weeks of increasing dyspnea and orthopnea. She reported sitting up to sleep. Her chest x-ray shows significant cardiomegaly, with enlargement of the left atrium and appendage and right atrium. Her heart size was not increased compared with prior x-rays, and her chest x-ray actually shows less edema than in the past. Notice how the right diaphragm is quite clear, with no blunting of the costophrenic angle. The left costophrenic angle is less clear because of the overlying heart, but the diaphragm can still be seen. An echocardiogram the same day showed biatrial enlargement, an ejection fraction greater than 55%, and no pericardial effusion. Although this is a very abnormal chest x-ray, another cause for her acute dyspnea should be considered.
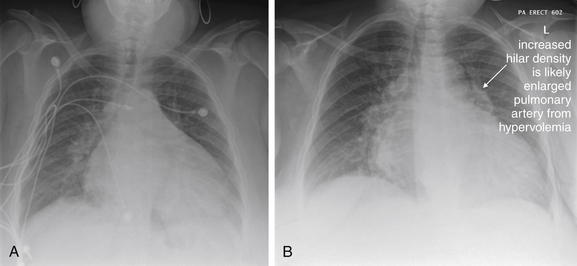
Figure 5-113 Cardiomegaly: Mild pulmonary edema, mild pericardial effusion, and ejection fraction greater than 55%.
This 50-year-old with human immunodeficiency virus, chronic obstructive pulmonary disease, and end-stage renal disease presented with 2 days of dyspnea (A). She reported missing dialysis for a week. Her chest x-ray shows significant cardiomegaly —or is this a pericardial effusion? Chest x-ray cannot reliably discriminate the enlarged cardiac silhouette of cardiomegaly from pericardial effusion. Increased densities at the right and left lung bases appear consistent with mild pulmonary edema, although overlying soft tissue may be a contributor. Her echocardiogram on this date showed left ventricular hypertrophy, an ejection fraction greater than 55%, and a mild pericardial effusion. A year later, the patient was seen for a similar complaint (B). The heart size is unchanged, although increased fullness of the hilum bilaterally suggests a greater degree of volume overload. Notice how the heart borders are clearer in A than in B. In both cases, the patient felt better after dialysis.
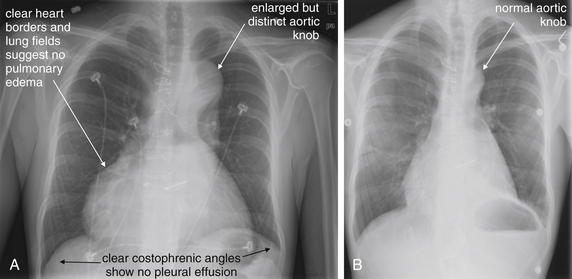
Figure 5-114 Cardiomegaly and thoracic aneurysm in Marfan syndrome.
This 24-year-old patient with Marfan syndrome presented with dyspnea (A). His heart appears markedly dilated, as does his aortic root and arch. His ejection fraction at this time was estimated at 10% by magnetic resonance imaging. No effusion was seen, despite the globular heart shape. This is a dilated cardiomyopathy. His lung fields, heart borders, and hemidiaphragms appear clear, without evidence of pulmonary edema. B, Three years earlier. Compare the heart size and aortic contour at this time, before progression of his disease. Sternotomy wires are visible, as the patient had already undergone mitral valve repair.
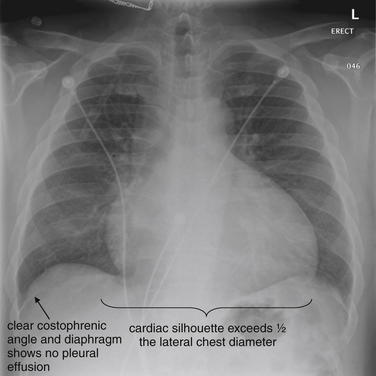
Figure 5-115 Congestive heart failure: Ejection fraction of less than 15% and mild pericardial effusion.
This 45-year-old male with a history of hypertension reported chronic dyspnea, worse in the last week. His blood pressure was 190 systolic with bilateral lower extremity edema. Although his cardiac silhouette is enlarged, his diaphragm and heart borders are clear without evidence of pleural effusions. His superior pulmonary vascular markings are increased, a finding called cephalization that is an early marker of increased pulmonary vascular volume and heart failure. An echocardiogram was preformed, showing global hypokinesis with an ejection fraction of less than 15%—decreased from 45% on echocardiogram 3 years prior. Only a mild pericardial effusion was seen, indicating that the majority of the increased heart size seen on x-ray is due to true cardiomegaly.
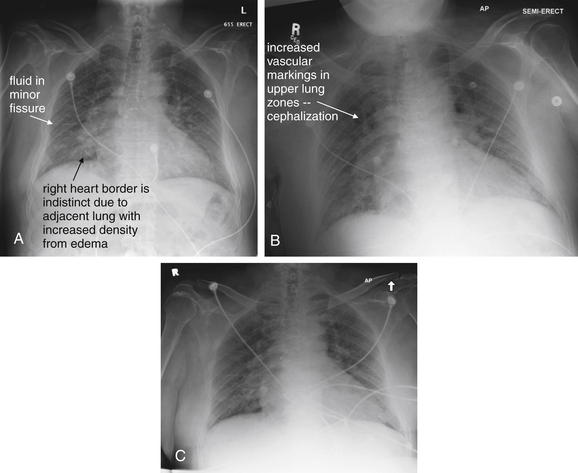
Figure 5-116 Congestive heart failure: Mild left ventricular hypertrophy with restricted filling, ejection fraction greater than 55%, and no pericardial effusion.
This 63-year-old male with coronary artery disease, chronic renal sufficiency, and diastolic heart failure (ejection fraction greater than 55%) presented multiple times for dyspnea A, B, and C, first through third clinical presentation. Each of these three x-rays shows signs of moderate pulmonary edema. The diaphragms and costophrenic angles are clear, suggesting no pleural effusion. The right heart border in all three images is indistinct because of interstitial edema in these locations. Portions of the left heart border are also indistinct. The upper lung fields have a hazy appearance indicating mild edema. Fluid is visible in the minor fissure on all three images. Does the similarity of these x-rays mean that edema is not the cause of the patient’s dyspnea? No, he simply presented with pulmonary edema on all three occasions.
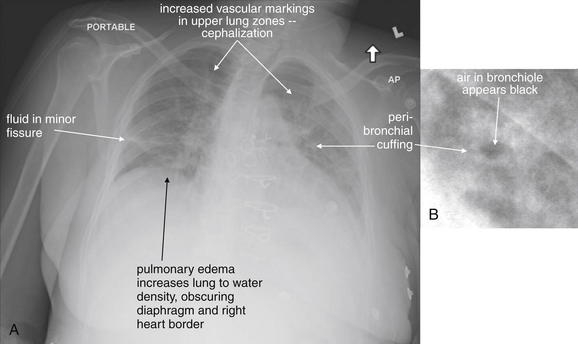
A, Anterior-posterior (AP) chest x-ray. B, Close-up from A. This 53-year-old female with end-stage renal disease missed dialysis and presented to the emergency department. Her examination demonstrated bilateral rales. Her x-ray shows mild cardiomegaly, bilateral interstitial opacities, and cephalization of the pulmonary vascular markings. The minor fissure appears thickened. These findings are consistent with pulmonary edema. In addition, peribronchial cuffing is present. As discussed elsewhere, this is a nonspecific thickening of the bronchial wall that can occur from edema in the setting of heart failure, asthma, viral illness, or even infections such as pertussis. The thickened wall appears white, whereas the air-filled bronchiole appears black and has a circular short-axis cross section.
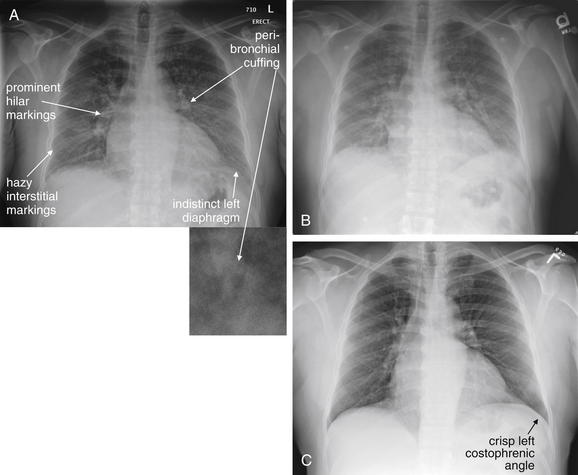
Figure 5-118 Congestive heart failure (CHF) with pulmonary edema.
This 56-year-old male with hypertension and CHF presented with 2 weeks of dyspnea, orthopnea, paroxysmal nocturnal dyspnea, and diaphoresis. His blood pressure was 200/90 with an oxygen saturation of 98% on room air when upright but 90% when supine. A, On emergency department presentation, the patient had evidence of pulmonary edema with prominent hilar markings, indicating full main pulmonary arteries. Streaky lower lung interstitial markings and peribronchial cuffing (small panel, close-up from A) are present. B, Two days later, these appear slightly worse. C, One month later, the patient has improved and has crisper diaphragms, clearer lung fields, and less prominent hilar fullness.
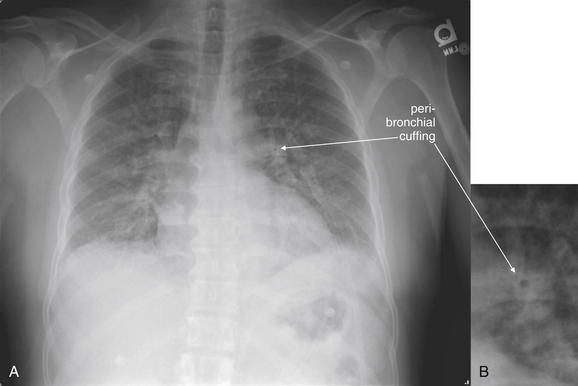
Same patient as in Figure 5-118. A, Frontal projection chest x-ray. B, Close-up from A. Pulmonary edema is an important finding to recognize, so take a moment with this x-ray. Note the hazy upper lung fields, the dense lower lungs with prominent interstitial markings, and the indistinct hemidiaphragms and heart borders. B, Peribronchial cuffing is also present.
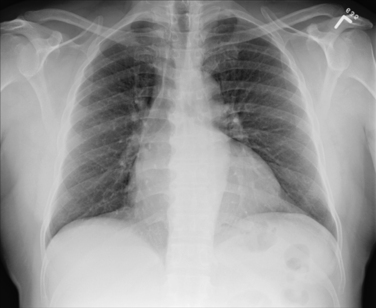
Figure 5-120 Pulmonary edema, resolved.
Same patient as Figure 5-119, 1 month later. Note the clear diaphragms and heart borders, the decrease in vascular markings in the upper lungs, and the resolution of lower lung interstitial markings and peribronchial cuffing.
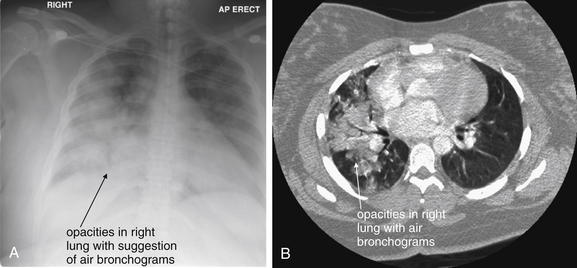
Figure 5-121 Postpartum congestive heart failure or community-acquired pneumonia?
This 31-year-old female was 3 days postpartum and presented with acute dyspnea and inspiratory chest pain with a nonproductive cough. She was tachypneic and tachycardic, with an oxygen saturation of 90% on room air. Postpartum cardiomyopathy, pneumonia, and pulmonary embolism were each considered. A chest computed tomography (CT) scan was performed and was negative for pulmonary embolism. An echocardiogram showed an ejection fraction greater than 55% with no pericardial effusion. A, Her anterior-posterior (AP) upright chest x-ray shows diffuse opacities in the right mid-thorax and lower thorax, which mask the right heart border and diaphragm. She has a more normal-appearing left lung. Compare this with the chest CT image (B), viewed on lung windows. On the CT image, air bronchograms are present, with opacification of alveoli surrounding the bronchi. A suggestion of this is seen on chest x-ray. Can frank pulmonary edema be discerned from infectious infiltrate on chest x-ray or CT? Both processes lead to fluid accumulation in alveoli, resulting in similar fluid density on either imaging modality. Air bronchograms can occur with either pulmonary edema or infection, as these are the result of fluid in alveoli, regardless of the causes. In this case, the marked asymmetry is more suggestive of infection, as the left lung appears quite normal on CT. The patient improved with antibiotic therapy.
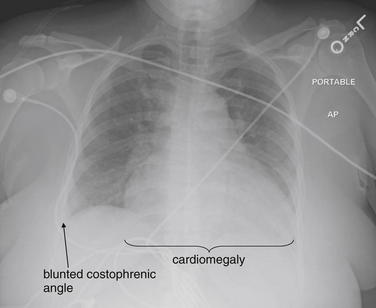
Figure 5-122 Congestive heart failure, postpartum: Ejection fraction of less than 15%, no pericardial effusion.
This 33-year-old female was brought to the emergency department after being found unresponsive. Her chest x-ray shows cardiomegaly, with the possibility of a pericardial effusion. Both costophrenic angles appear slightly blunted, suggesting at least small pleural effusions. The right lung base appears somewhat dense, possibly indicating edema; the left base is hidden behind the heart. Vascular markings are prominent in the upper lung fields. Sadly, the patient was found to have a postpartum cardiomyopathy. Her echocardiogram showed an ejection fraction of less than 15% with no pericardial effusion. She had left ventricular thrombus—the source of a large ischemic stroke that caused her unresponsive state.
An enlarged cardiothoracic ratio may also occur with pericardial effusion (Figures 5-123 through 5-130). This can be indistinguishable from cardiomegaly on chest x-ray, though classically the appearance of a large pericardial effusion is described as a “water bottle” appearance on upright chest x-ray. Imagine the appearance of a full water balloon that is placed on a flat surface. The balloon sags, creating a broader inferior aspect. A large pericardial effusion may have a similar appearance when the heart and pericardium rest in an upright position on the diaphragm and solid liver beneath. Although chest x-ray may assist in this diagnosis, ultrasound (see Chapter 6) and CT scan are definitive and should be used to differentiate cardiomegaly from pericardial effusion when clinical concern exists. Figures 5-131 through 5-135 (see also Figures 5-123 through 5-130) show the similar chest x-ray appearance of cardiomegaly and pericardial effusion. Pericardial effusion may accompany cardiomegaly in severe heart failure. Diagnostic imaging does not definitively determine the cause of a pericardial effusion, although associated findings such as lung opacities consistent with metastatic disease or primary lung neoplasms may suggest the cause.
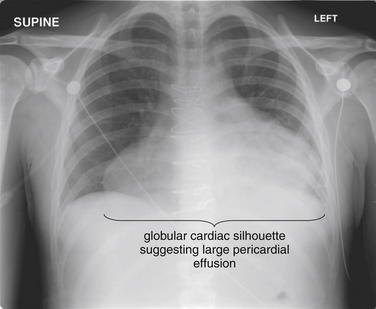
Figure 5-123 Massive pericardial effusion and tamponade.
This 23-year-old male has a history of aortic valve replacement for infective endocarditis. He presented with increased chest pain and dyspnea. His chest x-ray shows a globular cardiac silhouette, suggesting a large pericardial effusion. The lung fields and right costophrenic angle appear clear, although the left costophrenic angle is hidden behind the heart and cannot be assessed. The patient underwent chest computed tomography to evaluate his aorta, as he complained of severe interscapular pain as well (see Figure 5-125). Also see Figure 5-124, which compares his pre- and post-operative chest x-rays.
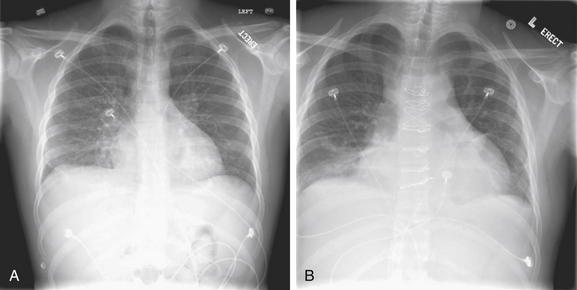
Figure 5-124 Massive pericardial effusion and tamponade.
Same patient as Figure 5-123. His preoperative (A) and postoperative (B) chest x-rays are shown from his aortic valve replacement. These preceded his presentation in Figure 5-123.
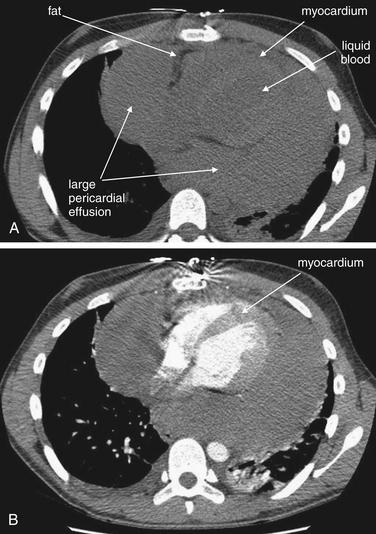
Figure 5-125 Massive pericardial effusion.
Same patient as Figures 5-123 and 5-124. The patient underwent chest computed tomography (CT) without (A) and then with (B) intravenous contrast to evaluate his aorta, which was normal. However, the CT confirmed a massive pericardial effusion surrounding a normal-appearing heart. Without contrast, note that fluid blood within the chambers of the heart has a slightly lower density than the pericardial effusion, which has a density more similar to that of myocardium. When contrast is administered, the ventricular chambers fill completely, and the myocardium enhances and becomes somewhat brighter than the surrounding pericardial effusion. The heart itself is outlined by a thin stripe of fat, which appears nearly black on soft-tissue windows. The patient developed hypotension, suggesting cardiac tamponade, and pericardial window was performed for drainage of the effusion. In the operating room, the effusion was found to be coagulated blood.
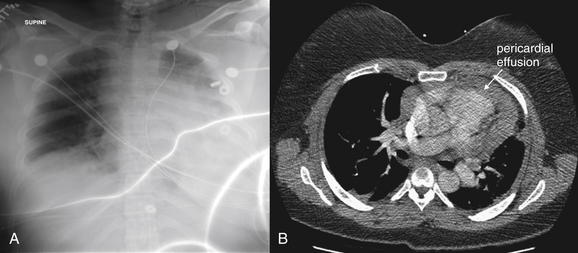
Figure 5-126 Massive pericardial effusion and tamponade.
This 35-year-old female with a history of pulmonary fibrosis treated with cyclophosphamide was brought to the emergency department by emergency medical services with a systolic blood pressure of 60mm Hg and a heart rate of 178 beats per minute. She complained of dyspnea. Her chest x-ray (A) showed an enlarged and indistinct heart, with the suggestion of a pleural effusion given the hazy appearance of the left hemithorax. The emergency physician suspected pulmonary embolism given her tachycardia and hypotension. B, CT with IV contrast was performed, showing no pulmonary embolism but a large pericardial effusion, which was causing cardiac tamponade. Interestingly, echocardiogram 2 hours before the CT scan was read as showing “trivial pericardial fluid.” However, based on the CT, the patient underwent left anterior thoracotomy, pericardial window, drainage of hemopericardium, and evacuation of intrapericardial fibrin clots. Her symptoms resolved. Echocardiogram is the usual modality for assessment of pericardial fluid. The patient’s body habitus likely interfered with an accurate transthoracic echocardiogram.
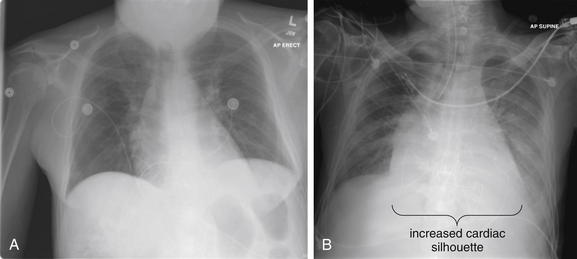
Figure 5-127 Pericardial effusion and tamponade (patient underwent pericardial window).
This 58-year-old lung transplant patient presented with 1 day of gradual dyspnea and cough. The patient had recently been admitted with Pseudomonas bacteremia and pulmonary embolism, was treated simultaneously with ciprofloxacin and coumadin, and had an INR of 2.5. Initial chest x-ray (A) was read as normal. Chest computed tomography (Figure 5-128) was negative for pulmonary embolism but showed a moderate pericardial effusion. The patient was admitted but then developed increased pericardial fluid (B) with pericardial tamponade requiring pericardial window. Remember that pericardial tamponade does not require a large volume pericardial effusion. Chest x-ray can be relatively insensitive for pericardial fluid. Consider bedside echocardiogram to assess for pericardial fluid in patients with dyspnea, chest pain, or hypotension.
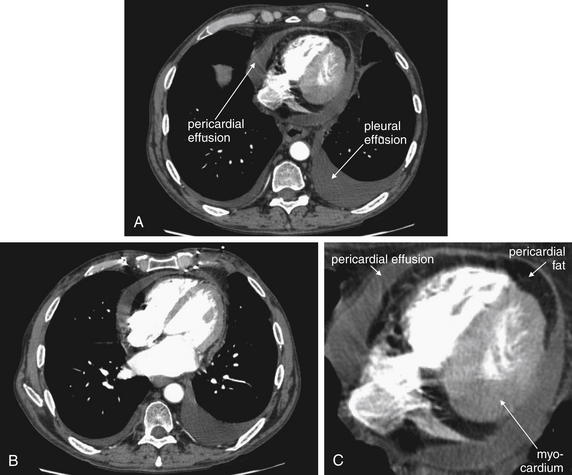
Figure 5-128 Pericardial effusion and tamponade.
Same patient as Figure 5-127. The patient’s chest CT with IV contrast shows a moderate pericardial effusion. On soft-tissue windows, unenhancing fluid such as pericardial or pleural effusions appears as an intermediate gray. The pericardial effusion surrounds a nearly black band, which is pericardial fat (fat is nearly black on soft-tissue windows). Within this lies the heart itself—the myocardium enhances with contrast and appears somewhat brighter than the effusion. A, B, Axial slices through the heart viewed on soft-tissue windows. C, Close-up from A.
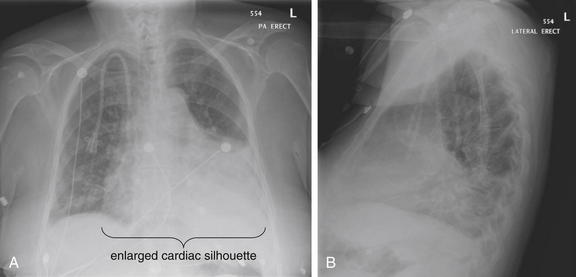
Figure 5-129 Pericardial effusion.
A, Posterior-anterior (PA) chest x-ray. B, Lateral chest x-ray. This 62-year-old female with end-stage renal disease on dialysis presented with dyspnea, not improved with dialysis. Her cardiac silhouette is enlarged. Is this cardiomegaly, pericardial effusion, or perhaps both? Chest x-ray cannot reliably discriminate between the two. Her echocardiogram showed a moderate pericardial effusion and an enlarged heart with an ejection fraction greater than 55%. She also underwent chest computed tomography (Figure 5-130).
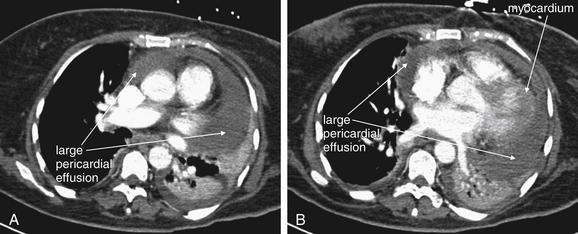
Figure 5-130 Pericardial effusion and tamponade.
Same patient as Figure 5-129. Chest CT with IV contrast. The patient has a large pericardial effusion. A, Axial CT slice just below the aortic arch, viewed on soft-tissue windows. B, A more caudad slice.
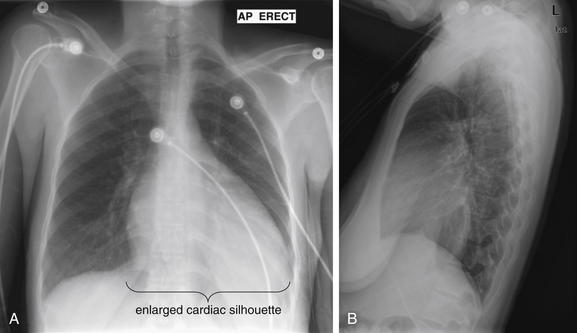
Figure 5-131 Cardiomegaly: Ejection fraction of 35% and mild pericardial effusion.
A, Anterior-posterior (AP) chest x-ray. B, Lateral chest x-ray. This 32-year-old female presented with right chest pain and dyspnea for the past few hours. She reported a history of mitral valve prolapse and had recently returned from a long car ride, greater than 16 hours. Does her x-ray give any hint of these abnormalities? Her heart appears enlarged, though chest x-ray cannot determine whether this is cardiomegaly or pericardial effusion. Chest computed tomography was performed to rule out pulmonary embolism (Figure 5-132) and discriminates these two findings. On bedside echocardiogram by the emergency physician, she was found to have a mild pericardial effusion and severe mitral regurgitation. Her ejection fraction was estimated at 35%. The patient was admitted and underwent mitral valve replacement.
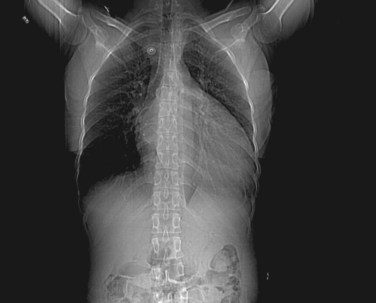
Figure 5-132 Cardiomegaly or pericardial effusion?
Computed tomography scout image from the same patient as Figures 5-131 and 5-133 again shows an enlarged cardiac silhouette. It is not clear from this view whether cardiomegaly or pericardial effusion is at play.
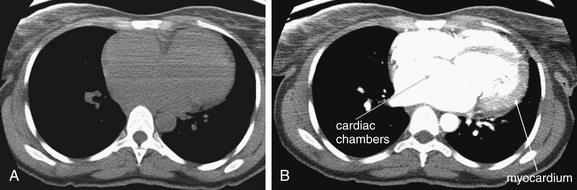
Chest CT from the same patient as Figures 5-131 and 5-132, without (A) and with (B) contrast. In these images, the heart appears significantly enlarged without a pericardial effusion. Without contrast, blood within the chambers of the heart are difficult to distinguish from myocardium. When contrast is injected, the chambers become an intense white, whereas the myocardium enhances somewhat.
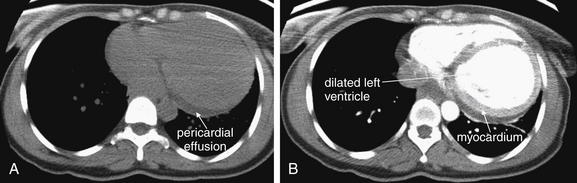
Figure 5-134 Pericardial effusion and cardiomegaly.
Same patient as in Figure 5-133. Here, a small pericardial effusion is visible in a dependent position deep to the left ventricle. The ventricle appears quite dilated as well. The pericardial fluid is dark gray and does not enhance with intravenous contrast (compare A, without contrast, and B, with contrast). The myocardial wall does enhance and becomes visible in B.
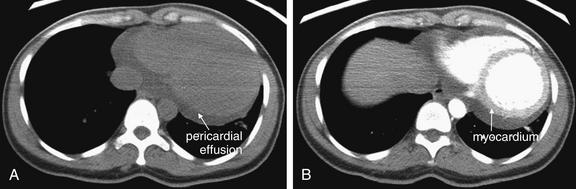
Figure 5-135 Pericardial effusion and cardiomegaly.
Same patient as in Figure 5-134. Lower in the chest, the pericardial effusion appears larger. The pericardial fluid is dark gray and does not enhance with intravenous contrast (compare A, without contrast, and B, with contrast). The myocardial wall does enhance and becomes visible in B.
Later in the course of heart failure or developing pulmonary edema, increased hydrostatic pressure results in the development of interstitial edema. This is manifested on chest x-ray as peribronchial cuffing (see Figure 5-119) described earlier in the section on interstitial pneumonia and Kerley B lines. Peribronchial cuffing is not specific to pulmonary edema and is seen in other states, including viral pneumonitis and bronchiolitis, such as that from respiratory syncitial virus. Kerley B lines are parallel, fine lines extending from the pleural surface into the subpleural lung, especially in lung bases, and thought to result from fluid accumulation in interlobular septa.
Late in the course of pulmonary edema, hydrostatic pressure forces fluid into alveoli, usually first in the lung bases and then in the upper lung segments (see Figure 5-110, B). This is usually symmetrical, although asymmetrical pulmonary edema can occur. Before frank air space edema occurs, symmetrical perihilar “butterfly” or “bat wing” air space disease may be seen. As described earlier in the section on air bronchograms, fluid within alveoli arising from heart failure may create a silhouette against the adjacent air-filled bronchi—an air bronchogram. The presence of this finding proves the presence of alveolar fluid but does not distinguish edema from infection, hemorrhage, aspiration, or other fluid. If edema progresses further, fluid may fill bronchioles adjacent to alveoli, eliminating the silhouette of the air bronchogram.
Pleural effusions are another common finding in pulmonary edema, although they may occur from many other causes, including infection, malignancy, and pulmonary embolism. When a unilateral pleural effusion occurs in the setting of heart failure, a right-sided pleural effusion is more common. Figures 5-136 through 5-152 show a variety of pleural effusions, emphasizing their variable size and appearance by chest x-ray, ultrasound, and CT.
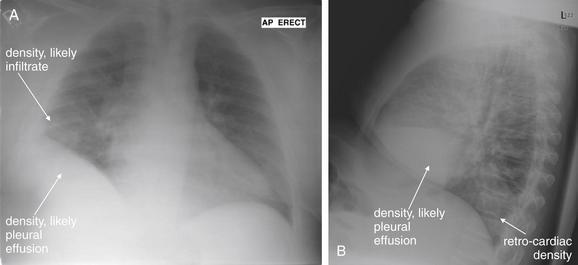
Figure 5-136 Pleural effusions or elevated hemidiaphragm?
A, Anterior-posterior (AP) upright chest x-ray. B, Lateral upright chest x-ray. This 52-year-old male with renal insufficiency and heart failure presented with increasing lower extremity edema and dyspnea. The patient was also febrile on emergency department arrival. His chest x-ray shows a density overlying the right lower chest. Remember that for diagnostic imaging findings, a differential diagnosis exists. On the anterior–posterior x-ray, this density is fluid density—it is indistinguishable from the appearance of the liver and diaphragm. It may be an elevated diaphragm, a subpulmonic pleural effusion, or a dense right lower lobe infiltrate. It appears to form a meniscus with the lateral chest wall, which supports pleural effusion. On lateral x-ray, the density is again seen and has a sharp and horizontally oriented upper margin. This suggests pleural fluid, although the minor fissure also represents a horizontal boundary in this location. This differential diagnosis can easily be explored with bedside ultrasound, which could confirm pleural effusion, or with decubitus x-rays that may show layering fluid. Superior to the density we described is a second less discrete density, which may represent an infiltrate. Increased density is also seen on the lateral x-ray behind the heart and overlying the lower thoracic spine.
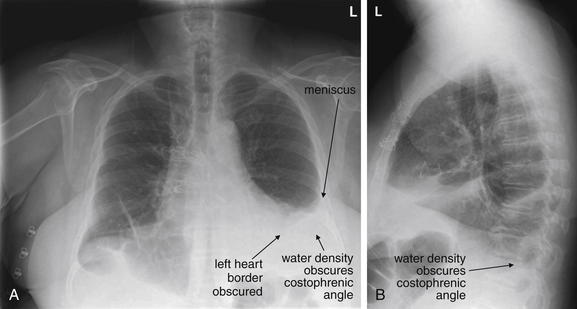
Figure 5-137 Pleural effusions.
A, Frontal projection upright chest x-ray. B, Lateral upright chest x-ray. This 59-year-old female recently underwent aortic valve replacement for bicuspid valve and presented with progressive shortness of breath and fever. Her chest x-ray shows a large left pleural effusion that obscures the left heart border and diaphragm on frontal view. It forms a meniscus with the lateral chest wall, another common feature of pleural effusions. On lateral chest x-ray, the posterior costophrenic angle is blunted, and a fluid meniscus is seen posteriorly.
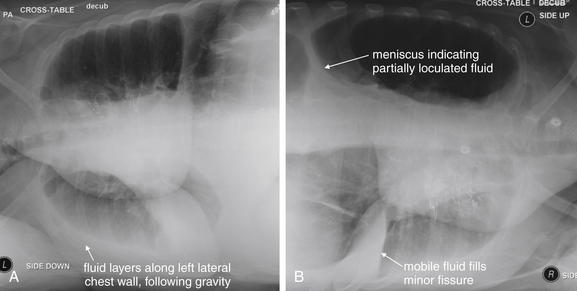
Figure 5-138 Pleural effusions.
Same patient as in Figure 5-137. The patient underwent decubitus x-rays to further delineate her pleural effusions. A, Left lateral decubitus chest x-ray. B, Right lateral decubitus chest x-ray. Decubitus views are named for the side positioned down. An x-ray obtained with the right side down is a right decubitus view. In the case of this patient, the left pleural effusion is seen to layer along the lateral chest wall in the left decubitus view—compare with the upright view in Figure 5-137, which shows the upper lateral left chest to be clear. On the right decubitus view, fluid fills the minor fissure, indicating that fluid is also mobile in the right pleural space. A meniscus remains visible in the left thorax on the right decubitus view, suggesting partial loculation of the left pleural effusion. Note that the lung in the nondependent position looks more lucent in these examples as fluid drains to a dependent position. The nondependent lung also is better aerated, with less atelectasis and less overlying soft tissue.
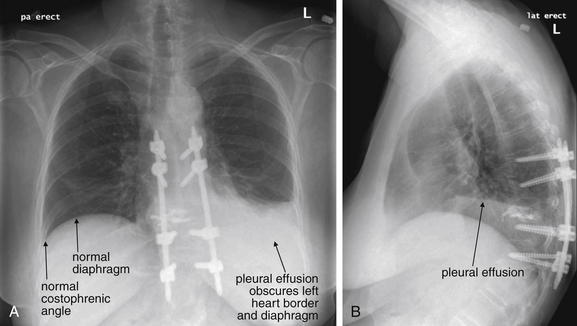
Figure 5-139 Pleural effusions.
A, Posterior-anterior (PA) upright chest x-ray. B, Lateral upright chest x-ray. This 62-year-old female with metastatic non–small cell lung cancer presented with 2 weeks of increasing dyspnea. Her chest x-ray shows a large left pleural effusion, which obscures the left heart border and diaphragm on the posterior–anterior view (A). On the lateral view (B), a fluid level is visible. Remember that pleural effusion can accompany many other disease processes. For this patient, malignant effusion, infection, heart failure, and effusion related to pulmonary embolism should be considered. Chest x-ray cannot directly differentiate these. The right chest has no effusion and provides a good comparison of a normal diaphragm and costophrenic angle.
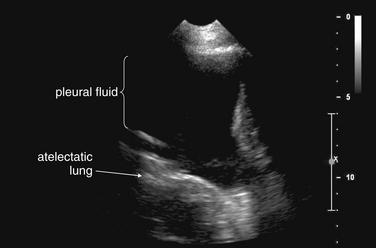
Figure 5-140 Pleural effusions.
Same patient as in Figure 5-139. An ultrasound of the chest was performed in preparation for thoracentesis. The large black region is pleural fluid. Lung tissue is seen deep to this and has echo characteristics similar to abdominal solid organs because it is atelectatic because of the pleural effusion. Thoracentesis should be possible here with little risk of pneumothorax, because 10 cm of pleural fluid separates the chest wall and lung in this location.
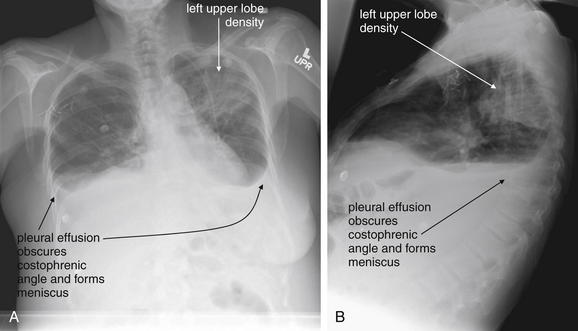
Figure 5-141 Pleural effusions.
A, Upright frontal projection chest x-ray. B, Upright lateral chest x-ray. This 49-year-old female with a history of breast cancer metastatic to bone and liver presented with shortness of breath and left-sided pleuritic chest pain. Her chest x-ray shows several findings, including a left upper lung opacity and bilateral large pleural effusions. The pleural effusions blunt the costophrenic angles and form meniscuses with the lateral chest walls on the posterior–anterior view. On the lateral view, pleural fluid fills the posterior recess. The infiltrate is also visible on the lateral x-ray. Given the clinical history, many causes for the pleural effusions must be considered, including malignant effusion, pulmonary embolism, heart failure, and infection. The infiltrate also may represent infection, metastatic disease, or pulmonary infarction. This is a reminder to consider the differential diagnosis for chest x-ray findings.
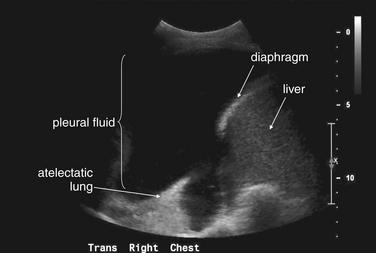
Figure 5-142 Pleural effusions.
Chest ultrasound was performed before thoracentesis. The black collection is pleural fluid. The white echogenic curve is the diaphragm, and beneath that lies the liver. An atelectatic lung is visible as well, 10 cm deep to the chest wall. Thoracentesis should be performed with little danger of pneumothorax.
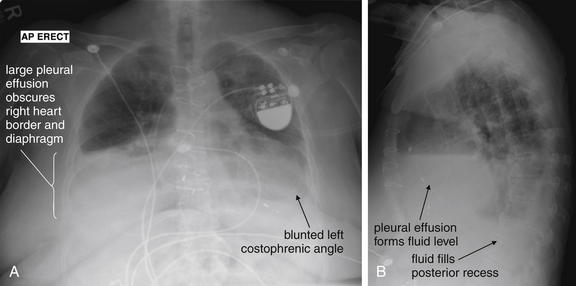
Figure 5-143 Pleural effusions.
A, Anterior-posterior (AP) upright chest x-ray. B, Lateral upright chest x-ray. This 71-year-old female presented with dyspnea on exertion and had a history of sick sinus syndrome and ischemic heart failure. A large right pleural effusion hides the right heart border and diaphragm on the anterior–posterior view. The left costophrenic angle is also hidden, although it is impossible to determine the size of the left pleural effusion as the left heart also overlies this area. On the lateral chest x-ray, a fluid level is visible overlying the heart, corresponding to the pleural effusions seen on the AP view. The posterior diaphragmatic recess is also filled with fluid.
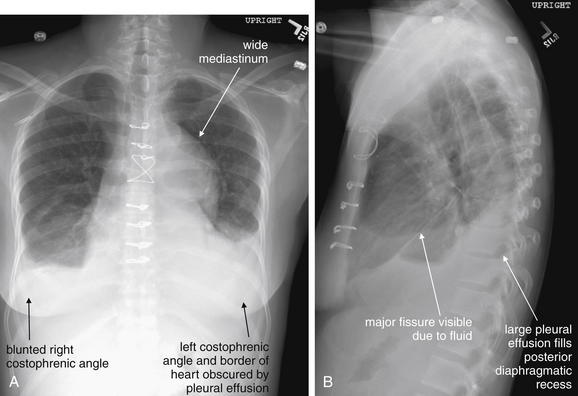
Figure 5-144 Pleural effusions.
A, Posterior-anterior (PA) chest x-ray. B, Lateral chest x-ray. This 48-year-old female with end-stage renal disease and a history or aortic dissection repair presented to the emergency department from clinic for transfusion. She denied chest pain or increased dyspnea. Her chest x-ray shows slight blunting of the right costophrenic angle, with a large left pleural effusion visible on the posterior–anterior x-ray. The left-sided effusion forms a classic meniscus with the lateral chest wall. The lateral x-ray shows a large pleural effusion. In addition, the major fissure is readily visible because of fluid tracking within it. The mediastinum has an abnormal contour and is widened. Abnormalities of the aorta and mediastinum are discussed in detail elsewhere.
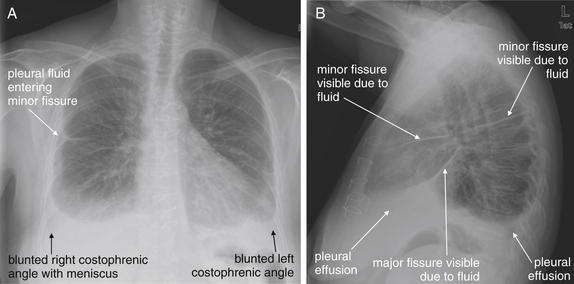
Figure 5-145 Pleural effusions.
A, Posterior-anterior (PA) upright chest x-ray. B, Lateral upright chest x-ray. This 54-year-old female presented with sudden onset right upper abdominal pain while exercising. Her chest x-ray shows bilateral pleural effusions on the posterior–anterior (PA) view, with the right forming a classic meniscus with the right chest wall. Fluid is also seen in the minor fissure on both the PA and the lateral views. On the lateral x-ray, fluid is also seen entering the major fissure. Is the pleural effusion the cause of the patient’s pain? What is the cause of the effusion? Chest x-ray does not answer these questions, and a careful differential diagnosis is required based on the history and physical examination. Premature closure based on the chest x-ray findings could lead to failure to diagnosis an underlying cause, such as pulmonary embolism, malignancy, heart failure, or abdominal pathology with sympathetic pleural effusion.
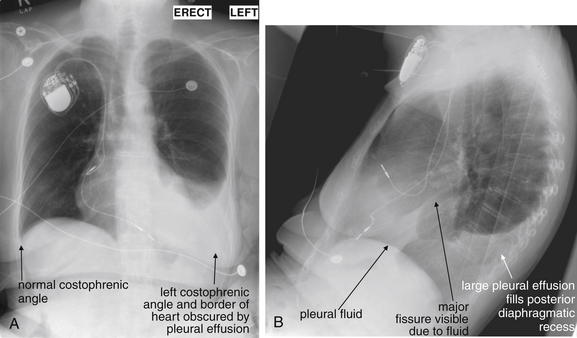
Figure 5-146 Pleural effusions.
This 71-year-old female with a history of atrial fibrillation presented with generalized weakness. Her primary care physician had also noted decreased breath sounds on the left. A, Her upright frontal projection chest x-ray shows a normal right chest with a clear costophrenic angle and right heart border. The left heart border and diaphragm are hidden by pleural effusion, which shares the same water density on x-ray. Note the classic meniscus formed between the pleural effusion and the left chest wall. B, On the lateral x-ray, pleural fluid is seen tracking into the major fissure and filling the posterior diaphragmatic recess. The effusion was aspirated but grew no organisms and had negative cytology.
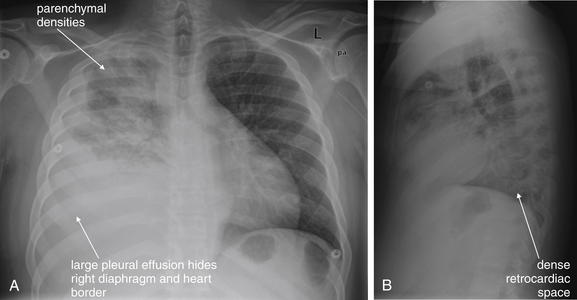
Figure 5-147 Pleural effusions.
A, Posterior-anterior (PA) chest x-ray. B, Lateral chest x-ray. This 30-year-old male with lung cancer presented with fever, dyspnea, and right chest pain. His chest x-ray shows a large right pleural effusion, as well as opacities of the upper lung that may indicate lymphangitic spread of tumor or superimposed infiltrate. How can pleural effusion be discriminated from dense pneumonia in the lower lung? Again, decubitus x-rays could demonstrate shifting fluid, or ultrasound could be used to evaluate. Computed tomography can discriminate pleural fluid from infiltrated lung as well. On x-ray, the presence of air bronchograms would indicate that the alveoli surrounding air-filled bronchi were opacified. A pleural effusion does not create air bronchograms. The absence of air bronchograms does not prove that this is a pleural effusion, because fluid or tumor infiltration of bronchi can eliminate air bronchograms even when alveolar opacification is present.
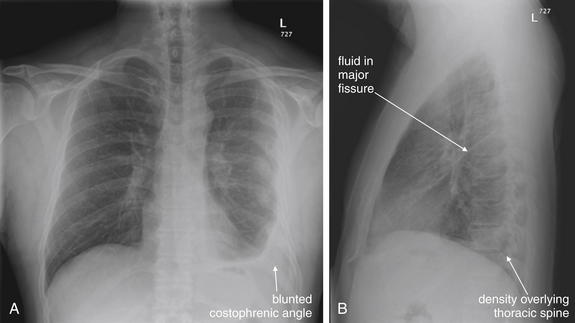
Figure 5-148 Pleural effusions.
A, Posterior-anterior (PA) upright chest x-ray. B, Lateral upright chest x-ray. This 44-year-old male presents with 2 weeks of cough, left chest pain, and dyspnea on exertion. Five months earlier, he had sustained a pneumothorax and several left-sided rib fractures. His chest x-ray shows a blunted left costophrenic angle with a meniscus along the left chest wall on posterior–anterior view. On the lateral x-ray, a meniscus and increased density are visible in the retrocardiac region overlying the lower thoracic spine. Some fluid is visible in the major fissure as well. Though the most likely cause may be residual hemothorax from his trauma, the patient was a heavy smoker and computed tomography was performed to exclude an underlying mass (Figure 5-149). Pulmonary embolism was also considered.
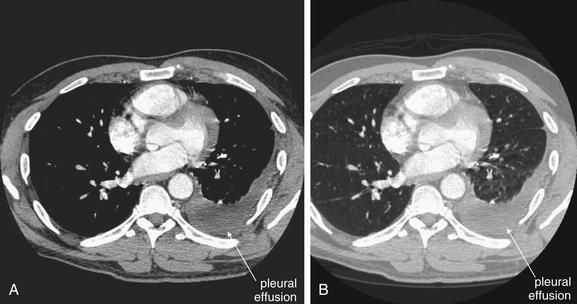
Figure 5-149 Pleural effusions.
Same patient as Figure 5-148. A, CT with IV contrast, axial slice viewed on soft-tissue windows. B, Same slice viewed with lung windows. A moderate left pleural effusion is seen. Computed tomography (CT) cannot discriminate the cause of a pleural effusion, other than by excluding parenchymal masses and pulmonary emboli. The density of pleural fluid can be measured on CT, but this is relatively nonspecific, as blood, serous fluid, and infected pleural fluid can have overlapping densities. Aspiration of pleural fluid for cytology, cultures, and chemical testing is necessary to further delineate the cause. No pulmonary emboli or masses were found on the patient’s CT.
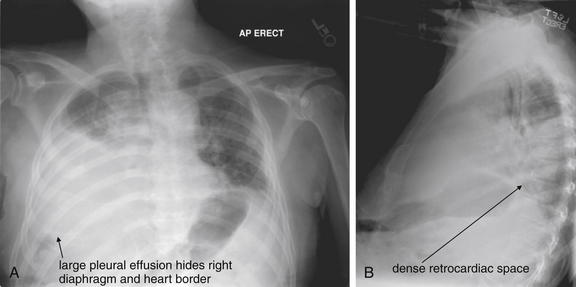
Figure 5-150 Pleural effusions.
A, Anterior-posterior (AP) upright chest x-ray. B, Lateral upright chest x-ray. This 85-year-old male presented with new right facial weakness and slurring of speech. His chest x-ray shows a large right pleural effusion that obscures the right heart border and diaphragm. This is visible on the lateral chest x-ray as well. The patient has taken a very small inspiration—notice how high the diaphragm is on the left on the AP view and on the lateral x-ray. Low lung volumes make the lungs look denser because of the crowding together of blood vessels.
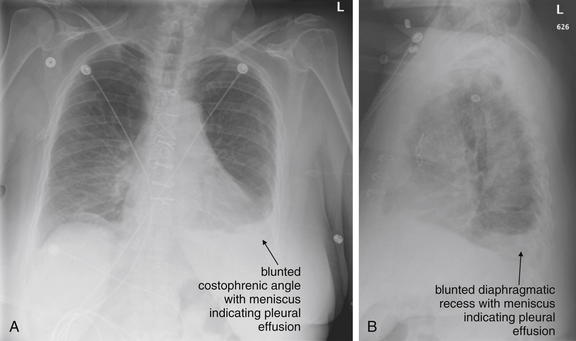
Figure 5-151 Pleural effusions.
A, Frontal projection upright chest x-ray. B, Lateral upright chest x-ray. This 60-year-old female presented with chest pain and dyspnea. She had undergone coronary artery bypass and grafting 2 weeks prior and had noted some swelling of her leg near the site of her saphenous vein harvest. Her chest x-ray shows a left pleural effusion with blunting of the costophrenic angle and a meniscus. Computed tomography was performed because of concern for possible pulmonary embolism (Figure 5-152).
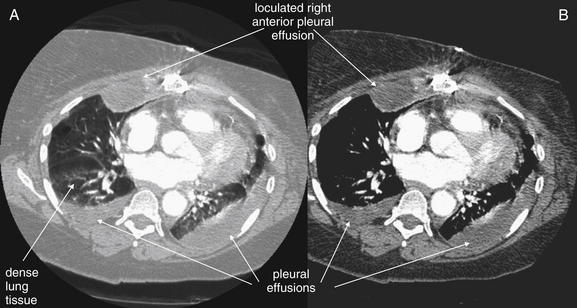
Figure 5-152 Pleural effusions.
Same patient as Figure 5-151. CT with IV contrast was negative for pulmonary embolism but showed bilateral pleural effusions, including a loculated right anterior effusion that did not move with gravity. A, Lung windows. B, Same slice viewed on soft-tissue settings. On lung windows, the dependent lung appears denser—this is likely due to compressive atelectasis from the adjacent pleural effusions.