Chapter 7 Imaging of Pulmonary Embolism and Nontraumatic Aortic Pathology
In the two preceding chapters we discussed chest imaging in patients without a history of injury and in the setting of trauma. In this chapter, we focus on imaging of three particularly life-threatening conditions: pulmonary embolism (PE), spontaneous aortic dissection, and spontaneous thoracic aortic aneurysm rupture. These conditions share computed tomography (CT) as their primary diagnostic modality today. For each of these, we briefly review pathophysiology, pretest probability assessment, and the limited role of chest x-ray in diagnosis. We discuss the role of CT in detail, comparing CT to other imaging modalities, including the historical criterion standards, pulmonary angiography and aortography, which are more rarely performed today. We consider the role and diagnostic accuracy of alternative imaging modalities, including ventilation–perfusion (VQ) scan, magnetic resonance imaging (MRI), and echocardiography. We consider challenging clinical scenarios, such as the patient with contraindications to intravenous (IV) contrast, the unstable patient who may be at risk during imaging tests outside of the emergency department, the patient requiring exclusion of both PE and aortic pathology, and the pregnant patient with suspected PE. Along the way, we review critical imaging findings that may allow you to diagnose these important conditions before radiologist interpretation, allowing earlier initiation of therapy. In the chapter on interventional radiology (Chapter 16), interventions for PE and aortic disease are described, with a critical review of the evidence for these treatments.
Brief Guide to Figures in This Chapter
Figures in this chapter are grouped according to clinical case so that x-rays, CT scans, and other imaging studies from a single patient are clustered together for teaching purposes. This means that sometimes you are directed to a figure later in the chapter, illustrating a related imaging finding in a different patient. These cross-references to later figures are marked by the words see also. In addition, a summary of the figure content is listed in Table 7-1 for quick reference. We highly recommend looking at all figures corresponding to a given patient case. They are arranged to illustrate pearls and pitfalls of imaging.
TABLE 7-1 Guide to Figures in This Chapter
| Content | Figure Numbers |
|---|---|
| Pulmonary embolism figures | 7-1 to 7-59 |
| 7-2, 7-3, 7-34, 7-38, 7-41, 7-51, 7-52 | |
| 7-2 | |
| 7-3, 7-34, 7-38, 7-41, 7-51, 7-52 | |
| 7-8 to 7-33, 7-35 to 7-37, 7-39, 7-40, 7-42, 7-47, 7-55 | |
| 7-11, 7-12 | |
| 7-13 to 7-27, 7-33, 7-39 | |
| 7-16, 7-17 | |
| 7-28, 7-29, 7-36, 7-42 | |
| 7-30 to 7-32, 7-35, 7-37, 7-42 | |
| 7-39, 7-40, 7-47 | |
| 7-43 to 7-46, 7-48 to 7-50, 7-53, 7-54 | |
| 7-4, 7-5 | |
| 7-56 to 7-59 | |
| Aortic disease figures | 7-60 to 7-102 |
| 7-60, 7-65, 7-67, 7-69, 7-70, 7-73, 7-75, 7-78, 7-85, 7-88, 7-92, 7-95, 7-98, 7-99 | |
| 7-60, 7-65, 7-67, 7-69, 7-70, 7-73, 7-75, 7-92, 7-95 | |
| 7-67, 7-78, 7-85, 7-88, 7-92 | |
| 7-98, 7-99 | |
| 7-61 to 7-64, 7-66, 7-68, 7-69, 7-71, 7-74, 7-76, 7-77, 7-79 to 7-84, 7-86, 7-87, 7-89 to 7-91, 7-93, 7-94, 7-96 to 7-98, 7-100 | |
| 7-80, 7-81 | |
| 7-80, 7-82, 7-83 (brachiocephalic) | |
| 7-64 | |
| 7-80, 7-82, 7-83 | |
| 7-84, 7-91 | |
| 7-87 | |
| 7-90 | |
| 7-96 | |
| 7-74, 7-93, 7-94 | |
| 7-72 |
We begin our discussion with PE. This discussion sets the stage for our review of aortic imaging, which has many features similar to those of PE.
Pulmonary Embolism
PE occurs when thrombus, usually from lower extremity or pelvic veins, migrates to the pulmonary arteries, resulting in partial or complete obstruction of blood flow in the affected vessel. The lung segment supplied by this vessel may become infarcted, and atelectasis or pleural effusion may occur.1 Pulmonary embolism is a life-threatening condition, although the range of reported mortality is very wide. In a large US emergency department sample of patients diagnosed with acute PE, 30-day mortality attributed to acute PE was only 1.1%, but all-cause mortality was 5.4%.1a Other studies suggest 30-day death rates of 15% in initially hemodynamically stable patients and almost 60% in patients presenting with hemodynamic instability, demonstrating the wide range of clinical severity.1b
Which Patients Require Imaging for Pulmonary Embolism? How Does Pretest Probability Influence Imaging Decisions?
Pretest probability assessment is a key part of planning for diagnostic imaging in emergency department patients with suspected PE. Pretest probability assessment first determines whether a patient requires imaging of any kind to assess for PE. Next, pretest probability strongly determines the reliability of the available diagnostic imaging modalities, influencing both the choice of modality and the clinical application of a negative or positive imaging test. As we discuss in detail later in the sections on VQ scan and CT, when imaging test results are at odds with clinical pretest probability, additional testing is warranted because of the possibility of false-positive and false-negative imaging results.
PE can be challenging to diagnosis clinically, as it can present with a variety of symptoms, including chest pain, dyspnea, and syncope. Let’s consider how clinical risk assessment tools should be applied to patients with suspected PE. First, ask the binary question: Is PE a possible cause of the patient’s presentation? If the answer is unequivocally “no,” (for example, in a patient with pleuritic chest pain immediately after blunt chest trauma), further risk assessment is not needed and may trigger unnecessary testing. If the answer is “yes” (including “likely not,” “possibly so,” or “likely yes”), “ further clinical risk stratification is needed. Several clinical assessment schemes exist, but they share the ability to sort patients into low-risk categories (not requiring imaging) and higher-risk categories (requiring imaging). Some risk stratification schemes incorporate lab testing (D-dimer∗), whereas others rely solely on clinical history and physical exam. We consider two risk stratification tools or clinical decision rules: Wells score and pulmonary embolism rule-out criteria (PERC).
Clinical decision rules are important guides to imaging decisions once the diagnosis of PE has been considered based on clinical gestalt. This last statement is important, because the two clinical rules we discuss here could lead to unnecessary imaging if applied indiscriminately to patients with clinical presentations not suggestive of PE. For example, a 60-year-old patient presenting with fever, abdominal pain, heart rate of 120 beats per minute, and history of appendectomy 10 days prior may be an obvious clinical case of postoperative abscess but scores 3 points by Wells criteria (discussed later), falling into a moderate risk group for PE. Clearly, the patient should not be evaluated for PE solely based on these criteria, unless clinical signs and symptoms suggest PE. By the same concept, the patient would fail several of the PERC, but these should not be applied if the clinician does not suspect PE. Figure 7-1 demonstrates appropriate use of risk-stratification for PE, and also shows how inappropriate use of risk-stratification rules could lead to unnecessary imaging.
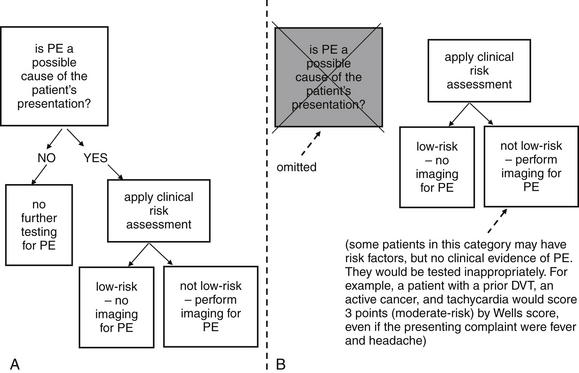
Figure 7-1 Two strategies for application of clinical risk stratification for pulmonary embolism (PE). Strategy A first asks the binary question: Could PE be the cause of the patient’s presentation? Then it applies specific clinical risk scores. This avoids unnecessary testing of patients with presentations not compatible with PE. Strategy B applies a clinical scoring system first and may lead to inappropriate testing of patients who have no clinical signs or symptoms of PE but have risk factors. Indiscriminate use of D-dimer testing without clinical risk stratification leads to the same type of error.
Wells criteria2 (Table 7-2) are validated criteria to identify patients with a low clinical risk for PE. Wells and colleagues have investigated multiple cutoffs, including a low–moderate–high categorization, and a PE unlikely–likely categorization (see Table 7-2). In Wells’ validation set, patients with a score less than 2 (low risk) had an overall PE rate of only 2.0%, regardless of D-dimer result. However, the confidence intervals were broad, with an upper limit of 7.1%, which would be unacceptably high for most clinicians. Ironically, low-risk patients with a negative D-dimer had a higher rate of PE (2.7%) than those with positive D-dimer testing (0%) in Wells’ study, though no statistical difference between the groups existed. When the Wells Criteria are dichotomized into PE “unlikely” (score ≤ 4) and “likely” (score > 4) categories, an unlikely score plus a negative SimpliRed D-dimer predicts a PE risk for around 2% with an upper 95% CI of 6%.2 Other studies suggest that the SimpliRed D-Dimer is not sufficiently sensitive and that ELISA D-dimer assays are superior.2a-2c More recently, a simplified dichotomized Wells Criteria has been described, although this rule requires additional prospective validation. Under this paradigm, each criterion is assigned only 1 point, and a score of no more than 1 combined with a normal D-dimer predicts a 3-month incidence of venous thromboembolism (VTE) of 0%, with a 95% confidence interval (CI) of 0% to 1.6%. Using this strategy, 26% of patients could avoid diagnostic imaging for PE.3 The use of Wells criteria, in conjunction with D-dimer testing, to screen patients for possible PE is widely accepted and was endorsed by the American College of Emergency Physicians (ACEP) in its 2003 clinical policy on evaluation of adult patients with suspected PE, now retired.4
TABLE 7-2 Wells Criteria for Pulmonary Embolism
| Criterion | Score |
|---|---|
| Clinical signs and symptoms of DVT | 3.0 |
| PE is No. 1 diagnosis or equally likely | 3.0 |
| Heart rate > 100 bpm | 1.5 |
| Immobilization at least 3 days or surgery in past 4 weeks | 1.5 |
| Previous objectively diagnosed PE or DVT | 1.5 |
| Hemoptysis | 1.0 |
| Malignancy with treatment within 6 months, or palliative | 1.0 |
Total score: <2 gives low (1.3%) risk of PE, 2-6 gives moderate (16.2%) risk, >6 gives high (37.5%) risk. Score ≤ 4 plus negative D-dimer predicts a 2% risk for venous thromboembolic disease. When each criterion is assigned only 1 point, a score ≤ 1 plus a normal D-dimer gives a 0% rate of VTE at 3 months.
Data from Douma RA, Gibson NS, Gerdes VE, et al. Validity and clinical utility of the simplified Wells rule for assessing clinical probability for the exclusion of pulmonary embolism. Thromb Haemost 101:197-200, 2009; Wells PS, Anderson DR, Rodger M, et al. Derivation of a simple clinical model to categorize patients’ probability of pulmonary embolism: Increasing the models utility with the SimpliRED D-dimer. Thromb Haemost 83:416-420, 2000.
The PERC5-6 are a prospectively derived and validated system to exclude PE without D-dimer testing. The advantage of such a system is the avoidance of unnecessary imaging prompted by false-positive D-dimer results, a problem often encountered with highly sensitive D-dimer tests. The criteria (Box 7-1) are meant to be applied only to patients judged to be at low risk for PE based on physician gestalt. Imaging decisions in patients not judged by gestalt to be at low risk of PE should not be based on PERC. In a prospective study of more than 8100 patients, the rate of 45-day VTE or death was less than 2% in PERC-negative patients. The rule can eliminate the need for diagnostic imaging in about 20% of patients with a low pretest probability (defined as <15%) based on physician gestalt. Multiple other clinical probability scores exist including the Charlotte Rule and Geneva Rule, with similar overall accuracy. These and experienced clinician gestalt can be used to determine pretest probability.6a
Formulating a pretest probability assessment of PE should be routine practice before the decision to perform a diagnostic imaging test for PE. In patients whose pretest probability assessment suggest a need for imaging to evaluate for PE, multiple imaging tests are available, but the usual first imaging step is chest x-ray.
How Is Chest X-ray Useful in the Evaluation of Pulmonary Embolism? What Is the Importance of Classic Abnormalities Such as Hampton’s Hump and the Westermark Sign? Do Any Chest X-ray Findings Confirm or Exclude Pulmonary Embolism?
Chest x-ray plays a limited role in the diagnosis of PE, as an embolism is not directly visible on plain x-ray. The greatest importance of chest x-ray in assessment for PE is in evaluation of the differential diagnosis, which can include pneumonia, pneumothorax, malignancy, pleural effusion, pericardial disorders, and aortic or other mediastinal abnormalities. Chest x-ray is inexpensive, rapid to obtain, and exposes the patient to minimal radiation in comparison with CT and VQ scan. Consequently, it is an appropriate initial imaging test in virtually every patient with suspected PE, as it explores the differential diagnosis of complaints such as chest pain, dyspnea,
Box 7-1 Pulmonary Embolism Rule-Out Criteria
From Kline JA, Courtney DM, Kabrhel C, et al. Prospective multicenter evaluation of the pulmonary embolism rule-out criteria. J Thromb Haemost 6:772-780, 2008; Kline JA, Mitchell AM, Kabrhel C, et al. Clinical criteria to prevent unnecessary diagnostic testing in emergency department patients with suspected pulmonary embolism. J Thromb Haemost 2:1247-1255, 2004.
In a patient classified as “low risk” by clinician gestalt, PE is unlikely if all of the preceding criteria are fulfilled. Sensitivity is 97.4% (95% CI = 95.8%-98.5%), and specificity is 21.9% (95% CI = 21.0%-22.9%); likelihood ratio negative is 0.12 (95% CI = 0.07-0.19). The score is meant to be used without D-dimer testing.
and syncope. Chest x-ray also provides information that can predict the diagnostic utility of VQ scan or in some cases can even substitute for the ventilation portion of the VQ scan, reducing cost and radiation exposure. Prospective Investigation of Pulmonary Embolism Diagnosis (PIOPED) I, a multicenter trial from 1983 to 1989 that provided methodologically rigorous evaluation of diagnostic tests for PE, provides a rich source of information on the diagnostic value of chest x-rays in patients with and without PE. Normal chest x-rays occurred in only 12% of patients in this study published in 1990—although this was a high-risk patient population with a high incidence of PE. Normal chest x-rays may be more common in a lower-risk cohort, more typical of emergency department patients undergoing testing today. The most common chest x-ray findings in patients with PE were atelectasis, parenchymal areas of increased opacity, or both, but these findings occurred with similar frequency in patients without PE and therefore cannot be used to differentiate PE. Several classically described chest x-ray findings of PE were specifically investigated but found to have little diagnostic value (see Table 7-3). The Westermark sign (oligemia distal to a large vessel occluded by PE) (Figure 7-2) was found to be relatively specific but highly insensitive, found in only 8% to 14% of patients with PE. “Classic” findings that proved nonspecific and insensitive included the Fleischner sign (a prominent central artery caused by distension of a vessel by a large clot or by pulmonary hypertension from distal embolization) and Hampton’s hump (a wedge-shaped pleural-based peripheral density with a convex medial border, representing parenchymal infarction) (Figure 7-3; see also chest x-rays in Figures 7-34, 7-38, 7-41, 7-51, and 7-52 and CT findings in Figures 7-30, 7-31, 7-32, 7-35, 7-37, 7-42, and 7-55).7 Findings such as these should not be used to exclude or confirm PE, because they have excessively high false positive and false negative rates.
TABLE 7-3 Chest X-ray Findings and Pulmonary Embolism Diagnosis
| Chest X-ray Finding | Sensitivity | Specificity |
|---|---|---|
| Normal | 12% | 82% |
| Oligemia (Westermark sign) | 8%-14% | 92%-96% |
| Prominent central pulmonary artery (Fleischner sign) | 20% | 80% |
| Pleural-based area of increased opacity (Hampton’s hump) | 22%-24% | 82% |
| Vascular redistribution | 9%-10% | 85%-87% |
| Pleural effusion | 35%-36% | 70% |
| Elevated diaphragm | 14%-20% | 85%-90% |
From Worsley DF, Alavi A, Aronchick JM, et al. Chest radiographic findings in patients with acute pulmonary embolism: Observations from the PIOPED Study. Radiology 189:133-136, 1993.
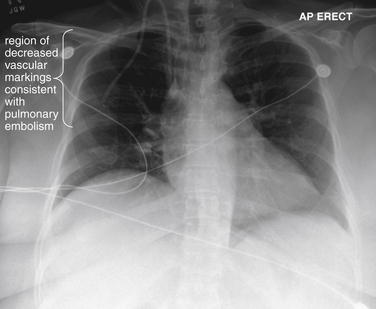
Figure 7-2 Pulmonary embolism (PE), chest x-ray with the Westermark sign.
This 57-year-old female with ovarian cancer presented with worsening dyspnea and leg pain. She underwent ventilation–perfusion scan that was high probability for PE.
Her chest x-ray shows an area in the right upper thorax with decreased pulmonary vascular markings compared with the left. This is consistent with the Westermark sign, an indication of a proximal PE blocking distal flow of blood to a lung segment. The Westermark sign is very insensitive but relatively specific, according to data from the Prospective Investigation of Pulmonary Embolism Diagnosis study. Occasionally, an abnormal region of lung parenchyma that is poorly ventilated because of bronchospasm or emphysema may have physiologic vasoconstriction, giving a similar appearance.
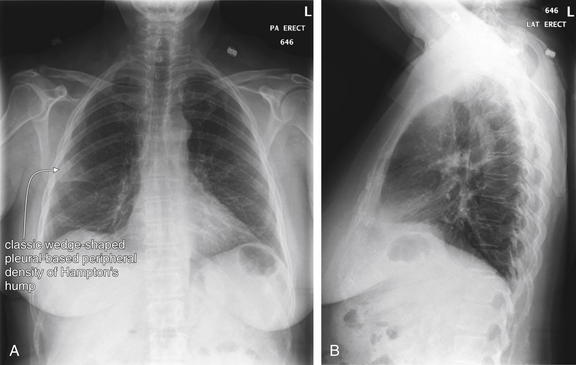
Figure 7-3 Pulmonary embolism (PE): Chest x-ray showing Hampton’s hump.
A, Posterior–anterior chest x-ray. B, Lateral chest x-ray. This 62-year-old female presented with sudden onset right pleuritic back pain awakening her at 2 AM. Her initial vital signs were pulse oximetry 96% on room air, blood pressure 153/70, heart rate 69 bpm, and temperature 38.0°C (100.4°F). This is an example of PE resulting in a peripheral wedge-shaped pleural-based infarction—Hampton’s hump. Note how the density stops abruptly at the minor fissure (a pleural boundary) inferiorly. This was interpreted in the radiology report as “right axillary subsegment pneumonia, right upper lobe.” Pneumonia and pulmonary infarction can appear identical on chest x-ray. Although neither sensitive nor specific for PE, Hampton’s hump should be recognized as a possible finding of PE to avoid misdiagnosis of a patient with pneumonia. PE was strongly suspected in this patient because of sudden onset and recent hospitalization, and computed tomography confirmed the diagnosis (see Figure 7-32).
Several key points about chest x-ray bear emphasis:
A variety of chest x-rays from patients with pulmonary emboli are shown throughout the chapter, along with corresponding CT and VQ scans. The take-home point regarding chest x-ray is to avoid being misled by chest x-ray findings into inappropriately abandoning the hunt for pulmonary embolism in an at-risk patient.
What Modalities Can Be Used to Detect Pulmonary Embolism? How Does Pulmonary Angiography Diagnose Pulmonary Embolism?
As we discussed earlier, chest x-ray plays a limited role in the diagnosis of PE, as an embolism is not directly visible on plain x-ray. Instead, indirect or associated findings of PE may sometimes be visible, including pleural effusions and pulmonary parenchymal opacities associated with infarction. In general, these findings are neither sensitive nor specific for PE, so the major role of chest x-ray is in evaluation for other pathologic processes in the differential diagnosis. Common imaging tests for PE include VQ scan and CT pulmonary angiography, with niche roles for MRA and echocardiography in the evaluation of selected patients, as discussed later. The historical criterion standard diagnostic test was fluoroscopic pulmonary angiography (Figures 7-4 and 7-5). In this test, a catheter is inserted through a central vein and advanced through the right heart to the pulmonary artery. Contrast is injected through the catheter, filling the pulmonary arterial tree, which is then visible under fluoroscopy. A pulmonary embolus is visible as a filling defect within the stream of contrast. A fully occlusive PE may completely block flow of contrast distally, whereas a partially occlusive thrombus or small peripheral thrombus may be subtler. As we discuss later, CT pulmonary angiography uses the same principles to detect thrombus and shares many of the advantages and pitfalls. Although pulmonary angiography is used as the “gold standard” diagnostic test in many studies evaluating other imaging modalities, angiography is itself imperfect. Based on animal models, autopsy studies, and follow-up studies using subsequent diagnosis of PE to identify false-negative angiography results, pulmonary angiography is likely only about 87% sensitive (95% CI = 79%-93%), which as we discuss is comparable to CT sensitivity.8-9 Pulmonary angiography is rarely performed today as a primary diagnostic test for PE because of its invasive nature and morbidity.10 Its role has largely been relegated to secondary investigation in cases in which other diagnostic modalities are inconclusive or when invasive therapy is needed for massive PE. The chapter on interventional radiologic techniques (Chapter 16) discusses pulmonary angiography in detail.
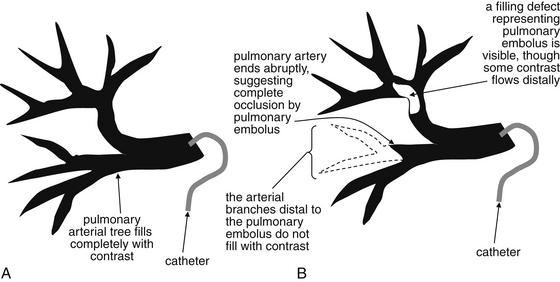
Figure 7-4 Pulmonary arteriogram: Schematic.
This schematic of a pulmonary angiogram depicts a normal examination (A) and an examination consistent with pulmonary embolism (PE) (B). During pulmonary angiography, radiopaque contrast material is directly injected into the main pulmonary arteries, using a pulmonary arterial catheter. The pulmonary arterial tree is then visible under fluoroscopy. A, Contrast injected through a catheter in a main pulmonary artery completely fills the arterial tree, indicating that no obstructing pulmonary emboli are present. B, A branch of the tree does not fill (outlined here in dashed line). In addition, a filling defect in the stream of contrast is visible in another section of the arterial tree, although contrast does flow distal to the partially obstructing PE.
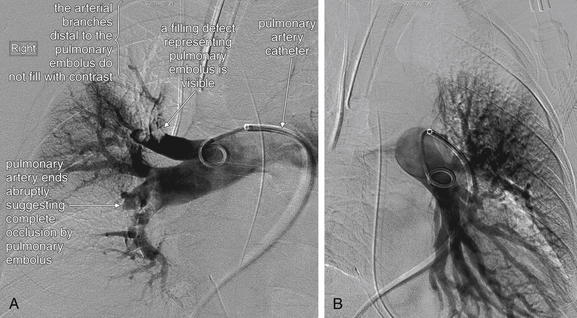
Figure 7-5 Pulmonary arteriogram.
Pulmonary arteriography is the historical criterion standard diagnostic imaging test for pulmonary embolism—although recent studies suggest that computed tomography may be comparable in sensitivity and specificity. Today, the study is rarely performed unless other diagnostic imaging tests are inconclusive or an invasive therapy such as mechanical clot disruption or catheter thrombolysis is planned. In pulmonary angiography, a catheter is advanced through a central vein into the right heart and then into the right and left pulmonary arteries. Contrast is injected, and the pulmonary arterial tree becomes visible under fluoroscopy. Filling defects may be seen directly, or a branch of the tree may fail to fill, indicating a thrombus blocking flow of contrast to that region. A, The patient’s right pulmonary arterial tree appears to be missing a major branch. Filling defects representing pulmonary emboli are also present. B, The left pulmonary arterial tree appears normal.
Next, we discuss the theory behind other common tests for PE, starting with CT.
CT Pulmonary Angiography
CT was independently invented in 1972 by British physicist Godfrey N. Hounsfield and American Allan M. Cormack, who in 1979 shared the Nobel Prize in medicine and physiology for their contributions.11-15 CT was a breakthrough technology, because it allowed depiction of cross-sectional anatomy with soft-tissue detail unobtainable by conventional x-ray, discovered in 1895 by Wilhelm Roentgen.16 The first CT scanner could accommodate only the human head and required more than 7 minutes to acquire a single image (slice). Early CT scanners used a single x-ray emitter and detector to acquire image data. Data was acquired one slice at a time, with the emitter and detector circling the patient once, and then the table moving a small distance between each image acquisition (Figure 7-6). The consequence was not only poor image resolution but also data gaps, because anatomic information between slices was unavailable. The ability of CT to diagnose subtle pathology, such as small pulmonary emboli, was limited by both resolution and data gaps. Initially CT was used to demonstrate not the PE but the infarcted lung segment, and it had a sensitivity of less than 50%.17
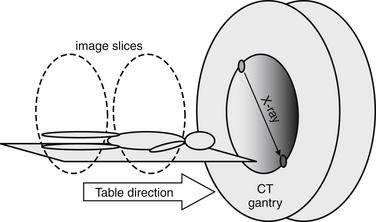
Figure 7-6 Single detector, nonhelical computed tomography.
Individual slices were acquired by rotating a single, paired x-ray source and detector around the patient.
Computed Tomography Scan Characteristics
Two innovations known as “helical” and “multislice” technology improved CT image and data quality, enhancing diagnostic capability. Because of these improvements in CT technology, older studies on the diagnostic characteristics of single-slice CT do not apply to most CT scanners now in clinical use. CT scanners with helical or “spiral” capability acquire data continuously as the patient moves through the gantry (Figure 7-7). Although depending on the CT protocol some data gaps may remain, the amount of missing data is substantially reduced by this technology.18-20 All modern scanners can acquire image data in this fashion. In the early years of CT, spiral CT for the diagnosis of PE was an important distinction, because nonhelical scanners were still in use at many institutions. Multislice CT introduces additional x-ray detectors. In scanners of this type, as the patient moves through the CT gantry, the emitter and detectors rotate around the patient in a circular path. The combination of continuous table motion and circular motion of the x-ray source and detectors results in a helical pattern of data acquisition.21 Data is acquired as a three-dimensional volume. Slices may be reconstructed in any plane, or three-dimensional reconstructions can be generated using sophisticated software.22-23 This technology offers substantial improvements in resolution, allowing structures less than a millimeter in size to be seen (the minimum slice thickness on most commercial CT scanners today is 0.625 mm). A tradeoff continues to exist between detail (resolution and signal-to-noise ratio) and radiation exposure. A high-resolution CT of the chest or abdomen exposes a patient to a radiation dose equivalent to approximately 400 chest x-rays.24 A common misconception is that a higher “slice number” of a CT scanner indicates higher resolution. Instead, the slice number (4 slice, 16 slice, 64 slice, etc.) refers to the number of x-ray detectors, which determines the number of slices that can be acquired simultaneously. This is independent of the slice thickness, which determines resolution. A higher slice number does allow a body region such as the chest to be scanned more quickly, minimizing motion artifact and thus improving test performance. Chapter 8 discusses some technical aspects of CT in more detail in the context of cardiac CT.
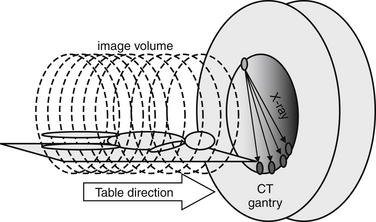
Figure 7-7 Multidetector, helical computed tomography (CT).
An x-ray source and multiple x-ray detectors rotate helically around the patient to acquire a volume of image data. All modern scanners use this technology, so requesting a spiral CT for diagnosis of pulmonary embolism is not necessary. A 4-detector CT is shown, but CT scanners with 16, 32, 64, or 256 detectors are commonly available today.
On CT, the density of tissues is measured in Hounsfield units (HU). Air has a density of −1000 HU, water 0 HU, and bone + 1000 HU. Fat, being less dense than water but denser than air, has a value of approximately −50 HU. Soft tissues such as muscle are somewhat denser than water and have an approximate value of +40 HU to +100 HU. A gray scale is then assigned spanning the range of densities, with the densest structures appearing white and the least dense appearing black. This gray scale can be shifted to accentuate tissues of interest. For example, if the user is interested in viewing details of bone, the computer reassigns the entire gray scale to values just below +1000 HU, allowing differentiation of subtle detail within bone. Detail of other structures is not visible on this setting, because all soft-tissue structures appear a fairly uniform gray whereas air remains black. If the user is interested in viewing lung detail, the gray scale is assigned to values near −1000 HU to accentuate details of low-density lung. Details of bone would be obscured on this setting, because all structures that are significantly denser than air would appear white. Most modern computerized picture archiving and communication systems (PACSs) allow the user to select from a list of useful preset variations in the gray scale, or windows. Typical window settings are lung, soft tissue (sometimes called vascular, chest–abdomen, or mediastinal), and bone. Most findings described in this chapter are seen best on soft tissue window settings, because these highlight detail of soft tissues and blood vessels. Some findings are seen best on lung windows, and these are specifically pointed out in the text and figure legends. Examples of window settings are shown in Figure 7-8.
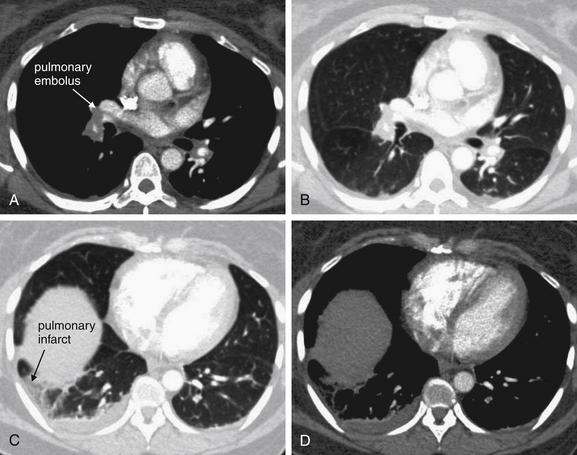
Figure 7-8 Window settings highlight pathology: CT pulmonary angiography.
All images are from same patient with pulmonary embolism (PE) and pulmonary infarct. The PE is easily visible on soft tissue window (A) but not on lung window (B). The parenchymal changes of the resulting infarcted lung are visible on lung window (C) but not on soft tissue window (D). These findings are described further in later figures.
How Does CT Pulmonary Angiography Detect Pulmonary Embolism?
As described earlier, traditional pulmonary angiography uses contrast material injected through a catheter in the main pulmonary artery to fill the pulmonary arterial tree. A filling “defect,” or location where contrast fails to fill a vessel lumen, marks the presence of a PE (see Figures 7-4 and 7-5). CT pulmonary angiography relies on the same principle of filling defects in a stream of injected contrast (Figures 7-9 and 7-10). The technique can be augmented by acquiring additional CT images of the pelvis and lower extremities to assess for clot in these locations, a test called CT venography (discussed later in this chapter). Contrast material is injected, usually peripherally through a catheter in the antecubital fossa. For CT pulmonary angiography, the CT acquisition is timed in an attempt to coincide with the arrival of the contrast bolus in the pulmonary arteries, after it has first traversed veins of the upper extremity, the subclavian vein, the superior vena cava, and the right atrium and ventricle (Figure 7-11). An ideal scan is achieved with a rapid contrast bolus and perfect timing of the scan. A poor contrast bolus may fail to fill the pulmonary arteries, limiting diagnostic accuracy. A poor contrast bolus may cause either a false-negative or a false-positive result. In some cases, a vessel that is partially filled with contrast may simulate the filling defect of a PE, causing a false-positive result. More often, PEs may be missed because they are not visible unless surrounded by a bright bolus of contrast (Figure 7-12) (a noncontrast chest CT is therefore not useful to assess for PE). A poorly timed scan may result in an image in which the pulmonary arteries are poorly opacified with contrast, because the contrast bolus has not yet reached or has already passed through the pulmonary arteries. Today, automated bolus tracking software improves the timing of the bolus. A technician injects a small test bolus of contrast, and CT images at the level of the main pulmonary artery are acquired over a few seconds. Enhancement of the pulmonary artery is measured over this time interval, allowing selection of the optimal timing of the full contrast injection and complete CT scan (see Fig. 7-12).
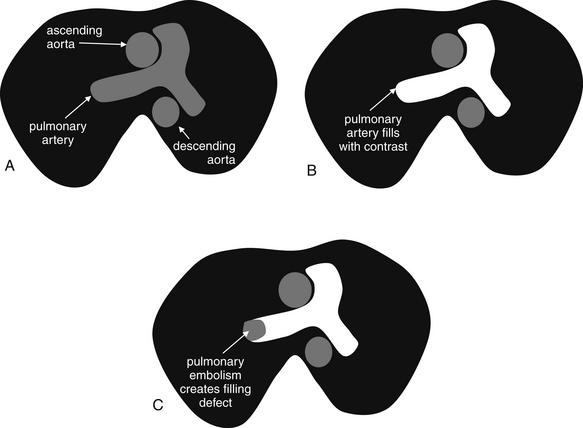
Figure 7-9 Computed tomography (CT) pulmonary angiography: Schematic of axial CT images.
Pulmonary embolism (PE) is detected on CT scan by rapid injection of contrast. The dense contrast fills the pulmonary arteries, except where PE creates a “filling defect.” Filling defects in the central pulmonary arteries are relatively easy to recognize, whereas distal branch vessels can be more difficult to evaluate because of their small size. Noncontrast CT is not useful for detection of PE, because liquid blood and thrombus share the same soft-tissue density. A, Noncontrast CT shows the aorta and main pulmonary artery filled with liquid blood, which has a dark gray appearance. B, Contrast has been injected, and the main pulmonary artery fills completely with contrast, eliminating the possibility of a thrombus in this location. C, A filling defect is present, where no contrast has filled the right pulmonary artery because of the presence of thrombus—a PE. Thrombi can have almost any shape, from irregular “blobs” to well-formed casts of the vessels from which they originate. It is common for some contrast to flow around thrombi, although in some cases they fully occlude the vessel in which they come to rest.
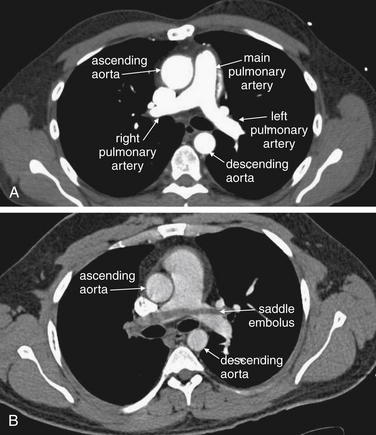
Figure 7-10 Computed tomography (CT) pulmonary angiography: Axial images.
Compare these images with the schematic in Figure 7-9. A, A normal pulmonary artery fills completely with contrast. There are no filling defects to suggest pulmonary embolus. B, The stream of contrast is interrupted by a filling defect. This fully obstructs the right pulmonary artery and crosses through the left pulmonary artery—a “saddle” pulmonary embolus. An unenhanced CT cannot be used to identify pulmonary emboli, as the densities of thrombus and liquid blood are nearly identical without the use of injected contrast (see Figure 7-12).
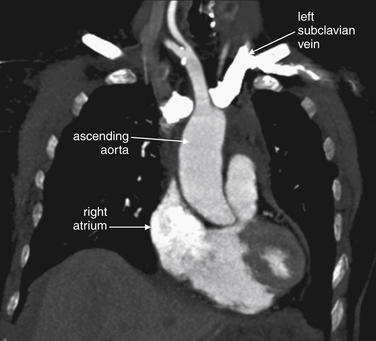
Figure 7-11 Contrast timing for computed tomography (CT) pulmonary angiography.
Coronal CT image, demonstrating the effect of contrast timing on scan quality. In this patient, a contrast bolus (white) is present in the left subclavian vein and has reached the right atrium. The ascending aorta is not as well opacified with contrast. An optimal scan for aortic pathology or pulmonary embolism is timed so that the contrast bolus is in the vessel of interest at the time of the scan.
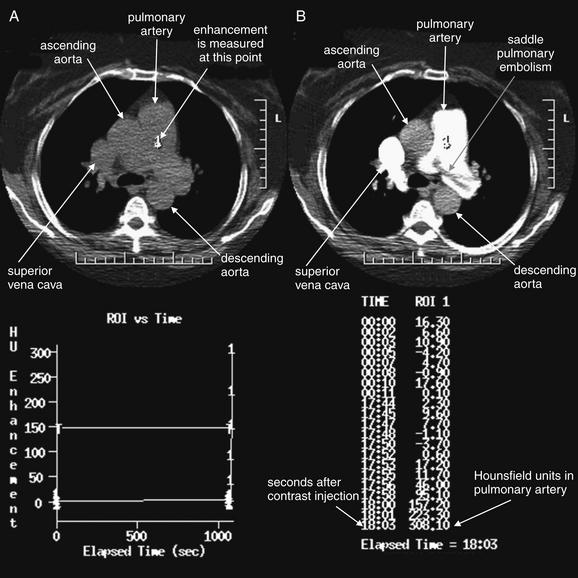
Figure 7-12 Contrast timing for computed tomography (CT) pulmonary angiography.
This image dramatically displays why contrast is essential for the detection of pulmonary embolism (PE) and why timing of contrast is critical. A, No contrast has been given, and the pulmonary artery appears uniform. B, Contrast fills the pulmonary artery, and a huge saddle PE becomes visible. Automated contrast bolus tracking software is used to determine the optimal timing of the CT image acquisition, relative to the moment of contrast injection. A small test bolus of contrast is injected, and the intensity of enhancement in the pulmonary artery is measured over several seconds. In the bottom half of the figure, the software displays a graph and table of the Hounsfield unit enhancement versus time. The full CT scan is then performed using the time interval that produced the desired degree of enhancement. Studies in the radiology literature have clarified the degree of enhancement needed for a diagnostic scan.
Small-caliber catheters and distally placed catheters (in the hand, wrist, or forearm) may result in a suboptimal contrast bolus and a nondiagnostic scan. A discussion of flow rates through peripheral catheters is given in Chapter 4 in the context of cervical CT angiography. An optimal contrast bolus requires an automated pressure injector, with an injection rate of around 4 to 5 mL per second. Phantom studies show that peripheral catheters as small as 20 gauge allow adequate contrast injection rates without exceeding safe pressure limits.25 Many institutions bar the use of central venous catheters with power injectors because of theoretical concerns of embolization of catheter fragments. Embolization has also been described with peripheral venous catheters, but this appears to be a much rarer event.26 Embolization occurs because of mechanical fragmentation of a catheter subjected to high pressures. Central venous catheters may be subject to fragmentation more than are peripheral catheters because of their length, which causes a linear increase in resistance to flow. In addition, a central catheter’s tip usually lies in the superior vena cava, with little obstruction to embolization of a fragment. In contrast, a peripheral catheter fragment may be prevented from embolizing because of valves in peripheral veins. Despite these concerns, a number of studies suggest that pressure injection through central venous catheters is safe.27-29 Some newer permanent and emergency devices are designed for high-pressure, rapid infusion. Examples include PowerPort and PowerLine, Bard Access Systems, which can tolerate 300 psi with a 5 mL per second maximum infusion rate (information from the manufacturer’s website).
What Are the Diagnostic Findings of Pulmonary Embolism on CT Pulmonary Angiography?
Large pulmonary emboli may be recognized easily by familiarity with a few basic points. Box 7-2 outlines a simple approach to CT interpretation for PE. Figures 7-9 and 7-10 depict classic findings of PE on CT scan. On CT, a normal pulmonary artery fills with contrast and appears bright white when viewed with soft-tissue windows. A PE within the vessel displaces contrast, creating a filling defect, which appears as a dark gray region within the vessel. The majority of pulmonary emboli occur within a few bifurcations of the main pulmonary artery, so inspection of the central pulmonary arteries may allow detection of PE in many cases. In one study, 51% of pulmonary emboli were found in central or lobar vessels, and 27% were in segmental vessels. In only 22% were isolated subsegmental vessels involved.30 More distal vessel branches may be more difficult to interpret because of their small size and the quality of the contrast bolus. Start your interpretation with inspection of the main pulmonary artery and its branches, because emboli in this location are both common and easily recognized (Figures 7-13 through 7-28). Inspect for saddle pulmonary emboli (see Figures 7-10, 7-13, and 7-15) and right atrial and ventricular abnormalities (see Figures 7-16 and 7-17).
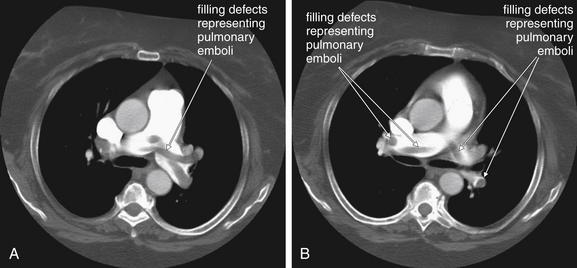
Figure 7-13 Pulmonary embolism (PE): Saddle embolus on CT pulmonary angiography.
The main pulmonary arteries are a simple place to start when interpreting computed tomography (CT) for PE, as the anatomy is easily recognized and large clots are readily seen. A, B, Two axial CT images through the level of the main pulmonary artery. This 66-year-old female with a previous history of PE became short of breath while grocery shopping. Her vital signs were stable on emergency department arrival (blood pressure 143/75, heart rate 109 bpm, oxygen saturation 100% on 2 L). Her CT shows a remarkable saddle PE, with perfectly formed casts of the vessels from which the clots originated. Some of these are seen in long axis and have a tubular shape. Others are seen in cross section and appear circular.
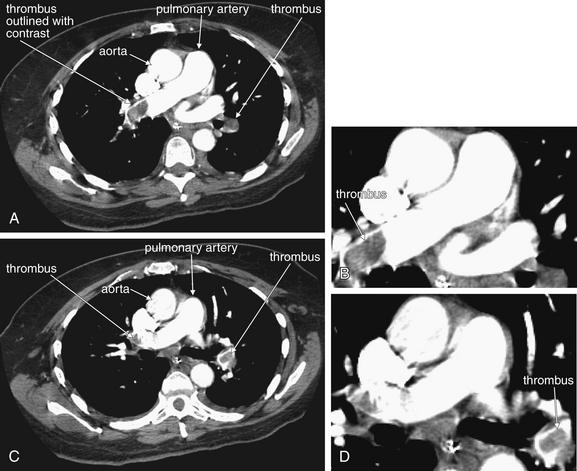
Figure 7-14 Pulmonary embolism: Multiple and bilateral emboli on CT pulmonary angiography.
This 51-year-old female with metastatic ovarian cancer presented with dyspnea and pleuritic chest pain. A large filling defect is present in the right main pulmonary artery, surrounded by a thin stream of contrast. A large thrombus is also visible in a branch of the left pulmonary artery, again surrounded by contrast. A, C, Axial computed tomography images. B, Close-up from A. D, Close-up from C.
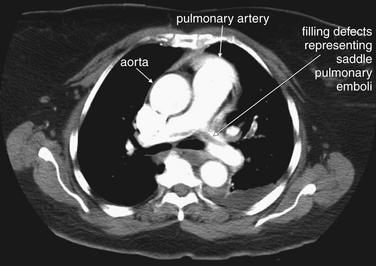
Figure 7-15 Pulmonary embolism (PE): Saddle embolus with enlarged right ventricle on CT pulmonary angiography.
This 73-year-old female had recently undergone total knee arthroplasty when she experienced syncope and was found to have a systolic blood pressure of 80 mm Hg with tachycardia and hypoxia to 80% on room air. Her CT shows a large saddle PE. The patient underwent pulmonary angiography (see Figure 7-5) and thrombectomy. Her CT also showed right ventricular enlargement (See Figure 7-16).
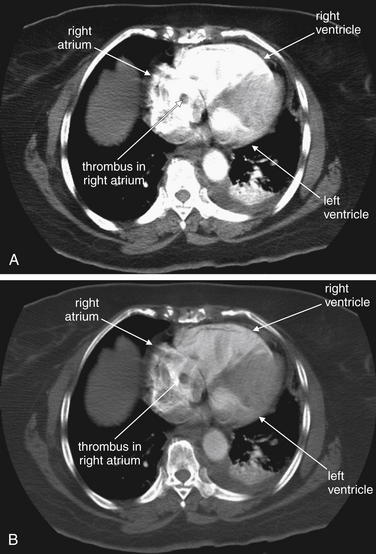
Figure 7-16 Pulmonary embolism (PE): Saddle embolus with enlarged right ventricle on CT pulmonary angiography.
Same patient as Figure 7-15. Her CT showed a large saddle PE (prior figure). In addition, sections through the right atrium and ventricle showed enlargement of these chambers and filling defects suggesting thrombus in these chambers. Note the tubular and rounded cross sections, which could correspond to thrombus casts of lower extremity veins. A, B, Same slice with window settings adjusted to highlight clot and cardiac chamber anatomy.
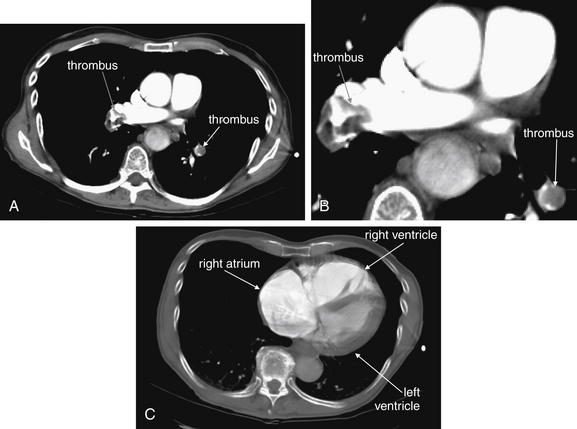
Figure 7-17 Pulmonary embolism: Large bilateral PE with right ventricular enlargement on CT pulmonary angiography and echocardiogram.
This 79-year-old male with a history of pancreatic cancer experienced sudden dyspnea and presyncope while in the shower. Paramedics found the patient to be hypoxic to 80% oxygen saturation on room air with a systolic blood pressure of 80 mm Hg. The patient was noted to have bilateral large pulmonary emboli on CT (A; B, close-up). In addition, the right atrium and ventricle were noted to be dilated (C), concerning for right heart strain. This was confirmed on echocardiogram. C, The CT window has been adjusted to allow the internal structure of the heart to be better appreciated—the setting is closer to a normal bone window. Note the massive right atrium. The right ventricle is as large as the left.
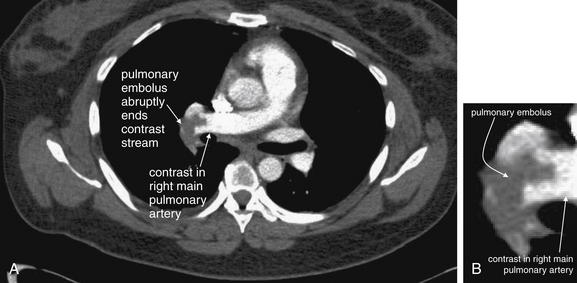
Figure 7-18 Right main pulmonary artery embolus: Axial CT pulmonary angiography image.
A, A filling defect representing a pulmonary embolus obstructs contrast flow in the right main pulmonary artery. B, Close-up.
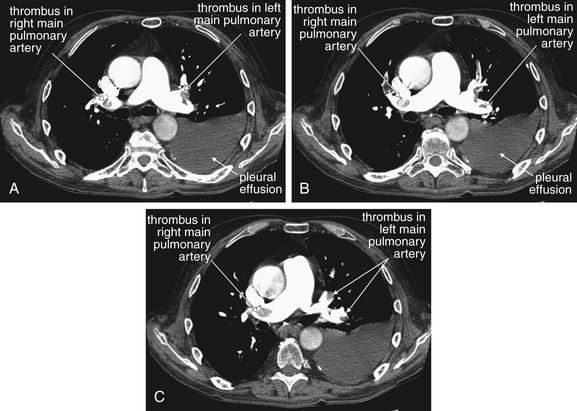
Figure 7-19 Pulmonary embolism: Emboli in main pulmonary arteries on CT pulmonary angiography.
This 68-year-old male with esophageal cancer presented with an acute syncope episode and less acutely worsening dyspnea. A to C, Consecutive axial images through the level of the main pulmonary artery. These computed tomography slices show multiple filling defects characteristic of pulmonary emboli. Although these appear somehow suspended in the middle of the lumen of the pulmonary artery, remember that you are looking at individual slices through a larger three-dimensional structure. The thrombus may be caught on a vessel bifurcation and dangling like a streamer in the current. Learn the appearance of these large main pulmonary artery clots. These are easiest to recognize, but peripheral clots share the same features. These thrombi are dark filling voids within a contrast-filled vessel. They are not fully occlusive, more like pieces of Jell-O than like a cork in a wine bottle. It is common to see contrast outlining the margins of a thrombus. This will help you confirm that the filling defect is within the vessel, not outside of a vessel that is leaving the plane of the image.
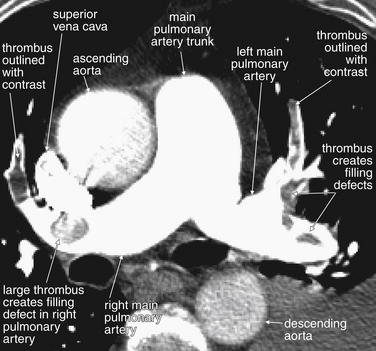
Figure 7-20 Pulmonary embolism in main pulmonary arteries on CT pulmonary angiography.
Same patient as Figure 7-19. Look in closer detail at the main pulmonary artery, which is nicely seen with both major branches in this image. In the right main pulmonary artery, a large thrombus is visible. Just distal to this, the artery curves anteriorly and another thrombus is seen, outlined with a thin ribbon of contrast on each side. This is called “railroad tracking” and is a common feature of pulmonary emboli. In the left main pulmonary artery, a strand of thrombus is caught at a major bifurcation. The embolus winds in and out of the plane of the image and appears as several filling defects. Inspection of adjacent image slices would prove these to be part of the same long segment of clot. Again, railroad tracking surrounds the anterior portion of the clot.
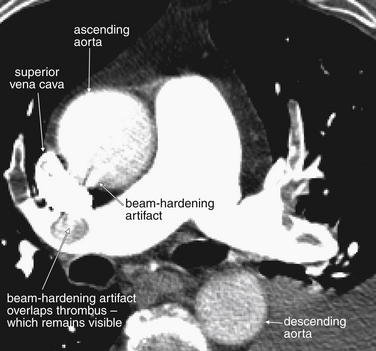
Figure 7-21 Artifacts on CT pulmonary angiography.
Same patient as Figure 7-20. Look in closer detail at the main pulmonary artery and its neighboring structures. The superior vena cava is visible as a bright kidney bean shape. It is so bright because of the continued injection of intravenous contrast that it is creating “beam-hardening artifact,” which produces a sunburst pattern emanating from the superior vena cava. This sunburst is slightly overlapping the adjacent structures, interfering with their visualization. The pulmonary artery is well opacified with contrast, which has traveled through the superior vena cava, mixed with blood in the right atrium, and then been ejected by the right ventricle into the main pulmonary trunk and its branches. A moderate amount of contrast fills the ascending aorta, while less has reached the descending aorta. For the purposes of this imaging study, which seeks to evaluate filling defects in the pulmonary arteries, this is fine—but this would be a suboptimal study for evaluation of aortic dissection.
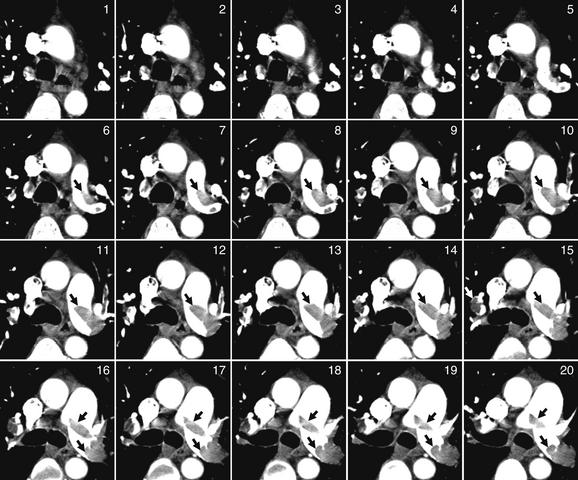
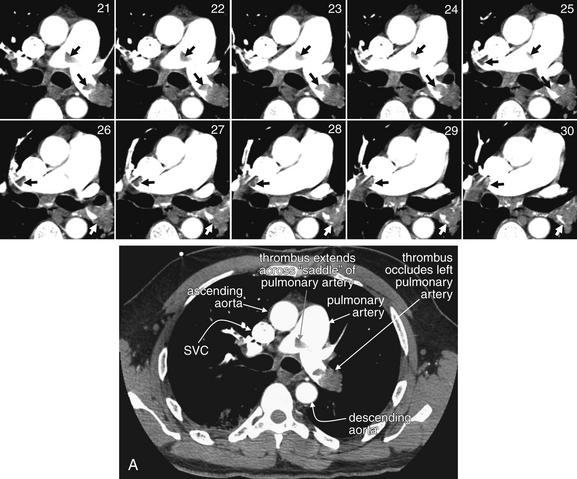
Figure 7-22 Pulmonary embolism (PE) in bilateral main pulmonary arteries on CT pulmonary angiography.
This 50-year-old female developed acute dyspnea, pleuritic right chest pain, and syncope after a 3-day prodrome of left leg pain. A single image complete image (A) is shown for orientation, which is the same as usual for CT (patient’s right is on left side of image). Coned-in views of the main pulmonary artery are also shown to allow you to follow the thrombus from slice to slice. The close-up corresponding to the complete computed tomography slice is number 21. Although it cannot be seen in its entirety in a single slice, a saddle PE occludes much of the left pulmonary artery and extends across to the right. Arrows point out the thrombus in some images.
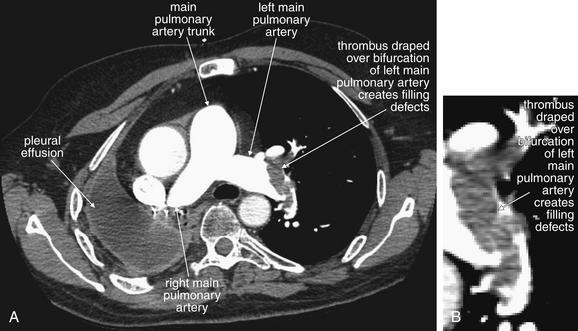
Figure 7-23 Pulmonary embolism in left main pulmonary artery on CT pulmonary angiography.
This 58-year-old male with metastatic lung cancer presented with acute chest tightness and dyspnea. The patient described himself as “gasping for air.” Again, a large central pulmonary embolus is seen as a filling defect, lodged at a bifurcation of the left main pulmonary artery. B, Close-up.
Figure 7-24 Pulmonary embolism (PE) in left main pulmonary artery on CT pulmonary angiography.
Same patient as Figure 7-23. Some institutions routinely perform multiplanar reconstructions to further characterize PE. In equivocal cases, these may help to delineate true thrombus from various artifacts. In this patient, the diagnosis of PE is unequivocal, but additional reconstructions are shown to illustrate their capabilities. This oblique coronal view shows the left pulmonary artery, filled with an amorphous clot. As in other figures, the clot is seen to partially occlude the vessel with a thin rim of surrounding contrast.
Figure 7-25 Pulmonary embolism (PE) in left main pulmonary artery on CT pulmonary angiography, sagittal view.
Same patient as Figure 7-24. This sagittal view shows the left pulmonary artery, again with clot partially occluding the vessel. A circular rim of contrast surrounds the clot in some locations. This is a common appearance that should be recognized.
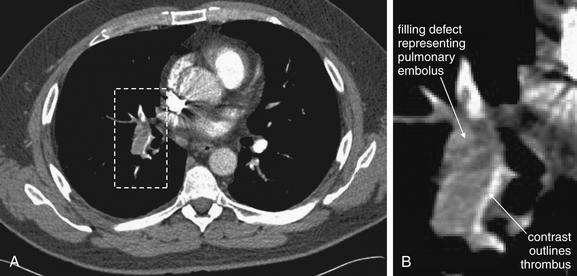
Figure 7-26 Railroad track sign of pulmonary embolism: Axial CT pulmonary angiography images.
Pulmonary emboli often do not fully occlude a vessel. Contrast may be seen leaking around the periphery of a thrombus, helping to identify a true filling defect within a pulmonary artery. A, A filling defect representing a pulmonary embolus obstructs contrast flow in a segmental pulmonary artery. Contrast can be seen leaking around the thrombus, sometimes called the railroad track sign. B, Close-up.
Figure 7-27 Right main pulmonary artery embolus: Coronal CT pulmonary angiography image.
A, Coronal view of the same patient as in Figure 7-26. Multiplanar images can clarify the diagnosis when a filling defect is suspected on axial images. Sometimes the additional images will reveal the suspected thrombus to be a structure outside the blood vessel—for example, an adjacent lymph node. Here, a filling defect representing a pulmonary embolus obstructs contrast flow in the right main pulmonary artery. Contrast can be seen leaking around and through the thrombus, a variation of the railroad track sign. B, Close-up. The window setting has been adjusted to decrease the brightness of the contrast bolus from that seen with soft tissue windows. Excessively bright contrast can create “bloom artifact” that obscures adjacent tissues including thrombus. Bone windows minimize this effect while allowing evaluation of contrast-filled vascular structures. Some PACS interfaces have preset optimized “vascular window” settings. Others allow the user to adjust and then save window settings.
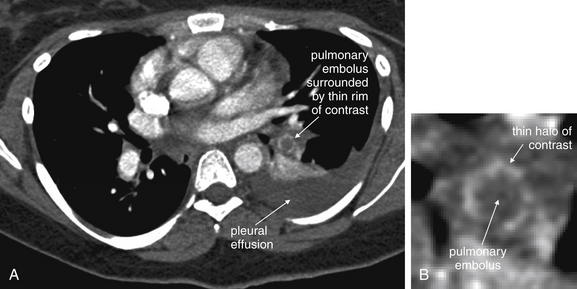
Figure 7-28 Segmental pulmonary embolism, CT pulmonary angiography.
A, A filling defect representing a pulmonary embolus is visible in a segmental artery to the left lower lung segment. Contrast leaking around the thrombus is visible as a white halo around the thrombus, which appears as a dark circle in cross section. A pleural effusion is also present (dark gray “fluid density” on soft tissue windows). B, Close-up.
Several additional pieces of information may be helpful in the evaluation of the scan. First, pulmonary emboli are more common in vessels in lower lung segments (58% of cases), and these should be carefully inspected.30
Second, many pulmonary emboli do not completely obstruct the vessel, and a characteristic appearance of contrast leaking around the embolus is often seen (Figures 7-23 through 7-28).30 A possible pulmonary embolus seen on one axial image should be tracked through multiple adjacent images to confirm or refute the finding (Figures 7-22 and 7-29; see also Figure 7-36). Coronal and sagittal plane images can also assist in this evaluation (see Figures 7-25 and 7-27).
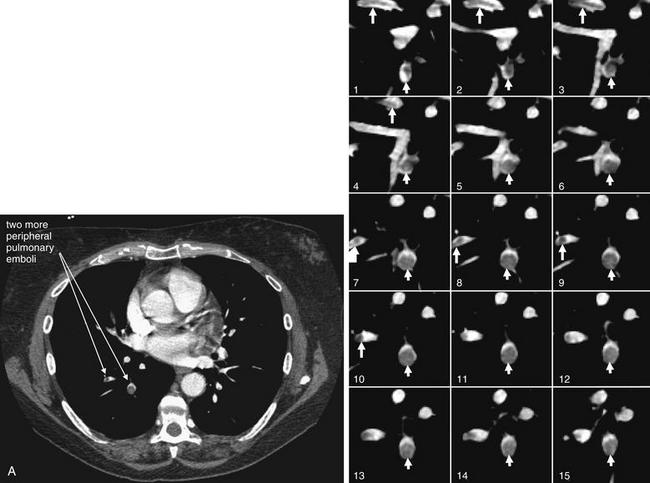
Figure 7-29 Pulmonary embolism, multilobar, seen with CT pulmonary angiography.
This 54-year-old woman with recurrent ovarian cancer presented with progressive dyspnea over a 2-week period. The patient has pulmonary emboli involving more distal branches of the pulmonary arteries than those that we have considered previously. A single complete slice (A) is shown to illustrate one of the affected vessels in context. The series of coned-in images then tracks that vessel through the adjacent slices. The close-up corresponding to the full slice is number 9. Some vessels are seen in short-axis cross section and have a circular appearance with circular clot. Other vessels are seen in long-axis cross section and contain clot that appears linear. Arrows have been placed to assist you in following a vessel and thrombus through multiple slices.
Third, inspection of lung windows may aid in the detection of PE. As stated earlier, selecting lung windows simply refers to picking a default setting on a PACS that shifts the CT gray scale to accentuate the fine detail of low-density tissues such as lung. On lung
Box 7-2 Algorithm for Interpreting CT for Pulmonary Embolism
window settings, parenchymal abnormalities such as linear atelectasis and wedge-shaped peripheral opacities (representing infarcts) may be visible. Figures 7-30 through 7-42 demonstrate these CT lung window abnormalities, as well as the corresponding CT soft tissue window and chest x-ray findings. Once a parenchymal abnormality is noted on lung windows, the viewer should return to soft tissue window settings, where inspection of the vessels leading to the abnormal lung segment may reveal a PE. This step is necessary to differentiate pulmonary infarct, because a parenchymal density may also represent pneumonia or mass. Pleural effusions may be helpful in detection of a PE by pointing to a lung region of concern, but they are equally common in patients with and without PE, and their presence should not be interpreted as confirming PE.30

Figure 7-30 Pulmonary infarction: Axial computed tomography (CT) image.
CT lung window in a patient with pulmonary embolism. A wedge-shaped, peripheral, pleural-based parenchymal density is visible in the right lung. This is the CT correlate of the classic x-ray finding, Hampton’s hump. An adjacent pleural effusion is present. The dome of the liver is visible, because this is a slice through the lower thorax. Although the lung window can suggest pulmonary infarct, the appearance is also consistent with pneumonia, so the soft tissue window must be inspected to identify thrombus in a vessel supplying that lung region. The clot causing a parenchymal infarct may not be visible on the same slice, so inspect all slices.
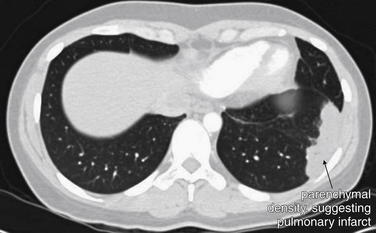
Figure 7-31 Pulmonary infarction, subacute: Axial computed tomography (CT) image.
A CT lung window demonstrates a peripheral, pleural-based density in the left lung—the CT analogue of Hampton’s hump. This patient presented nearly 1 month after an acute episode of pleuritic chest pain and dyspnea after an airplane trip. No filling defect was visible on any of the soft tissue window slices, presumably because of spontaneous lysis of a pulmonary embolus. In the right clinical context, this finding is compatible with pulmonary infarct from pulmonary embolus—but pneumonia or mass lesions can give a similar CT appearance, so inspection of the soft tissue window remains important.
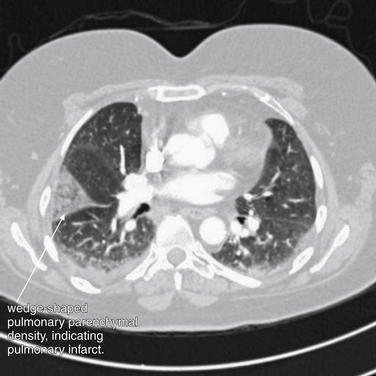
Figure 7-32 Pulmonary embolism (PE): Hampton’s hump.
Computed tomography scan from the patient in Figure 7-3. A lung window demonstrates the same wedge-shaped peripheral density seen on the patient’s chest x-ray. This pulmonary infarct is in the watershed of the pulmonary artery obstructed by thrombus, a PE. Soft-tissue windows showing the PE are reviewed in Figure 7-33.
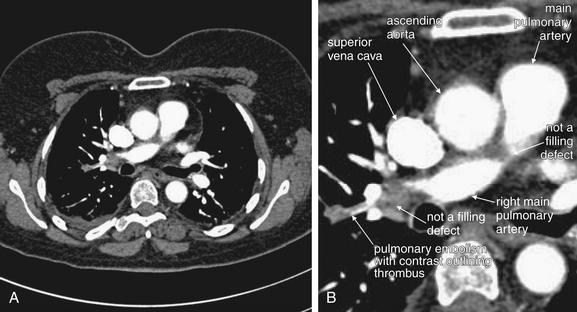
Figure 7-33 Pulmonary embolism (PE): Hampton’s hump.
Same CT pulmonary angiogram as Figure 7-32. A, Soft-tissue window. B, Close-up. A PE is present in a branch pulmonary artery, seen in long-axis cross section. This thrombus is outlined in contrast, a common finding sometimes called railroad tracking in the radiology literature. Interpreting chest CT for PE requires some getting used to. This figure has two other regions that appear to be occlusions on this single image, but review of adjacent images proves that these densities lie outside of the pulmonary artery. Novice readers might be deceived by the manner in which the pulmonary artery moves in and out of the plane of this image. We review many more examples that clarify this.
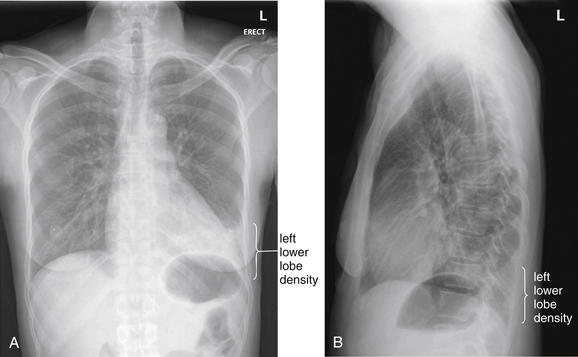
Figure 7-34 Pulmonary embolism (PE) with visible infarct on chest x-ray.
This 48-year-old female presented with sudden onset of pleuritic pain along her left costal margin with dyspnea and hemoptysis. She had experienced some cough the prior 2 weeks. A left lower lobe opacity was noted on chest x-ray and is visible on both posterior–anterior (PA) (A) and lateral (B) views. The upper surface of the left diaphragm is obscured on the PA x-ray, and increased density overlies the heart on this view. On the lateral x-ray, the thoracic spine fails to become darker approaching the diaphragm (as is normal) because of the overlying lung density. This was interpreted as likely pneumonia by the radiologist. PE was suspected based on the sudden onset of symptoms, and CT pulmonary angiography was performed (Figure 7-35). Remember that pneumonia and pulmonary infarct are indistinguishable on chest x-ray.
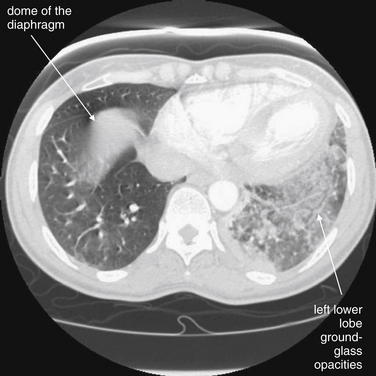
Figure 7-35 Pulmonary embolism (PE) with visible infarct on chest x-ray.
This computed tomography (CT) image (viewed on lung window settings) shows the same infiltrate as in the chest x-ray in Figure 7-34. Compare the normal right lung with the left lung, which shows a patchy, ground-glass appearance. This appearance can be caused by pulmonary infarction and hemorrhage (as in this case), atypical infection, or aspiration. The right lung has a central density, but this is the dome of the diaphragm or uppermost liver, because this slice is taken low in the chest near the upper abdomen. The critical teaching point is that chest x-ray findings suggesting pneumonia may represent pulmonary infarction. When PE is strongly suspected, chest CT should be performed to further evaluate the patient. Ventilation–perfusion (VQ) scan may be less helpful in this scenario, because an infiltrate on chest x-ray would likely result in a ventilation defect with a matched perfusion defect on a VQ scan—by definition, an intermediate probability scan for PE. VQ could be diagnostic if additional unmatched perfusion defects are found. The soft-tissue windows are shown in Figure 7-36 and confirm PE. Interestingly, the patient was found to be hyperthyroid and thrombocytopenic, perhaps contributing to pulmonary hemorrhage.
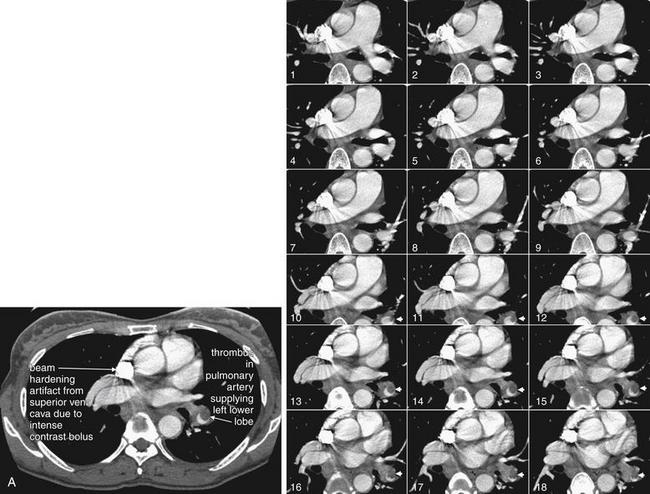
Figure 7-36 CT pulmonary angiogram from patient with visible pulmonary infarct on chest x-ray.
Same patient as Figures 7-34 and 7-35, soft-tissue windows. A single complete slice is shown for orientation (A), corresponding to image number 14. Coned-in views of the main pulmonary arteries are shown to allow these vessels to be tracked through multiple slices. A large thrombus is seen in short-axis cross section, giving it a circular appearance. A crescent of contrast is seen partially outlining this thrombus, which does not completely fill the vessel at this level. The thrombus is a tubular cast of the vessel from which it originated and is visible on several adjacent slices because of its length. This thrombus lies in the pulmonary artery supplying the left lower lobe, explaining the infarct in that location. The superior vena cava is filled with very dense contrast, creating beam-hardening (streak) artifact with a sunburst appearance overlying adjacent structures.
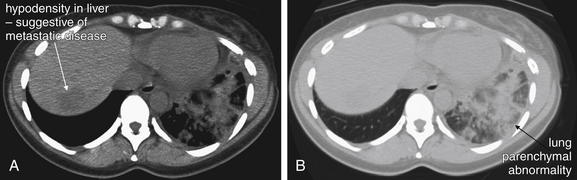
Figure 7-37 Pulmonary embolism (PE), massive: Visible infarct on noncontrast “renal protocol” computed tomography (CT).
This 42-year-old female presented with left flank pain and cough. She had recently been diagnosed with likely lung cancer but had not undergone biopsy or other workup or treatment. The initial evaluation by the emergency physician suggested renal colic, and a noncontrast abdominal CT was performed. A, Soft-tissue window. B, Lung window for the same slice. The cephaladmost slices from abdominal CT routinely include the lower lung, and on the lung window a left lower lobe density was noted—interpreted appropriately by the radiologist as “heterogeneous opacities in the left lower lung, which may be the result of infection, aspiration, or spread of malignancy.” However, another explanation for this appearance is pulmonary infarction from PE. The emergency physician obtained chest x-ray that also showed an appearance consistent with infiltrate (Figure 7-38). With this apparent diagnosis in hand based on imaging, the patient was admitted to an observation unit and treated for pneumonia. The next morning, PE was considered and confirmed by contrasted chest CT. The take-home point is that the appearance of pulmonary infarction and pneumonia can be identical on chest x-ray and CT lung window. In both cases, the density of lung tissue increases because of the presence of fluid, cellular debris, inflammatory cells, and possibly alveolar hemorrhage. When the clinical history suggests PE, the presence of an infiltrate on chest x-ray or CT is not diagnostic of pneumonia and does not rule out PE. Compare with the chest x-ray in Figure 7-38 and the CT pulmonary angiogram in Figure 7-39.
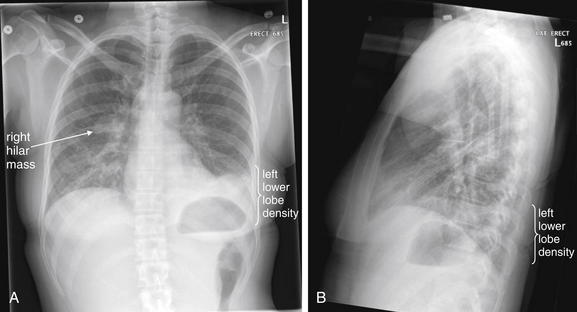
Figure 7-38 Pulmonary embolism (PE) chest x-ray.
Following the noncontrast abdominal CT in Figure 7-37, the patient underwent chest x-ray, showing increased density in the left lower lobe. The diaphragm and left heart border are obscured on the posterior–anterior x-ray (A), and the retrocardiac space appears abnormally dense on the lateral view (B) (the “spine sign”—absence of the normal progressive lucency of the thoracic spine as it approaches the diaphragm). These abnormalities were interpreted as evidence of pneumonia by the emergency physician, though they were the result pulmonary infarction from PE (see Figure 7-39). The radiologist suggested infection, edema, or atelectasis but did not mention infarction. Pulmonary infarction and infectious infiltrate can have identical appearances on chest x-ray. The patient also has a known right hilar mass. Compare with the noncontrast CT in Figure 7-37 and the CT pulmonary angiogram in Figure 7-39.
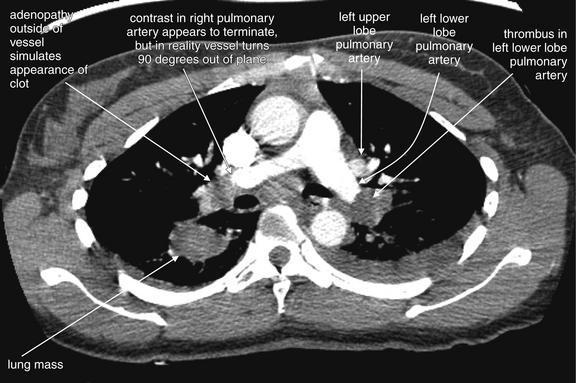
Figure 7-39 Pulmonary embolism with visible infarct.
Same patient as in Figures 7-37 and 7-38. CT pulmonary angiography demonstrates a filling defect completely obstructing the left lower lobe pulmonary artery. On the right, a lung mass is seen, and hilar adenopathy adjacent to the right main pulmonary artery is seen. How can you distinguish a mass adjacent to the artery from a clot within? In some cases, they may be indistinguishable, but often inspection of several adjacent slices can allow the two to be discriminated. Thrombus and adenopathy or other soft-tissue masses share the same dark gray (soft-tissue density) on soft-tissue windows. Therefore it is not the color that should be relied upon. Instead, follow the vessel in question through several slices to determine whether the apparent cutoff is simply the result of the vessel turning and traveling outside of the plane of the single CT slice. If the contrast-filled vessel can be followed through several slices, the soft-tissue mass is likely extrinsic to the vessel. If the vessel does not appear to be filled with contrast in adjacent slices, the soft-tissue density is likely thrombus within the vessel—a pulmonary embolus. The next figure shows a series of coned-in views to allow you to see the distinction between thrombus and soft-tissue mass external to the vessel.
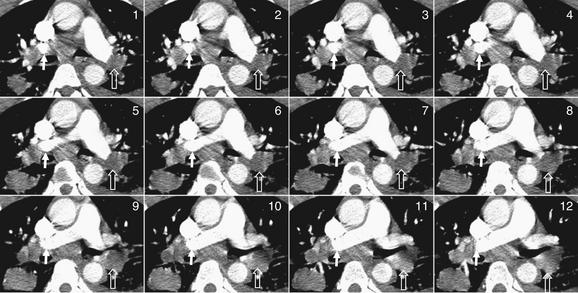
Figure 7-40 Pulmonary embolism (PE): Distinguishing adenopathy from thrombus.
Image number 6 corresponds to the full computed tomography image in Figure 7-39—review that figure before proceeding with this one. Start with image 1 in the top left and track the normal right pulmonary artery (marked by a white arrow) as it turns and is visible as a contrast-filled circular cross section in several slices. It then is visible in long-axis section and merges into the pulmonary trunk. In none of the slices shown is it obstructed with thrombus. However, a lymph node outside of the vessel is easily mistaken for a PE. Now follow the left pulmonary artery (marked by an open arrow), and you will see that it remains obstructed in several adjacent slices. A branch to the right upper lobe diverges, but the branch to the left lower lobe (open arrow) remains obstructed in every slice and does not fill with contrast. Cases such as this are common and require careful attention by the radiologist to avoid misdiagnosis.
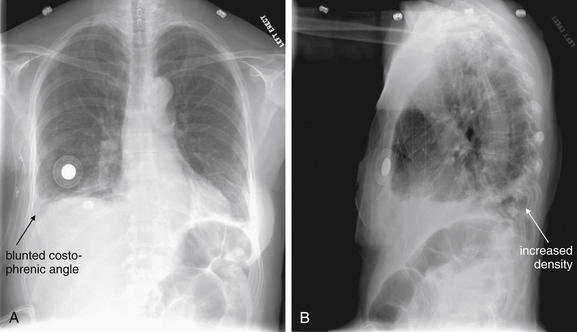
Figure 7-41 Pulmonary embolism (PE), massive.
This 63-year-old female underwent mastectomy for breast cancer 5 days prior and awoke with pleuritic right chest pain and dyspnea. Her chest x-ray shows a blunted right costophrenic angle on the right on the posterior–anterior view (A) and increased density on the lateral view (B). PE was suspected, and CT pulmonary angiography was performed (Figure 7-42).
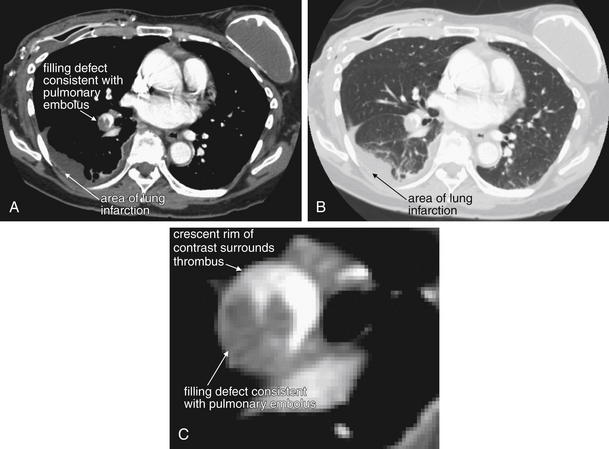
Figure 7-42 Pulmonary embolism (PE), massive.
These CT pulmonary angiography images show a filling defect in the right lower lobe pulmonary artery, a PE. The watershed region of lung supplied by this vessel is infarcted, resulting in increased density on chest computed tomography and in the chest x-ray in Figure 7-41. A, Soft-tissue window. B, Lung window of the same slice. C, Close-up from A showing the thrombus in more detail.
False-positive and false-negative CT pulmonary angiography results may occur due a number of factors. A poor contrast bolus may not opacify the pulmonary arteries sufficiently to allow the filling defect of a pulmonary embolus to be recognized. Ironically, a very dense contrast bolus can also lead to misdiagnosis because of streak artifact that can obscure thrombus (see Figures 7-21, 7-36, and 7-47). A slow scanner or an extremely tachypneic patient may result in a false-negative or nondiagnostic scan because of excessive motion artifact. Lymph nodes immediately adjacent to blood vessels appear dark gray and may be mistaken for pulmonary emboli by inexperienced readers. A blood vessel compressed by an adjacent structure such as a lymph node, airway, or mass may have an irregular contour that may be mistaken for the filling defect of a PE. Extremely obese patients may have poor-quality scans resulting from underpenetration of radiation.30 Intentional inspiration and “breath hold” immediately before CT acquisition can introduce an artifact leading to false-positive interpretation by the following mechanism. With slower CT scanners, the patient is often instructed to take a deep breath and then to stop breathing during the scan to reduce motion artifact. Deep inspiration results in a sudden decrease in intrathoracic pressure, pulling noncontrasted blood into the right heart from the inferior vena cava. This can result in indeterminate or false-positive interpretation in a minority of cases, because the noncontrasted blood (which appears dark gray) may be mistaken for the filling defect of a PE.31 Ironically, faster scanners might worsen this artifact if deep inspiration is encouraged, because the entire CT acquisition occurs rapidly during the peak of the effect of inspiration.
Do CT Findings Predict Acute Morbidity and Mortality from Pulmonary Embolism?
A number of scoring systems have been proposed for severity of PE by CT. Surprisingly, saddle PE does not predict high mortality.32 CT can detect physiologic consequences of massive PE such as right ventricular dilatation, ventricular septal bowing, and decreased size of the left atrium and pulmonary veins from decreased pulmonary venous return.33-35 To date, studies are equivocal, with some suggesting that CT evidence of right ventricular dysfunction may predict morbidity and mortality and thus might be a criterion for aggressive therapy using interventional radiologic techniques, which are described in detail in Chapter 16.36-38
CT Pulmonary Angiography Sensitivity: When Is a Negative Scan Enough?
Although many measures of CT sensitivity can be considered, let’s start with two summary statements:
Later, we review the evidence for these statements.
CT as a diagnostic test for PE was attempted as early as 1978, but early attempts offered poor resolution, sensitivity, and specificity. This resulted from the use of single-slice, nonhelical technology. Because images were acquired at large distance intervals and with relatively thick slices, small pulmonary emboli were undetectable. Image acquisition speed was slow, resulting in motion artifact during respiration.17,39 By the late 1990s, studies of CT using single-slice helical scanning began to report CT sensitivity of 87% to 91% with specificity of 78% to 98%, which compared favorably with the alternative diagnostic tests, VQ scan and pulmonary angiography.40-41 By 2002 to 2005, reports emerged of modern helical multislice scans offering superior image resolution with visualization of subsegmental pulmonary arteries, limited gaps in data, and rapid scan acquisition, eliminating respiratory and cardiac motion artifact.42-43 For these reasons, when evaluating studies on the sensitivity and other test characteristics of CT for PE, it is important to determine whether modern CT equipment was used in the study. Although CT remains a limited test, it uses the same basic principles as traditional pulmonary angiography as described earlier, and the test characteristics of the two modalities have converged as CT technology has continued to improve. The most current studies of CT show high sensitivity and specificity when compared with pulmonary angiography. Questions have begun to arise about the proper criterion diagnostic standard when comparing the two techniques, because pulmonary angiography itself is subject to false positives and false negatives.8
Before examining the evidence in detail, let’s reexamine our goal in performing diagnostic imaging for detection of PE. CT accuracy can be evaluated using two general strategies. The first is a “disease-oriented outcome” standard, meaning the presence or absence of PE, as detected by some reference test and compared with CT. The second is a “patient-oriented outcome” standard, based on the clinical outcome (morbidity or mortality) for a patient with a normal CT scan who is not treated with anticoagulation. The second may be the more important standard, because our primary goal as emergency physicians is to prevent morbidity and mortality.
Literally hundreds of published articles exist on the topic of CT for PE; a PubMed search using the terms “CT,” “pulmonary,” and “angiography” found 1679 matches with more studies published each day. (The author performed that first search on March 8, 2010, but by March 21, 2011 the number of PubMed matches had grown to 2025). Here, we consider a few of the key studies underlying our understanding of CT sensitivity and specificity. Early studies of single-detector CT were haunted by questions of undetected subsegmental pulmonary emboli with possible significant patient morbidity and mortality resulting from undiagnosed and untreated thrombus. However, new studies of multidetector CT demonstrate the ability to image subsegmental pulmonary arteries. Most importantly, patient outcomes after negative CT are similar to those after negative traditional pulmonary angiography. A 2005 review found that the incidence of PE 6 to 12 months after negative traditional pulmonary angiography was approximately 1.6%, whereas a negative CT pulmonary angiogram carried a 1.3% average incidence of VTE. Exceptions to this may include patients with symptoms of deep venous thrombosis (DVT), in whom further evaluation may be warranted if CT pulmonary angiography is negative.8 To be fair, these outcome numbers are influenced not only by the sensitivity of the two tests, but also by the risk profile of the patient populations being tested. Patients subjected to formal pulmonary angiography are typically at high risk (high pretest probability) of PE, warranting the use of an invasive test for evaluation. Thus a low rate of PE following a negative angiogram in this population is impressive, reflecting high test sensitivity. In contrast, patients undergoing CT pulmonary angiography have a low overall risk of PE, so good outcomes following normal CT pulmonary angiography are as much a measure of the low pretest probability of disease as of the test’s sensitivity. We will consider this issue in more detail in the discussion to come.
Outcome Studies Following Negative CT Pulmonary Angiography
A systematic review and meta-analysis (including both single and multidetector CT) published in JAMA in 200544 found that the likelihood ratio negative for PE following a negative chest CT was 0.07 (95% CI = 0.05-0.11). The likelihood ratio negative for mortality attributable to PE was 0.01 (95% CI = 0.01-0.02) at follow-up of 3 to 12 months. These values are similar to those reported for conventional pulmonary angiography. Other investigators have also reported good clinical outcomes (98% or greater survival without venous thromboembolic disease) in the 6 months after a negative chest CT, without additional DVT testing.45 The Christopher Study, a prospective multicenter study of 3306 patients published in JAMA in 2006,46 examined VTE outcomes in patients with negative chest CT who were not anticoagulated. The 3-month rate of VTE was only 1.3% (95% CI = 0.7%-2.0%), with a mortality rate of 0.5% (95% CI = 0.2%-1.0%). A 2009 meta-analysis47 found a similar 3-month incidence of VTE (1.2%, 95% CI = 0.8%-1.8%) following normal CT pulmonary angiography and conventional pulmonary angiography (1.7%, 95% CI = 1.0%-2.7%). Fatal pulmonary emboli were rare in the 3 months following a normal CT, occurring in 0.6%. The authors also evaluated the incremental safety provided by performing bilateral compression ultrasound to evaluate for DVT but found no statistically significant difference in 3-month risk for PE or fatal PE with this additional testing strategy.
In JAMA in 2007, Anderson et al.48 reported a randomized, controlled, single-blinded noninferiority trial comparing CT and VQ scan to assess the safety of CT as an initial test for acute PE. The study examined a high-risk population of 1417 patients, all with a Wells score of 4.5 or greater or positive D-dimer results. Patients were randomized to assessment with either VQ scan or CT scan. Initial diagnosis with PE was made for 19.2% of patients in the CT group and 14.2% of patients in the VQ scan group. Patients with negative imaging results did not receive anticoagulation and were followed for 3 months to determine the interval development of either PE or proximal DVT. Only 0.4% of patients with negative initial CT scan results and 1.0% of those with negative VQ scan results developed thromboembolism during the follow-up, with no statistical difference between the two groups. This study offers strong evidence that either CT scan or VQ scan is a safe initial approach to rule out PE in the emergency department, with a negative predictive value of 99%.
You may recall that negative predictive values are subject to variation depending on the rate of disease in the study population and are relatively discouraged as a reported measure of a test’s accuracy for this reason. Consider the extreme example of a test that is always negative for PE and therefore has a sensitivity of 0%. If used in a study population consisting of 99 patients without PE and 1 patient with PE, the test would have a 99% negative predictive value, because only a single patient has the disease. Then, why should we accept a negative predictive value in Anderson et al.’s study? This study examined a high-risk population, with an overall rate of PE of 16.5%. This is likely a higher rate of thromboembolic disease than would occur in most emergency department cohorts being evaluated, so the test likely will perform with a similarly high negative predictive value in our patients. Consider how our hypothetical 0% sensitivity test would perform in this population. It would fail to identify all patients with PE (16.5%), so the negative predictive value would be only 83.5%. Anderson et al.’s study48 suggests that both VQ and CT perform well in sorting from a high-risk population those patients who can safely avoid anticoagulation. The authors point out that CT diagnosed more patients with PE than did VQ scan, yet those with negative CT or VQ fared equally well without anticoagulation. This implies that some of those diagnosed with PE by CT scan either did not really have the disease or did not require anticoagulation therapy for it. Overdiagnosis of PE remains a potential concern with CT scan, as this may subject patients to unnecessary anticoagulation.
CT, VQ scan, and Likelihood Ratios: Altering Pretest Odds With a Negative Diagnostic Imaging Test
Another measure of test diagnostic accuracy is likelihood ratio. Two likelihood ratios can be calculated for every test, based on the test’s sensitivity and specificity. The likelihood ratio positive (LR+) is the probability of a person who has the disease in question testing positive divided by the probability of a person who does not have the disease testing positive. This is also mathematically represented as LR+ = sensitivity/ (1-specificity). The likelihood ratio negative (LR-) is the probability of a person who has the disease in question testing negative divided by the probability of a person who does not have the disease testing negative. It is mathematically represented by LR− = (1-sensitivity)/specificity. The pretest odds of the diagnosis multiplied by the appropriate likelihood ratio determines the post-test odds. Odds and probability can be mathematically interconverted. Although the pretest odds cannot be specifically determined for an individual patient, it can be estimated by the physician based on factors such as the overall prevalence of disease in a given emergency department and the given patient’s similarity to the overall population (e.g., more at risk or less at risk than an average patient). A likelihood ratio positive greater than 10 strongly increases disease probability, effectively ruling in disease for all but the lowest-risk patients. A likelihood ratio negative less than 0.1 strongly decreases disease probability, effectively ruling out disease in all but the highest-risk patients. Given this background, what are the LR+ and LR− values for CT pulmonary angiography and VQ scan (a test for pulmonary embolism discussed later in this chapter)?
Roy et al.49 performed a systematic review and meta-analysis of strategies for diagnosis of acute PE, published in BMJ in 2005. The authors provide likelihood ratios for CT and VQ scan, which are useful in our clinical decisions. Positive likelihood ratios were as follows: “high probability” VQ scan was 18.3 (95% CI = 10.3-32.5), CT was 24.1 (95% CI = 12.4-46.7), and lower extremity venous ultrasound was 16.2 (95% CI = 5.6-46.7). Because positive likelihood ratios greater than 10 are generally considered to be helpful in ruling in a disease process, all three diagnostic strategies could be considered confirmatory if positive in a patient with a moderate or high pretest probability of PE. Negative likelihood ratios were as follows: normal or near-normal VQ scan was 0.05 (95% CI = 0.03-0.10), and negative CT plus negative lower extremity ultrasound was 0.04 (95% CI = 0.03-0.06). Because a test with a likelihood ratio negative less than 0.1 is considered to provide strong evidence against a disease process, a normal VQ or CT plus ultrasound can be used to rule out PE in all but the highest-risk patients.49 The authors noted that the likelihood ratio negative of a negative CT alone (without ultrasound) was only 0.11 (95% CI = 0.06-0.15) and therefore concluded that CT alone should only be used to rule out PE in low-risk patients. Adding ultrasound evaluation may be prudent in patients with higher clinical risk. A low-probability VQ scan had a negative likelihood ratio of 0.36 (95% CI = 0.25-0.50), meaning that it reduces the likelihood of PE but only moderately. In very-low-risk patients, this may equate to an acceptably low risk for PE, but in high-risk patients, a “low probability” VQ scan does not rule out PE. Likelihood ratios are based on sensitivity and specificity values, so what do published studies say about CT sensitivity and specificity?
Studies of CT Pulmonary Angiography Sensitivity and Specificity
A 2002 meta-analysis of 12 studies from 1990 to 2000 comparing CT to standard pulmonary angiography or high-probability VQ scan found an overall sensitivity of 74.1% and specificity of 89.5%, with broad reported ranges for both sensitivity (57% to 100%) and specificity (68% to 100%).50 A systematic review and meta-analysis published in 2005 in Radiology (including single and multidetector CT) found the pooled sensitivity for CT to be 86% (95% CI = 80.2%-92.1%) with a specificity of 93.7% (95% CI = 91.1%-96.3%).51 In other words, a positive CT is likely to rule in PE correctly, but a negative CT might miss as many as one in five patients with PE. A 2006 review reached similar conclusions, finding that CT pulmonary angiography alone was relatively insensitive but, when combined with lower extremity DVT diagnostic testing, had a false-negative rate of only 1.6%.52
In 2006, the results of the multicenter PIOPED II study were published in the New England Journal of Medicine. This National Institutes of Health–funded prospective study used a composite reference standard, including additional imaging results, to determine the accuracy of multidetector CT. The study included 4-, 8-, and 16-detector CT scanners. Overall, the study found CT pulmonary angiography to be 83% sensitive (95% CI = 76%-92%) with a specificity of 96% (95% CI = 93%-97%). The likelihood ratio positive was 19.6 (95% CI = 13.3-29.0), indicating that a positive CT scan strongly predicts the presence of PE. The likelihood ratio negative was 0.18 (95% CI = 0.13-0.24), indicating that a negative CT substantially reduces but does not exclude the possibility of PE.53 Remember that a test with a likelihood ratio positive greater than 10 is thought to suggest a disease process strongly, whereas a likelihood ratio negative less than 0.1 is necessary to exclude a diagnosis confidently. The investigators also reported the positive predictive values in patients with intermediate and high pretest probability and the negative predictive value of CT angiography in patients with low pretest probability. Positive predictive values of CT in intermediate- and high-risk patients were 92% and 96%, respectively. Negative predictive value was 97% in low-risk patients. As described earlier, positive and negative predictive values are influenced by the prevalence of disease in the subject groups and are generally discouraged as a means of describing test properties. However, in this case, reporting predictive values stratified by clinical pretest probability is appropriate, because validated tools (Wells score and others) are available to us as emergency physicians to allow us to identify patients with similar probability of disease. The authors concluded that a CT finding that is concordant with pretest probability is highly predictive, whereas discordant imaging and clinical risk assessment should be followed with additional testing. The relatively low sensitivity of CT pulmonary angiography in PIOPED II (83%) may come as a surprise, and deserves comment. The reference standard for the diagnosis of PE in PIOPED II was designed to be extremely conservative, and included the diagnosis of DVT by venous ultrasound in a patient whose other diagnostic tests for PE were negative. Thus a DVT was assumed to be a surrogate for the diagnosis of PE, and a negative CT pulmonary angiogram in this setting was considered to be a false negative. While from a clinical perspective, patients with DVT require anticoagulation, it is not actually true that all patients with DVT also have PE. Thus, this reference standard exaggerates the false negative rate (and thus decreases the apparent sensitivity) of CT for PE. 13.5% of PE diagnoses in PIOPED II were based on such ultrasound findings. If these patients in truth had isolated DVT without PE, the negative CTs that occurred in some of these patients would be true negatives, not false negatives, and the sensitivity of CT would be higher than that reported by the PIOPED II investigators.53a
In another publication, the PIOPED II investigators recommended several diagnostic pathways based on clinical pretest probability.54 They point out that a negative CT angiogram in a low-risk patient has an excellent negative predictive value (96%) and recommend against treatment in this group. They point out a slightly improved negative predictive value (97%) when CT venography (CTV) of the lower extremities is also performed, although controversy exists about this technique because the small additional diagnostic yield comes at the cost of considerable additional radiation exposure. Notably, they recommend additional diagnostic testing in low pretest probability patients with positive CT angiography results resulting from positive predictive values of only 68% for segmental PE and 25% for subsegmental PE. Segmental and subsegmental filling defects on CT are more prone to interobserver error and may result from poor contrast bolus or other artifacts, rather than PE. They are therefore less predictive of PE. If CT demonstrates main or lobar PE, for which positive predictive value is high (97%), the PIOPED investigators recommend treatment without further testing. Filling defects in main or lobar pulmonary arteries are usually readily recognized and easily distinguished from artifact; therefore, they are more predictive of PE.
For patients with moderate pretest probability assessment, the PIOPED II authors suggest treatment in accordance with CT results without further diagnostic testing because of good negative and positive predictive values in this group (89% and 92%, respectively). In patients with high-probability clinical assessment, they recommend treatment for positive CT findings (positive predictive value = 96%) but further workup if CT is negative because of a negative predictive value of only 60% for CT angiography and 82% for CT angiography plus lower extremity CTV.
These recommendations from PIOPED II may be unnecessarily conservative, because they reflect a disease-oriented outcome based on CT sensitivity, not based on patient outcome. PIOPED II did follow patients to 3 and 6 months by phone interview, but the clinical outcomes of patients with negative CT were not reported. It is not clear from the study that PEs missed by CT scan resulted in patient deaths or significant morbidity. Other studies have shown a very low yield of routine lower extremity imaging for DVT in asymptomatic patients with negative chest CT. Rates of additional DVT found using this technique are as low as 0.7% to 2.7%, with costs as high as $200,000 per additional isolated DVT diagnosed.55-56 An overall algorithm incorporating pretest probability and CT results in shown in Table 7-4.
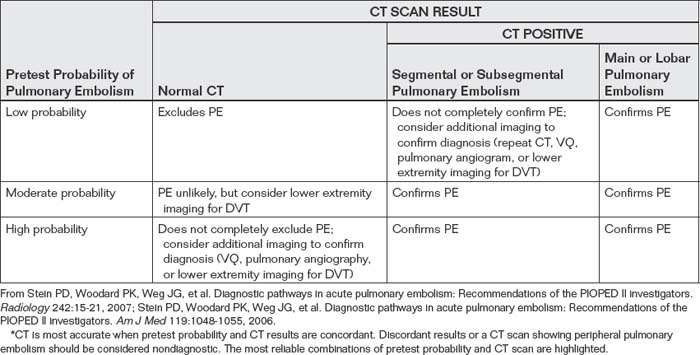
What Is a Ventilation–Perfusion Scan? How Does It Detect or Exclude Pulmonary Embolism?
Ventilation-Perfusion (VQ) scan is a nuclear scintigraphy technique for detection of pulmonary embolism. VQ scanning is a two-phase test process (Figure 7-43). First, the patient inhales a radioactive isotope (usually xenon-133), and the distribution of this gas in the lung parenchyma is recorded by a gamma camera (also called scintillation camera) outside the patient’s body. Next, a radioactive isotope (technetium-99m) is injected, and the distribution of blood in the patient’s pulmonary arteries is again recorded by an external camera. In a normal patient, the radioactive gas is well distributed through all lung segments, and blood flow is preserved to all lung segments. Several abnormal scenarios may occur, not all representing PE. For example, in a patient with pneumonia or atelectasis, a “defect” occurs in the ventilation image because little of the inhaled radioactive isotope is delivered to the abnormal alveoli of the affected lung segment. The normal physiologic response of the body is to decrease perfusion to poorly ventilated lung, so a corresponding decrease in signal is seen on the perfusion portion of the scan, indicating low blood flow to the poorly ventilated lung zone. This is referred to as a “matched defect” and is considered abnormal but not clearly diagnostic of PE. This scenario of matched defect can occur with pneumonia, atelectasis, chronic obstructive pulmonary disease (COPD), asthma, or pleural effusion—or with a large PE resulting in parenchymal infarction. A matched defect may result in an “intermediate probability” interpretation of the VQ scan, which neither confirms nor excludes PE. In an uncomplicated PE without associated lung parenchymal infarction, gas exchange is normal, so no defect is expected on the ventilation phase of the VQ scan. The embolus blocks delivery of the injected radioactive isotope to a portion of the lung, resulting in a defect only on the perfusion images. The result is an “unmatched perfusion defect,” which is considered high probability for PE. Although this finding is highly suggestive of PE, it is not pathognomonic, as we discuss later. When multiple unmatched perfusion defects are present, PE is by far the most likely cause. Figures 7-44 through 7-55 demonstrate high-probability VQ scans and the associated chest x-rays and CT scans from the same patients. As you review the VQ scans, you may be surprised to see the grainy quality of the images. Current gamma cameras have a spatial resolution of only 1.8 cm at a distance of 5 cm from the camera face, meaning that two separate sources of gamma radiation must be at least 1.8 cm apart to be distinguished. Resolution rapidly diminishes with increasing distance of the radiation source from the camera.
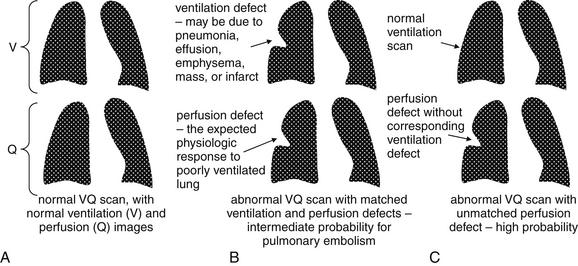
Figure 7-43 Ventilation–perfusion (VQ) scan: Schematic.
VQ scan is a nuclear medicine test used to evaluate for pulmonary embolism (PE). In the diagrams, the top images represent ventilation scans, each paired with a perfusion scan image below it. The blank space in the center of each image is the mediastinal silhouette, which results in a void space with little tracer. VQ scans are graded as normal or very low probability for PE (A, with normal ventilation and perfusion), low or intermediate probability for PE (B, with some areas of matched perfusion defects), or high probability for PE (C, with normal ventilation and single or multiple segmental and subsegmental perfusion defects). A, A normal lung should have uniform distribution of a gas through its parenchyma, which is demonstrated by administering an inhaled radioactive gas and acquiring a ventilation image (V). Normal pulmonary arteries should allow uniform blood flow throughout the lung, which can be demonstrated by injection of a radioactive isotope and acquisition of a perfusion image (Q). B, Abnormal lung parenchyma limits gas distribution, resulting in an abnormal ventilation scan. The normal physiologic response to a hypoxic lung region is vasoconstriction of the pulmonary arteries supplying that lung zone. This results in a “matched” perfusion defect, with decreased distribution of the injected radioactive tracer to the poorly ventilated lung zone seen on the perfusion scan. Any pathologic process that limits ventilation of a lung segment can result in a matched defect—including chronic obstructive pulmonary disease, pneumonia, pleural effusion, or lung mass. Sometimes PE results in a matched defect—if the embolism is large enough to result in pulmonary infarction with alveoli in the necrotic lung zone filling with fluid and cellular debris. C, More often, PE limits blood flow but not ventilation of the lung zone, resulting in a normal ventilation scan and an abnormal perfusion scan. This VQ mismatch is typical of PE but occasionally can result from other pathology. For example, a lung mass could result in extrinsic compression of a pulmonary artery, causing an abnormal perfusion scan but a normal ventilation scan. In a real VQ scan, multiple views from anterior, posterior, and oblique viewpoints are compared. A VQ scan is by nature low resolution—the scan is acquired over approximately 45 minutes, with a camera outside the patient registering emitted radiation. Respiratory motion and patient motion result in blurring of the image.
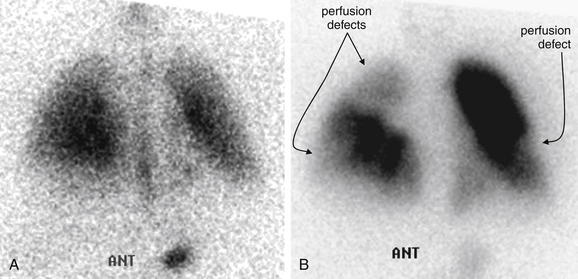
Figure 7-44 Pulmonary embolism (PE): Bilateral.
A direct comparison of the ventilation–perfusion (VQ) scans in a 30-year-old female with bilateral PE.
A, Ventilation scan image acquired with the detector anterior to the patient. Both lungs show distribution of inhaled radiopharmaceutical. B, Perfusion scan image acquired from the same anterior perspective. Multiple perfusion defects are seen; none matched on ventilation scan. This is a high-probability VQ scan, because no other process would be expected to cause multiple areas of poor perfusion with normal ventilation.
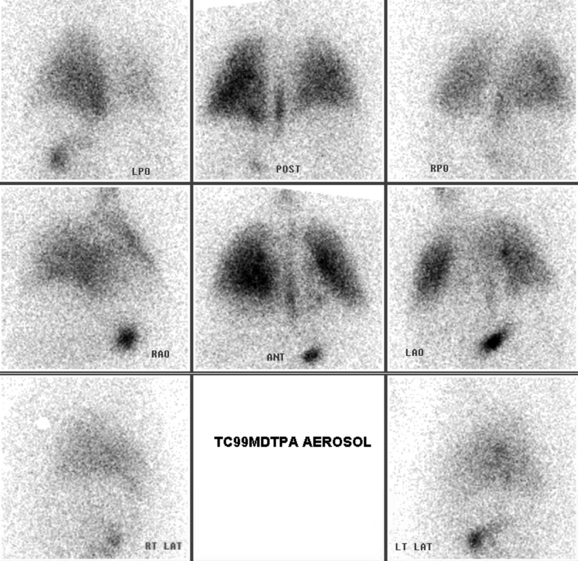
Figure 7-45 Pulmonary embolism (PE): Bilateral, ventilation scan.
This 30-year-old female presented with flank pain and no identifiable risk factors for PE. Her initial vital signs were reassuring except for visible tachypnea, noted in the physician chart. Her ventilation–perfusion scan was read as high probability for PE. The inpatient team also performed chest computed tomography (Figure 7-47). We start by looking at the ventilation scan above; the perfusion scan is shown in Figure 7-46. This ventilation scan is essentially normal. Look at the central cell, showing an image captured with a detector anterior to the patient. Radioactive tracer is seen distributed through both lungs. The white region in the central chest, indicating absence of inhaled tracer, is the normal cardiac silhouette. The right diaphragm was felt to be slightly elevated. The other cells view the chest from varying angles (posterior, oblique, and lateral). Compare with the perfusion scan in Figure 7-46.
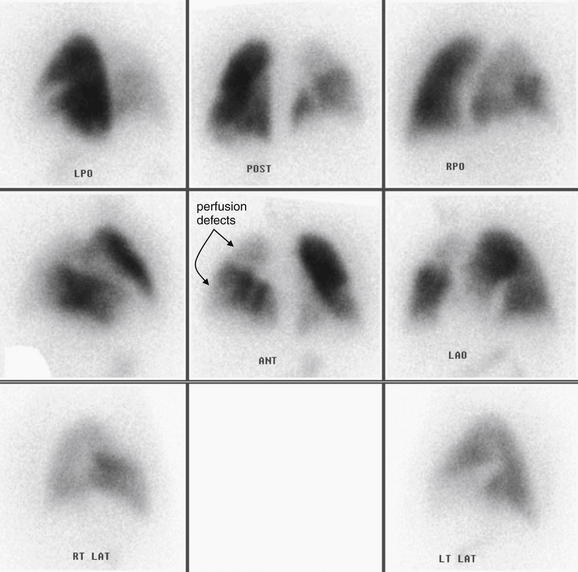
Figure 7-46 Pulmonary embolism (PE): Bilateral, perfusion scan.
Same patient as Figure 7-45. Here we inspect the perfusion scan images. Look at the central cell, showing an image acquired with the detector anterior to the patient. Multiple perfusion defects are seen, none matched on ventilation scan (Figure 7-45). Together, Figures 7-45 and 7-46 constitute a high-probability ventilation–perfusion scan. The other images above view the chest from varying angles (posterior, oblique, and lateral). They confirm the same finding of multiple perfusion defects. Compare with the CT pulmonary angiogram from the same patient in Figure 7-47.
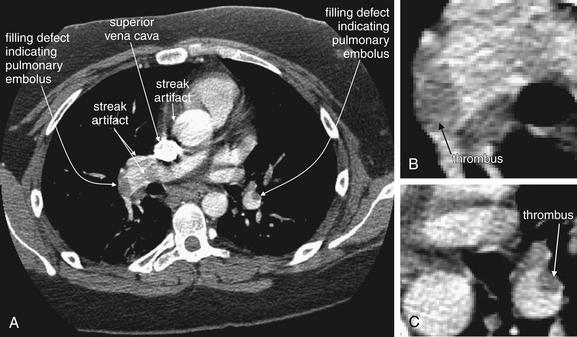
Figure 7-47 Pulmonary embolism (PE): bilateral with poor contrast bolus.
Same patient as Figure 7-46. A, Axial computed tomography (CT) slice. B, C, Close-ups. Despite a relatively poor-quality scan with artifact and a suboptimal contrast bolus, bilateral pulmonary emboli are visible, indicated by filling defects in large pulmonary arteries. The superior vena cava is intensely enhanced with contrast, creating streak artifact that can confuse the diagnosis. Note the difference between these diffuse hypodense artifacts and the well-marginated real filling defects created by the pulmonary thrombus. In some cases, it may be impossible to differentiate artifacts from real emboli. Focus on identifying definite emboli to rule in the diagnosis.
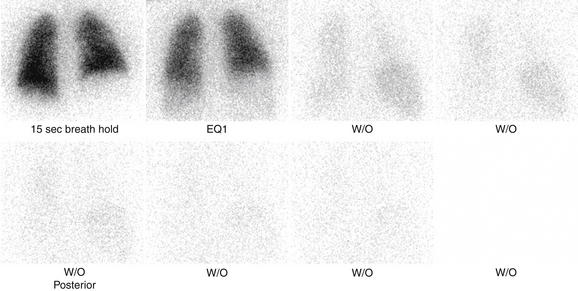
Figure 7-48 Pulmonary embolism ventilation–perfusion scan: High probability.
This 48-year-old male with a history of recurrent deep venous thromboses presented with dyspnea and chest tightness. The previous week, he had visited his physician with left leg pain and was diagnosed with a muscle strain. This ventilation scan is normal. Compare with the perfusion scan from the same patient in Figure 7-49.
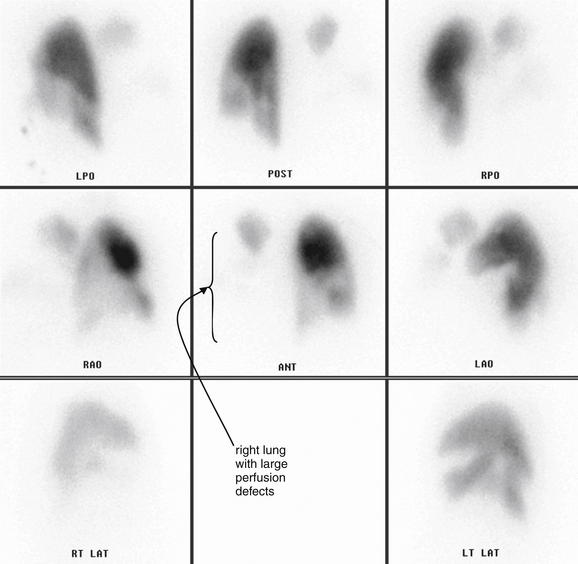
Figure 7-49 Pulmonary embolism (PE) ventilation–perfusion (VQ) scan: High probability.
Same patient as Figure 7-48. This perfusion scan is markedly abnormal. There is virtually no perfusion of the right lung, and regions of the left lung also appear hypoperfused. Begin by looking at the central cell, which shows a perfusion image acquired with the detector anterior to the patient. Only the right lung apex shows perfusion. The left mid- and lower lung are also poorly perfused. The remaining cells confirm these perfusion defects, which are not matched on ventilation scan (Figure 7-48). This is a high-probability VQ scan for PE.
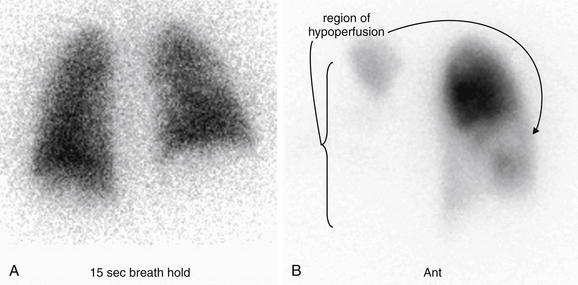
Figure 7-50 Pulmonary embolism (PE) ventilation–perfusion (VQ) scan: High probability.
Same patient as Figures 7-48 and 7-49. These ventilation (A) and perfusion (B) images from the patient show multiple areas of VQ mismatch. Both were acquired with the detector anterior to the patient. The void in the center of the ventilation scan (A) is the normal mediastinal and cardiac silhouette. On the perfusion scan (B), nearly the entire right lung is not perfused, consistent with central PE. The left mid- and lower lung are also poorly perfused.
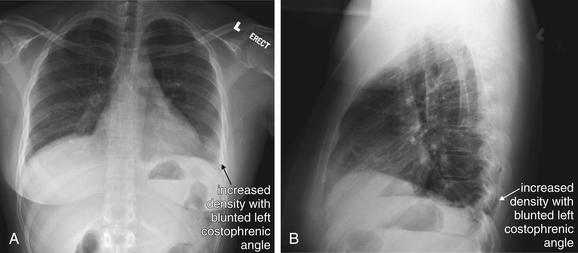
Figure 7-51 Pulmonary embolism (PE): Hampton’s hump.
A, Posterior–anterior chest x-ray. B, Lateral chest x-ray. Hampton’s hump is a classic but insensitive and nonspecific finding of PE. It is described as a wedge-shaped peripheral density on chest x-ray, indicating pulmonary infarction. Its appearance is not distinguishable from an infiltrate from pneumonia. In a pulmonary infarction from PE, tissue necrosis leads to the accumulation of alveolar fluid and cellular debris, as well as reactive inflammatory cells and hemorrhage. This increases the tissue density from air density to water density, just as with bacterial pneumonia. Early in the course of PE, or with small nonocclusive PE, no infarction may occur, and Hampton’s hump will not be visible. This 29-year-old female presented with acute onset of pleuritic left chest pain and dyspnea. Her chest was interpreted as normal, but look carefully at the left costophrenic angle. An increased density is present here. The finding is also seen on the lateral x-ray. Compare with the normal right side. Figure 7-52 shows her chest x-ray 2 days later. Her workup confirmed PE.
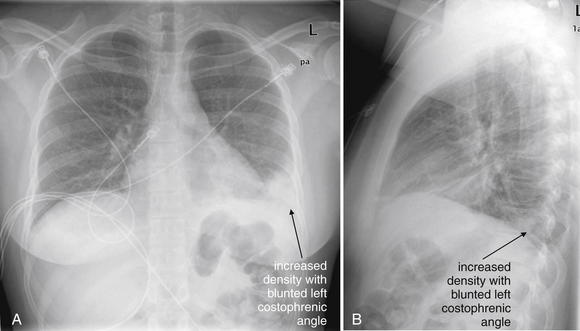
Figure 7-52 Pulmonary embolism (PE): Hampton’s hump.
A, Posterior–anterior chest x-ray. B, Lateral chest x-ray. Same patient as Figure 7-51, now 2 days later: 29-year-old female with sudden pleuritic left chest pain and dyspnea. Compare with the chest x-ray in the earlier figure. Now the increased density at the left costophrenic angle is more evident. This wedge-shaped pleural-based density is a pulmonary infarct—a finding sometimes called Hampton’s hump. Although this finding is neither sensitive nor specific for PE, it is important to recognize that infarction and pneumonia can appear identical on chest x-ray. When the clinical history suggests PE, this appearance on chest x-ray should not lead to termination of the workup and diagnosis of pneumonia.
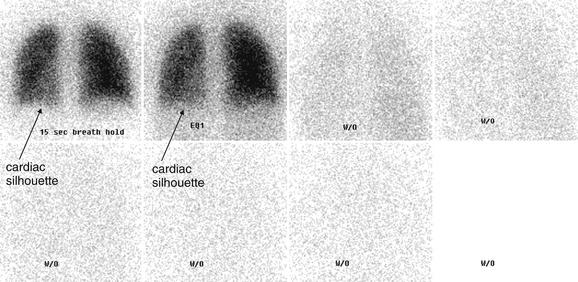
Figure 7-53 Pulmonary embolism: Hampton’s hump, normal ventilation.
This ventilation scan was obtained in the same patient as Figure 7-51. The perfusion scan is shown in Figure 7-54. The images in the upper left show even distribution of an inhaled radiopharmaceutical (11.3 mCi of xenon-133). A slight decrease in gas distribution is seen in the region overlying the cardiac silhouette, which appears on the left as these images are acquired with the detector behind the patient. The abnormal region near the left costophrenic angle (seen on the initial chest x-ray, Figure 7-51) is not visible on this ventilation scan—it is too small to be resolved. The remaining frames show the washout phase, which indicates that the inhaled gas is rapidly exhaled from the lung, with no air-trapping. Air-trapping would be evident as retained radiopharmaceutical and might be seen in chronic obstructive pulmonary disease or asthma.
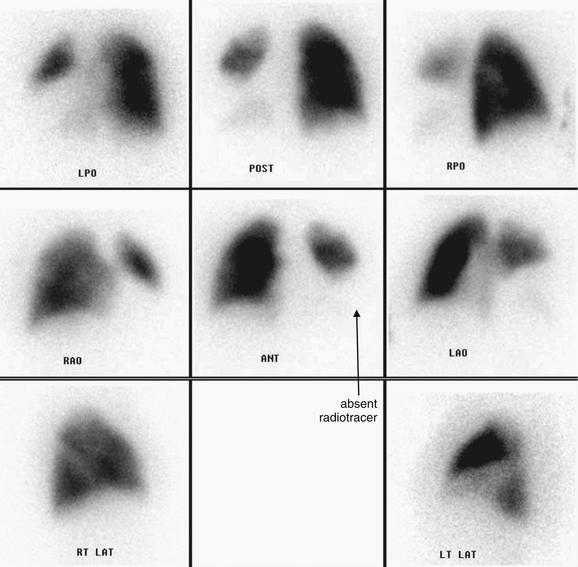
Figure 7-54 Pulmonary embolism (PE): Hampton’s hump, abnormal perfusion scan.
This perfusion scan was obtained in the same patient as Figures 7-51 through 7-53. The dark areas reflect distribution of an injected radiopharmaceutical (4.4 mCi of technetium-99m macroaggregate albumin). The abbreviations below the images indicate the relative position of the detector to the chest: LPO (left posterior oblique), POST (posterior), RPO (right posterior oblique), RAO (right anterior oblique), ANT (anterior), LAO (left anterior oblique), RT LAT (right lateral), and LT LAT (left lateral). Start by looking at the central image, which shows an anterior view. There is markedly decreased or absent tracer distribution in the left lower lobe and lingula. This is not accounted for by the cardiac silhouette, which does not project completely over this region. The other viewpoints confirm this finding. This, combined with the normal ventilation scan (Figure 7-53), constitutes a high-probability ventilation–perfusion (VQ) scan for PE. Another possible cause of this degree of VQ mismatch would be a large central mass compressing the pulmonary artery but not restricting airflow. Computed tomography was performed to exclude this alternative cause (Figure 7-55).
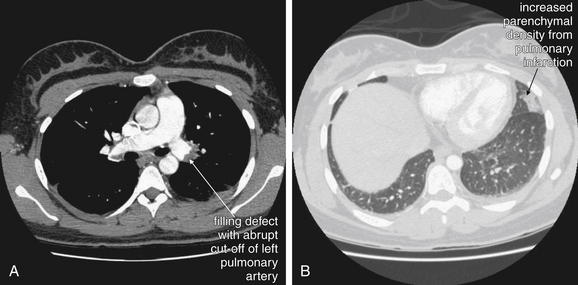
Figure 7-55 Pulmonary embolism (PE): Hampton’s hump.
CT pulmonary angiogram from the same patient as in Figure 7-54 showed a large left PE—accounting for the perfusion defect seen on ventilation–perfusion scan in that figure. On soft-tissue window (A), this is seen as a filling defect in the left main pulmonary artery. On lung window (B), an area of pulmonary infarction (corresponding to the abnormality on the patient’s chest x-ray) is visible as increased parenchymal density. Compare with the patient’s chest x-rays in Figures 7-51 and 7-52.
Other pathology can disrupt blood flow without altering ventilation, resulting in a false-positive VQ scan. An example is a tumor embolism, classically a renal cell carcinoma, which can enter the inferior vena cava and then embolize to the lung. The VQ appearance would be identical to that for PE. CT could also misdiagnose this condition based solely on chest CT findings, but if a renal mass is suspected, additional CT of the abdomen could prove tumor involvement of the inferior vena cava (Figure 7-56). Another example of pathology that could create a false-positive VQ scan is a central lung mass that extrinsically compresses a pulmonary artery branch while preserving ventilation to the lung segment (Figures 7-57 through 7-59). Whereas one unmatched defect can suggest but not absolutely confirm PE, multiple bilateral defects strongly suggest PE because few other processes can lead to this pattern.
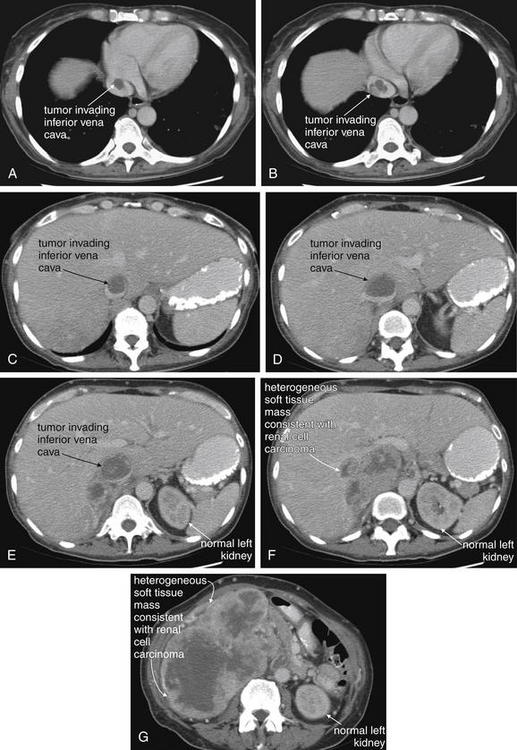
Figure 7-56 Tumor embolism from renal cell carcinoma.
This 55-year-old female with no prior medical history presented with a 50-pound weight loss over the past 8 months, with a palpable abdominal mass and increasing dyspnea. Sadly, computed tomography (CT) of the chest (A, B) and abdomen (C to G) shows an enormous mass replacing her right kidney, invading the inferior vena cava, and extending to the right atrium. Other chest CT images (not shown) showed pulmonary emboli, which may have been tumor emboli rather than thrombus. Renal cell carcinomas classically invade the renal vein and inferior cava, resulting in tumor emboli. These create an intravascular filling defect on CT and would result in ventilation–perfusion (VQ) mismatch on VQ scan, exactly as with typical pulmonary embolism from thrombus. Emergency physicians must be aware of these alternative causes of abnormal VQ and CT pulmonary arteriograms.
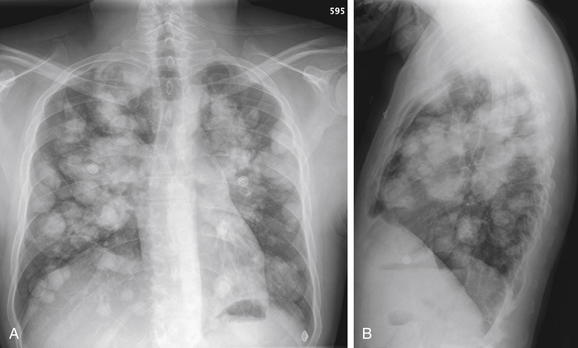
Figure 7-57 Metastatic disease with cannonball emboli.
A, Posterior–anterior chest x-ray. B, Lateral chest x-ray. This patient with metastatic osteosarcoma has the classic appearance of pulmonary metastatic disease, with innumerable rounded bilateral nodules. These occur as tumor cells are carried hematogenously to the lungs, implant, and grow. Nodules of different sizes may have seeded at different times. Because of the markedly abnormal chest x-ray, ventilation–perfusion scan would be a poor choice for assessing this patient for pulmonary embolism. The CT in Figure 7-58 shows yet another reason that CT is a better choice in this patient.
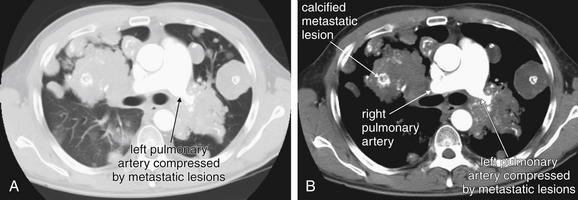
Figure 7-58 Metastatic disease with cannonball emboli and pulmonary artery compression.
Same patient as Figure 7-57. A, Lung window. B, Soft-tissue window. Here, confluent metastatic lesions are creating a unique problem—the left pulmonary artery is surrounded and compressed. Compare the diameter of the right and left pulmonary arteries. Consider what would happen if this patient were to undergo ventilation–perfusion (VQ) scan for suspected pulmonary embolism (PE). Extrinsic compression of a pulmonary artery can create VQ mismatch, falsely suggesting PE. Even without the unusual compression of the left pulmonary artery, the multiple pulmonary masses would create matched VQ defects that would result in an indeterminate VQ scan. In these single images, the right pulmonary artery may appear to be obstructed by either tumor or thrombus, but remember that vessels can curve in and out of a single image plane. Look at the next figure to understand the true course of the vessel. Another feature of these osteosarcoma lesions is internal calcifications—although a noncontrast CT would demonstrate this more clearly. The white markings within the lesions are calcium deposits, not injected contrast material.
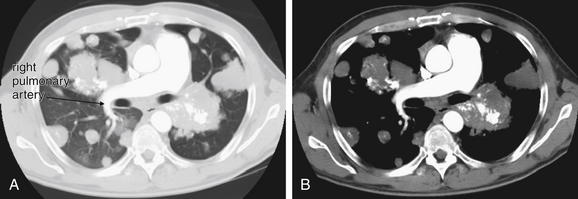
Figure 7-59 Metastatic disease with cannonball tumor emboli.
Same patient as Figure 7-58. A, Lung window. B, Soft-tissue window. The right pulmonary artery remains patent despite encroaching metastatic lesions. Compare with the images in the prior figure.
Understanding of the technique behind VQ scanning allows identification of patients who would be poor candidates for this test. Patients with abnormal chest x-rays, for example, with pleural effusions or atelectasis, are likely to have matched defects on VQ scan. Consequently, VQ scan may be unreliable to rule out PE in these patients. Patients with COPD or asthma may also have matched defects on VQ because of poor gas exchange and a normal physiologic shunting of blood away from poorly ventilated lung. These patients may also have nondiagnostic VQ scans.57-58
What Are the Sensitivity and Specificity of Ventilation–Perfusion Scan?
VQ scans are rated on a structured scoring system with values of normal, very low probability, low probability, intermediate probability, and high probability.
Based on an analysis of PIOPED II data, Sostman et al proposed a modified set of diagnostic criteria, simplifying the results of VQ to 3 categories: PE present, PE absent, or nondiagnostic (Table 7-5).58a When nondiagnostic categories are removed from analysis, and only the new categories of PE present and PE absent were considered, the sensitivity of VQ was 77.4% (95%CI 69.7% to 85.0%) and the specificity was 97.7% (95%CI 96.4% to 98.9%). If any VQ scan interpretation other than “normal” was considered positive for PE, the sensitivity was 99%, but the specificity was only 20%. This means that, when only the extreme diagnostic categories are considered, the performance of VQ scan is similar to that of CT in PIOPED II.59-60 Intermediate probability VQ scan results neither confirm nor exclude PE. Unfortunately, nondiagnostic results are common, with the majority of VQ scan results falling into neither the normal nor the high-probability categories. In PIOPED I, normal VQ results occurred in only 14% of subjects.59 In PIOPED II, more than 25% of patients had nondiagnostic VQ scan results, compared with only 6% with nondiagnostic CT results.60
TABLE 7-5 Modified PIOPED II Scintigraphic Criteria
| Category | Finding |
|---|---|
| PE present (high probability) | Two or more segments of V/Q mismatch |
| PE absent (normal perfusion or very low probability) | Nonsegmental perfusion abnormalities; these were enlargement of the heart or hilum, elevated hemidiaphragm, costophrenic angle effusion, and linear atelectasis with no other perfusion defect in either lung |
| Perfusion defect smaller than corresponding radiographic lesion | |
| Two or more matched V/Q defects with regionally normal chest radiograph and some areas of normal perfusion elsewhere in the lungs | |
| One to three small segmental perfusion defects (<25% of segment) | |
| Solitary triple-matched defect (defined as a matched V/Q defect with associated matching chest radiographic opacity) in the mid or upper lung zone confined to a single segment | |
| Stripe sign (a stripe of perfused lung tissue between a perfusion defect and the adjacent pleural surface; best seen on a tangential view) | |
| Pleural effusion of one-third or more of the pleural cavity with no other perfusion defect in either lung | |
| Nondiagnostic (low or intermediate probability) | All other findings |
From: Sostman HD, Stein PD, Gottschalk A, et al. Acute pulmonary embolism: sensitivity and specificity of ventilation-perfusion scintigraphy in PIOPED II study. Radiology 246(3):941-946, 2008.
Moreover, the pretest probability of PE affects the diagnostic accuracy of VQ, in much the same way that pretest probability affects the accuracy of CT, as reviewed earlier. A normal or very low probability VQ scan does not exclude PE in patients with a moderate or high pretest probability of PE; PIOPED I found PE rates in these patients to be as high as 16% to 40% with a negative VQ scan. Even with a low pre-test probability, the rate of PE was 7% in patients with very low probability VQ scan. In a retrospective analysis of data from PIOPED II, patients with very-low-probability VQ scan result and low pretest probability by Wells criteria had only a 3.1% rate of PE.61 In a systematic review published in Radiology in 2005, VQ scan interpreted as “normal” was 98.3% sensitive to detect PE (95% CI = 97.2%-99.5%), meaning that a normal VQ scan effectively rules out PE in most patients. However, a “normal” VQ scan result was obtained in only 4.8% (95% CI = 4.7%-4.9%) of patients, meaning that most patients would have nonreassuring VQ results prompting further testing. A VQ scan interpretation of “high probability” was very specific for PE at 97.1% (95% CI = 96.0%-98.3%), effectively confirming the diagnosis in most patients. However, the sensitivity of a “high probability” VQ scan was only 39% (95% CI = 37.3%-40.8%) in this meta-analysis, meaning that 60% of patients with PE would have a false-negative or nondiagnostic VQ result. VQ results that are neither “normal” nor “high probability” fail to confirm or rule out the diagnosis, and additional testing should be performed.51 The ACEP 2003 clinical policy on evaluation of adult patients presenting with suspected PE concluded that a normal VQ scan is adequate to exclude “clinically significant” PE in a patient with low to moderate pretest probability, but this policy predates the PIOPED II data.4 Table 7-6 illustrates the relationship between pretest probability and VQ result in diagnosing PE. Note the similarity in clinical application of VQ scan and CT results, incorporating clinical pretest probability. Concordant imaging test and clinical pretest probability results are generally correct, while discordant results requiring further testing.
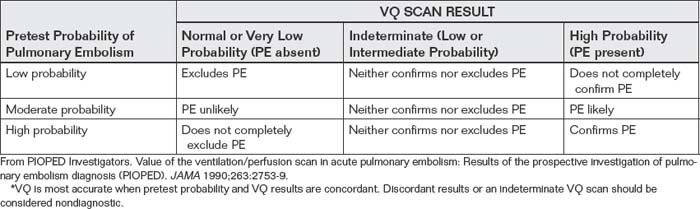
Which Patients Are Candidates for Ventilation–Perfusion Scan? What Factors Favor the Use of Computed Tomography?
Table 7-7 illustrates factors favoring VQ or CT scan. Some patients may be candidates for VQ scan because of anticipated inability to undergo a diagnostic CT. Patients with poor IV access may not be able to undergo the rapid contrast bolus necessary for a high-quality CT. VQ may be necessary in patients with renal insufficiency or contrast allergy that are contraindications to CT. Obese patients may exceed the weight capacity of CT scanners (450 pounds for all major manufacturers, with some offering options up to 650 pounds). In addition, the gantry bore diameter of the CT scanner may limit CT in obese patients. The standard gantry diameter is 70 cm, with some manufacturers offering larger gantries up to 90 cm. A common myth is that large hospitals, zoos, and veterinary hospitals may have scanners with larger weight capacities and gantry size capable of scanning larger patients. However, tertiary care hospitals are limited to the same standard CT scanners found in most community hospitals. Veterinary hospitals and zoos are not licensed to care for human patients, and they are equipped with standard human CT scanners that have the same gantry diameter limits. Some have been modified with a specialized table to accommodate heavier animal bodies.62-63
TABLE 7-7 Factors Affecting Choice of Computed Tomography or Ventilation–Perfusion Scan
| Patient Consideration | Favored Imaging Modality |
|---|---|
| Contrast allergy | VQ |
| Contrast nephropathy or poor renal function | VQ |
| Obese patient, exceeding CT table weight capacity or gantry diameter | VQ |
| Radiation exposure (young, pregnant, or female) | VQ or perfusion scan without ventilation scan |
| Poor or small-gauge IV access | VQ (does not require rapid contrast bolus) |
| Abnormal chest x-ray, chronic lung disease, or other factors predicting intermediate (nondiagnostic) VQ result | CT (provides alternative diagnoses) |
| Intermediate pretest probability | CT |
| Strong concern for alternative diagnosis (e.g., aortic pathology) | CT (provides alternative diagnosis) |
| Very high or very low pretest probability | Either CT or VQ as initial test; consider further investigation if imaging result is discordant with pretest probability |
Other considerations include patient stability—a chest CT requires minutes, whereas a VQ scan may take up to 1 hour to complete. The decision to use VQ scan as the initial diagnostic test for possible PE clearly should take into consideration the patient’s pretest probability of PE. In addition, an understanding of the technique of VQ scanning (described earlier) can aid in patient selection for this test. Patients who are predicted to have matched VQ defects are poor candidates for this test, because the results will likely be nondiagnostic. Patients with moderate pretest probability of PE are also relatively poor candidates for VQ scan, the likelihood of a diagnostic VQ scan in this group is low. Patients who may be appropriate for VQ as the primary means of excluding PE may be those with normal chest x-ray, no history of COPD or asthma, and a low pretest probability of PE. A normal VQ scan in these patients likely excludes PE, perhaps to a greater degree than does a normal CT that has a small chance of missing subsegmental PE.59 Older age, history of chronic lung disease such as emphysema, and chest x-ray findings of emphysema all predict nondiagnostic VQ scan, suggesting that CT may be a better choice in these patients unless contraindications to CT exist.58 CT scan results in a higher radiation dose to breast tissue than does VQ scan, so VQ may be the favored test in young females, when all other considerations are equal. Phantom models suggest that a single chest CT may increase breast cancer risk by 0.4% to 4% relative to baseline, although shielding and other dose reduction techniques can be used.64-66 Perfusion scanning without ventilation scanning is another option to reduce radiation exposure. In this technique, the chest x-ray is used as a surrogate for the ventilation scan, with chest x-ray abnormalities compared to defects on the perfusion image. A perfusion defect in the presence of a normal chest x-ray suggests PE. This technique has sensitivity and specificity similar to CT angiography and VQ scan, according to an analysis from PIOPED II data.67 This technique may be preferable in pregnant women, in whom radiation dose to the fetus is a particular concern. Total effective whole-body radiation dose from this technique is approximately 0.8 mSv, compared with 1.6-8.3 mSv for CT pulmonary angiography.67a Radiation risks of CT and VQ scan in pregnancy are discussed later in this chapter.
Another factor in choosing between VQ scan and CT scan is the breadth of the differential diagnosis under consideration. VQ scan answers a binary question in the emergency department: Is a PE present? CT scan can provide alternative diagnoses and is the better test when a broad differential diagnosis is under serious consideration. A study of 1025 emergency department patients undergoing CT for suspected PE found that among the 921 patients without PE detected, 7% had a CT finding requiring “specific and immediate intervention.” These findings included pneumonia (81%), aortic aneurysm or dissection (7%), and mass suggesting undiagnosed malignancy (7%).68 Later in this chapter, we discuss diagnostic strategies when both PE and aortic dissection are serious concerns.
What Is the Position of the American College of Emergency Physicians on Diagnostic Testing for Pulmonary Embolism?
ACEP published a clinical policy on evaluation of adult patients presenting with suspected PE in 2003. In this evidence-based review, authors concluded that a normal VQ scan was adequate to exclude “clinically significant” PE in patient with low to moderate pretest probability.4 In the same review, they cited as a level B recommendation the use of CT scan as an alternative to VQ scan for patients with suspected PE. Importantly, this clinical policy predates the publication of several of the meta-analyses described earlier on good clinical outcomes following negative CT scans. In addition, PIOPED II was completed and published after publication of this ACEP policy, which is now categorized by ACEP as “not current.” ACEP clinical policies undergo review periodically to incorporate new clinical evidence, or are retired if such a review is not performed.
Magnetic Resonance Imaging in Diagnosis of Pulmonary Embolism
MRI is a more recently described modality in diagnosis of PE. Indications for MRI for PE include contraindication to CT because of dye allergy, radiation concerns, and nondiagnostic testing with CT or VQ scan. In a study of CT angiography (PIOPED II), 24% of patients had 1 or more relative contraindications to radiation or iodinated contrast, suggesting a need for MRI as an alternative.53 MRI can be used to assess for both PE and lower extremity and pelvic DVT. Initial experience with MRI showed sensitivity and specificity comparable or superior to that of multidetector CT.69 Several techniques, including real-time MRI, magnetic resonance angiography (MRA), magnetic resonance (MR) perfusion imaging, and MR venography, can be combined to take advantage of differential sensitivity and specificity of the techniques. When analyzed on a per-patient basis (as opposed to per-embolus basis), the sensitivity of real-time MRI, MRA, MR perfusion imaging, and a combined protocol was 85%, 77%, 100%, and 100%, respectively, compared with a reference standard of 16-detector CT in 62 patients. Specificity was 98%, 100%, 91%, and 93%, respectively. Real-time MRI is advantageous because it can be performed without use of contrast agents and is rapid, taking only 180 seconds. MR perfusion imaging requires gadolinium contrast and takes approximately 7 minutes. MRA also requires contrast and takes only a few minutes.70-71 In another study comparing MRA to conventional pulmonary angiography, MRA had an overall sensitivity of 77% (95% CI = 61%-90%), with sensitivity of 40%, 84%, and 100% for isolated subsegmental, segmental, and central or lobar PE, respectively.72-73 MRI may play a role in confirming or ruling out PE when other imaging studies are equivocal. PIOPED III, a prospective multicenter study of gadolinium-enhanced magnetic resonance pulmonary angiography and lower extremity venography, enrolled 371 patients at 7 hospitals from 2006 to 2008. MRA/MRV results were compared against a mixed reference standard consisting of CT, VQ, ultrasound, d-dimer, and clinical assessment. MRA was technically inadequate in 25% of patients. When only technically adequate images were considered, the sensitivity of MRA was 78% (95%CI 67%-86%) and specificity was 99% (95%CI 96%-100%). When technically inadequate MRA was included, sensitivity was only 57%. The combination of MRA and venography was 92% sensitive (95%CI 83%-97%) and 96% specific (95%CI 91%-99%) when only technically adequate images were considered, but 52% of patients had technically inadequate results. The high specificity of this test may make it particularly useful in patients with nondiagnostic or suspected false positive imaging results using other modalities. The limited sensitivity of MRA alone means that a negative MRA should not be considered to rule out PE. The large percentage of technically inadequate MRA and MRV exams should make this a second line imaging study in patients who qualify for other imaging strategies. The procedure is probably most useful at centers that frequently perform the exam and thus have a greater chance of obtaining technically adequate results.74
Echocardiography for Pulmonary Embolism Diagnosis
Both transthoracic echocardiography (TTE) and transesophageal echocardiography (TEE) can be used for assessment of PE. Echocardiography is not a first-line diagnostic test to exclude PE in most patients because of poor sensitivity. However, some echocardiographic findings are highly specific for PE and can be used to confirm the diagnosis. Other findings are suggestive of PE and in a critically ill patient can be used to plan confirmatory testing, empiric anticoagulation, or invasive therapy such as catheter-based thrombolysis or thrombectomy. If a patient is stable enough to undergo CT or VQ scan, these tests are generally preferred because of higher accuracy. Echocardiography is advantageous because it is portable and can be used at the bedside in the emergency department or intensive care unit. It does not require the administration of nephrotoxic contrast agents. It can provide information about serious alternative diagnoses such as pericardial effusion and tamponade or aortic dissection, potentially redirecting the diagnostic and therapeutic plan. Some echocardiographic findings have been correlated with mortality from PE and may suggest the need for intensive care unit admission or aggressive radiologic therapies, which are described in more detail in the chapter on interventional radiology (Chapter 16).
TTE has a reported sensitivity around 30% to 55%, with specificity between 85% and 95%.75-76 In a single-center, prospective, single-blinded study, right ventricular dilatation by TTE had a sensitivity of only 31% (95% CI = 21%-41%) but was highly specific for PE (94%, 05% CI = 89%-99%). The maximum velocity of tricuspid regurgitation, a marker of high pulmonary artery pressures, was also assessed. Elevated values (>2.7 m per second) had a sensitivity of 51% (95% CI = 38%-64%) with relatively low specificity (88%, 95% CI = 81%-95%) because any non-PE pathology causing pulmonary hypertension can result in this finding. If right ventricular hypertrophy (free right ventricular wall thickness > 6mm) was present, tricuspid regurgitation velocity should not be used in evaluation for PE, as right ventricular hypertrophy suggests a long-standing pulmonary hypertension rather than an acute cause such as PE. The presence of both RV dilatation and high tricuspid regurgitation velocity was poorly sensitive (29%, 95% CI = 19%-39%) but highly specific (96%, 95% CI = 92%-100%).77 This study suggests that the combination of right ventricular dilatation, high tricuspid regurgitation velocity, and normal right ventricular free wall thickness has a specificity similar to that for CT scan and VQ scan and thus could be used for diagnosis of PE. The authors stressed that nonspecificity of individual echocardiographic criteria would mean that some patients would be erroneously diagnosed with and treated for PE if these were used in isolation. Still, in the sickest patients, TTE can increase the probability of the diagnosis of PE pending confirmatory testing. Other rare findings, such as free-floating right ventricular or inferior vena cava thrombus, may confirm the diagnosis of PE.78-79
TEE for definitive diagnosis of PE has been described in small studies. Pruszczyk et al.80 reported 80% sensitivity and 100% specificity using this method to visualize pulmonary emboli in the main right and left pulmonary arteries directly—though in a series of only 32 consecutive patients. Other authors have suggested that direct visualization of PE may be difficult (sensitivity 26%), although suggestive right heart abnormalities may support the diagnosis of PE.81 Other reports describe the value of TEE in detecting thrombus in the inferior and superior vena cava, right atrium, and right ventricle.79
The prognostic value of echocardiography for patients with PE confirmed by other modalities has also been studied. In a study of normotensive patients with acute PE, the predictive value of echocardiogram for in-hospital shock or intubation, death, recurrent PE, or severe cardiopulmonary disability at 6-month follow-up was assessed. Right ventricular dysfunction on initial echocardiogram was only 61% sensitive (95% CI = 46%-74%) and 57% specific (95% CI = 48%-66%) for an adverse outcome.82 This gives LR+ of 1.4 and LR– of 0.7, values which do not substantially change pretest probability assessment. A systematic review found five studies of echocardiographic findings of right ventricular dysfunction, with a pooled risk ratio of 2.4 (95% CI = 1.3-4.4) for death among hemodynamically stable patients with acute PE.36 Overall, these studies imply that right ventricular dysfunction is only a moderate predictor of inpatient morbidity, with larger studies needed to determine its role and accuracy in more detail.
Assessment for Deep Venous Thrombosis
No discussion of PE assessment is complete without discussion of DVT. DVT is believed to be the source for most pulmonary emboli, and assessment for DVT can be a surrogate for assessment of PE. When a patient has signs or symptoms of PE (e.g., syncope, dyspnea, or chest pain) and DVT is confirmed, the diagnosis of PE is often assumed. When patients cannot undergo assessment for PE because of clinical instability or contraindications to CT or VQ scan, assessment for DVT is a reasonable alternative. Moreover, when tests for PE (CT or VQ) are negative but a high clinical pretest probability exists, additional exclusion of DVT provides a greater likelihood ratio negative for future risk for thromboembolic disease, bolstering the decision to withhold anticoagulation. PIOPED II demonstrated that lower extremity imaging for DVT detects about 7% more patients requiring anticoagulation than CT pulmonary angiography alone, increasing sensitivity from 83% to 90% when the techniques are combined.83 Historically, DVT was assessed with venography—direct injection of contrast material into the lower extremity venous system. This technique was associated with a risk for inducing DVT and has been largely abandoned. The most common method for detection of DVT today is noninvasive serial compression ultrasonography, often referred to by emergency physicians as “Doppler.” This is a bit of a misnomer, because DVT diagnosis by ultrasound does not require the use of Doppler capability. Normal veins of the lower extremities are readily compressible with an ultrasound probe, whereas thrombosed segments are incompressible (see Figure 14-132 illustrating this technique in the Chapter 14 on extremity imaging). An ultrasound technician or emergency physician can assess for DVT by incremental compression of lower extremity veins from the inguinal ligament to the level of the popliteal fossa. If all veins are compressible, no DVT is present. An incompressible segment is evidence of DVT. Depending on the age of the DVT, the ultrasound appearance may be hyper-, hypo-, or anechoic, so compressibility rather than echotexture is used to differentiate patent and thrombosed veins. Doppler can be used as a supplemental technique. Augmentation of Doppler flow with application of pressure to the calf can be used to prove patency of lower extremity veins, although Doppler has not been shown to improve accuracy over simple compression.84 While many DVTs present with calf swelling or pain, the calf itself is not usually assessed, as superficial and deep calf vein thromboses are not usually treated with anticoagulation because of a low risk for subsequent PE or proximal extension. A meta-analysis of studies of ultrasound found the sensitivity of compression ultrasound for proximal DVT to be 93.8% (95% CI = 92.0%-95.3%) with specificity of 97.8% (95% CI = 97.0%-98.4%).85 Rare studies show a lower sensitivity of ultrasound, approximately 70%, with excellent specificity (100%).86 Studies show the safety of withholding anticoagulation in patients with two negative ultrasound tests for DVT at 1-week intervals, with 3-month rates of thromboembolism of only around 0.6% (95% CI = 0.07%-2.14%). Guidelines call for repeat ultrasound in 1 week to confirm negative findings, partly because of the risk for progression of an undetected calf DVT.87-88 However, repeat ultrasound appears to have a low additional diagnostic yield, around 1.3%.85
Ultrasound is advantageous because it is portable, is inexpensive, and does not require administration of contrast agents or radiation. It is therefore safe in pregnant patients and patients with contrast allergies or renal impairment that may limit use of CT and VQ scan for assessment of PE. Bedside ultrasound can be used in assessment of unstable patients, eliminating hazardous transportation.
CT venography (CTV) can be performed with CT pulmonary angiography (see Chapter 14, Figure 14-133). The chest CT contrast bolus is simply followed into the pelvis and lower extremities, eliminating or minimizing the need for additional contrast administration.56 This is accompanied by a significant additional radiation exposure and cost, raising questions about the relative benefit of the technique. In a study of 427 emergency department patients evaluated with CT pulmonary angiography for PE, addition of CTV identified only a single additional case of isolated DVT without PE, at a cost of $206,400.55 CTV adds between 2 and 6 mSv to the radiation exposure for the patient, including significant gonadal exposure.56 PIOPED II suggests that lower extremity imaging increases sensitivity for thromboembolic disease from 83% (CT pulmonary angiography alone) to 90%.83 The range of reported additional thromboembolic disease cases identified by addition of lower extremity imaging ranges from only 1%89 to an astounding 27% in various studies.90 A meta-analysis found the sensitivity of CTV to be 95.9% (95% CI = 93%-97.8%) with a specificity of 95.2% (95% CI = 93.6%-96.5%).91 Some studies suggest lower sensitivity, closer to 70%.86
Pelvic thrombus appears to be rare, and a more radiation-sparing technique is CT solely of the lower extremities, skipping the pelvis (imaging from acetabulum down, rather than the iliac crest). This technique reduces radiation exposure by about 40% while missing only 4% of DVTs.92 Another method for radiation reduction is use of discontinuous axial CT imaging, with 7.5-mm slices alternating with 15 mm of skipped anatomy. This technique approaches the sensitivity of continuous lower extremity CT imaging and would reduce pelvic irradiation by 75%.93 Ultrasound of the extremities results in no radiation exposure and is a reasonable alternative.
When Is CT Venography a Preferred Approach Over Ultrasound?
CT and ultrasound assessment for DVT are diagnostically equivalent according to data from PIOPED II, so in an average patient, either test is reasonable when viewed purely from the perspective of diagnostic accuracy. The choice of test can be made based on safety, time, and expense in most patients.83 Some patients cannot undergo lower extremity ultrasound because of the presence of overlying cast material or orthopedic external fixators. Obesity makes ultrasound a difficult test, with CT sometimes a better option. Open lower extremity wounds or infections may make compression with an ultrasound probe difficult or unacceptably painful for the patient, in which case CT is a reasonable alternative. When pelvic DVT is specifically suspected, CT or MR venography is preferred over ultrasound, which cannot detect thrombus within the bony pelvis.
Magnetic Resonance Venography for Assessment of Deep Venous Thrombosis
MRI can also be used as a diagnostic test for DVT. It shares many of the advantages of CT: it can be combined with MR pulmonary angiography and can assess for pelvic thrombus, as well as lower extremity clot. MR may be useful in many of the same clinical circumstances that make ultrasound difficult. Unlike CT, MR does not expose the patient to ionizing radiation, making it a reasonable choice in pregnant patients. Some MR sequences (e.g., time of flight and phase contrast venography) can identify clot without the use of contrast agents by using intrinsic properties of flowing blood or clot.94 A meta-analysis showed diagnostic accuracy similar to that reported for both CT and ultrasound: sensitivity of 91.5% (95% CI = 87.5%-94.5% and specificity of 94.8% (95% CI = 93.9%-62.1%).95 PIOPED III demonstrated an improvement in sensitivity for VTE to 92% when lower extremity MRV was combined with contrast-enhanced MR pulmonary angiography, compared with MRA alone (78% sensitivity). However, the combined technique was technically difficult, with 52% of patients having inadequate results.95a MRI is costly compared with other techniques and should not be used as a first-line examination.96
Cost and Radiation Exposure of Diagnostic Tests for Thromboembolic Disease
Table 7-8 depicts approximate costs and radiation exposures for common tests used in evaluation of possible thromboembolic disease. Radiation risks of CT are described in more detail at the end of the chapter.
TABLE 7-8 Approximate Costs and Radiation Exposures of Diagnostic Imaging Tests for Pulmonary Embolism and Deep Venous Thrombosis
| Modality | Cost | Radiation Exposure |
|---|---|---|
| Pulmonary angiography | $6000 | 3.2-30.1 mSv |
| Contrast-enhanced CT pulmonary angiography | $1700 | 1.6-8.3 mSv |
| Contrast-enhanced CT lower extremity and pelvic venography | $500 surcharge in addition to CT pulmonary angiography | 2.5-6 mSv |
| Ventilation–perfusion (VQ) scan | $900 | 1.2-2.0 mSv |
| Ultrasound of bilateral legs | $600 | none |
| D-dimer (rapid ELISA) | $25 | none |
| Chest x-ray (PA and lateral) | $50-$150 | 0.07 mSV |
| Echocardiogram | $250-$500 | none |
| MRI pulmonary angiography or pelvic and lower extremity venography | $2000 | none |
ELISA, enzyme-linked immunosorbent assay.
From East Ohio Regional Hospital. Patient price information list. (Accessed at http://www.eastohioregionalhospital.com/pricelist.asp.); Harvard Pilgrim HealthCare. Massachusetts medical cost data. (Accessed at https://www.harvardpilgrim.org/portal/page?_pageid=253,192924&_dad=portal&_schema=PORTAL.); Hunsaker AR, Zou KH, Poh AC, et al. Routine pelvic and lower extremity CT venography in patients undergoing pulmonary CT angiography. AJR Am J Roentgenol 190:322-6, 2008; Johnson JC, Brown MD, McCullough N, Smith S. CT lower extremity venography in suspected pulmonary embolism in the ED. Emerg Radiol 12:160-3, 2006; Stein PD, Woodard PK, Weg JG, et al. Diagnostic pathways in acute pulmonary embolism: Recommendations of the PIOPED II investigators. Radiology 242:15-21, 2007.
Imaging of Nontraumatic Aortic Disease: Dissection and Aneurysm
Let’s move on to a discussion of aortic diseases. Physicians are often imprecise in their nomenclature, but when we discuss nontraumatic aortic pathology, we are dealing with two separate processes, aortic aneurysm (with risk for rupture and hemorrhagic shock) and aortic dissection (with risk for occlusion of branch vessels and retrograde extension to the pericardium and aortic valve). These may occur independently or may coexist in a given patient. While a complete discussion of the risk factors and pathology of the two processes is beyond the scope of this book, understanding the difference between the two categories of disease is essential to understanding diagnostic imaging for these. As you will see, aortic dissection may be extremely difficult to diagnose by x-ray when a concurrent aortic aneurysm is not present. The figures in this section are arranged to depict concepts about aortic disease, centered on clinical cases. Many cases show both x-ray and CT findings. Be sure to review all figures associated with a case to glean the most information.
Aortic aneurysm (Figures 7-60 and 7-61; see also Figures 7-67 through 7-74 and 7-92 through 7-94) is defined by an aortic diameter exceeding 3 cm (50% larger than the upper limit of normal, 2 cm). However, clinically significant thoracic aneurysms are substantially larger. The risk for rupture is proportional to diameter but must be weighed against the operative mortality risk. In general, ascending thoracic aortic aneurysms should be repaired at 5.5 cm diameter and descending thoracic aneurysms at 6.5 cm. Patients with Marfan’s syndrome or familial aneurysms should undergo repair of the ascending aorta at 5 cm or the descending aorta at 6 cm.97 Advancing age, cigarette smoking, and male gender are other significant risk factors for aortic aneurysm. Because aneurysm is a disease characterized by an enlarging aortic diameter, the chest x-ray silhouette is a better test for this disease than for aortic dissection—but from a clinical perspective, ruling out both diseases is usually necessary in a symptomatic patient, making chest x-ray a poor diagnostic exam.
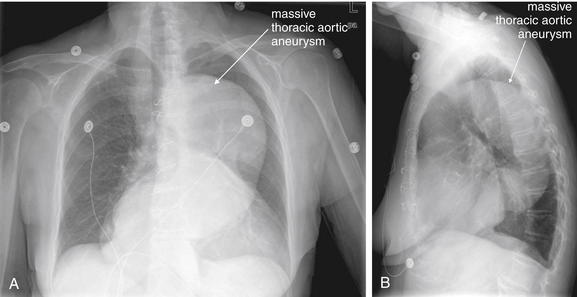
Figure 7-60 Thoracic aortic aneurysm.
This 74-year-old female presented with myalgias and back pain. Her chest x-ray shows a massively dilated thoracic aortic aneurysm. A wide mediastinum may be an indication of aortic aneurysm. A, Posterior–anterior chest x-ray. B, Lateral chest x-ray.
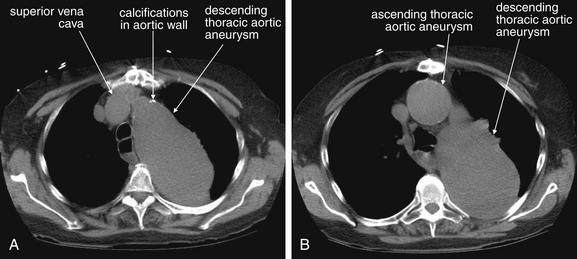
Figure 7-61 Thoracic aortic aneurysm.
Same patient as Figure 7-60. The patient underwent noncontrast CT because of renal insufficiency. The ascending aorta measures 4.5 cm in diameter, whereas the descending aorta measures 7 by 10 cm. Without contrast, a superimposed dissection cannot be detected. A, B, Axial slices moving from cephalad to caudad.
Figures 7-62 through 7-98 demonstrate a series of cases of nontraumatic aortic dissection, with the chest x-ray, CT scan, and aortogram from the same patient grouped together when available. Figures 7-99 and 7-100 demonstrate a case of an abnormal mediastinum on chest x-ray that was not because of aortic dissection or aneurysm—a reminder of the limitations of chest x-ray.
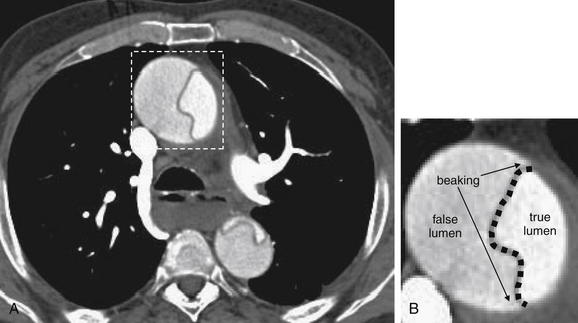
Figure 7-62 Anatomy of aortic dissection, CT angiogram.
A, Axial CT image. B, Close-up.
In aortic dissection, an intimal flap (dotted black line in magnified view) divides the aorta into a true and a false lumen. The characteristic sharp corners of the false lumen are known as “beaking.”
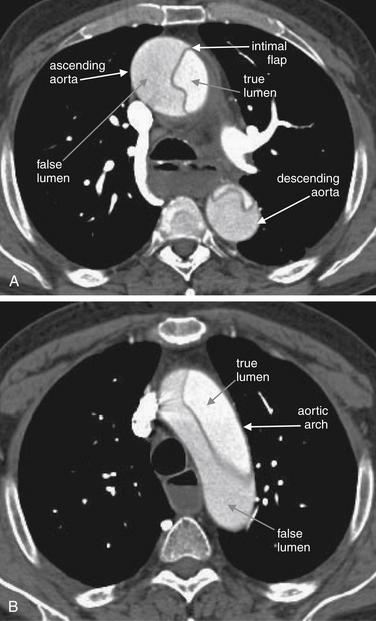
Figure 7-63 Aortic dissection, CT angiogram.
Cross sections through the aorta, showing a large dissection. An intimal flap divides the aorta into a true and a false lumen. Here, the true lumen is brightly filled with contrast, whereas the false lumen appears darker because of a lower flow of contrast. The dissection involves the ascending aorta, arch, and descending aorta. There is no extravasation of contrast outside of the aortic lumen, and the patient’s mediastinal silhouette on chest x-ray was normal. In this patient, the ascending aorta is somewhat dilated. The descending aorta is of normal size. A, Axial slice through the ascending and descending aorta. B, A more cephalad axial slice through the aortic arch.
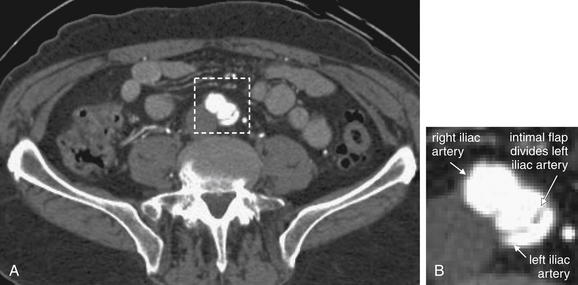
Figure 7-64 Aortic dissection with iliac artery dissection, CT angiogram.
A, Axial image through iliac arteries at level of pelvis. B, Close-up. In this massive aortic dissection, the intimal flap extends into the left iliac artery. The right iliac artery is normal. Aortic dissection may involve any branch vessel. Consequently, the usual CT protocol for aortic dissection includes CT of the chest, abdomen, and pelvis to include the entire aorta and its major branches.
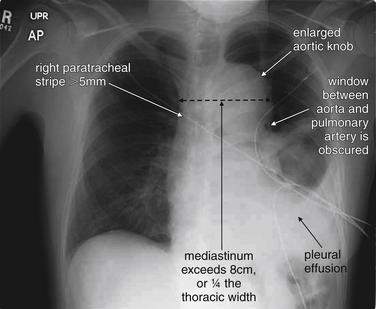
Figure 7-65 Aortic dissection with abnormal chest x-ray.
This patient had experienced chest pain 1 week prior, which had spontaneously resolved, although dyspnea persisted. Chest x-ray demonstrates a wide mediastinum and aortic knob, confirmed on CT (Figure 7-66). The left pleural effusion was shown on CT to be a hemothorax from extravasating aortic blood. Other classic findings of aortic dissection are also seen here. Though none of these findings is reliable individually, in aggregate they are quite concerning for aortic pathology in this patient.
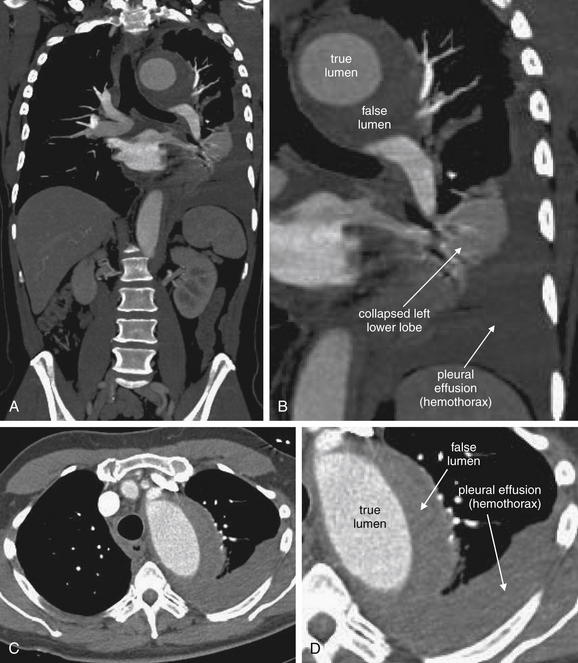
Figure 7-66 Aortic dissection.
A, Coronal image. B, Close-up from A. C, Axial image. D, Close-up from C. Same patient as in Figure 7-65. This aortic dissection occurred in an existing large thoracic aneurysm. Blood extravasated, causing hemothorax and collapsing the left lower lung. In the coronal images, note that the aorta immediately abuts the left main bronchus, explaining why displacement of this bronchus is seen on chest x-ray in some cases of aortic pathology.
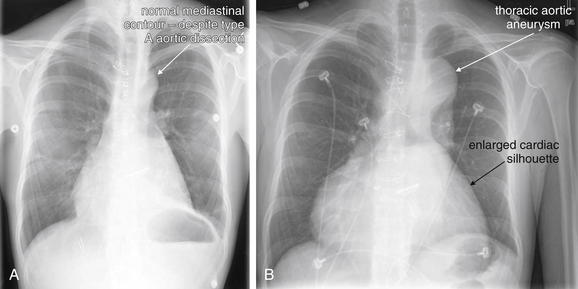
Figure 7-67 Aortic dissection versus aneurysm.
Because aortic dissection may involve only the intima and may not violate the external contour of the aorta, the mediastinal silhouette may not change on chest x-ray. A normal chest x-ray occurs in approximately 12% of cases and cannot rule out aortic dissection when the condition is suspected clinically. Aortic aneurysm by definition involves a 50% or greater increase in aortic diameter, so the mediastinal silhouette is usually abnormal. This male patient with Marfan’s syndrome had mitral valve replacement at age 13. At age 20, he developed chest pain and was found to have type A aortic dissection. He subsequently developed worsened aneurysmal dilatation of his aorta, chronic aortic dissection, and a dilated cardiomyopathy with an ejection fraction less than 15%. Compare his chest x-ray at age 20 on the date of his acute aortic dissection (A) with his chest x-ray a mere 4 years later (B). The widening of his mediastinum seen in B is a result of his thoracic aneurysm—he has type A aortic dissection at the time of both x-rays, but the aortic knob and mediastinum appear normal in A.
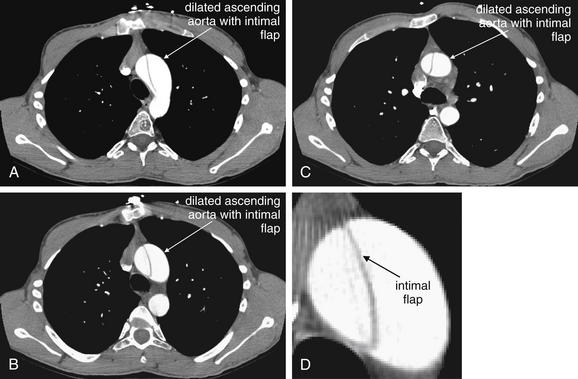
Figure 7-68 Aortic dissection.
This 20-year-old male with Marfan’s syndrome presented with chest pain. His chest x-ray is shown in Figure 7-67, A, and has a normal mediastinal silhouette. The CT images here demonstrate an intimal flap involving the ascending aorta and proximal arch, a type A dissection. The patient also has aneurysmal dilatation of the ascending aorta, which is nearly twice the diameter of the descending aorta. A through C, Axial images moving from cephalad to caudad. D, Close-up from B.
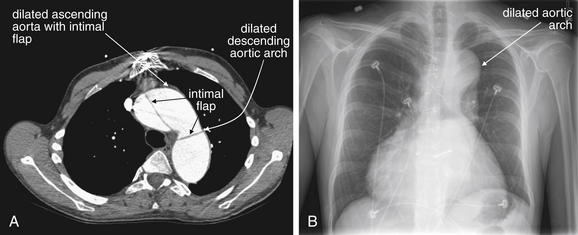
Figure 7-69 Aortic dissection within an aneurysm.
Same patient as Figure 7-68, 4 years later. The patient now has a chronic type A dissection, with a markedly aneurysmal thoracic aorta. Compare this axial CT image (A) with that in Figure 7-68, noting that the descending aorta is now dilated as well. Compare the size of the aorta with that of the thoracic vertebral body. B, Chest x-ray at the time of the CT in A. The aortic aneurysm renders the aortic contour abnormal on chest x-ray. The intimal flap of dissection is not visible on chest x-ray.
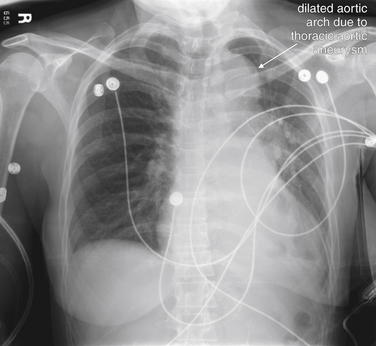
Figure 7-70 Aortic dissection type B within thoracic aneurysm.
This patient with a known thoracic aneurysm developed acute chest and back pain. Her chest x-ray is abnormal—with a dramatically enlarged aortic knob and wide mediastinum—but these are old findings, unchanged from her prior chest x-rays. Her CT angiogram is shown in Figure 7-71.
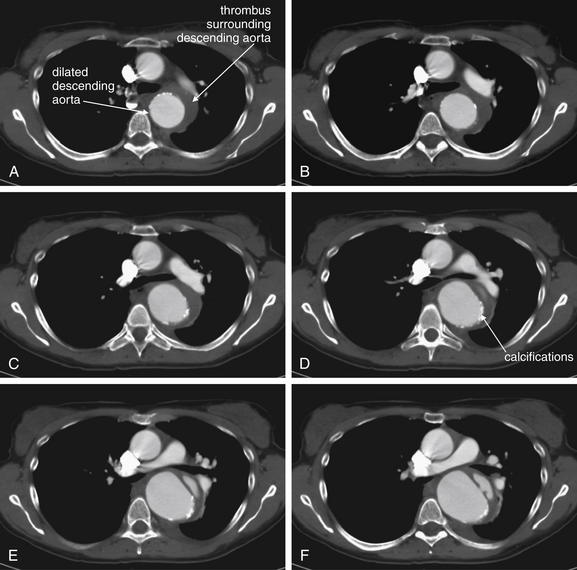
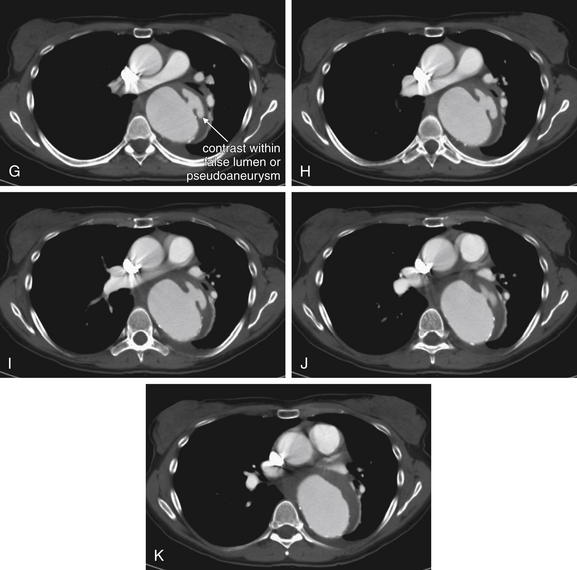
Figure 7-71 Aortic dissection type B in thoracic aneurysm, CT angiogram.
Same patient as in Figure 7-70. A through K, Axial computed tomography (CT) images progressing from cephalad to caudad. This series of CT images shows an aneurysmal descending aorta, partially surrounded by a thombosed layer outside of vascular calcifications (bright white punctate lesions) within the aortic wall. This was described by the radiologist as a chronic type B aortic dissection (defined by its involvement of the descending aorta only). However, it may be a pseudoaneurysm of the descending aorta, arising from a true aneurysm. Regardless, contrast can be seen within a mushroom-shaped region on the left side of the patient’s aorta.
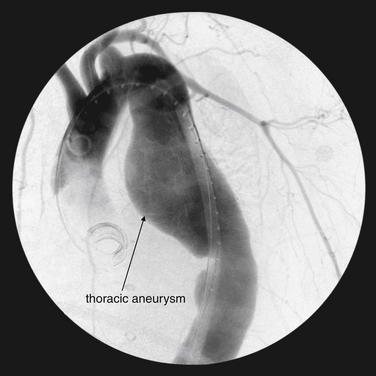
Figure 7-72 Aortic dissection type B in thoracic aneurysm.
Same patient as in Figures 7-70 and 7-71. This aortogram, performed during stent graft placement for repair of the chronic type B dissection and thoracic aneurysm, clearly shows the aneurysm but not the dissection. Because of its cross-sectional ability, computed tomography is particularly helpful at depicting the internal anatomy of the aorta.
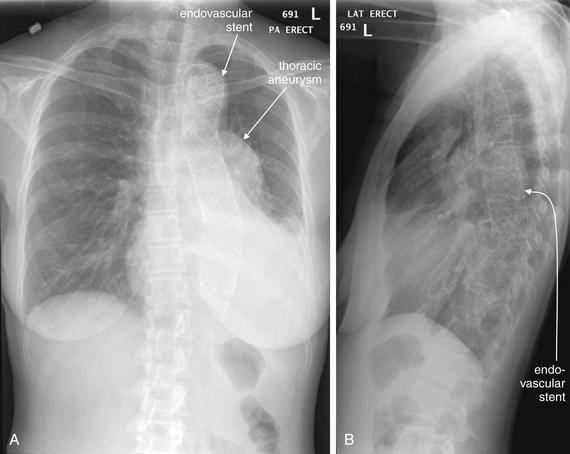
Figure 7-73 Thoracic aneurysm repair.
A, Posterior–anterior chest x-ray. B, Lateral chest x-ray. The same patient as Figures 7-70 through 7-72, after endovascular stenting. The mediastinal silhouette remains wide, because the thoracic aneurysm sac has not been removed—the endovascular stent runs through it and protects against aneurysm rupture.
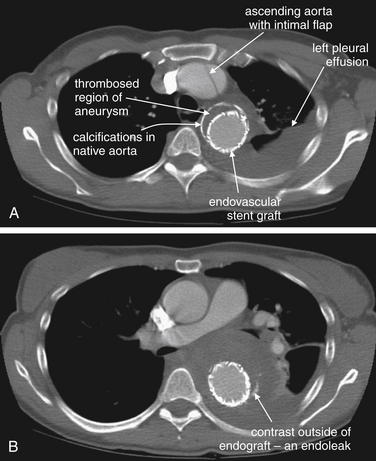
Figure 7-74 Complications of thoracic aneurysm repair: type A aortic dissection and endoleak.
Same patient as Figure 7-73. This CT angiogram shows several findings. First, the endovascular graft is visible as a bright white ring (because of its metal composition). A, It is surrounded by the native calcifications of the patient’s thoracic aneurysm. The lumen outside of the stent graft has thrombosed as expected and contains no contrast. The stent itself is patent and filled with contrast. The ascending aorta has an intimal flap—indicating a new type A aortic dissection. A pleural effusion is present. B, A more caudad slice shows a small amount of contrast outside of the stent graft but inside of the expected contour of the original aneurysm—an endoleak. Endoleaks are common after endovascular repair and are discussed in detail in Chapter 11. An endoleak is defined as the continued flow of blood into the aneurysm sac. Endoleaks are graded as one of four types. Type 1 endoleaks occur immediately at the time of placement of an endovascular graft, usually resulting from missizing of the graft, such that the proximal or distal ends of the graft are not sealed against the aorta. This requires placement of a larger graft, because type 1 endoleaks leave the aneurysm sac subject to systemic vascular pressures with continued risk for acute rupture. Type 2 endoleaks occur because of retrograde flow of blood through collateral vessels into the aneurysm sac. Common examples include filling of the aneurysm sac from spinal perforating arteries or intercostals arteries. Type 2 endoleaks are often observed without treatment, as they do not subject the aneurysm sac to full systemic vascular pressures and are at relatively low risk for rupture. Type 2 endoleaks that do not resolve spontaneously can be treated with angiographic embolization. Type 3 endoleaks occur when a tear in the fabric of the graft occurs, or if separation occurs between grafts consisting of multiple modules. This type of leak is relatively rare but leaves the aneurysm sac subject to systemic vascular pressures, requiring replacement of the graft because of continued risk for aneurysm rupture. Type 4 endoleaks occur from leaks through pores of the graft material and usually do not require repair. The type of endoleak can often be determined from CT. In this patient, the contrast was noted to arise from a single intercostal artery, making this a type 2 endoleak.
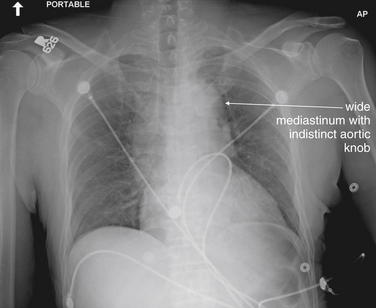
Figure 7-75 Aortic dissection type A with abnormal chest x-ray.
This 50-year-old male presented with throat and abdominal pain, radiating to his legs. He was hypertensive (240 mm Hg systolic blood pressure), and aortic dissection was suspected, despite the absence of chest or back pain. His chest x-ray shows a wide mediastinum—but as the computed tomography (CT) in Figure 7-76 shows, this is due to a preexisting dilated ascending aorta. CT confirmed acute aortic dissection, but because the dissection was confined to the intima, it would not be expected to change the mediastinal contour on chest x-ray.
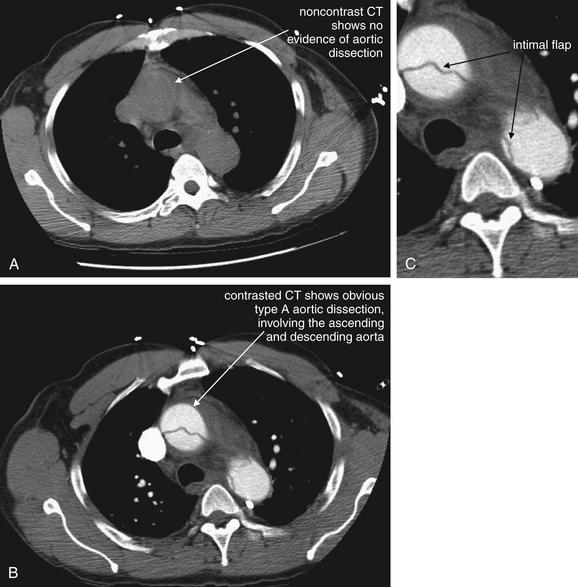
Figure 7-76 CT angiogram in a patient with type A aortic dissection and abnormal chest x-ray.
This figure demonstrates several essential points. First, the intimal flap of aortic dissection cannot be seen without injection of vascular contrast material. Images A and B were acquired minutes apart. A, A section through the ascending and descending aorta without contrast. B, A section through the same level after contrast administration. The intimal flap is invisible in A but readily apparent in B. C, Close-up from B. The second essential point for this figure is the effect of aortic dissection on mediastinal contour. When nontraumatic dissection involves only the intima, the external contour of the aorta does not change. The mediastinum may or may not be widened—depending on the configuration of the aorta and other mediastinal structures before dissection occurred. This patient’s mediastinum is wide, but not because of his dissection.
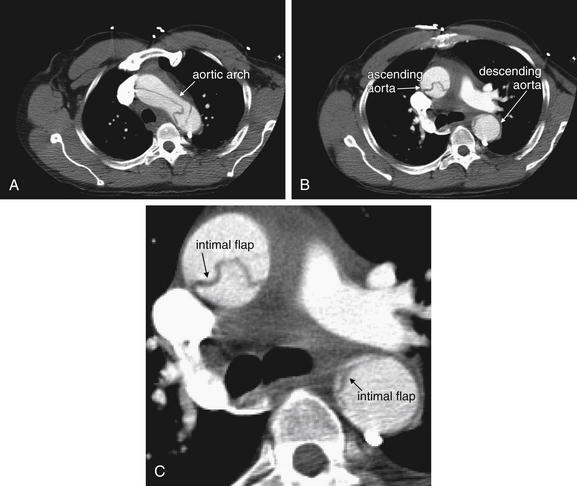
Figure 7-77 CT angiogram in a patient with type A aortic dissection and abnormal chest x-ray.
Same patient as in Figures 7-75 and 7-76. A, An axial computed tomography (CT) slice through the aortic arch. B, A more caudad slice. C, Close-up from B. More images from the same patient depict the dissection flap in the ascending aorta, arch, and descending aorta. When the flap is located centrally within the lumen, it is readily apparent on contrasted CT. This is the case here in the ascending aorta and arch. However, in this patient, the true and false lumens are quite asymmetrical in the descending aorta and the intimal flap hugs the aortic wall, making it subtler. Inspect carefully for flaps along the aortic wall.
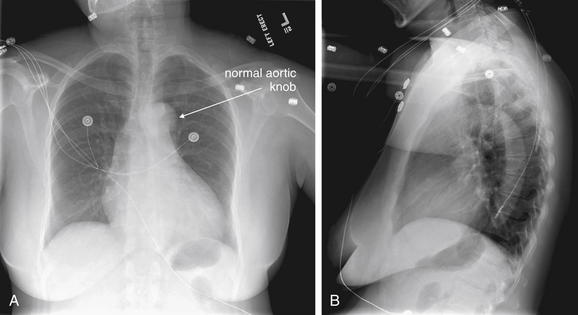
Figure 7-78 Type A aortic dissection with normal chest x-ray.
A, Posterior–anterior chest x-ray. B, Lateral chest x-ray. This 45-year-old female with no past medical history presented with burning chest pain similar to her past indigestion. Her chest x-ray was interpreted as normal. Her aortic knob is well defined, and her mediastinum is not widened. She was admitted to an observation unit for assessment of possible cardiac ischemia. During an exercise stress echocardiogram, the patient developed leg pain and a dissection flap was noted on ultrasound. Her CT aortogram is reviewed in Figure 7-79. How can aortic dissection occur with a normal chest x-ray? Spontaneous aortic dissection affects the intima, so the external contour of the aorta may not acutely change. About one in eight dissections occurs with a normal chest x-ray.
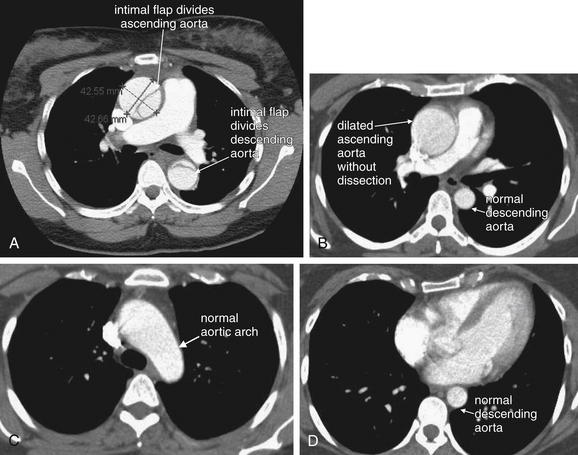
Figure 7-79 CT aortogram in a patient with type A aortic dissection and a normal chest x-ray.
A, Same patient as in Figure 7-78, with Stanford type A aortic dissection. Compare with B through D, showing another patient with a dilated ascending aorta but no dissection. The normal aorta should be uniformly filled with contrast, without evidence of an intimal flap. The ascending and descending aorta should be circular in cross section. The arch is elliptic in cross section. Both of these patients have a dilated aortic root, a risk factor for aortic dissection. However, in neither patient did the ascending aorta result in a significantly enlarged mediastinum on chest x-ray.
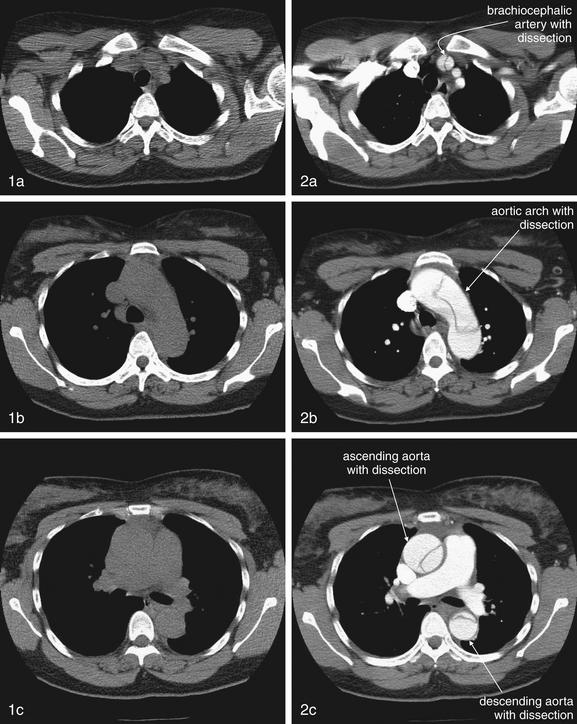
Figure 7-80 Contrast is essential to the CT diagnosis of aortic dissection.
Same patient as Figure 7-78 and Figure 7-79, A. Series 1 (left column) shows noncontrast chest CT, moving from cephalad to caudad. Series 2 (right column) shows slices from the same positions, now with intravenous contrast. The importance of contrast for the diagnosis of aortic dissection cannot be overemphasized. The intimal flap is invisible without contrast.
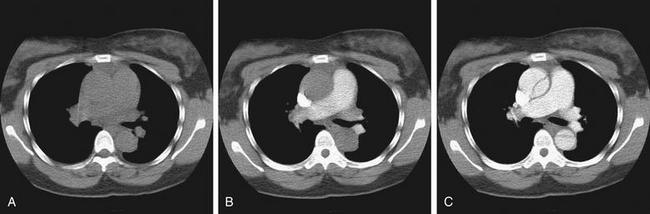
Figure 7-81 Contrast timing in the CT diagnosis of aortic dissection.
Same patient as Figures 7-78, 7-79, A, and 7-80. For the diagnosis of aortic dissection, appropriate timing of the injected contrast bolus is essential. Fortunately, automated bolus tracking software allows a small test bolus to be performed, to gauge when the injected contrast will reach the vascular bed of interest. The images show the same patient during different phases of contrast injection. A, No contrast has been injected, and the aortic dissection is not visible. B, Contrast has reached the pulmonary artery—as would be the goal for a CT pulmonary arteriogram for the diagnosis of pulmonary embolism—and again, the aortic dissection is invisible. C, Contrast has reached the aorta and the dissection has finally become visible. The necessity for accurate contrast timing is an important concept for the emergency physician. It stresses the importance of informing your radiologist of your diagnostic priorities so that the CT protocol can be adjusted accordingly. In addition, the rapid contrast infusions necessary for high-quality CT angiograms require relatively large intravenous access.
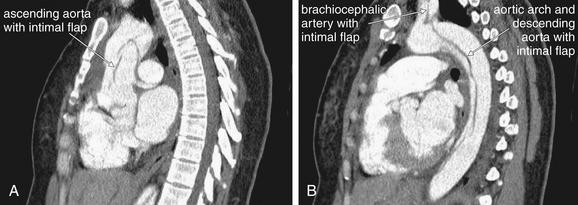
Figure 7-82 CT angiogram from a patient with type A aortic dissection and a normal chest x-ray.
Same patient as Figures 7-78, 7-79, A, 7-80, and 7-81. A, B, Sagittal reconstructions from CT aortogram. These sagittal reconstructions reveal the aortic dissection to involve the aortic root and ascending aorta, the arch and descending aorta, and the brachiocephalic artery. Because the aorta does not lie in a single sagittal plane, the entire aorta is not visible in a single thin sagittal slice. Special curved reconstructions or thick slab reconstructions called maximum intensity projections can allow more of the aorta to be seen in a single image.
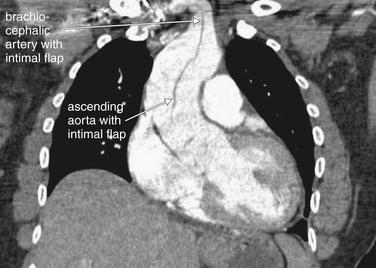
Figure 7-83 Multiplanar CT imaging can reveal dissection involving aortic branch vessels.
Same patient as Figures 7-78, 7-79, A, and 7-80 through 7-82. This coronal reconstruction shows an intimal flap arising in the ascending aorta and extending into the brachiocephalic artery. Multiplanar reconstructions can help to define branch vessel involvement that can complicate aortic dissection.
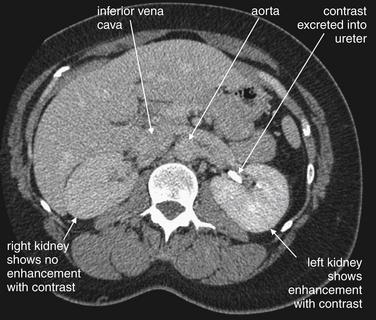
Figure 7-84 Delayed CT images can reveal organ hypoperfusion resulting from aortic dissection.
Same patient as Figures 7-78, 7-79, A, and 7-80 through 7-83. Delayed images through the abdomen in the same patient reveal a lack of normal enhancement of the right kidney—an indication of ischemia from involvement of the right renal artery by the aortic dissection. The left kidney shows enhancement and is even beginning to excrete contrast into the ureter. The aorta and inferior vena cava do not contain contrast, since it has been several minutes since the contrast injection. As a consequence, the aortic dissection is again invisible.
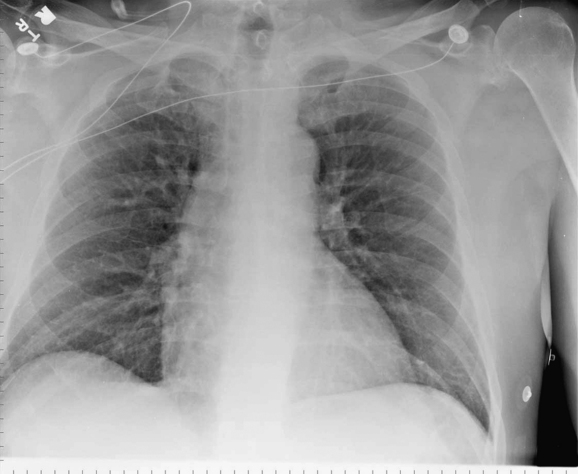
Figure 7-85 Aortic dissection type A with normal chest x-ray.
A 72-year-old male with neck pain radiating into his chest. The patient was given aspirin and nitroglycerin by emergency medical services with improvement in his pain from 10 out of 10 to 2 out of 10. On electrocardiogram, the patient had ST segment depression in leads V3 through V5, and heparin was initiated. The chest x-ray appears normal, with a well-defined aortic knob and normal mediastinum. The emergency physician then suspected aortic dissection because of the migratory nature of the patient’s pain, and chest CT was performed (Figure 7-86).
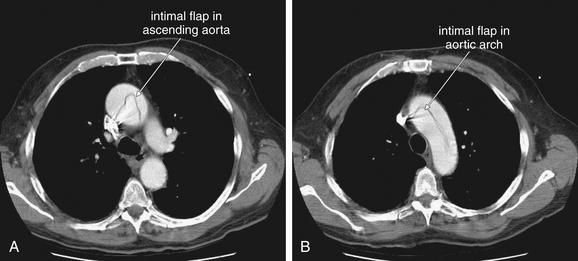
Figure 7-86 CT aortogram in a patient with type A aortic dissection and a normal chest x-ray.
Same patient as Figure 7-85. This computed tomography with intravenous contrast shows an intimal flap within the ascending aorta (A) and aortic arch (B). The ascending aorta is enlarged, measuring 5.4 cm in diameter. Because only the intima, not the muscularis layer, is affected, no blood has left the aorta. No mediastinal hematoma is present, and no increase in mediastinal diameter has occurred acutely. The result is the normal chest x-ray seen in this patient in Figure 7-85. Why did the ischemic electrocardiogram changes occur? The dissection flap may be intermittently occluding the coronary artery ostia.
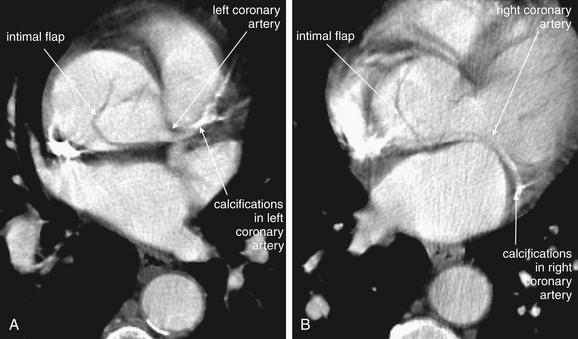
Figure 7-87 Aortic dissection with coronary artery involvement.
Same patient as Figures 7-85 and 7-86. Why did the patient have ischemic electrocardiogram (ECG) changes? Again, the dissection flap may be intermittently occluding the coronary artery ostia. In these two panels, the intimal flap appears to lead into the ostia of the left (A) and right (B) main coronary arteries. The course of these arteries is marked by calcifications. This CT was not ECG-gated to reduce motion artifact, so the coronary arteries are not seen with optimal clarity. Chapter 8 discusses ECG-gating of CT in detail.
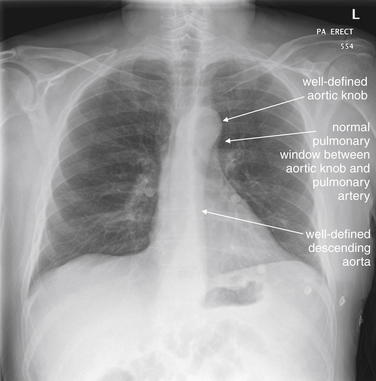
Figure 7-88 Aortic dissection Stanford type B with normal chest x-ray.
This 63-year-old male experienced sudden, severe, sharp back chest pain radiating to the interscapular area and then to the upper abdomen. Aortic dissection was suspected resulting from the classic character of the patient’s pain. Chest x-ray was normal, with a narrow mediastinum and well-defined aortic knob and course of the descending aorta. Computed tomography was ordered because of high pretest probability of aortic dissection (Figure 7-89). Remember that a normal chest x-ray does not rule out thoracic aortic dissection.
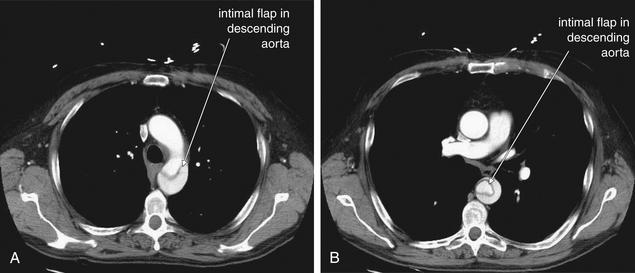
Figure 7-89 CT aortogram in a patient with Stanford type B aortic dissection and normal chest x-ray.
Same patient as Figure 7-88. A, CT aortogram demonstrates an intimal flap involving only the descending aorta—a type B dissection. The aorta is of normal caliber. Because the intima is the only layer of the aortic wall involved, no blood has escaped the aorta, no periaortic hematoma is present, and no change in mediastinal contour is seen on chest x-ray (Figure 7-88). B, An interesting configuration of the intimal flap.
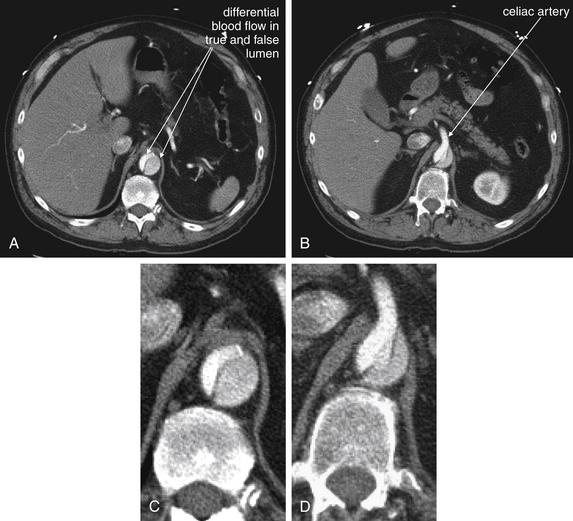
Figure 7-90 Branch vessel involvement from aortic dissection.
Same patient as Figure 7-88 and 7-89. Imaging of the entire aorta is necessary when dissection is suspected. The dissection continues into the abdomen, involving the proximal celiac artery. Note the differential flow in the true and false lumens. Bright white contrast indicating brisk flow supplying the celiac artery. The darker lumen has a lesser amount of contrast within it, mixed with blood. A, Axial image just cephalad to the celiac artery. B, A few slices caudad to A, the celiac artery emerges from the aorta. C, Close-up from A. D, Close-up from B.
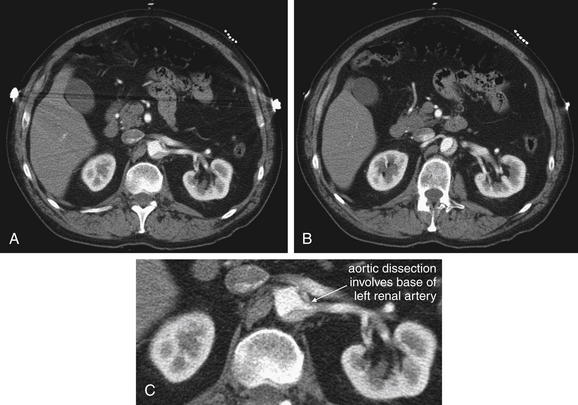
Figure 7-91 Branch vessel involvement from aortic dissection.
A, B, Sequential images at the level of the renal artery. C, Close-up from A. Same patient as Figures 7-88 through 7-90. Here, the intimal flap and false lumen appear to involve the origin of the left renal artery, although the kidney does enhance with contrast.
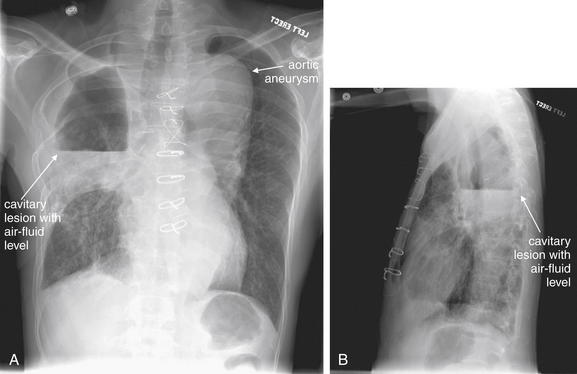
Figure 7-92 Aortic aneurysm and mycetoma.
A, Posterior–anterior chest x-ray, B, Lateral chest x-ray. This 51-year-old male presented with fever, cough, and chest pain. The patient had a history of Aspergillus fumigatus mycetoma, accounting for the right upper lobe cavitary lesion. A superimposed lung abscess is also possible, and tuberculosis should be considered. Also notable is the wide mediastinum, consistent with a thoracic aortic aneurysm, which has previously undergone endovascular repair. Chest CT was performed to evaluate these abnormalities further (Figures 7-93 and 7-94).
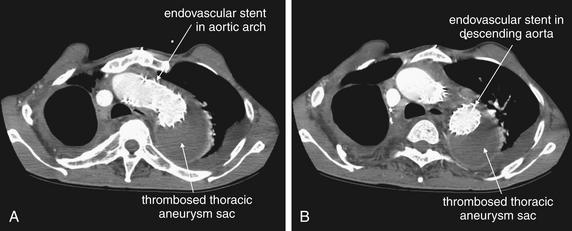
Figure 7-93 Aortic aneurysm with endovascular repair.
A, B, Axial computed tomography images, moving from cephalad to caudad. Same patient as Figure 7-92. This 51-year-old male has had an endovascular repair of a large thoracic aortic aneurysm. The aneurysm sac persists but has thrombosed, resulting in a dark soft-tissue density when viewed on soft-tissue window—the expected result of the endovascular repair. The aortic stent is patent and fills with intravenous contrast, resulting in the bright white color within it. The contour of the aneurysm sac remains readily visible on the patient’s chest x-ray (Figure 7-92).
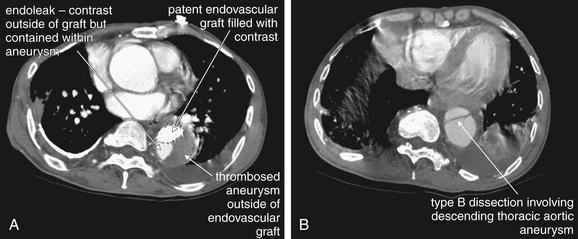
Figure 7-94 Endoleak and type B aortic dissection.
Additional images from the same patient as Figures 7-92 and 7-93 reveal two complications. A, The descending aorta shows three compartments: an endovascular graft filled appropriately with contrast, a thrombosed segment of descending aortic aneurysm (the expected effect of excluding blood flow from the aneurysm with the endovascular stent), and a region of contrast that lies outside of the endovascular graft. This latter region is called an endoleak, meaning a region of blood leak outside of the endovascular graft but still contained within the aneurysm sac. This is a potentially serious failure of the endovascular stent, because blood leaking outside of the stent could leak from the aneurysm should it rupture. Small endoleaks are common and are often not treated, because they may thrombose spontaneously. Endoleaks are discussed in more detail in Chapter 11. B, An intimal flap of a type B dissection is seen, caudad to the termination of the endovascular graft.
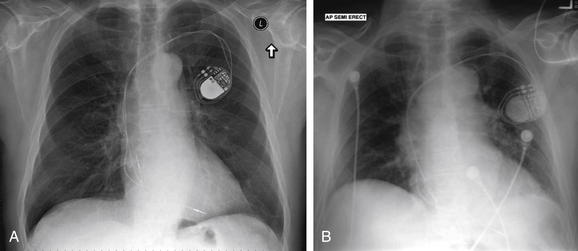
Figure 7-95 Aortic dissection type A, 1 year prior and on day of acute dissection.
As described earlier, a spontaneous aortic dissection may not acutely change the aortic caliber or result in mediastinal hematoma—resulting in little or no change in the chest x-ray. The wide mediastinum often described may reflect a preexisting aortic aneurysm, which is a risk factor for aortic dissection. About 12% of aortic dissections occur with a normal chest x-ray. This patient had chest x-rays 1 year prior (A) and on the day of an acute type A aortic dissection (B). The radiology interpretation was, “Given differences in technique, cardiac and mediastinal contours are stable.” Computed tomography images from the patient are shown in Figure 7-96.
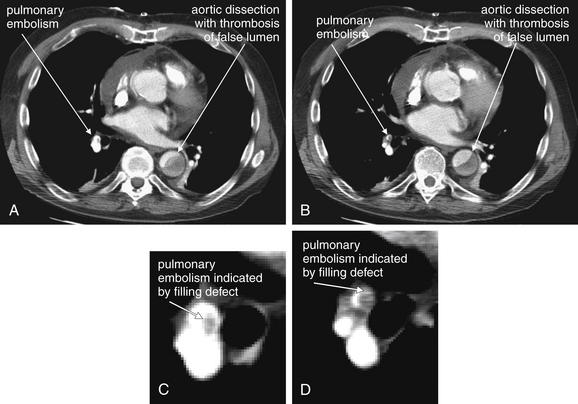
Figure 7-96 Aortic dissection type A with pulmonary embolism (PE).
Same patient as Figure 7-95. Later, this patient continued to have a chronic type A aortic dissection, and has now developed an additional complication—a PE. The false lumen of the dissection is seen to be thrombosed—explaining the absence of contrast within it. PE is discussed in more detail earlier in the chapter. A and B, two adjacent slices through the chest, revealing the descending aorta and branches of the right pulmonary artery. C and D, close-ups from A and B.
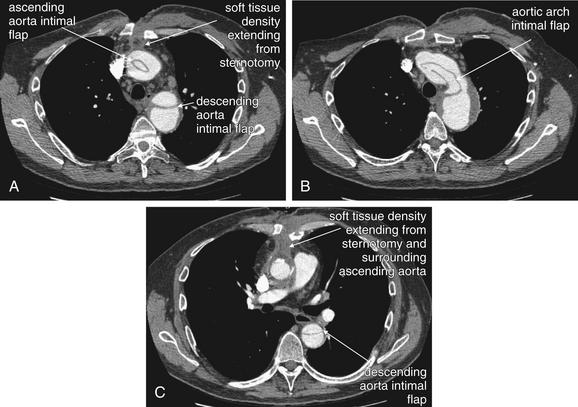
Figure 7-97 Aortic dissection type A with wound infection.
This patient underwent open repair of a type A aortic dissection and returned with a poorly healing sternotomy wound. Computed tomography shows soft-tissue density extending from the wound and surrounding the ascending aorta—suspicious for invasive infection. In addition, intimal flaps remain. A through C, Axial slices at various aortic levels.
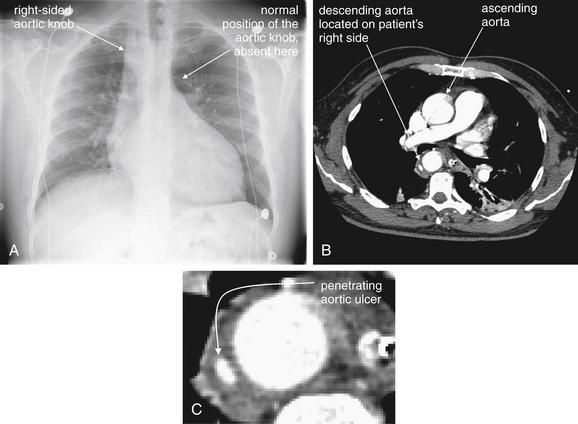
Figure 7-98 Right aortic arch.
Variations in the appearance of the mediastinum on chest x-ray may occur because of congenital abnormalities. This 48-year-old male complained of chest pain and had a history of atrial fibrillation and stroke. A, His chest x-ray lacks the normal aortic knob—careful inspection reveals the aortic knob to be on the right. B, Chest computed tomography was performed and confirmed a right-sided aortic arch. A focal penetrating aortic ulcer or dissection was also noted (C, close-up). This connected to the main aortic lumen on an adjacent slice.
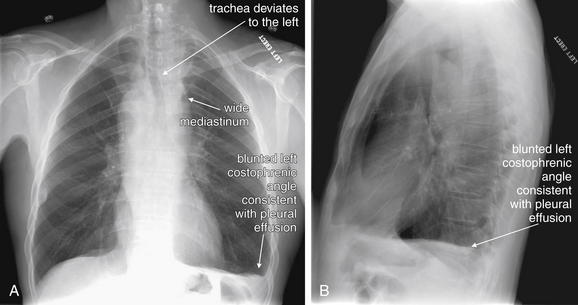
Figure 7-99 Right aortic arch and mediastinal mass.
This 63-year-old male presented with 1 month of neck fullness and dysphagia. His chest x-ray shows a wide mediastinum, and the trachea deviates to the left just below the level of the clavicles. The clinical history was more concerning for mass than for aortic dissection. Computed tomography was performed and is reviewed in Figure 7-100. A, Posterior–anterior chest x-ray. B, Lateral chest x-ray.
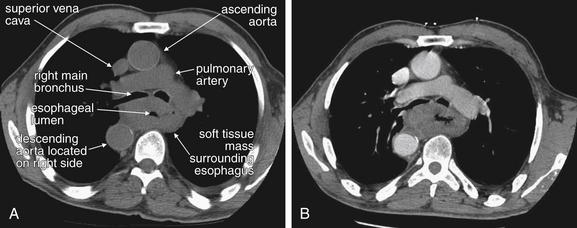
Figure 7-100 Right-sided aortic arch and mediastinal mass.
Chest computed tomography from the same patient as in Figure 7-99. A, Noncontrast axial image. B, Image at the same level following IV contrast administration. Incidentally, the patient has a right-sided aortic arch. In addition, posterior to the main bronchi, a soft-tissue mass surrounds the esophagus. The esophageal lumen is filled with air and appears black. Workup revealed esophageal cancer. Not all mediastinal widening is the result of acute aortic pathology.
Nontraumatic aortic dissection occurs as shear forces of blood flow initiate a tear in the intimal lining. This tear may extend proximally or distally, forming an intimal flap that divides the aorta into a true and a false lumen (see Figures 7-62 through 7-64). As the tear progresses, other layers of the aortic wall may be violated and blood may extravasate, in which case the classic chest x-ray findings of an indistinct aortic knob and widened mediastinum may be present (see Figure 7-65; see also Figures 7-70 and 7-75). However, the event begins as a purely intimal injury. As a consequence, the external aortic contour may not alter during aortic dissection.98 Figures 7-78, 7-85, 7-88, and 7-95 demonstrate chest x-rays with a normal or near-normal mediastinum despite dramatic aortic dissections proven on CT. Review these chest x-rays and the accompanying CT scans (see Figures 7-79, 7-86, 7-89 through 7-91, and 7-96). Aortic dissections may extend into or occlude the origins of branch vessels, including coronary, carotid, extremity, renal, mesenteric, or spinal vessels (see Figures 7-64, 7-80, 7-82 through 7-84, 7-87, 7-90 and 7-91). Dissection may also lead to aortic valve regurgitation or pericardial tamponade. Risk factors for dissection include hypertension, connective tissue disorders such as Marfan syndrome (see Figures 7-67 and 7-68) and Ehlers-Danlos syndrome, bicuspid aortic valve, Turner syndrome, prior aortic valve replacement, and third-trimester pregnancy, when increased production of collagenase is thought to weaken the aortic wall.99 Aortic dissection has been described in patients without evident preexisting aortic pathology. In these cases, a precipitating event, sometimes hypertension associated with drug use (cocaine)100 or physical exertion (power weight lifting)101 has been suggested as the cause.102