Who Needs Aortic Imaging? Can Clinical Risk Stratification Rule Out Aortic Dissection?
Unfortunately, no simple, accurate, and well-validated clinical scoring system exists to screen patients for aortic dissection. Shirakabe et al. described an emergency room acute aortic dissection score, using four clinical criteria: (1) presence of back pain, (2) mediastinal–thoracic ratio greater than 30%, (3) aortic regurgitation, and (4) aortic diameter greater than 30 mm on ultrasound. A score of at least three was 93% sensitive and 78% specific. However, the need for thoracic echocardiography limits the utility of this rule in screening chest pain patients for dissection and determining the need for CT. In many centers, CT may be more readily available than echocardiography. In addition, this scoring system has not been prospectively validated outside of the original study environment.103 Acute aortic dissection is correctly suspected initially in only 15% to 43% of presentations, suggesting that the combination of risk factor analysis, history, and physical examination has poor sensitivity. A systematic review in JAMA in 200299 noted that a thorough chest pain history, including the quality, radiation, and intensity at onset, is associated with a higher initial diagnostic accuracy but still misses 10% of aortic dissections. This review notes that many classically described abnormalities of aortic dissection, including significant differences in interarm blood pressure measurements, have little evidence basis. The presence of upper extremity blood pressure differences greater than 20 mm Hg is sometimes recommended as a warning sign for aortic dissection, though studies show that 18% of asymptomatic subjects with a history of hypertension and 15% of asymptomatic subjects with no such history have a blood pressure disparity exceeding 10 mm Hg between upper extremities.103a,103b A variety of classic signs and symptoms have poor discriminatory power when used alone. Table 7-9 reviews some history and physical examination findings that may increase or decrease the risk for aortic dissection. However, no single element of history or physical examination appears sensitive enough to rule out aortic dissection, meaning that definitive imaging should be performed when the diagnosis is seriously entertained.99
TABLE 7-9 Clinical Factors and Likelihood of Thoracic Aortic Dissection
| Clinical Factor | Positive or Negative Likelihood Ratio (LR) (95% CI) | Utility |
|---|---|---|
| Severe pain of abrupt onset | LR negative 0.3 (0.2-0.5)Positive LR 1.6 (1.0-2.4) | Decreases risk when negative |
| Migratory pain | LR positive 1.1-7.6Negative LR 0.6 (0.5-0.7) | Increases risk when positive |
| Tearing or ripping pain | LR positive 1.2-10.8LR negative 0.4-0.99 | Increases risk when positive |
| Pulse deficits | LR positive 5.7 (1.4-23.0)LR negative 0.7 (0.6-0.9) | Increases risk when positive |
| Focal neurologic deficits | LR positive 6.6-33.0LR negative 0.71-0.87 | Increases risk when positive |
| Aortic regurgitation murmur (a diastolic murmur) | Not useful | |
| Combination of “aortic pain” (defined as severe, sudden-onset, tearing pain), blood pressure differential or pulse deficit in upper extremities, and wide mediastinum on chest x-ray | LR positive 66.0 (4.1-1062.0) | Increases risk substantially when all three factors are positive |
| LR negative 0.07 (0.03-0.17) | Decreases risk substantially when all three factors are negative | |
| Normal aorta and mediastinum on chest x-ray | LR negative 0.3 (0.2-0.4) | Decreases risk |
From Klompas M. Does this patient have an acute thoracic aortic dissection? JAMA 287:2262-72, 2002.Likelihood ratios are reviewed earlier in this chapter in the section on pulmonary embolism. LR+ ≥ 10 substantially increases odds of disease. LR− ≤ 0.1 substantially decreases odds of disease. LR + or − equal to 1 have no effect on odds of disease. Intermediate values have accordingly moderate effects on odds of disease.
What Modalities Can Be Used to Diagnose Spontaneous Aortic Catastrophes?
Although chest x-ray is the initial imaging examination in most patients with chest pain, its sensitivity and specificity for aortic catastrophes is poor, as described in more detail later. Aortography (see Figure 7-72) is the historical gold standard for aortic dissection and thoracic aneurysm, but it has been replaced by CT with IV contrast as the predominant imaging modality in the emergency department. Today, aortography is restricted almost entirely to patients who have aortic disease detected with other imaging modalities and who require therapeutic interventions. As described in the chapter on interventional radiology (Chapter 16), aortography allows placement of stent grafts (see Figures 7-73, 7-74, 7-93, and 7-94) that can be used to repair some forms of dissections and aneurysms.
MRI without contrast, MRA with gadolinium contrast enhancement, TTE, and TEE can also be used to diagnosis aortic disease, but these are reserved primarily for patients with contraindications to CT. MRI and MRA are used predominately in patients with allergy to iodinated contrast agents used in CT. MRA was once used in patients with renal insufficiency because of concerns about contrast nephropathy related to iodinated contrast. However, the recent recognition of fatal nephrogenic systemic fibrosis in patients with renal disease who have received gadolinium has substantially eroded this indication for MRA. Gadolinium-associated nephrogenic systemic fibrosis is described in detail in Chapter 15. Gadolinium contrast-enhanced MRA has excellent test characteristics for aortic pathology but more limited availability in emergency departments. Multiplanar ECG-gated spin-echo MRI without use of gadolinium contrast also has excellent reported sensitivity and specificity for aortic dissection.103c Three-dimensional MRA without gadolinium contrast is a newer alternative, with preliminary experience suggesting similar diagnostic performance to gadolinium-enhanced MRA.103d Echocardiography and MRI or MRA share the ability to assess the aortic valve, pericardium, and left ventricular ejection fraction. CT can provide this information as well if retrospective electrocardiogram gating is performed (described in detail in Chapter 8) but at the cost of significant radiation exposure.
Echocardiography is a reasonable option in the patient who appears too unstable to undergo CT scan. The modality is portable and does not require administration of nephrotoxic contrast agents. TEE has excellent sensitivity and specificity (described later). It can be performed on an intubated patient in the emergency department or in the operating suite if a very high suspicion for aortic dissection exists.
Interpreting the Chest X-ray for Aortic Pathology
Although a normal chest x-ray alone cannot exclude aortic pathology, some classic abnormalities may suggest aortic disease, and familiarity with these findings may assist with clinical risk stratification. Let’s briefly describe the major chest x-ray abnormalities associated with aortic dissection and aortic aneurysm. These are also illustrated in figures throughout this section.
See Figures 7-60, 7-65, 7-67, 7-69, 7-70, 7-73, 7-75, and 7-92, which demonstrate abnormal mediastinal findings on chest x-ray suggestive of aortic disease.
What Is the Role of Chest X-ray in Ruling Out Aortic Pathology? Does a Normal Chest X-ray Rule Out Aortic Pathology? If Not, When Is Computed Tomography Needed Following a Normal Chest X-ray?
Chest x-ray is insensitive for aortic pathology. In nontraumatic aortic dissection, chest x-ray is reported to have sensitivity as low as 81%, with specificity as low as 89%.98-99,106-107 As described earlier, an intimal flap may occur in an aorta of normal caliber, and no extravasation of blood may occur, at least initially. In this scenario, the mediastinal silhouette seen on x-ray would not be expected to alter during dissection when compared with a chest x-ray taken before the dissection. Figures 7-78, 7-85, 7-88, and 7-95 show normal or unchanged chest x-rays in the setting of acute aortic dissection—review these and the associated CT images, which follow each x-ray. Chest x-ray may be abnormal in nontraumatic dissection if the dissection occurs in an aneurysmal aorta, if the dissection leads to formation of a large mural hematoma, or if extravasation of blood occurs into the mediastinum or pleural space. The likelihood ratio negative associated with a normal mediastinum and aortic contour is around 0.3—remember that a likelihood ratio negative less than 0.1 is needed to substantially decrease pretest odds of disease. As shown in Table 7-9, the combination of a normal chest x-ray, the absence of a classic aortic dissection clinical history, and the absence of pulse deficits or blood pressure disparities has a strong likelihood ratio negative. However, it is essential to understand that a normal chest x-ray does not rule out aortic dissection when the disease is suspected clinically. In addition, an abnormal mediastinum can result from nonaortic pathology, because the mediastinum contains numerous structures, including the heart, great vessels, trachea, esophagus, lymph nodes, and (sometimes) thyroid and thymus glands.
Chest x-ray findings suggestive of aortic dissection have been described, including a wide mediastinum, an abnormal aortic contour, displacement of soft tissues from aortic calcifications, tracheal deviation, and pleural effusions. A BestBETs review found four studies with mixed methodology—all of which found completely inadequate sensitivity of these findings to be useful clinically to rule out dissection. For example, displacement of soft tissues from aortic calcifications, which might be expected to occur as a dissection separates the intima from the aortic muscularis layer, has a sensitivity of only 5% to 9%. A widened mediastinum has a reported sensitivity of only about 47% to 65%. Even a normal chest x-ray may occur in the setting of dissection—reportedly in 12% to 40% of cases.98 In a study of the interobserver agreement among radiologists for interpretation of these “classic” chest x-ray findings of aortic dissection, interobserver agreement was little better than that expected by chance. In a study of 75 patients with aortic dissection, only 25% had initial chest x-ray interpretations in which the radiologist prospectively stated that aortic dissection or aortic aneurysm was present or in which further aortic imaging was recommended.108
Jagannath et al. found that the classic chest x-ray features individually had poor interrater reliability, sensitivity, and specificity. When the radiologist’s overall impression based on these findings was used, the sensitivity was 81%, with a specificity of 89%.106 Hagan et al.107 reviewed the International Registry of Acute Aortic Dissection database and found that no radiographic abnormalities were noted in 12% of aortic dissections. The mediastinum and aortic contour were normal in 21%. A widened mediastinum was noted in 62% and an abnormal aortic contour in 50%. An abnormal cardiac contour was present in 26% and pleural effusion in 19%. Displacement of aortic calcifications was noted in only 14%. Because the registry does not include patients without aortic dissection, specificity cannot be calculated.
Von Kodolitsch and colleagues109 examined the likelihood ratios for individual chest x-ray findings in a high-risk cohort of patients with suspected aortic dissection. They reported likelihood ratios for individual findings, as well as sensitivity and specificity of the complete x-ray interpretation. Overall sensitivity was only 69%, and specificity was 86%. The negative likelihood ratios for classic findings such as widened mediastinum and displaced calcifications were between 0.4 and 1.1, which are not clinically useful to rule out disease.
Does this mean that every patient with chest pain needs CT or other definitive imaging to evaluate the aorta, even with a normal chest x-ray? Not necessarily. Aortic dissection is a relatively rare disease, and the combination of a nonconcerning history, a normal chest x-ray, and the absence of blood pressure differentials or pulse deficits has a strong likelihood ratio negative (see Table 7-9). Consider the following scenario, depicted in Figures 7-101. A population of 1000 emergency department patients presents with chest pain. Imagine that 1% of that population has aortic dissection (10 patients), and that chest x-ray is 80% sensitive and 80% specific for detection of aortic dissection. This means that chest x-ray detects 8 of 10 patients with aortic dissection, leaving only 2 patients undetected. This gives a normal chest x-ray a negative predictive value of 99.7%. In 1000 patient encounters of this type, you would miss only 2 patients with aortic dissection by relying on chest x-ray as your imaging modality. If instead you chose to use CT as your diagnostic modality, you would need to perform CT in 794 patients with normal chest x-rays to identify 2 patients with dissection, giving a number needed to treat of almost 400. Consider a different scenario with a high-risk population, in which the 1000 patients encountered have a classic history of abrupt tearing interscapular pain (Figure 7-102). Let’s allow that 30% of such patients (300 patients out of 1000) might have aortic dissection. If chest x-ray has 80% sensitivity and specificity, as in our first example, 80% of patients with aortic dissection (240 out of 300) would be identified by chest x-ray. As 60 patients with dissection would have normal chest x-rays, the negative predictive value of a normal chest x-ray would be only 90%, which is unacceptable given the morbidity of the disease in question. In this case, CT should be used to evaluate those patients with normal chest x-rays. Thus 620 patients would undergo CT to identify 60 aortic dissections, giving a number needed to treat of around 10. How does this hypothetical scenario help you understand when CT should be used to screen for dissection? Your clinical judgment, including factors from the history of present illness, past medical history, and physical exam, likely can select from all comers those patients who are at very low or high risk for aortic dissection. As demonstrated, if your pretest probability of aortic dissection is low (e.g., 1%), a normal chest x-ray has a good negative predictive value, and no further imaging for dissection should be performed. If your pretest probability is high (e.g., 30%), the negative predictive value of chest x-ray is relatively low, and further imaging for dissection should be performed, even in a patient with a normal chest x-ray.
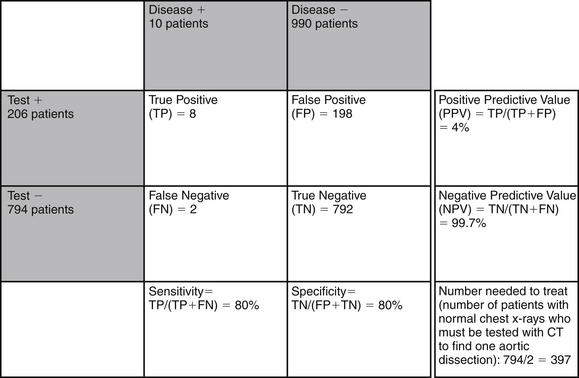
Figure 7-101 Examples of test performance of chest x-ray for detection of aortic dissection: low-risk population.
Imagine 1000 emergency department patients with chest pain, of whom 1% (10 patients) have aortic dissection. Imagine that chest x-ray is 80% sensitive and 80% specific for aortic dissection. In this scenario, because aortic dissection is rare, even a sensitivity as low as 80% means that 99.8% of patients with normal chest x-rays do not have aortic dissection. Nearly 400 patients with normal chest x-rays would need to be imaged with computed tomography to find 1 patient with aortic dissection.

Figure 7-102 Examples of test performance of chest x-ray for detection of aortic dissection: high-risk population.
Imagine 1000 emergency department patients with chest pain, of whom 30% (300 patients) have aortic dissection. Imagine that chest x-ray is 80% sensitive and 80% specific for aortic dissection. In this scenario, because aortic dissection is common, a sensitivity as low as 80% means that up to 10% of patients with normal chest x-rays have aortic dissection. One dissection would be found for every 10 computed tomography scans performed in patients with normal chest x-ray.
Notice that the relative rarity of aortic dissection means that even a fairly specific test results in a high false-positive rate—so most patients with abnormal chest x-ray findings do not have aortic dissection. As shown in Figure 7-101, in a population with a low incidence of aortic dissection (1%), false positives far outnumber true positives, and the positive predictive value of an abnormal chest x-ray is very low. An example would be a 20-year-old healthy patient with fever, noted to have a wide mediastinum on chest x-ray. This patient has a very low pretest probability of acute aortic dissection, and the mediastinal abnormality is likely not due to aortic pathology. Even in a high-risk population (30% rate of aortic dissection, see Figure 7-102), chest x-ray produces a large number of false-positive results, and the positive predictive value is less than 70%.
Overall, the pretest probability of aortic disease must be considered carefully when deciding how to proceed following a chest x-ray. A normal chest x-ray in a patient with a high pretest probability of disease demands further imaging. An abnormal chest x-ray in a patient with a low pretest probability of aortic disease does not strongly predict aortic pathology—although other causes of mediastinal widening (e.g., adenopathy or other mass) (see Figure 7-99 and 7-100) must be considered and may require imaging.
How Sensitive Are Advanced Imaging Modalities for Aortic Pathology?
Early CT studies for aortic dissection showed limited sensitivity, again because of the technologic limitations of single-slice, nonhelical CT.110 Modern multislice helical CT offers high sensitivity and the advantage of three-dimensional reconstructions that depict branch vessel anatomy and may help with planning of surgical approach. By 1993, CT was described as nearing 100% sensitivity for detection of aortic dissection. A 1993 study by Nienaber and colleagues111 in the New England Journal of Medicine compared CT, MRI without gadolinium contrast, TEE, and TTE in 110 patients with clinically suspected aortic dissection. The study had a strong gold standard, including operative findings in 62 patients, autopsy in 7, and contrast angiography in 64. The sensitivities were 98.3% for CT, 98.3% for MRI, 97.7% for TEE, and 59.3% for TTE. Specificities were 87.1% (CT), 97.8% (MR), 76.9% (TEE), and 83.0% (TTE). Further advances in multidetector CT and three-dimensional postprocessing since that time have improved the diagnostic utility of CT. A 2003 study published in Radiology confirmed 100% sensitivity of CT for detection of type A aortic dissection compared with surgical findings. The study also examined the sensitivity and specificity of CT for important complications that can affect surgical planning, including detection of an entry tear (sensitivity = 82%, specificity = 100%), aortic arch branch vessel involvement (sensitivity = 95%, specificity = 100%), and pericardial effusion (sensitivity = 83%, specificity = 100%).112
CT Aortic Angiography Technique
CT for aortic pathology uses the same principles as for PE. In traditional aortic angiography, contrast injected through a catheter proximal to the aortic valve fills the aorta, revealing the aortic contour and size, as well as any intimal flaps. In CT aortic angiography, contrast is injected under pressure through a catheter in the antecubital fossa; traverses the upper extremity, subclavian vain, superior vena cava, right atrium and ventricle, and pulmonary vessels; and then returns to the left atrium and ventricle. The scan is timed to coincide with arrival of the contrast bolus in the aorta. As for CT pulmonary angiography (see discussion earlier in this chapter), a well-timed contrast bolus is essential to the diagnosis of aortic dissection. With rare exceptions in which calcifications in the aortic wall and high density thrombus in the false aortic lumen are visible, a noncontrast CT or poorly timed CT cannot detect aortic dissection (see Figures 7-80 and 7-81), although it may reveal aortic aneurysm (see Figure 7-61). Nondiagnostic scans result from poor contrast boluses, which may incompletely opacify the aorta. Poor scan timing limits sensitivity, because contrast may not yet have reached or may have already passed out of the aorta, preventing the intimal dissection flap from being recognized.30,113 Typically, the entire aorta is imaged, from above the top of the aortic arch to below the aortic bifurcation, so CT spans the chest, abdomen, and pelvis.
Interpretation of Computed Tomography for Aortic Pathology
Normal Aorta
Interpretation of CT for aortic pathology is relatively simple compared with CT pulmonary angiography (Box 7-3 gives the recommended algorithm). The descending thoracic aorta is a tubular structure with a fixed location anterior and slightly to the left of the thoracic spine. Its normal size is defined as less than or equal to 2 cm. A normal aorta on a good-quality scan with an adequate contrast bolus should be completely opacified and should appear bright white on CT soft tissue windows. In cross section, the descending and ascending aorta appear as a smoothly outlined circle (see Figure 7-79). The aortic arch in cross section appears elliptic (see Figure 7-79). Calcifications in the aortic wall may be visible as bright white spots, even in the absence of contrast, and indicate atherosclerotic disease (see Figures 7-61, 7-71, and 7-74).30
Spontaneous Aortic Dissection or Aneurysm
Aortic aneurysm can be diagnosed on CT simply by measurement of the aortic diameter. Modern PACS software interfaces offer toolbar calipers for measurement. Diameters above 3 cm constitute aneurysm (see Figure 7-79). Aortic dissection may occur in aneurysmal aortas or aortas of normal caliber. Aortic dissection is diagnosed on CT by the presence of an intimal flap, visible as a line dividing the aorta into a true and a false lumen. There may be a differential enhancement or filling of the true and false lumens with contrast. This difference is not uniform; the true lumen may contain more or less contrast than the false lumen. In some cases, the false lumen may tear back into the true lumen, and the two channels may contain equal amounts of contrast. The false lumen (or more rarely, the true lumen) may be thrombosed and may contain no contrast, thus appearing dark on CT. Although it may be relatively unimportant for emergency medical management or diagnosis, the false channel often demonstrates “beaking” and cobwebbing (defined by the presence of thin strands of tissue connecting the dissected intimal flap to the aortic wall) (see Figures 7-62 and 7-63).30 The extent of the dissection can be determined on CT, allowing classification by the Stanford or Debakey system (Box 7-4), which may determine medical or surgical therapy.114 Blood products outside of the aorta may be seen, indicating leaking or rupture. Blood products that accumulated prior to the moment of CT appear dark on CT, with densities of approximately 40 to 70 HU. Extravasation of contrast material beyond the lumen of the aorta marks active bleeding at the time of CT—this appears bright white on CT soft-tissue windows, with densities between 130 and 200 HU, depending on the contrast bolus. Proximal extension of the dissection may be visible as pericardial blood, usually dark in appearance on CT unless active bleeding into the pericardium is ongoing. Branch vessels such as the coronary, carotid, subclavian, brachiocephalic, renal, mesenteric, and iliac arteries should be inspected for dissection as well (see Figures 7-64, 7-82 through 7-84, 7-87, 7-90, and 7-91).30 Repeated CT of a body region after a brief delay is often performed, allowing contrast to be concentrated by end-organs. This can reveal normal and abnormal patterns of organ enhancement, in some cases disclosing poor perfusion of organs resulting from aortic dissection. For example, failure of the kidneys to enhance on delayed images can indicate compromise of renal blood flow by the dissection (see Figure 7-84).
Computed Tomography Radiation and Cancer
Chest CT scan carries with it a radiation exposure of around 8 mSv, the equivalent of approximately 400 posterior–anterior chest x-rays.115 The cancer risk associated with this exposure varies with age at exposure and with gender. For a 20 year old female undergoing CT pulmonary angiography, the cancer risk is estimated at 1 in 330, while in a 60 year old female the risk is approximately 1 in 930. Males at these same ages have estimated risks of approximately 1 in 880 and 1 in 1770, respectively.115a This risk is cumulative and permanent (does not diminish with time since exposure), with no known safe exposure limit. A single x-ray photon of sufficient energy striking a critical deoxyribonucleic acid (DNA) base pair (or creating an oxygen free radical that interacts with DNA) can be the inciting event leading to a future cancer. This delayed risk must be weighed against the probability that a patient is today suffering from a life-threatening disease process. It is also important to recognize that this attributable risk from CT is still relatively small, compared with the baseline risk for cancer death, which is estimated at more than 1 in 5. Centers for Disease Control data indicate that cancer was the second leading cause of death in 2005, accounting for 22.8% of U.S. deaths.24,116 In comparison, estimates of attributable cancer induction (not death) from 64-slice cardiac CT (which carries a radiation exposure higher than that from CT pulmonary angiography, depending on the exact CT protocol) range from 1 in 143 (0.7%) for a 20-year-old woman to 1 in 3261 (0.03%) for an 80-year-old man.117 Emergency physicians should be aware of the magnitude of these risks to provide a thoughtful risk–benefit analysis for their patients. In a 2004 survey, only 9% of emergency physicians stated that CT could increase cancer risk, though attention to this problem since that time has likely increased awareness.118 The American Board of Emergency Medicine included reading on this topic in its 2009 Lifelong Learning and Self-Assessment Test.
Computed Tomography Radiation Exposure and Teratogenesis
As stated earlier, a single CT of the chest delivers a large radiation dose to the patient, approximately 8 mSv. However, risk for fetal malformation (teratogenesis)
Box 7-3 Algorithm for Evaluating Computed Tomography for Aortic Pathology
resulting from diagnostic radiation exposure is not believed to be significant below a cumulative dose of 50 mSv. Radiation exposures should be avoided if possible in pregnancy, particularly in critical periods of organogenesis, from 2 to 8 weeks postconception. Despite this, American College of Obstetricians and Gynecologists guidelines state “Exposure to X-rays during pregnancy is not an indication for therapeutic abortion.”119,119a The American College of Radiology, American College of Obstetrics and Gynecology, and
Box 7-4 Classification of Thoracic Aortic Dissection
From Weisenfarth JD. Aortic Dissection in Emergency Medicine. (Accessed at http://emedicine.medscape.com/article/756835-diagnosis)

National Council on Radiation Protection unanimously agree that no single diagnostic imaging procedure results in harmful fetal effects.120 In contrast, physicians tend to overestimate the risk for fetal malformation resulting from exposure to diagnostic radiologic procedures.121 In the pregnant patient, the usual considerations apply in selecting VQ or CT as a diagnostic test. With regard to fetal radiation exposure, a VQ scan exposes the fetus to approximately 0.32 to 0.36 mSv.122 The dose can be further reduced by eliminating the ventilation scan, reducing ventilation imaging to a single breath-hold view, or reducing the amount of the perfusion agent.122 Chest CT also is estimated to expose the fetus to less than 1 mSv. Anthropomorphic phantom models suggest that fetal exposure from CT pulmonary angiography at 0 and 3 months are 0.24 to 0.47 mSv and 0.61 to 0.66 mSV, respectively, well below the recognized threshold for fetal effects.122-123 Either modality may be reasonable, and other patient factors besides fetal radiation dose should likely drive the choice of imaging study.
Indications for Intravenous Contrast
IV contrast is indicated for the diagnosis of PE and aortic pathology. As described earlier, the presence of contrast material in pulmonary vessels allows recognition of filling defects caused by PE. In aortic dissection, intimal injuries and active bleeding are made visible by the presence of injected contrast. CT without contrast has quite limited sensitivity for these processes, although in extreme cases ruptured aneurysms or large pulmonary emboli may be visible without contrast.30
Intravenous Contrast and Allergy
Reaction to iodinated contrast agents is relatively rare, with an incidence of 3% to 15% for mild reactions but only 0.004% to 0.04% for very severe reactions. Fatal reactions occur in only 1 in 170,000.124 Contrast reactions are termed “anaphylactoid” because they likely occur by slightly different mechanisms from those causing true allergic reactions, although the clinical presentation and treatment are the same.126 Risk factors for contrast reaction include asthma (6- to 10-fold risk) and severe allergies to any other substance. Seafood allergies do not appear to constitute a specific additional risk factor, beyond the heightened risk seen in patients with a history of severe reaction to any allergen. Seafood allergies are thought to be mediated by proteins in seafood, not iodine. For a variety of reasons, new low-osmolality contrast agents have a lower potential for contrast reaction (5 times lower for mild reactions and 10 times lower for severe reactions) and should be considered for high-risk patients. These agents are somewhat more expensive than standard high-osmolality agents (approximately $40 per patient), which has prevented their universal use.125 Most institutions have these agents readily available upon request.
Pretreatment to prevent contrast reaction can be performed, but most regimens require 12 to 24 hours of pretreatment and are impractical in the emergency department. In its Manual on Contrast Media, the American College of Radiology recommends a minimum of 6 hours between steroid and contrast administration, whether steroids are administered orally or intravenously, citing evidence that pretreatment 3 hours or fewer before contrast administration is not helpful.126,128 A rapid pretreatment protocol beginning 1 hour before contrast has been described and is used in some institutions—though this is based on an uncontrolled case series of nine patients by Greenberger et al. (Box 7-5).126-128 Breakthrough reactions may occur despite steroid premedication and may
Box 7-5 Pretreatment to Prevent Anaphylactoid Reactions to Iodinated Contrast
From American College of Radiology. Manual on Contrast Media. 7th ed: American College of Radiology; 2010.
In decreasing order of desirability, according to the ACR:
be severe in 24% of cases,129 so alternative methods of diagnosis should be considered in high-risk patients.
Intravenous Contrast and Nephrotoxicity
Nephrotoxicity from iodinated contrast is a major concern. Contrast nephropathy is defined as a rise of 25% or 0.5 mg/dL in measured creatinine from baseline. It occurs in an estimated 15% of contrast procedures, accounting for 150,000 cases per year in the United States. Contrast nephropathy is thought to be responsible for 10% of in-hospital renal failure. The contrast dose for chest CT approximates 150 mL and may place patients at risk for renal injury. A creatinine clearance below 60 mL per minute places a patient at risk. Estimated creatinine clearance can be calculated by a formula (Box 7-6) or by use of online or personal digital assistant calculators. Because creatinine clearance is a function of the patient’s age, gender, weight, and measured creatinine, elderly patients with apparently normal measured creatinine values may have markedly abnormal creatinine clearance. For example,
Box 7-6 Creatinine Clearance Calculation∗
Multiply by 0.85 for women.
∗ For automatic calculators, search online for “creatinine clearance calculator.”
an 80-year-old female weighing 72 kg with a measured creatinine of 0.95 mg/dL has a creatinine clearance less than 60 mL per minute and is at risk for nephrotoxicity. Congestive heart failure and diabetes are also risk factors. Fortunately, less than 1% of patients with contrast nephropathy require dialysis, but among those requiring dialysis, there is a 30% in-hospital mortality.130-131
Methods to decrease renal toxicity include use of low-osmolality contrast, prehydration with IV normal saline,132-133 pretreatment with IV sodium bicarbonate,134 and pretreatment with N-acetylcysteine (Box 7-7). Most N-acetylcysteine protocols require 24 hours of pretreatment, again making them of little utility in the emergency department, although an immediate N-acetylcysteine protocol has been described (see Box 7-7). Studies on pretreatment show only an effect on creatinine, not a patient-oriented outcome effect such as change in need for dialysis.135-136 The latest randomized controlled trial comparing sodium chloride (normal saline) hydration to sodium bicarbonate showed no difference in rates of contrast nephropathy, contradicting an earlier promising trial with more limited methodology.137 Overall, the best strategy is likely avoidance of contrast when possible through use of an alternative imaging modality. When contrast must be given emergently, the best strategy is normal saline hydration combined with low-osmolality contrast at the lowest possible volume to complete the CT.
In patients suspected of PE or aortic pathology who cannot undergo CT with IV contrast alternative diagnostic methods should be used, such as MRA (aortic pathology or PE), VQ (PE), or echocardiography (aortic pathology or PE). For patients with normal renal function who cannot receive iodinated contrast because of allergy, gadolinium can be used as a CT contrast agent, or MRA with gadolinium contrast can be used.138-140 Gadolinium-enhanced MRA is no longer an alternative in patients with renal insufficiency who are at risk for contrast nephropathy from iodinated contrast. This is due to the recently recognized risk for gadolinium-induced nephrogenic systemic fibrosis, a rare but potentially fatal condition affecting patients with acute renal failure, those with chronic renal insufficiency with a poor glomerular filtration rate, and even patients already receiving
Box 7-7 Pretreatment to Prevent Contrast Nephropathy From Iodinated Contrast Agents
From American College of Radiology. Manual on Contrast Media. 7th ed, American College of Radiology, 2010; Baker CS, Wragg A, Kumar S, et al. A rapid protocol for the prevention of contrast-induced renal dysfunction: the RAPPID study. J Am Coll Cardiol 41(12):2114-2118, 2003; Brar SS, Shen AY, Jorgensen MB, et al. Sodium bicarbonate vs sodium chloride for the prevention of contrast medium-induced nephropathy in patients undergoing coronary angiography: a randomized trial. JAMA 300(9):1038-1046, 2008; Trivedi HS, Moore H, Nasr S, et al. A randomized prospective trial to assess the role of saline hydration on the development of contrast nephrotoxicity. Nephron Clin Pract 93(1):C29-34, 2003.
dialysis. The risks of nephrogenic systemic fibrosis are described in detail in Chapter 15. In patients who can receive neither iodinated contrast nor gadolinium, some advanced MR techniques can assess for PE and aortic pathology without any contrast administration.
Critical Differential Diagnosis: Imaging When Both Pulmonary Embolism and Aortic Dissection are Suspected
So far we have discussed imaging tailored for diagnosis of PE or aortic pathology. In reality, some patients present with histories, examination findings, vital signs, and risk factors compatible with both forms of pathology. What strategies are appropriate for diagnosis in this scenario? CT protocols for PE and aortic pathology differ, particularly in the timing of contrast relative to CT scan acquisition, as described in the earlier sections. An optimal scan for either form of pathology times the contrast to fill the vascular bed of interest, thus compromising assessment of alternative pathology (see Figures 7-11, 7-12, and 7-81). CT can be performed to assess for both PE and aortic dissection, as well as coronary artery disease (described in detail in Chapter 8). In brief, such “triple rule-out CT” requires a biphasic contrast injection (70 mL of contrast, followed by a 50:50 mixture of 25 mL of contrast and 25 mL of saline).141 Occasionally, a CT performed for evaluation of one form of pathology may reveal the other—or even coexisting aortic dissection and PE (see Figure 7-96).
In any given patient, the importance of differentiating these diagnoses must be weighed against the additional risk for contrast nephropathy resulting from the increased contrast dose. In a patient with no renal disease, this risk may be minimal. Another strategy is to perform CT tailored to evaluate one form of pathology optimally, with the intention of performing a second diagnostic test or initiating empiric therapy for the second form of pathology if necessary. For example, CT can be performed to rule out aortic pathology as the first test. If negative, the patient can undergo VQ scan or can be treated empirically with anticoagulation. If PE is strongly suspected, imaging tailored for this diagnosis can be selected. In general, CT is often the best first diagnostic test in this scenario, because it may fortuitously reveal alternative diagnoses. VQ scan does not identify aortic pathology. MR can also be performed to evaluate aortic pathology or PE if initial CT is negative.
Imaging in the Unstable Patient With Suspected Pulmonary Embolism, Aortic Dissection, or Both
The unstable patient with suspected PE, aortic dissection, or both presents a particular dilemma. The two disease processes present competing treatment goals, limiting use of empiric medical therapy when both diseases are suspected. For example, use of heparin or thrombolytic agents for treatment of PE is contraindicated in the presence of aortic dissection. Similarly, the use of beta-blockers and vasodilators for empiric treatment of aortic dissection can decrease cardiac output and preload, causing hemodynamic collapse if large PE is present. Other competing diagnoses such as pericardial tamponade may present similarly and may be worsened by empiric therapy for PE or aortic dissection. Definitive diagnosis is important, and the risks and benefits of various diagnostic strategies must be weighed against the likelihood of mortality if no firm diagnosis is reached.
Bedside echocardiography including possible transesophageal approach can be of benefit, because it may reveal aortic dissection, evidence of PE, large pericardial effusion or tamponade, and cardiac wall motion abnormalities suggesting acute myocardial infarction. As a triage strategy, bedside transthoracic echocardiography is reasonable, because it does not require patient transport or administration of nephrotoxic contrast. It preserves the ability to continue resuscitation efforts in the emergency department.
As a rule, VQ scan is a poor choice in unstable patients, because it necessitates removing the patient from the emergency department for up to an hour. Although CT is often described as “a place where patients go to die,” and the danger of an unstable patient in CT is undeniable, consider the alternatives if massive PE or aortic dissection is present. Neither of these diagnoses presents much opportunity for successful resuscitation in the emergency department if cardiac arrest occurs, and definitive diagnosis is essential to aggressive treatment. For example, massive PE can be treated by interventional techniques (described in Chapter 16), whereas type A aortic dissection requires emergency surgical treatment. The patient should be stabilized as much as possible with appropriate (and potentially prophylactic) airway management and vascular access. Empiric medical therapies should be considered, despite the risks described earlier. Once these measures have been taken, CT may be a reasonable option even in a patient who remains relatively unstable, because it may present the only path to diagnosis. Consider CT tailored for assessment of both PE and aortic pathology. Simultaneous consultation with thoracic surgeons, interventional radiologists, and cardiologists is also reasonable. The patient may benefit from transfer to an angiography suite or operating suite for procedures such as simultaneous right and left heart catheterization to evaluate the pulmonary arteries and aorta. The local resources strongly dictate the imaging approach, which must be closely tied to the therapeutic plan.
Summary
A number of imaging modalities are available for emergency diagnosis of PE and aortic dissection or aneurysm. A normal chest x-ray cannot rule out these potentially fatal processes, so definitive imaging is needed when the diagnoses are strongly considered. CT of the chest has become the test of choice in the emergency department assessment of both conditions. VQ scan is a reasonable alternative to CT when the differential diagnosis is limited to PE. An understanding of pretest probability assessment is essential to selection and interpretation of an imaging test for PE and aortic dissection. When imaging results contradict clinical risk assessment, further imaging evaluation is warranted to exclude PE.
1. Goldhaber S.Z. Pulmonary embolism. Lancet. 2004;363:1295-1305.
1a. Pollack C.V., Schreiber D., Goldhaber SZ., et al. Clinical characteristics, management, and outcomes of patients diagnosed with acute pulmonary embolism in the emergency department: initial report of EMPEROR (Multicenter Emergency Medicine Pulmonary Embolism in the Real World Registry). J Am Coll Cardiol. 2000;57(6):700-706.
1b. Agnelli G., Becattini C. Acute pulmonary embolism. N Engl J Med. 2010;363(3):266-274.
2. Wells P.S., Anderson D.R., Rodger M., et al. Derivation of a simple clinical model to categorize patients’ probability of pulmonary embolism: Increasing the models utility with the SimpliRED D-dimer. Thromb Haemost. 2000;83:416-420.
2a. Harrison M., Jones S. Towards evidence based emergency medicine: best BETs from the Manchester Royal Infirmary. SimpliRed D-dimer assay in suspected pulmonary embolus. J Accid Emerg Med. 2010;17(6):404-405.
2b. Farrell S., Hayes T., Shaw M. A negative SimpliRED D-dimer assay result does not exclude the diagnosis of deep vein thrombosis or pulmonary embolus in emergency department patients. Ann Emerg Med. 2000;35(2):121-125.
2c. Stein PD., Woodard PK., Weg JG., et al. Diagnostic pathways in acute pulmonary embolism: recommendations of the PIOPED II Investigators. Radiology. 2007;242(1):15-21.
3. Douma R.A., Gibson N.S., Gerdes V.E., et al. Validity and clinical utility of the simplified Wells rule for assessing clinical probability for the exclusion of pulmonary embolism. Thromb Haemost. 2009;101:197-200.
4. American College of Emergency Physicians Clinical Policies Committee; Clinical Policies Committee Subcommittee on Suspected Pulmonary Embolism. Clinical policy: Critical issues in the evaluation and management of adult patients presenting with suspected pulmonary embolism. Ann Emerg Med. 2003;41:257-270.
5. Kline J.A., Mitchell A.M., Kabrhel C., et al. Clinical criteria to prevent unnecessary diagnostic testing in emergency department patients with suspected pulmonary embolism. J Thromb Haemost. 2004;2:1247-1255.
6. Kline J.A., Courtney D.M., Kabrhel C., et al. Prospective multicenter evaluation of the pulmonary embolism rule-out criteria. J Thromb Haemost. 2008;6:772-780.
6a. Ceriani E., Combescure C., Le Gal G., et al. Clinical prediction rules for pulmonary embolism: a systematic review and meta-analysis. J Thromb Haemost. 2010;8(5):957-970.
7. Worsley D.F., Alavi A., Aronchick J.M., et al. Chest radiographic findings in patients with acute pulmonary embolism: Observations from the PIOPED study. Radiology. 1993;189:133-136.
8. Patel S., Kazerooni E.A. Helical CT for the evaluation of acute pulmonary embolism. AJR Am J Roentgenol. 2005;185:135-149.
9. Wittram C., Waltman A.C., Shepard J.A., et al. Discordance between CT and angiography in the PIOPED II study. Radiology. 2007;244:883-889.
10. Weiss C.R., Scatarige J.C., Diette G.B., et al. CT pulmonary angiography is the first-line imaging test for acute pulmonary embolism: A survey of U.S. clinicians. Acad Radiol. 2006;13:434-446.
11. Ambrose J., Hounsfield G. Computerized transverse axial tomography. Br J Radiol. 1973;46:148-149.
12. Hounsfield G.N. Computerized transverse axial scanning (tomography): Part I. Description of system, 1973. Br J Radiol. 1995;68:H166-H172.
13. Hounsfield G.N. Picture quality of computed tomography. AJR Am J Roentgenol. 1976;127:3-9.
14. Friedland G.W., Thurber B.D. The birth of CT. AJR Am J Roentgenol. 1996;167:1365-1370.
15. Hounsfield G.N. Computed medical imaging, Nobel lecture, 8 December 1979. J Radiol. 1980;61:459-468.
16. Jones C.G. A review of the history of U.S. radiation protection regulations, recommendations, and standards. Health Phys. 2005;88:697-716.
17. Sinner W.N. Computed tomographic patterns of pulmonary thromboembolism and infarction. J Comput Assist Tomogr. 1978;2:395-399.
18. Kalender W.A., Polacin A. Physical performance characteristics of spiral CT scanning. Med Phys. 1991;18:910-915.
19. Rydberg J., Liang Y., Teague S.D. Fundamentals of multichannel CT. Radiol Clin North Am. 2003;41:465-474.
20. Rydberg J., Liang Y., Teague S.D. Fundamentals of multichannel CT. Semin Musculoskelet Radiol. 2004;8:137-146.
21. Wang G., Vannier M.W. The effect of pitch in multislice spiral/helical CT. Med Phys. 1999;26:2648-2653.
22. Ravenel J.G., McAdams H.P. Multiplanar and three-dimensional imaging of the thorax. Radiol Clin North Am. 2003;41:475-489.
23. Ravenel J.G., McAdams H.P., Remy-Jardin M., Remy J. Multidimensional imaging of the thorax: practical applications. J Thorac Imaging. 2001;16:269-281.
24. International Commission on Radiological Protection, Committee 3. Radiation and your patient: A guide for medical practitioners. (Accessed at http://www.icrp.org/docs/Rad_for_GP_for_web.pdf.)
25. Behrendt F.F., Bruners P., Keil S., et al. Impact of different vein catheter sizes for mechanical power injection in CT: In vitro evaluation with use of a circulation phantom. Cardiovasc Intervent Radiol. 2009;32:25-31.
26. Weiss C.R., Fishman E.K. Multidetector 3D CT of pulmonary embolism of a peripheral intravenous line. Emerg Radiol. 2005;11:247-249.
27. Herts B.R., Cohen M.A., McInroy B., et al. Power injection of intravenous contrast material through central venous catheters for CT: In vitro evaluation. Radiology. 1996;200:731-735.
28. Herts B.R., O’Malley C.M., Wirth S.L., et al. Power injection of contrast media using central venous catheters: Feasibility, safety, and efficacy. AJR Am J Roentgenol. 2001;176:447-453.
29. Sanelli P.C., Deshmukh M., Ougorets I., et al. Safety and feasibility of using a central venous catheter for rapid contrast injection rates. AJR Am J Roentgenol. 2004;183:1829-1834.
30. Chiles C., Carr J.J. Vascular diseases of the thorax: Evaluation with multidetector CT. Radiol Clin North Am. 2005;43:543-569. viii
31. Gosselin M.V., Rassner U.A., Thieszen S.L., et al. Contrast dynamics during CT pulmonary angiogram: Analysis of an inspiration associated artifact. J Thorac Imaging. 2004;19:1-7.
32. Ryu J.H., Pellikka P.A., Froehling D.A., et al. Saddle pulmonary embolism diagnosed by CT angiography: Frequency, clinical features and outcome. Respir Med. 2007;101:1537-1542.
33. Bankier A.A., Janata K., Fleischmann D., et al. Severity assessment of acute pulmonary embolism with spiral CT: Evaluation of two modified angiographic scores and comparison with clinical data. J Thorac Imaging. 1997;12:150-158.
34. Ocak I., Fuhrman C. CT angiography findings of the left atrium and right ventricle in patients with massive pulmonary embolism. AJR Am J Roentgenol. 2008;191:1072-1076.
35. Findik S., Erkan L., Light R.W., et al. Massive pulmonary emboli and CT pulmonary angiography. Respiration. 2008;76:403-412.
36. Sanchez O., Trinquart L., Colombet I., et al. Prognostic value of right ventricular dysfunction in patients with haemodynamically stable pulmonary embolism: A systematic review. Eur Heart J. 2008;29:1569-1577.
37. Araoz P.A., Gotway M.B., Trowbridge R.L., et al. Helical CT pulmonary angiography predictors of in-hospital morbidity and mortality in patients with acute pulmonary embolism. J Thorac Imaging. 2003;18:207-216.
38. Ghaye B., Ghuysen A., Bruyere P.J., et al. Can CT pulmonary angiography allow assessment of severity and prognosis in patients presenting with pulmonary embolism? What the radiologist needs to know. Radiographics. 2006;26:23-39.
39. Godwin J.D., Webb W.R., Gamsu G., Ovenfors C.O. Computed tomography of pulmonary embolism. AJR Am J Roentgenol. 1980;135:691-695.
40. Remy-Jardin M., Remy J., Deschildre F., et al. Diagnosis of pulmonary embolism with spiral CT: Comparison with pulmonary angiography and scintigraphy. Radiology. 1996;200:699-706.
41. Mayo J.R., Remy-Jardin M., Muller N.L., et al. Pulmonary embolism: Prospective comparison of spiral CT with ventilation–perfusion scintigraphy. Radiology. 1997;205:447-452.
42. Remy-Jardin M., Tillie-Leblond I., Szapiro D., et al. CT angiography of pulmonary embolism in patients with underlying respiratory disease: Impact of multislice CT on image quality and negative predictive value. Eur Radiol. 2002;12:1971-1978.
43. Bruzzi J.F., Remy-Jardin M., Kirsch J., et al. Sixteen-slice multidetector computed tomography pulmonary angiography: Evaluation of cardiogenic motion artifacts and influence of rotation time on image quality. J Comput Assist Tomogr. 2005;29:805-814.
44. Quiroz R., Kucher N., Zou K.H., et al. Clinical validity of a negative computed tomography scan in patients with suspected pulmonary embolism: A systematic review. JAMA. 2005;293:2012-2017.
45. Tillie-Leblond I., Mastora I., Radenne F., et al. Risk of pulmonary embolism after a negative spiral CT angiogram in patients with pulmonary disease: 1-year clinical follow-up study. Radiology. 2002;223:461-467.
46. van Belle A., Buller H.R., Huisman M.V., et al. Effectiveness of managing suspected pulmonary embolism using an algorithm combining clinical probability, D-dimer testing, and computed tomography. JAMA. 2006;295:172-179.
47. Mos I.C., Klok F.A., Kroft L.J., et al. Safety of ruling out acute pulmonary embolism by normal CT pulmonary angiography in patients with an indication for CT: Systematic review and meta-analysis. J Thromb Haemost. 2009.
48. Anderson D.R., Kahn S.R., Rodger M.A., et al. Computed tomographic pulmonary angiography vs. ventilation-perfusion lung scanning in patients with suspected pulmonary embolism: A randomized controlled trial. JAMA. 2007;298:2743-2753.
49. Roy P.M., Colombet I., Durieux P., et al. Systematic review and meta-analysis of strategies for the diagnosis of suspected pulmonary embolism. BMJ. 2005;331:259.
50. Safriel Y., Zinn H. CT pulmonary angiography in the detection of pulmonary emboli: A meta-analysis of sensitivities and specificities. Clin Imaging. 2002;26:101-105.
51. Hayashino Y., Goto M., Noguchi Y., Fukui T. Ventilation–perfusion scanning and helical CT in suspected pulmonary embolism: Meta-analysis of diagnostic performance. Radiology. 2005;234:740-748.
52. Hogg K., Brown G., Dunning J., et al. Diagnosis of pulmonary embolism with CT pulmonary angiography: A systematic review. Emerg Med J. 2006;23:172-178.
53. Stein P.D., Fowler S.E., Goodman L.R., et al. Multidetector computed tomography for acute pulmonary embolism. N Engl J Med. 2006;354:2317-2327.
53a. Stein PD., Fowler SE., Goodman LR., et al. Multidetector computed tomography for acute pulmonary embolism. N Engl J Med. 2006;354(22):2317-2327.
54. Stein P.D., Woodard P.K., Weg J.G., et al. Diagnostic pathways in acute pulmonary embolism: Recommendations of the PIOPED II investigators. Radiology. 2007;242:15-21.
55. Johnson J.C., Brown M.D., McCullough N., Smith S. CT lower extremity venography in suspected pulmonary embolism in the ED. Emerg Radiol. 2006;12:160-163.
56. Hunsaker A.R., Zou K.H., Poh A.C., et al. Routine pelvic and lower extremity CT venography in patients undergoing pulmonary CT angiography. AJR Am J Roentgenol. 2008;190:322-326.
57. Costello J., Hogg K. CT pulmonary angiogram compared with ventilation–perfusion scan for the diagnosis of pulmonary embolism in patients with cardiorespiratory disease. Emerg Med J. 2003;20:547-548.
58. Calvo-Romero J.M., Lima-Rodriguez E.M., Bureo-Dacal P., Perez-Miranda M. Predictors of an intermediate ventilation/perfusion lung scan in patients with suspected acute pulmonary embolism. Eur J Emerg Med. 2005;12:129-131.
58a. Sostman HD., Stein PD., Gottschalk A., et al. Acute pulmonary embolism: sensitivity and specificity of ventilation-perfusion scintigraphy in PIOPED II study. Radiology. 2008;246(3):941-946.
59. P.I.O.P.E.D Investigators. Value of the ventilation/perfusion scan in acute pulmonary embolism: Results of the Prospective Investigation of Pulmonary Embolism Diagnosis (PIOPED). JAMA. 1990;263:2753-2759.
60. Sostman H.D., Stein P.D., Gottschalk A., et al. Acute pulmonary embolism: Sensitivity and specificity of ventilation–perfusion scintigraphy in PIOPED II study. Radiology. 2008;246:941-946.
61. Gottschalk A., Stein P.D., Sostman H.D., et al. Very low probability interpretation of V/Q lung scans in combination with low probability objective clinical assessment reliably excludes pulmonary embolism: Data from PIOPED II, J Nucl Med. 2007;48:1411-1415.
62. Personal communication with Department of Radiology, North Carolina State University College of Veterinary Medicine. 2008.
63. RT Image. CT data sheet index: 2010. (Accessed at http://www.rt-image.com/datasheet/index.cfm?chartID=63&action=1)
64. Hurwitz L.M., Reiman R.E., Yoshizumi T.T., et al. Radiation dose from contemporary cardiothoracic multidetector CT protocols with an anthropomorphic female phantom: Implications for cancer induction. Radiology. 2007;245:742-750.
65. Hurwitz L.M., Yoshizumi T.T., Goodman P.C., et al. Radiation dose savings for adult pulmonary embolus 64-MDCT using bismuth breast shields, lower peak kilovoltage, and automatic tube current modulation. AJR Am J Roentgenol. 2009;192:244-253.
66. Hurwitz L.M., Yoshizumi T.T., Reiman R.E., et al. Radiation dose to the female breast from 16-MDCT body protocols. AJR Am J Roentgenol. 2006;186:1718-1722.
67. Sostman H.D., Miniati M., Gottschalk A., et al. Sensitivity and specificity of perfusion scintigraphy combined with chest radiography for acute pulmonary embolism in PIOPED II. J Nucl Med. 2008;49:1741-1748.
67a. Stein PD., Woodard PK., Weg JG., et al. Diagnostic pathways in acute pulmonary embolism: recommendations of the PIOPED II Investigators. Radiology. 2007;242(1):15-21.
68. Richman P.B., Courtney D.M., Friese J., et al. Prevalence and significance of nonthromboembolic findings on chest computed tomography angiography performed to rule out pulmonary embolism: A multicenter study of 1025 emergency department patients. Acad Emerg Med. 2004;11:642-647.
69. Sostman H.D., Layish D.T., Tapson V.F., et al. Prospective comparison of helical CT and MR imaging in clinically suspected acute pulmonary embolism. J Magn Reson Imaging. 1996;6:275-281.
70. Kluge A., Luboldt W., Bachmann G. Acute pulmonary embolism to the subsegmental level: Diagnostic accuracy of three MRI techniques compared with 16-MDCT. AJR Am J Roentgenol. 2006;187:W7-W14.
71. Kluge A., Mueller C., Strunk J., et al. Experience in 207 combined MRI examinations for acute pulmonary embolism and deep vein thrombosis. AJR Am J Roentgenol. 2006;186:1686-1696.
72. Oudkerk M., van Beek E.J., Wielopolski P., et al. Comparison of contrast-enhanced magnetic resonance angiography and conventional pulmonary angiography for the diagnosis of pulmonary embolism: A prospective study. Lancet. 2002;359:1643-1647.
73. van Beek E.J., Wild J.M., Fink C., et al. MRI for the diagnosis of pulmonary embolism. J Magn Reson Imaging. 2003;18:627-640.
74. Stein P.D., Gottschalk A., Sostman H.D., et al. Methods of Prospective Investigation of Pulmonary Embolism Diagnosis III (PIOPED III). Semin Nucl Med. 2008;38:462-470.
74a. Stein PD., Chenevert TL., Fowler SE., et al. Gadolinium-enhanced magnetic resonance angiography for pulmonary embolism: a multicenter prospective study (PIOPED III). Ann Intern Med. 2010;152(7):434-443, W142-433.
75. Grifoni S., Olivotto I., Cecchini P., et al. Utility of an integrated clinical, echocardiographic, and venous ultrasonographic approach for triage of patients with suspected pulmonary embolism. Am J Cardiol. 1998;82:1230-1235.
76. Rudoni R.R., Jackson R.E., Godfrey G.W., et al. Use of two-dimensional echocardiography for the diagnosis of pulmonary embolus. J Emerg Med. 1998;16:5-8.
77. Bova C., Greco F., Misuraca G., et al. Diagnostic utility of echocardiography in patients with suspected pulmonary embolism. Am J Emerg Med. 2003;21:180-183.
78. Goldhaber S.Z. Echocardiography in the management of pulmonary embolism. Ann Intern Med. 2002;136:691-700.
79. Rosenberger P., Shernan S.K., Mihaljevic T., Eltzschig H.K. Transesophageal echocardiography for detecting extrapulmonary thrombi during pulmonary embolectomy. Ann Thorac Surg. 2004;78:862-866. discussion 6
80. Pruszczyk P., Torbicki A., Kuch-Wocial A., et al. Transoesophageal echocardiography for definitive diagnosis of haemodynamically significant pulmonary embolism. Eur Heart J. 1995;16:534-538.
81. Rosenberger P., Shernan S.K., Body S.C., Eltzschig H.K. Utility of intraoperative transesophageal echocardiography for diagnosis of pulmonary embolism. Anesth Analg. 2004;99:12-16.
82. Kline J.A., Hernandez-Nino J., Rose G.A., et al. Surrogate markers for adverse outcomes in normotensive patients with pulmonary embolism. Crit Care Med. 2006;34:2773-2780.
83. Goodman L.R., Stein P.D., Matta F., et al. CT venography and compression sonography are diagnostically equivalent: Data from PIOPED II. AJR Am J Roentgenol. 2007;189:1071-1076.
84. Lensing A.W., Doris C.I., McGrath F.P., et al. A comparison of compression ultrasound with color Doppler ultrasound for the diagnosis of symptomless postoperative deep vein thrombosis. Arch Intern Med. 1997;157:765-768.
85. Goodacre S., Sampson F., Thomas S., et al. Systematic review and meta-analysis of the diagnostic accuracy of ultrasonography for deep vein thrombosis. BMC Med Imaging. 2005;5:6.
86. Taffoni M.J., Ravenel J.G., Ackerman S.J. Prospective comparison of indirect CT venography versus venous sonography in ICU patients. AJR Am J Roentgenol. 2005;185:457-462.
87. Birdwell B.G., Raskob G.E., Whitsett T.L., et al. The clinical validity of normal compression ultrasonography in outpatients suspected of having deep venous thrombosis. Ann Intern Med. 1998;128:1-7.
88. Cogo A., Lensing A.W., Koopman M.M., et al. Compression ultrasonography for diagnostic management of patients with clinically suspected deep vein thrombosis: Prospective cohort study. BMJ. 1998;316:17-20.
89. Perrier A., Roy P.M., Sanchez O., et al. Multidetector-row computed tomography in suspected pulmonary embolism. N Engl J Med. 2005;352:1760-1768.
90. Ghaye B., Nchimi A., Noukoua C.T., Dondelinger R.F. Does multi-detector row CT pulmonary angiography reduce the incremental value of indirect CT venography compared with single-detector row CT pulmonary angiography? Radiology. 2006;240:256-262.
91. Thomas S.M., Goodacre S.W., Sampson F.C., van Beek E.J. Diagnostic value of CT for deep vein thrombosis: Results of a systematic review and meta-analysis. Clin Radiol. 2008;63:299-304.
92. Katz D.S., Loud P.A., Bruce D., et al. Combined CT venography and pulmonary angiography: A comprehensive review. Radiographics. 2002;22:S3-S19. discussion S20-S4
93. Goodman L.R., Stein P.D., Beemath A., et al. CT venography for deep venous thrombosis: Continuous images versus reformatted discontinuous images using PIOPED II data. AJR Am J Roentgenol. 2007;189:409-412.
94. Kelly J., Hunt B.J., Moody A. Magnetic resonance direct thrombus imaging: A novel technique for imaging venous thromboemboli. Thromb Haemost. 2003;89:773-782.
95. Sampson F.C., Goodacre S.W., Thomas S.M., van Beek E.J. The accuracy of MRI in diagnosis of suspected deep vein thrombosis: Systematic review and meta-analysis. Eur Radiol. 2007;17:175-181.
95a. Stein PD., Chenevert TL., Fowler SE., et al. Gadolinium-enhanced magnetic resonance angiography for pulmonary embolism: a multicenter prospective study (PIOPED III). Ann Intern Med. 2010;152(7):434-443, W142-433.
96. Goodacre S., Sampson F., Stevenson M., et al. Measurement of the clinical and cost-effectiveness of non-invasive diagnostic testing strategies for deep vein thrombosis. Health Technol Assess. 2006;10:1-168. iii-iv
97. Elefteriades J.A. Natural history of thoracic aortic aneurysms: indications for surgery, and surgical versus nonsurgical risks. Ann Thorac Surg. 2002;74:S1877-S1880. discussion S92-S8
98. Hogg K., Teece S. Best evidence topic report: The sensitivity of a normal chest radiograph in ruling out aortic dissection. Emerg Med J. 2004;21:199-200.
99. Klompas M. Does this patient have an acute thoracic aortic dissection? JAMA. 2002;287:2262-2272.
100. Hsue P.Y., Salinas C.L., Bolger A.F., et al. Acute aortic dissection related to crack cocaine. Circulation. 2002;105:1592-1595.
101. Hogan C.J. An aortic dissection in a young weightlifter with non-Marfan fibrillinopathy. Emerg Med J. 2005;22:304-305.
102. Knaut A.L., Cleveland J.C.Jr. Aortic emergencies. Emerg Med Clin North Am. 2003;21:817-845.
103. Shirakabe A., Hata N., Yokoyama S., et al. Diagnostic score to differentiate acute aortic dissection in the emergency room. Circ J. 2008;72:986-990.
103a. Pesola GR., Pesola HR., Lin M., et al. The normal difference in bilateral indirect blood pressure recordings in hypertensive individuals. Acad Emerg Med. 2002;9(4):342-345.
103b. Pesola GR., Pesola HR., Nelson MJ., et al. The normal difference in bilateral indirect blood pressure recordings in normotensive individuals. Am J Emerg Med. 2001;19(1):43-45.
103c. Nienaber CA., von Kodolitsch Y., Nicolas V., et al. The diagnosis of thoracic aortic dissection by noninvasive imaging procedures. N Engl J Med. 1993;238(1):1-9.
103d. Srichai MB., Kim S., Axel L., et al. Non-gadolinium-enhanced 3-dimensional magnetic resonance angiography for the evaluation of thoracic aortic disease: a preliminary experience. Tex Heart Inst J. 2010;37(1):58-65.
104. Savoca C.J., Austin J.H., Goldberg H.I. The right paratracheal stripe. Radiology. 1977;122:295-301.
105. Umeki S. A new roentgenographic sign: The split eggshell sign for aortic arch aneurysms. Am J Med. 1989;86:362-363.
106. Jagannath A.S., Sos T.A., Lockhart S.H., et al. Aortic dissection: A statistical analysis of the usefulness of plain chest radiographic findings. AJR Am J Roentgenol. 1986;147:1123-1126.
107. Hagan P.G., Nienaber C.A., Isselbacher E.M., et al. The International Registry of Acute Aortic Dissection (IRAD): New insights into an old disease. JAMA. 2000;283:897-903.
108. Luker G.D., Glazer H.S., Eagar G., et al. Aortic dissection: Effect of prospective chest radiographic diagnosis on delay to definitive diagnosis. Radiology. 1994;193:813-819.
109. von Kodolitsch Y., Nienaber C.A., Dieckmann C., et al. Chest radiography for the diagnosis of acute aortic syndrome. Am J Med. 2004;116:73-77.
110. Weinbaum F.I., Dubner S., Turner J.W., Pardes J.G. The accuracy of computed tomography in the diagnosis of retroperitoneal blood in the presence of abdominal aortic aneurysm. J Vasc Surg. 1987;6:11-16.
111. Nienaber C.A., von Kodolitsch Y., Nicolas V., et al. The diagnosis of thoracic aortic dissection by noninvasive imaging procedures. N Engl J Med. 1993;328:1-9.
112. Yoshida S., Akiba H., Tamakawa M., et al. Thoracic involvement of type A aortic dissection and intramural hematoma: Diagnostic accuracy—Comparison of emergency helical CT and surgical findings. Radiology. 2003;228:430-435.
113. Rivas L.A., Fishman J.E., Munera F., Bajayo D.E. Multislice CT in thoracic trauma. Radiol Clin North Am. 2003;41:599-616.
114. Weisenfarth JD. Aortic Dissection in Emergency Medicine. (Accessed at http://emedicine.medscape.com/)
115. Brenner D.J., Hall E.J. Computed tomography: An increasing source of radiation exposure. N Engl J Med. 2007;357:2277-2284.
115a. Smith-Bindman R., Lipson J., Marcus R., et al. Radiation dose associated with common computed tomography examinations and the associated lifetime attributable risk of cancer. Arch Intern Med. 2009;169(22):2078-2086.
116. Kung H-C, Hoyert DL, Xu J, Murphy SL: Deaths: final data for 2005. National Vital Statistics Reports 56(10):1-121.
117. Einstein A.J., Henzlova M.J., Rajagopalan S. Estimating risk of cancer associated with radiation exposure from 64-slice computed tomography coronary angiography. JAMA. 2007;298:317-323.
118. Lee C.I., Haims A.H., Monico E.P., et al. Diagnostic CT scans: Assessment of patient, physician, and radiologist awareness of radiation dose and possible risks. Radiology. 2004;231:393-398.
119. De Santis M., Di Gianantonio E., Straface G., et al. Ionizing radiations in pregnancy and teratogenesis: A review of literature. Reprod Toxicol. 2005;20:323-329.
119a. American College of Obstetricians and Gynecologists, Committee on Obstetric Practice. Guidelines for diagnostic imaging during pregnancy. ACOG Committee Opinion no. 158. Washington, DC: ACOG; 1995.
120. Toppenberg K.S., Hill D.A., Miller D.P. Safety of radiographic imaging during pregnancy. Am Fam Physician. 1999;59:1813-1818. 20
121. Ratnapalan S., Bona N., Chandra K., Koren G. Physicians’ perceptions of teratogenic risk associated with radiography and CT during early pregnancy. AJR Am J Roentgenol. 2004;182:1107-1109.
122. Hurwitz L.M., Yoshizumi T., Reiman R.E., et al. Radiation dose to the fetus from body MDCT during early gestation. AJR Am J Roentgenol. 2006;186:871-876.
123. Jaffe T.A., Yoshizumi T.T., Toncheva G.I., et al. Early first-trimester fetal radiation dose estimation in 16-MDCT without and with automated tube current modulation. AJR Am J Roentgenol. 2008;190:860-864.
124. Morcos S.K., Thomsen H.S. Adverse reactions to iodinated contrast media. Eur Radiol. 2001;11:1267-1275.
125. Valls C., Andia E., Sanchez A., Moreno V. Selective use of low-osmolality contrast media in computed tomography. Eur Radiol. 2003;13:2000-2005.
126. American College of Radiology. Manual on Contrast Media, ed 7, American College of Radiology, 2010.
127. Greenberger P.A., Halwig J.M., Patterson R., Wallemark C.B. Emergency administration of radiocontrast media in high-risk patients. J Allergy Clin Immunol. 1986;77:630-634.
128. Lasser E.C., Berry C.C., Mishkin M.M., et al. Pretreatment with corticosteroids to prevent adverse reactions to nonionic contrast media. AJR Am J Roentgenol. 1994;162:523-526.
129. Freed K.S., Leder R.A., Alexander C., et al. Breakthrough adverse reactions to low-osmolar contrast media after steroid premedication. AJR Am J Roentgenol. 2001;176:1389-1392.
130. McCullough P.A., Adam A., Becker C.R., et al. Epidemiology and prognostic implications of contrast-induced nephropathy. Am J Cardiol. 2006;98:5K-13K.
131. McCullough P.A., Sandberg K.R. Epidemiology of contrast-induced nephropathy. Rev Cardiovasc Med. 2003;5(Suppl 4):S3-S9.
132. Trivedi H.S., Moore H., Nasr S., et al. A randomized prospective trial to assess the role of saline hydration on the development of contrast nephrotoxicity. Nephron Clin Pract. 2003;93:C29-C34.
133. Krasuski R.A., Beard B.M., Geoghagan J.D., et al. Optimal timing of hydration to erase contrast-associated nephropathy: The OTHER CAN study. J Invasive Cardiol. 2003;15:699-702.
134. Merten G.J., Burgess W.P., Gray L.V., et al. Prevention of contrast-induced nephropathy with sodium bicarbonate: A randomized controlled trial. JAMA. 2004;291:2328-2334.
135. Kay J., Chow W.H., Chan T.M., et al. Acetylcysteine for prevention of acute deterioration of renal function following elective coronary angiography and intervention: A randomized controlled trial. JAMA. 2003;289:553-558.
136. Baker C.S., Wragg A., Kumar S., et al. A rapid protocol for the prevention of contrast-induced renal dysfunction: The RAPPID study. J Am Coll Cardiol. 2003;41:2114-2118.
137. Brar S.S., Shen A.Y., Jorgensen M.B., et al. Sodium bicarbonate vs. sodium chloride for the prevention of contrast medium-induced nephropathy in patients undergoing coronary angiography: A randomized trial. JAMA. 2008;300:1038-1046.
138. Morcos S.K., Remy-Jardin M. Gadolinium-based contrast media for multi-detector row spiral CT pulmonary angiography in patients with renal insufficiency. Radiology. 2006;238:1077. author reply, 1077-1078
139. Remy-Jardin M., Bahepar J., Lafitte J.J., et al. Multi-detector row CT angiography of pulmonary circulation with gadolinium-based contrast agents: Prospective evaluation in 60 patients. Radiology. 2006;238:1022-1035.
140. Remy-Jardin M., Dequiedt P., Ertzbischoff O., et al. Safety and effectiveness of gadolinium-enhanced multi-detector row spiral CT angiography of the chest: Preliminary results in 37 patients with contraindications to iodinated contrast agents. Radiology. 2005;235:819-826.
141. Takakuwa K.M., Halpern E.J. Evaluation of a “triple rule-out” coronary CT angiography protocol: use of 64-section CT in low-to-moderate risk emergency department patients suspected of having acute coronary syndrome. Radiology. 2008;248:438-446.
142. Stein P.D., Woodard P.K., Weg J.G., et al. Diagnostic pathways in acute pulmonary embolism: Recommendations of the PIOPED II investigators. Am J Med. 2006;119:1048-1055.
143. East Ohio Regional Hospital. Patient price information list. (Accessed at http://www.eastohioregionalhospital.com/pricelist.asp)
144. Harvard Pilgrim HealthCare. Massachusetts medical cost data. (Accessed at https://www.harvardpilgrim.org/portal/page?_pageid=253, 192924&_dad=portal&_schema=PORTAL)
145. Broder J: Emergency CT of the chest: Pulmonary embolism and aortic pathology. (Accessed at http://emedhome.com/)