Chapter 14 Acquired Macular Disorders
Introduction
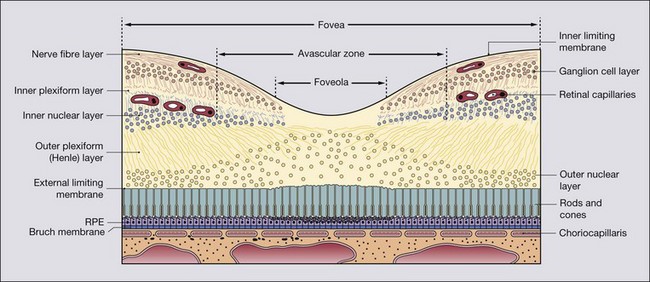
Anatomical landmarks
Retinal pigment epithelium
Bruch membrane
Clinical evaluation of macular disease
Symptoms
Slit-lamp biomicroscopy
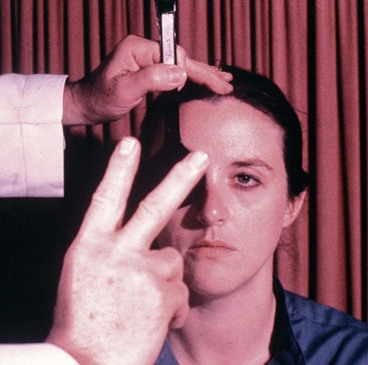
Indirect slit-lamp ophthalmoscopy (Fig. 14.3A) utilizes high power convex lenses designed to obtain a wide field of view of the fundus which is vertically inverted and laterally reversed (Fig. 14.3B). The technique is as follows:
 of its full round diameter.
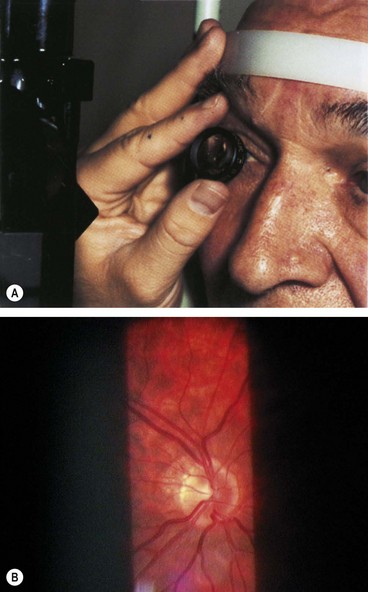
Visual acuity
Snellen visual acuity
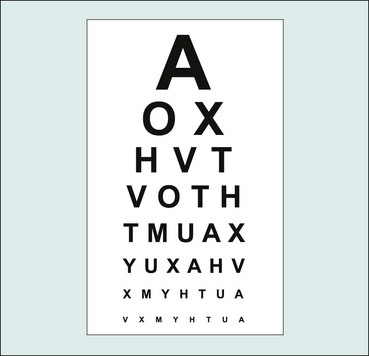
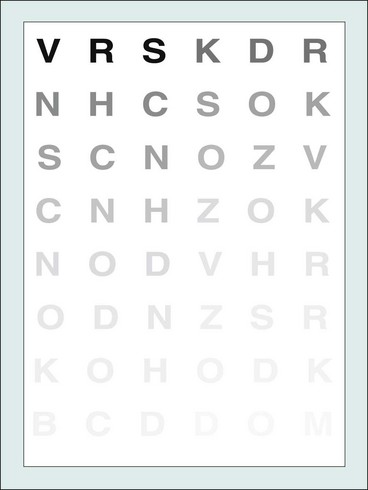
Distance visual acuity (VA) is directly related to the minimum angle of separation (subtended at the nodal point of the eye) between two objects that allow them to be perceived as distinct. It is usually carried out using black letters or symbols (optotypes) of a range of sizes set on a white chart at a standard distance.
Very poor visual acuity
If the patient is unable to read any letters at any distance, VA is recorded as follows:
LogMAR acuity
LogMAR charts address many of the deficiencies of the Snellen chart (Table 14.1), and are the standard means of VA measurement in research and increasingly in clinical practice.
Table 14.1 Comparison of Snellen and logMAR visual acuity testing
| Snellen | LogMAR |
|---|---|
| Shorter test time | Longer test time |
| More letters on the lower lines introduces an unbalanced ‘crowding’ effect | Equal numbers of letters on different lines controls for crowding effect |
| Fewer larger letters reduces accuracy at lower levels of VA | Equal numbers of letters on low and higher acuity lines increases accuracy at lower VA |
| Variable readability between individual letters | Similar readability between letters (particularly in later ETDRS charts using Sloan optotypes) |
| Lines not balanced with each other for consistency of readability | Lines balanced for consistency of readability (particularly in later ETDRS charts) |
| Smaller chart so relatively portable | Larger chart so less portable |
| 6 m testing distance: longer testing lane (or a mirror) required | 4 m testing distance on many charts: smaller testing lane (or no mirror) required |
| Letter and row spacing not systematic | Letter and row spacing set to optimize contour interaction |
| Lower accuracy and consistency so relatively unsuitable for research | Higher accuracy and consistency so appropriate for research (but optimally three versions of ETDRS chart and standardized lighting required) |
| No negative scoring | Better than 6/6 equivalent VA gives a counterintuitive negative score |
| Straightforward scoring system; little or no mental arithmetic needed | Slightly more complex scoring; some mental arithmetic required (easier with VAR system) |
| Easy to use; many clinicians perceive as satisfactory in standard clinical setting | Despite advantages, slightly less user-friendly |
LogMar charts

Contrast sensitivity
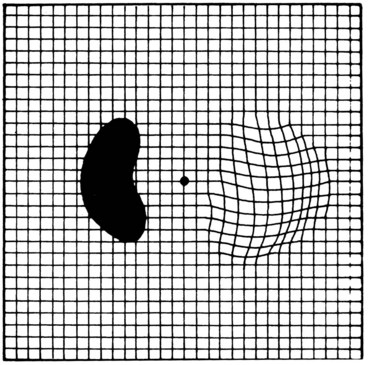
Amsler grid
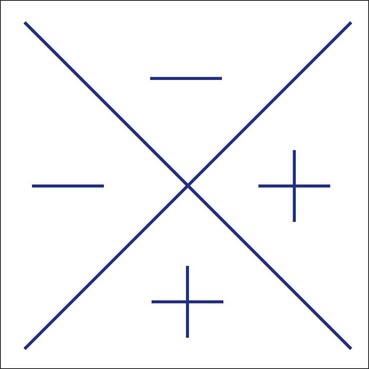
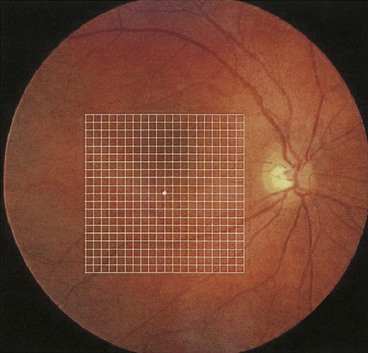
The Amsler grid evaluates the 20° of the visual field centred on fixation (Fig. 14.10). It is principally useful in screening for and monitoring macular disease, but will also demonstrate central visual field defects originating elsewhere. Patients with a substantial risk of choroidal neovascularization should be provided with an Amsler recording chart for regular use at home.
Charts
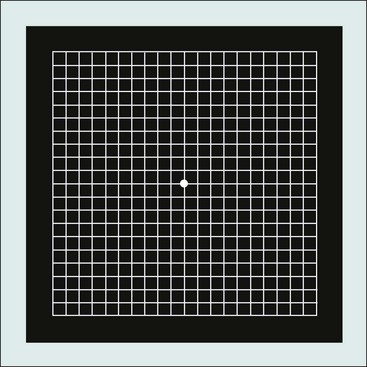
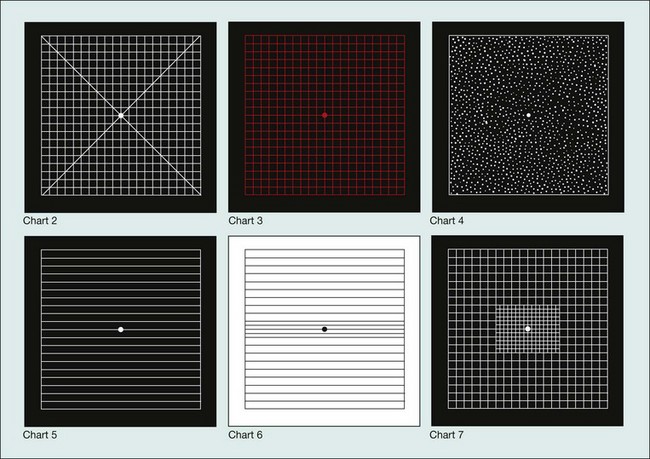
There are seven charts, each consisting of a 10 cm square (Figs 14.11 and 14.12).
Technique
The pupils should not yet have been dilated, and in order to avoid a photostress effect the eyes should not yet have been examined on the slit-lamp. A presbyopia correction should be worn if appropriate. The chart should be well illuminated and held at a comfortable reading distance. One eye is covered.
In clinical practice, testing is very commonly carried out simply using the recording chart, upon which patients can then illustrate any abnormality directly.
fundus Fluorescein angiography
Principles
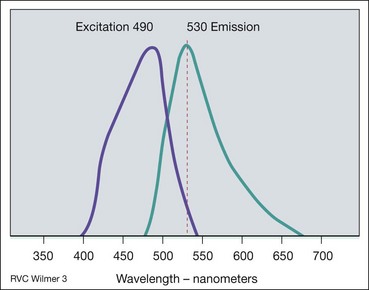
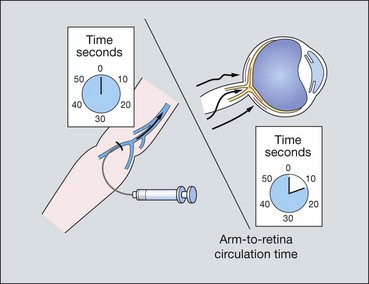
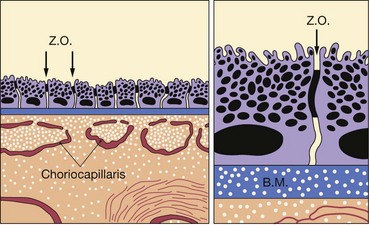
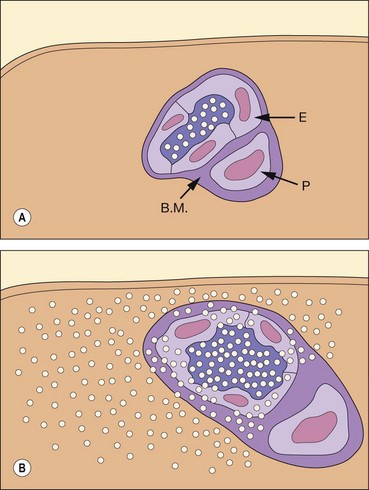
Fig. 14.17 Inner blood–retinal barrier. (A) Intact; (B) disrupted (E = endothelial cell; B.M. = basement membrane; P = pericyte)
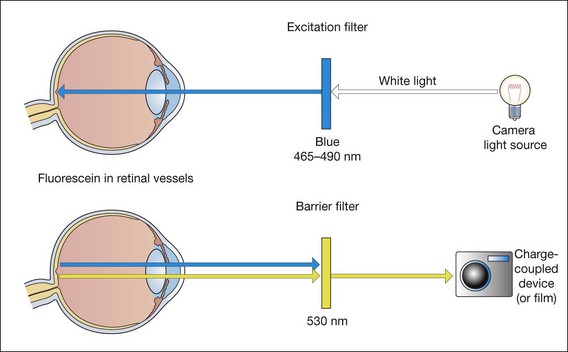
Fig. 14.18 Principles of fluorescein angiography
(Redrawn from PG Watson, BL Hazelman, CE Pavésio and WR Green, from The Sclera and Systemic Disorders, Butterworth-Heinemann, 2004)
It must be emphasized that FA should only be performed if the findings are likely to influence management.
Technique
Table 14.2 Adverse events in fluorescein angiography
Table 14.3 Red-free fundus photography
Phases of the angiogram
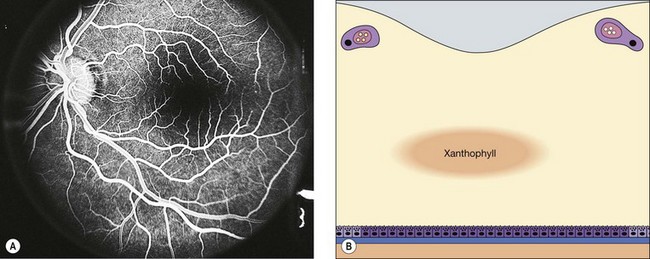
Fluorescein enters the eye through the ophthalmic artery, passing into the choroidal circulation through the short posterior ciliary arteries and into the retinal circulation through the central retinal artery. Because the route to the retinal circulation is slightly longer than that to the choroidal, the latter is filled about 1 second before the former (Fig. 14.19). In the choroidal circulation, precise details are often not discernible, mainly because of rapid leakage of free fluorescein from the choriocapillaris and also because the melanin in the RPE cells blocks choroidal fluorescence. The angiogram consists of the following overlapping phases (Fig. 14.20).
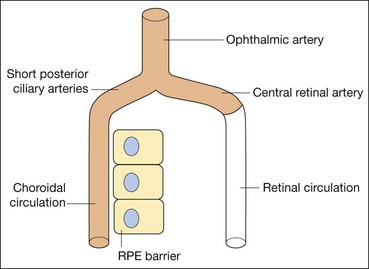
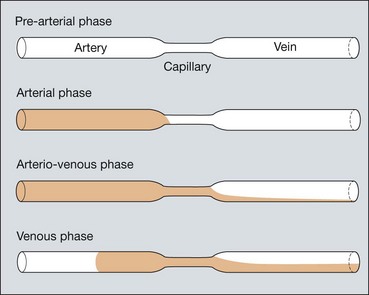
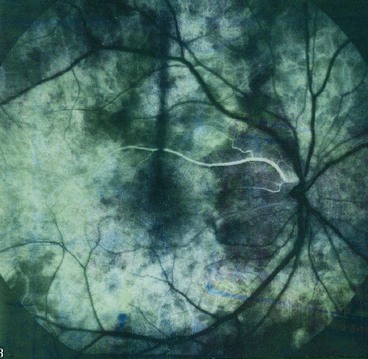
Fig. 14.21 Choroidal phase shows patchy choroidal filling as well as filling of a cilioretinal artery
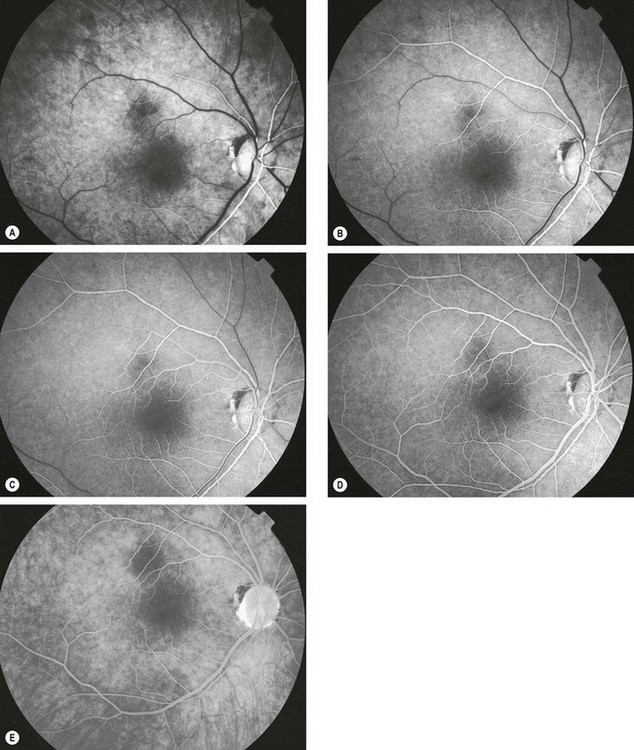
Fig. 14.22 Normal fluorescein angiogram. (A) Arterial phase shows filling of the choroid and retinal arteries; (B) arteriovenous (capillary) phase shows complete arterial filling and early laminar venous flow; (C) early venous phase shows marked laminar venous flow; (D) mid-venous phase shows almost complete venous filling; (E) late (elimination) phase shows weak fluorescence with staining of the optic disc
Causes of hyperfluorescence
Increased fluorescence may be caused by (a) enhanced visualization of a normal density of fluorescein, or (b) an increase in the fluorescein content of the tissues.
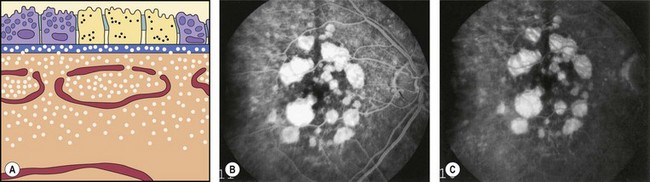
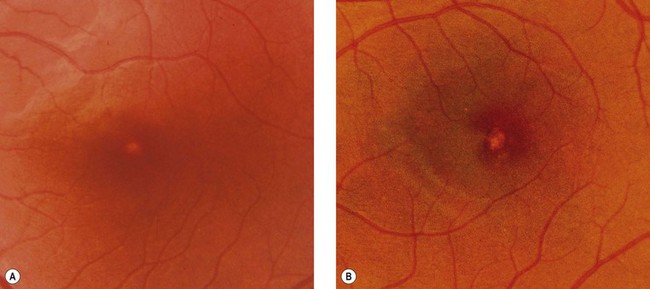
Fig. 14.24 Hyperfluorescence caused by a transmission (window) defect associated with dry age-related macular degeneration
Causes of hypofluorescence
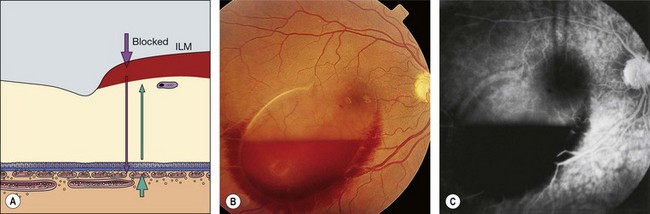
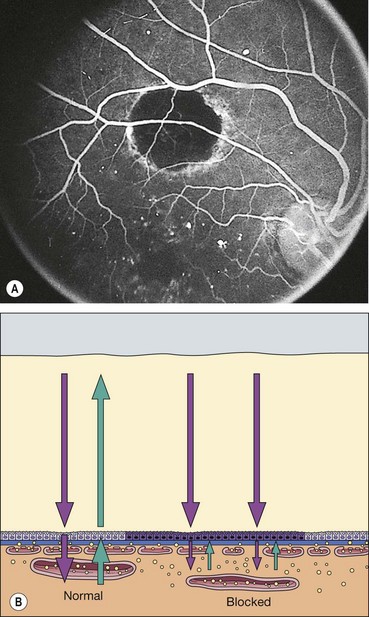
Reduction or absence of fluorescence may be due to: (a) optical obstruction (‘masking’ or blockage) of normal density of fluorescein in a tissue (Fig. 14.28) or (b) inadequate perfusion of tissue (‘filling defect’).
Systematic approach to reporting angiograms
A fluorescein angiogram should be interpreted methodically to optimize diagnostic accuracy. A suggested scheme:
Indocyanine green angiography
Principles
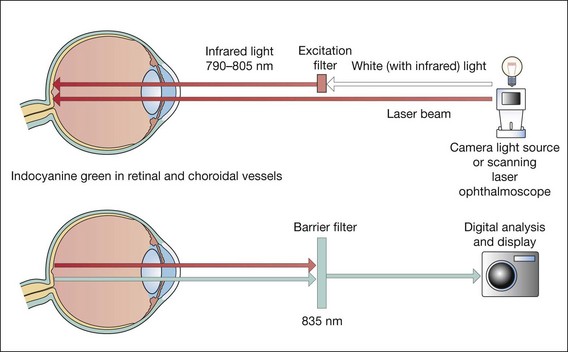
Fig. 14.32 Principles of indocyanine green angiography
(Redrawn from PG Watson, BL Hazelman, CE Pavésio and WR Green, from The Sclera and Systemic Disorders, Butterworth-Heinemann, 2004)
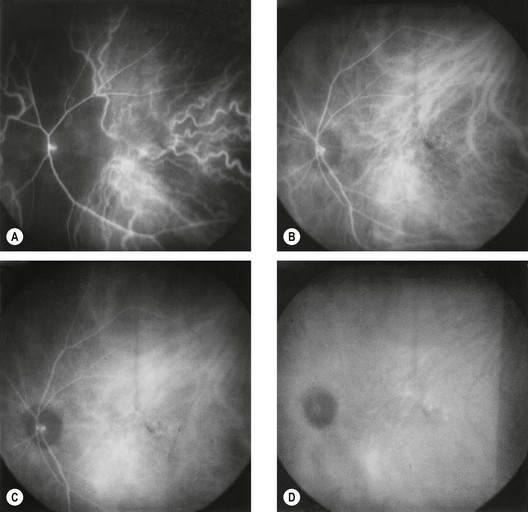
Fig. 14.33 Normal indocyanine green angiogram. (A) Early phase (up to 60 seconds post-injection) shows prominent choroidal arteries and poor early perfusion of the ‘choroidal watershed’ zone; (B) early mid-phase (1–3 minutes) shows more prominence of choroidal veins as well as retinal vessels; (C) late mid-phase (3–15 minutes) shows fading of choroidal vessels but retinal vessels are still visible; diffuse tissue staining is also present; (D) late phase (15–45 minutes) shows hypofluorescent choroidal vessels and gradual fading of diffuse hyperfluorescence
(Courtesy of S Milewski)
Adverse effects
ICGA is generally better tolerated than FA although the following problems may occur:
Causes of hyperfluorescence
Hypofluorescence
Clinical indications
Optical coherence tomography
Definition
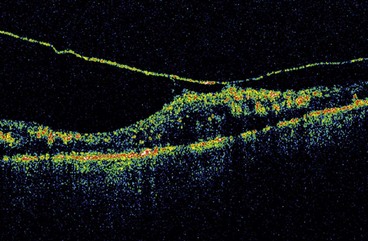
Optical coherence tomography (OCT) is a non-invasive, non-contact imaging system which provides high resolution cross-sectional images of the retina, vitreous and optic nerve head. Imaging of the anterior segment (AS-OCT) is also possible using the same technique although at present modified apparatus must be employed.
Principles
OCT is analogous to B-scan ultrasonography but uses near-infrared light interferometry rather than sound waves. Interferometry involves studying the pattern of interference created by the superposition of waves.
Indications
Normal appearance
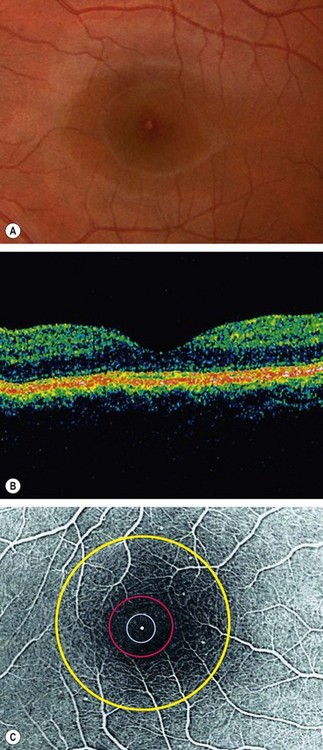
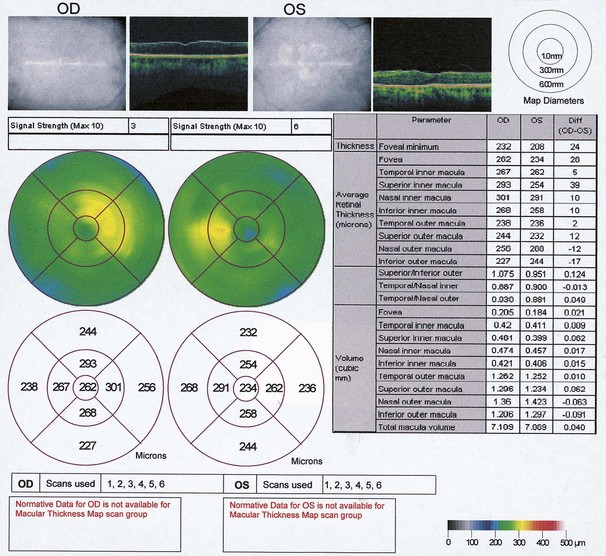
High reflectivity structures are depicted as red, intermediate as green-yellow and low reflectivity as blue-black (Fig. 14.34). High resolution OCT (Fig. 14.34B) has the ability to identify fine retinal structures such as the external limiting membrane and ganglion cell layer which are not visualized as clearly with standard resolution (Fig. 14.34A). Detailed quantitative information on retinal thickness can be displayed numerically and in a false-colour topographical map (Fig. 14.35).
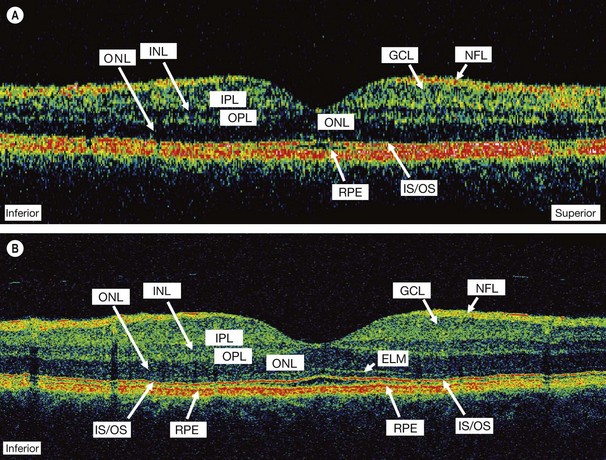
Fig. 14.34 OCT displays. (A) Standard resolution of a normal macula in which most of the major retinal layers can be visualized; (B) high-resolution improves visualization of smaller structures such as the external limiting membrane (ELM) and ganglion cell layer (GCL); INL = inner nuclear layer; IPL = inner plexiform layer; IS/OS = photoreceptor inner and outer segment junction; NFL = nerve fibre layer; ONL = outer nuclear layer; OPL = outer plexiform layer; RPE = retinal pigment epithelium
(Courtesy of J Fujimoto)
Age-related macular degeneration
Introduction
Age-related macular degeneration (AMD), also known as age-related maculopathy (ARM), is a degenerative disorder affecting the macula. It is characterized by the presence of specific clinical findings including drusen and RPE changes as early features with no evidence the signs are secondary to another disorder. Later stages of the disease are associated with impairment of vision.
Classification
Epidemiology
Risk factors
AMD is multifactorial in aetiology, and is thought to involve a complex interaction between genetic and environmental factors.
Drusen
Histopathology
Clinical features
Fluorescein angiography
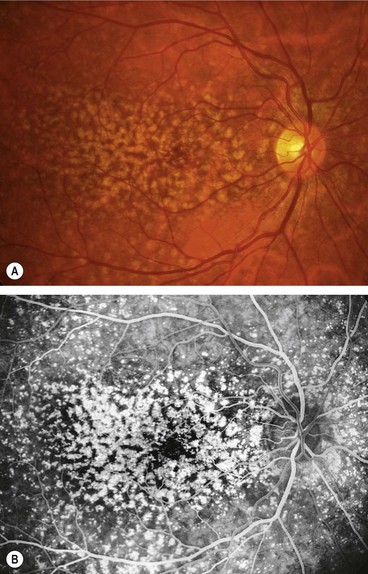
Fluorescein angiographic findings depend on the state of the overlying RPE and on the affinity of the drusen for fluorescein. Hyperfluorescence can be caused by a window defect due to atrophy of the overlying RPE, or by late staining (Fig. 14.38). Hypofluorescent drusen masking background fluorescence are hydrophobic, with a high lipid content, and tend not to stain.
Lesions related to drusen
A number of conditions feature lesions similar to age-related drusen, and at least some may have a similar pathophysiological basis.
Prophylactic antioxidant supplementation in AMD
There is substantial evidence, notably from the Age-Related Eye Disease Study (AREDS), that taking high dose antioxidant vitamins and minerals on a regular basis can decrease the risk of AMD progression.
Recommendations for use
The recommendation was made in AREDS that individuals aged over 55 should undergo examination for the following high risk characteristics, and if one or more are present should consider antioxidant supplementation:
The reduction in risk of progression to further visual loss at 5 years is in the order of 25% for those taking supplements with the more advanced of these signs at baseline; supplements did not discernibly reduce progression in those with early or no AMD.
Other considerations
Although supplementation is generally very safe, possible adverse effects include an increased risk of lung cancer with beta-carotene in smokers and ex-smokers, genitourinary tract problems with high zinc intake, and heart failure in people with vascular disease or diabetes (vitamin E).
Non-exudative (dry) AMD
Diagnosis
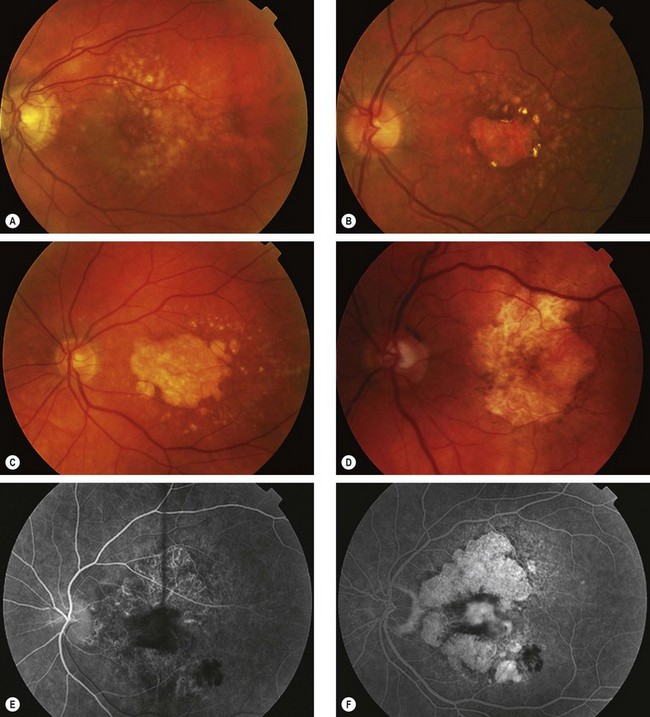
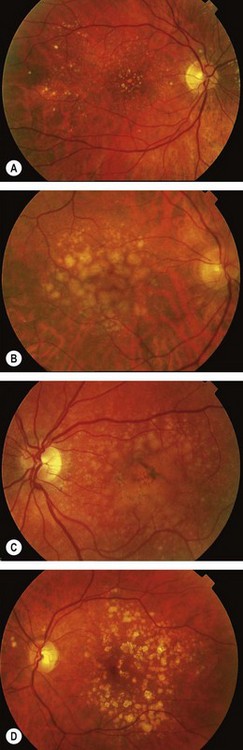
Fig. 14.40 Atrophic age-related macular degeneration. (A) Drusen and mild RPE changes; (B) drusen and moderate retinal atrophy; (C) drusen and geographic atrophy; (D) geographic atrophy and disappearance of drusen; (E) FA arteriovenous phase shows slight hyperfluorescence; (F) FA late phase shows intense hyperfluorescence (window defects)
Management
Retinal pigment epithelial detachment
Pathogenesis
Pigment epithelial detachment (PED) from the inner collagenous layer of Bruch membrane is caused by disruption of the physiological forces maintaining adhesion. The basic mechanism is thought to be the reduction of hydraulic conductivity of a thickened and dysfunctional Bruch membrane, thus impeding movement of fluid from the RPE towards the choroid. Immune-mediated processes may also be important. The different types are discussed below.
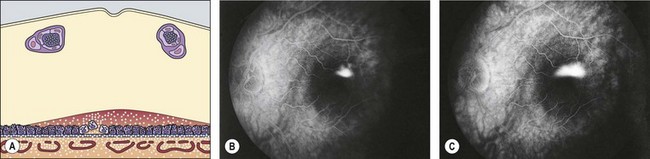
Serous PED
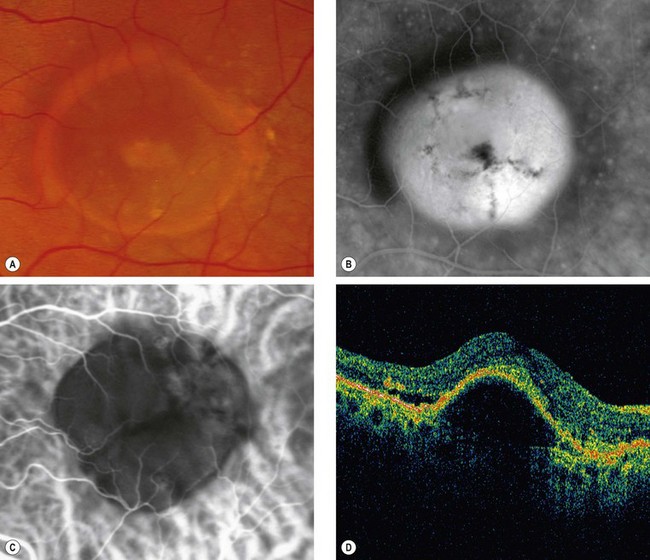
Fig. 14.41 Detachment of the RPE. (A) Clinical appearance; (B) FA shows hyperfluorescence; (C) ICGA shows hypofluorescence with a faint ring of surrounding hyperfluorescence; (D) OCT shows separation of the RPE from Bruch membrane
(Courtesy of P Gili – figs A and B; fig. C – A Bolton; C Barry – fig. D)
Fibrovascular PED
By definition (Macular Photocoagulation Study classification) fibrovascular PED represents a form of ‘occult’ CNV (see below).
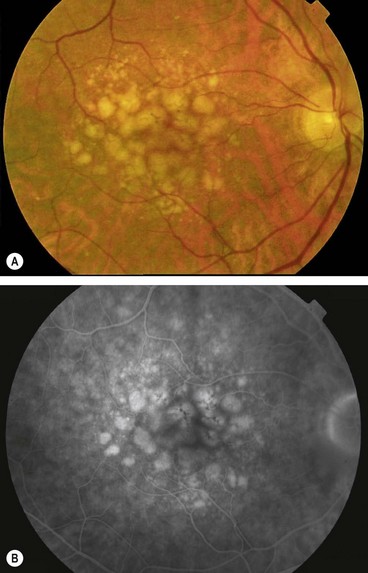
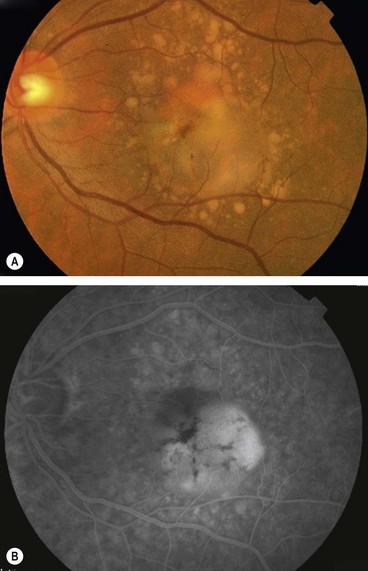
Drusenoid PED
Drusenoid PED develops from confluent large soft drusen (Fig. 14.42A).
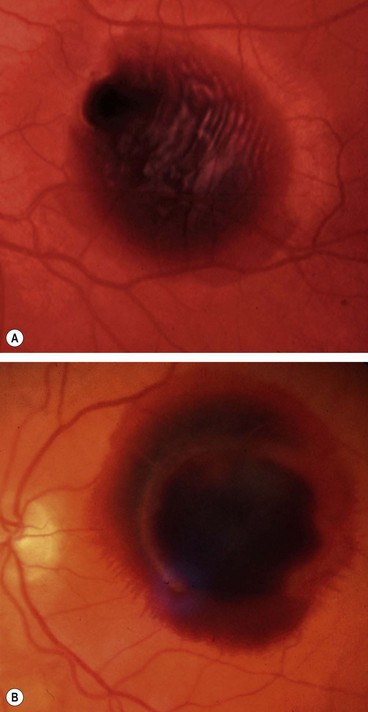
Haemorrhagic PED
Virtually all eyes with haemorrhagic PED have underlying CNV or polypoidal choroidal vasculopathy (PCV): consider the latter if no drusen are seen.
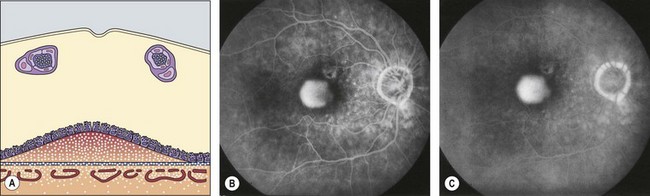
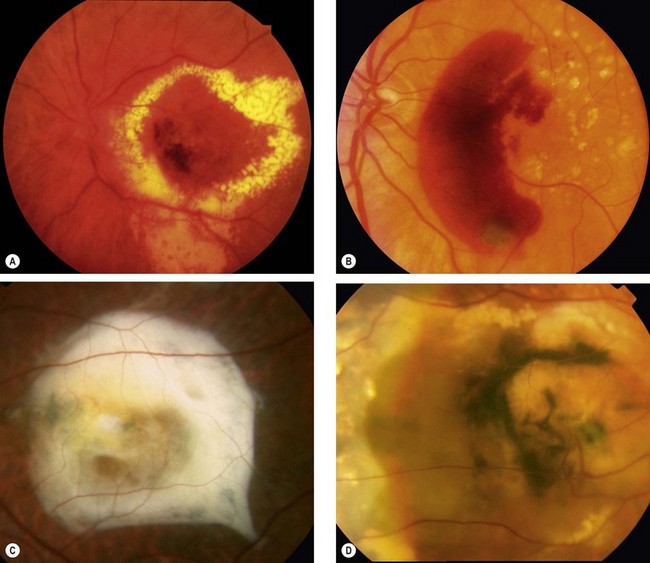
Retinal pigment epithelial tear
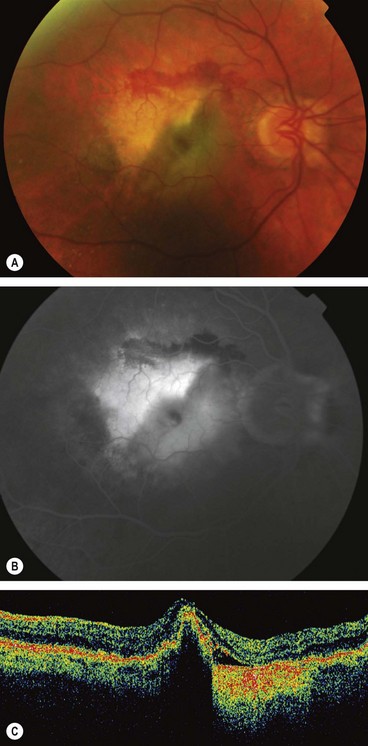
Fig. 14.44 Tear of the RPE. (A) A pale triangular area with surrounding blood and an adjacent darker area; (B) FA late phase shows relative hypofluorescence of the folded flap with adjacent hyperfluorescence where the RPE is absent; (C) OCT shows hyperreflectivity adjacent to the fold
(Courtesy of Moorfields Eye Hospital – figs A and B; C Barry – fig. C)
Choroidal neovascularization
Pathogenesis
Clinical features
Fluorescein angiography
FA is used primarily to confirm a suspected diagnosis of CNV prior to committing the patient to anti-VEGF treatment. Precise localization is now much less important and the distinction between classic and occult CNV membranes less relevant than formerly. Monitoring now consists predominantly of serial retinal thickness or volume assessment with OCT. The terminology commonly used to describe the FA appearances of CNV is derived from the Macular Photocoagulation Study (MPS) as follows:
Indocyanine green angiography
ICGA demonstrates CNV as a focal hyperfluorescent ‘hot spot’ or ‘plaque’, and can be an extremely useful adjunct to FA for the following reasons:
Optical coherence tomography
The major use of OCT in the management of CNV is in monitoring the response to treatment, for which it provides an accurate quantitative assessment. OCT has to date been of limited help in the diagnosis of CNV, though ongoing improvements in structural definition with newer high resolution devices, including three-dimensional imaging and the ability to construct separate images of different retinal layers, is likely to lead to increasing utility. Typically, CNV is shown as a thickening and fragmentation of the RPE/choriocapillaris high-reflectivity band. Subretinal and sub-RPE fluid (Fig. 14.49A), blood and scarring (Fig. 14.49B) are demonstrated.
Treatment with anti-VEGF agents
Ranibizumab (Lucentis)
Ranibizumab is a humanized monoclonal antibody fragment developed specifically for use in the eye. It non-selectively binds to and inhibits all isoforms of VEGF-A. The optimal timing of intravitreal injections is not yet clearly defined. The usual dose is 0.5 mg in 0.05 mL. Three main treatment strategies are currently adopted:
Bevacizumab (Avastin)
In contrast to ranibizumab, bevacizumab (Avastin) is a complete antibody and is very much cheaper; at present its use for AMD is ‘off label’.
Limited results suggest that it is effective – perhaps comparably to ranibizumab – and safe for intravitreal injection and trials are ongoing to compare the two. As bevacizumab is a larger molecule than ranibizumab, it may be retained in the vitreous for a longer period, so may need to be given less frequently. Speculatively it might also be associated with fewer systemic side-effects, at least in comparison with the 0.5 mg dose of ranibizumab; the bevacizumab 1-year stroke rate is around 0.5%, similar to the normal population rate. The dose of bevacizumab is usually 1.25 mg/0.05 mL or 2.5 mg/0.1 mL.
Pegaptanib (Macugen)
Pegaptanib sodium was the first anti-VEGF agent approved by regulatory authorities for ocular treatment. Although offering visual outcomes superior to photocoagulation, the results are similar to outcomes with PDT (see below), and use of pegaptanib is considerably less widespread than other anti-VEGF agents.
Technique of intravitreal injection
Patients should be able to return to normal activity after 24 hours, but should be warned to seek advice urgently should they experience any deterioration in their vision or symptoms of inflammation.
Photodynamic therapy (PDT)
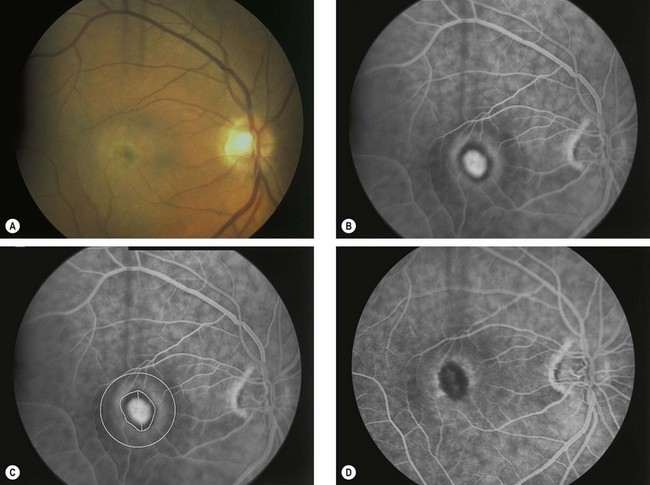
Fig. 14.50 Photodynamic therapy. (A) Small dirty grey lesion at the fovea surrounded by blood; (B) FA venous phase shows hyperfluorescence from classic subfoveal CNV surrounded by a hypofluorescent ring; (C) greatest linear dimension of the lesion; (D) FA 3 months following successful treatment shows hypofluorescence at the site of the lesion
(Courtesy of S Milewski)
Combination therapies
Although anti-VEGF therapy has revolutionized the management of CNV, further investigation is attempting to achieve outcomes which are better still. A principal goal is a reduction in the frequency of intravitreal injections, in view particularly of the rare but potentially severe adverse effects. It is hoped that the use of more than one treatment modality in combination will facilitate this. Regimens include the combination of PDT with anti- VEGF, PDT with intravitreal steroid, steroid and anti-VEGF and ‘triple therapy’: with steroid/anti-VEGF/PDT.
Argon laser photocoagulation
Thermal laser ablation of CNV is now rarely used, though may still be suitable for treatment of classic extrafoveal membranes and some cases of PCV and RAP.
Experimental treatments
A range of additional treatment modalities are under investigation. Examples include:
Haemorrhagic AMD
The visual prognosis for most eyes with extensive subretinal or sub-RPE haemorrhage is poor, although the following should be considered.
Retinal angiomatous proliferation
Retinal angiomatous proliferation (RAP) is a variant of exudative AMD in which the major component of the neovascular complex is initially located within the retina. The process may originate within the deep retinal capillary plexus or within the choroid, in the latter case with the early formation of retinal–choroidal anastomoses (RCA) without an underlying type 1 neovascular membrane. The disease is often bilateral and symmetrical and visual deterioration can be rapid and profound.
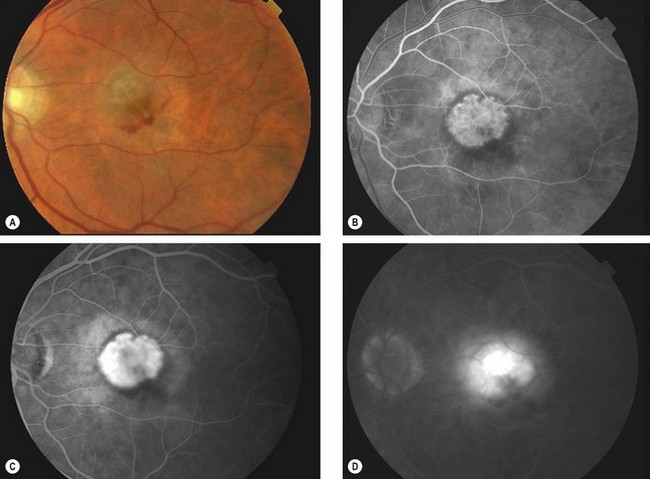
Diagnosis
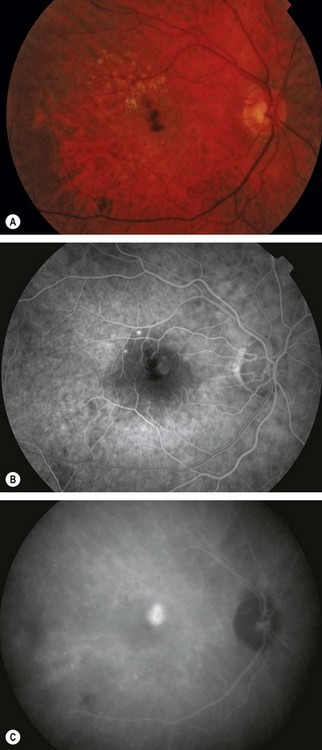
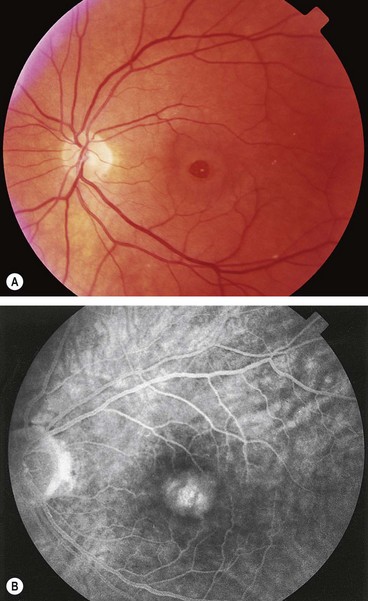
Fig. 14.51 Retinal angiomatous proliferation. (A) Macular drusen and a small intraretinal haemorrhage at the macula; (B) FA early venous phase shows faint hyperfluorescence from a small frond of intraretinal neovascularization; (C) ICGA late phase shows hyperfluorescence of the frond (‘hot spot’)
(Courtesy of Moorfields Eye Hospital)
Treatment
Optimal management has yet to be determined. VEGF has been identified in excised RAP lesions, suggesting a useful role for anti-VEGF therapy, and reports to date show promising results. Limited success has been reported for other treatments including focal photocoagulation of the intraretinal component, PDT, intravitreal steroid and surgical section of supplying vessels. The condition may occasionally resolve spontaneously.
Polypoidal choroidal vasculopathy
Overview
Polypoidal choroidal vasculopathy (PCV), also known as posterior uveal bleeding syndrome, is an idiopathic choroidal vascular disease characterized by a dilated network of inner choroidal vessels with multiple terminal aneurysmal protuberances. It is more common in patients of African and East Asian ethnic origin than in whites and more common in women than men (5 : 1). The disease is often bilateral but asymmetrical in severity.
Diagnosis
Age-related macular hole
Overview
Idiopathic age-related macular hole is a relatively common cause of central visual loss, with a prevalence of approximately 3 : 1000 individuals; with peak incidence of onset in females in the 7th decade. Presentation may be with impairment of central vision in one eye, or as a relatively asymptomatic deterioration, first noticed when the fellow eye is closed or at a routine sight test. The risk of involvement of the fellow eye at 5 years is around 10%.
Pathogenesis
The pathogenesis is incompletely defined, but current hypotheses suggest a role for the following:
Stages
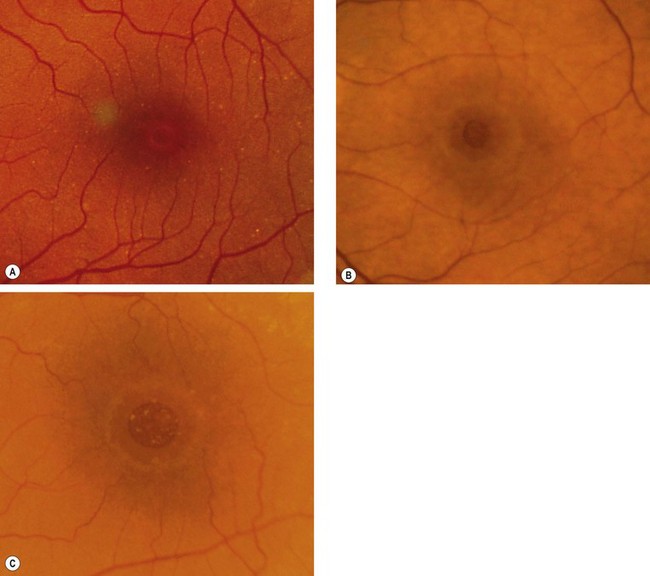
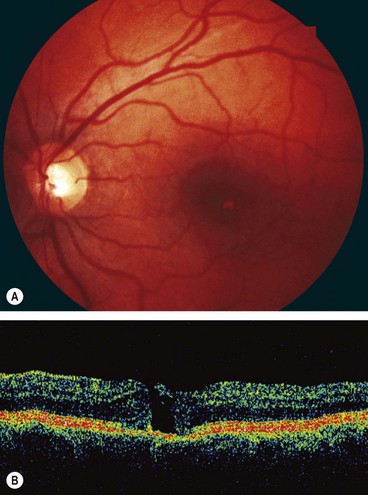
Fig. 14.53 Macular hole (A) Occult – stage 1b; (B) small full-thickness – stage 2; (C) full-sized – stage 3
(Courtesy of J Donald M Gass, from Stereoscopic Atlas of Macular Diseases, Mosby 1997 – fig. A; S Milenkov – fig. B)
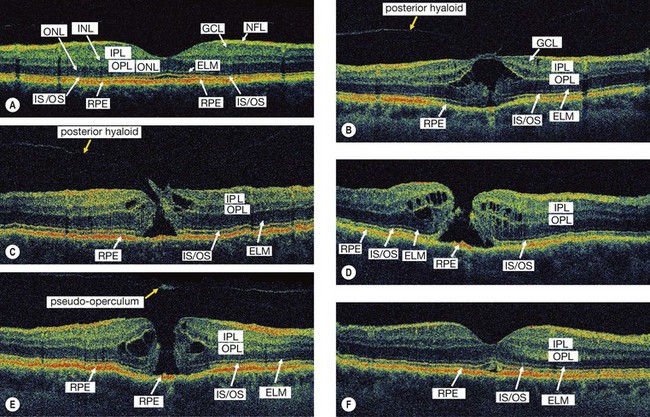
Fig. 14.54 High resolution OCT of macular hole. (A) Normal; (B) stage 1b shows attachment of the posterior hyaloid to the fovea, separation of a small portion of the sensory retina from the RPE in the foveolar region and intraretinal cystic changes; (C) eccentric stage 2 shows attachment of the vitreous to the lid of the hole and cystic changes; (D) stage 3 shows a full-thickness hole with intraretinal cystic spaces at its border; (E) stage 4 shows a full-thickness macular hole with intraretinal cystic spaces and an overlying pseudooperculum; (F) stage 4 after surgical closure
(Courtesy of J Fujimoto)
Investigations
Slit-lamp biomicroscopy alone is usually sufficient to make the diagnosis.
Surgery
About 50% of stage 1 holes resolve following spontaneous vitreofoveolar separation, so these are managed conservatively. About 10% of full-thickness holes also close spontaneously, with variable visual improvement.
Differential diagnosis of age-related macular hole
Macular microhole
Macular microhole is uncommon and may be easily overlooked without a careful history and examination. It is usually unilateral and has a favourable prognosis.
Central serous chorioretinopathy
Overview
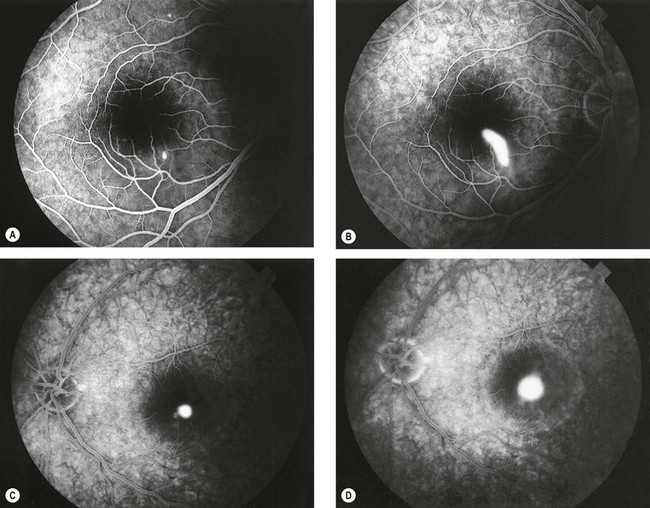
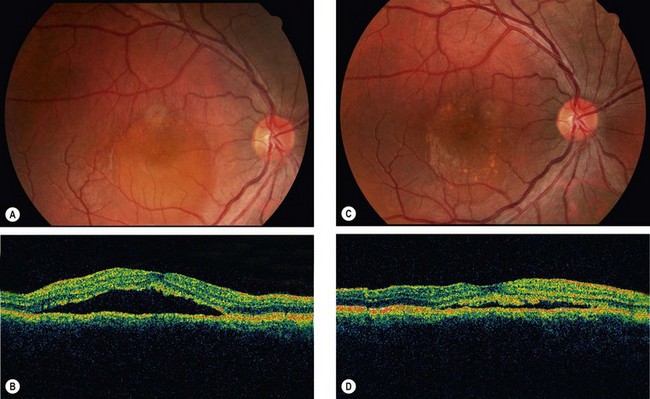
Central serous chorioretinopathy (CSCR) is an idiopathic disorder characterized by a localized serous detachment of the sensory retina at the macula secondary to leakage from the choriocapillaris through focal, or less commonly diffuse, hyperpermeable RPE defects. CSCR typically affects one eye of a young or middle-aged Caucasian man; women with CSCR tend to be older. Imperfectly defined additional risk factors include psychological stress, type A personality, steroid administration, Cushing syndrome, systemic lupus erythematosus and pregnancy.
Clinical features
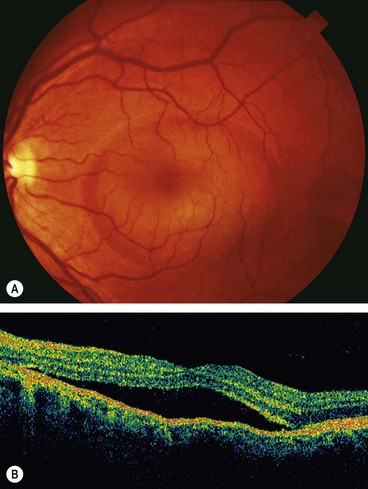
Investigations
Course
Management
Cystoid macular oedema
Pathogenesis
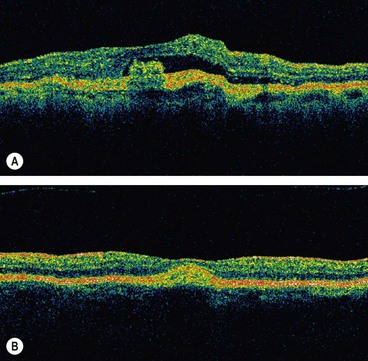
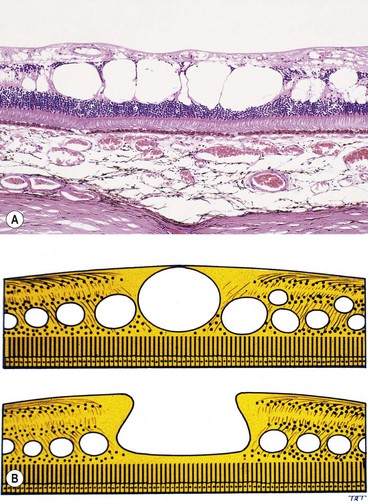
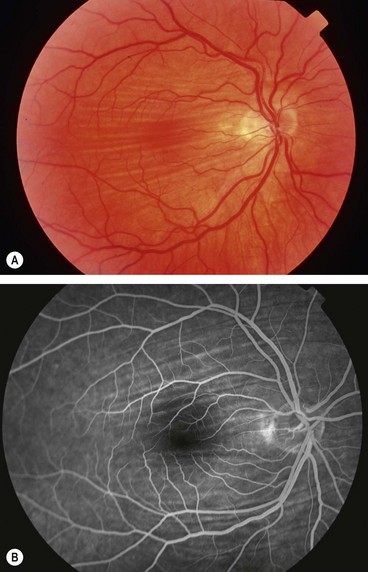
Cystoid macular oedema (CMO) results from the accumulation of fluid in the outer plexiform and inner nuclear layers of the retina with the formation of cyst-like changes (Fig 14.61A). Fluid may initially accumulate intracellularly in Müller cells, with subsequent rupture. In long-standing cases, smaller microcystic spaces coalesce into larger cavities and may progress to lamellar hole formation at the fovea (Fig. 14.61B) with irreversible impairment of central vision. CMO is a non-specific manifestation of any type of macular oedema.
Diagnosis
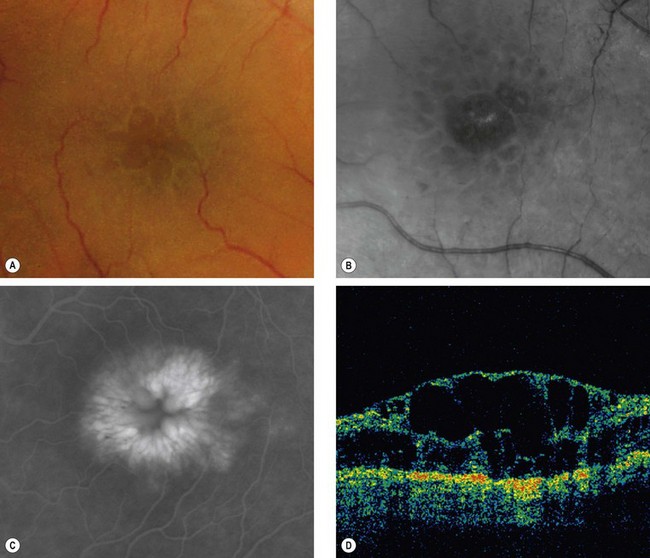
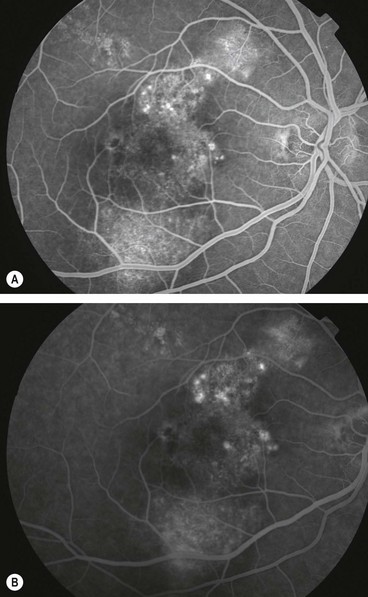
Fig. 14.62 (A) Cystoid macular oedema; (B) red-free image; (C) FA late phase shows a ‘flower-petal’ pattern of hyperfluorescence; (D) OCT shows hyporeflective spaces within the retina, macular thickening and loss of the foveal depression
(Courtesy of J Donald M Gass, from Stereoscopic Atlas of Macular Diseases, Mosby 1997 – fig. A; P Gili – fig. B; C Barry – fig. D)
Causes
Epimacular membrane
Pathogenesis
An epimacular membrane (EMM), also known as a macular epiretinal membrane, cellophane maculopathy and macular pucker, is a sheet-like fibrocellular structure which develops on or above the surface of the retina. Proliferation of the cellular component and contraction of the membrane leads to visual symptoms, primarily due to retinal wrinkling, obstruction and localized elevation with or without CMO.
Classification
Diagnosis
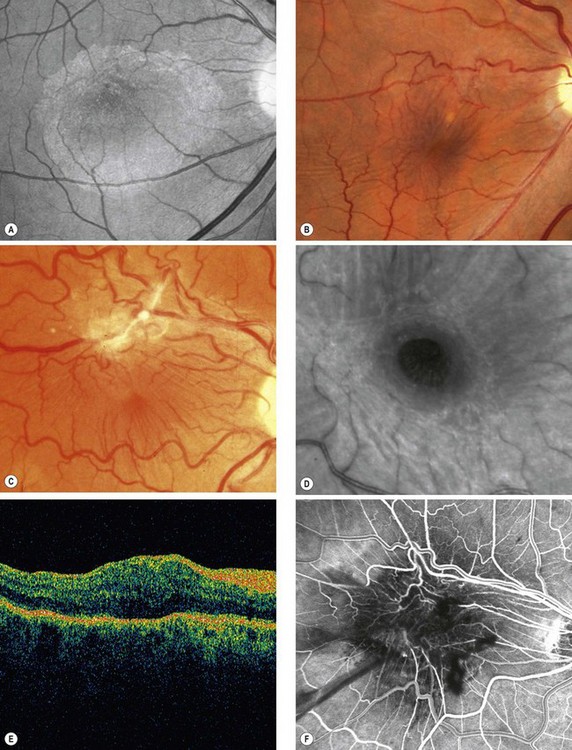
Fig. 14.63 Epimacular membrane. (A) Translucent membrane seen with red-free light; (B) more obvious membrane with mild vascular distortion; (C) advanced membrane; (D) macular pseudohole seen with red-free light; (E) OCT shows high reflectivity and retinal thickening; (F) FA early venous phase highlights the vascular tortuosity
(Courtesy of L Merin – fig. A; C Barry – figs B, E and F; P Gili – fig. D)
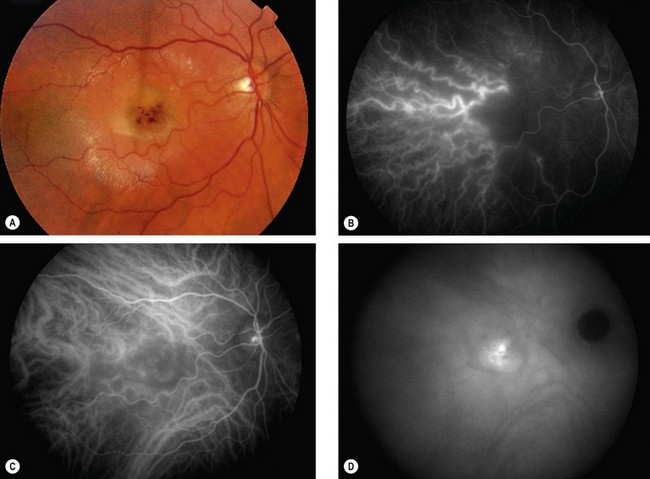
Degenerative myopia
Pathogenesis
Myopia is the result of complex hereditary and environmental factors. A refractive error of more than −6 dioptres constitutes high myopia, in which axial length is usually greater than 26 mm. ‘Pathological’ or degenerative myopia is characterized by progressive anteroposterior elongation of the scleral envelope associated with a range of secondary ocular changes, principally thought to relate to mechanical stretching of the involved tissues. It is a major cause of legal blindness, with maculopathy the most common cause of visual loss.
Diagnosis
Complications
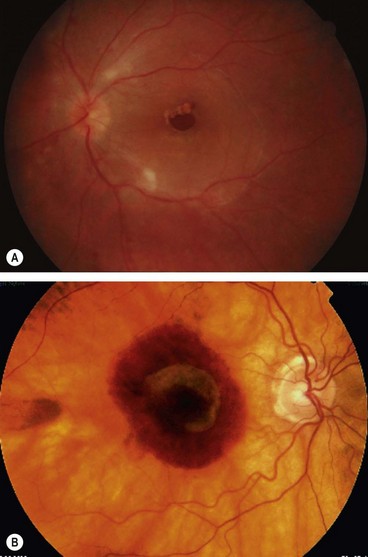
Fig. 14.65 (A) shallow retinal detachment confined to the posterior pole, caused by a macular hole; (B) subretinal haemorrhage associated with CNV
(Courtesy of M Khairallah – fig. A)
Table 14.4 Systemic associations of high myopia
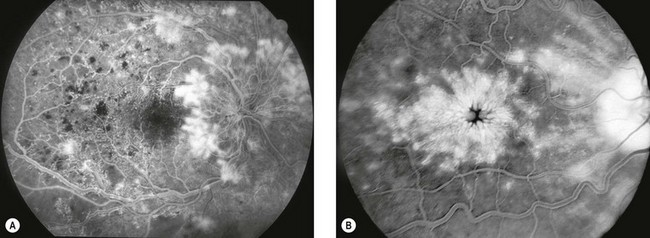
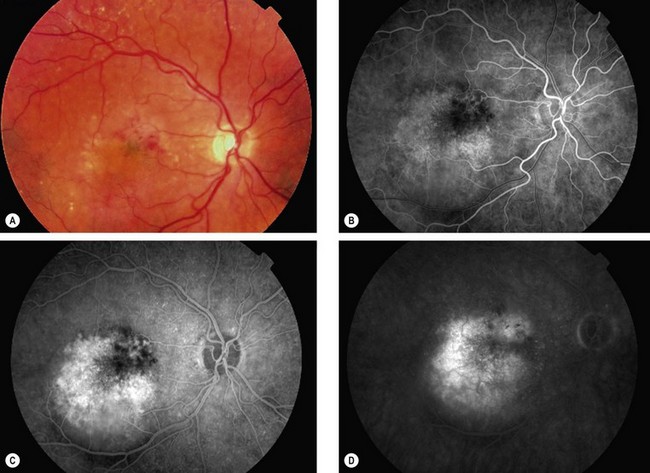
Angioid streaks
Ocular considerations
Histology
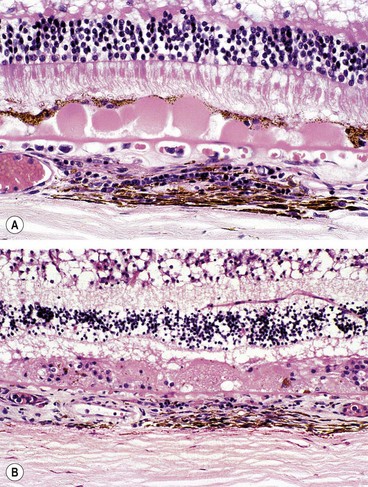
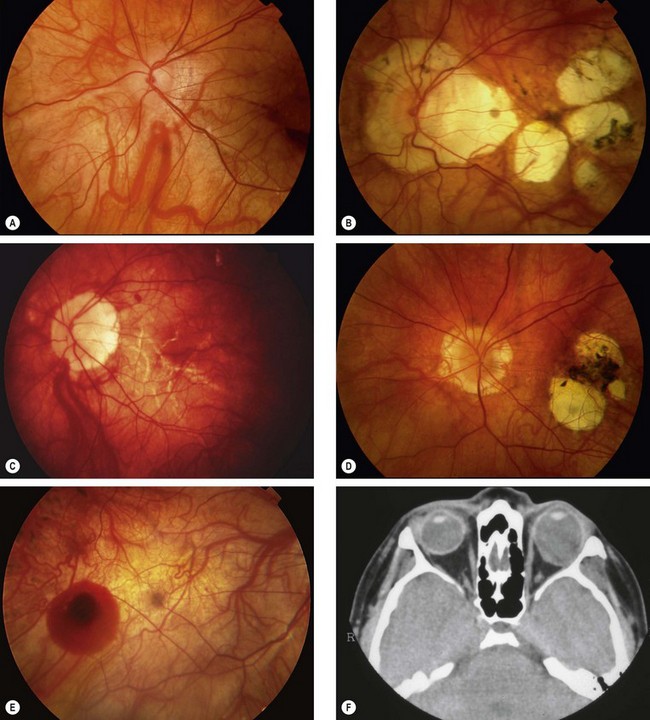
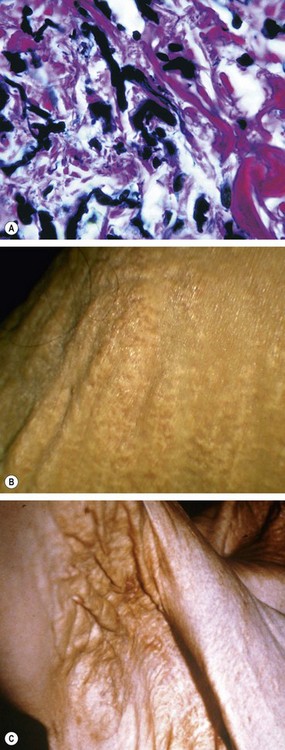
Angioid streaks are crack-like dehiscences in brittle thickened and calcified Bruch membrane, associated with atrophy of the overlying RPE (Fig. 14.66A).
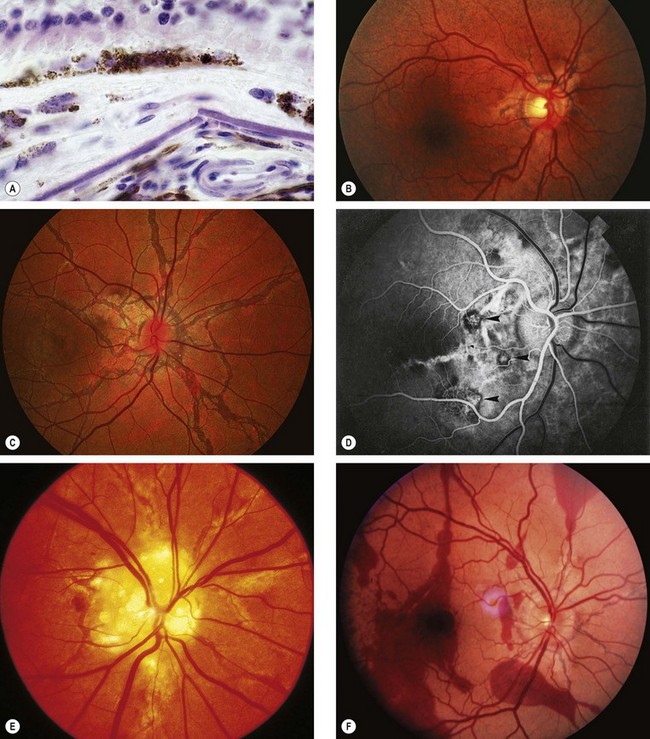
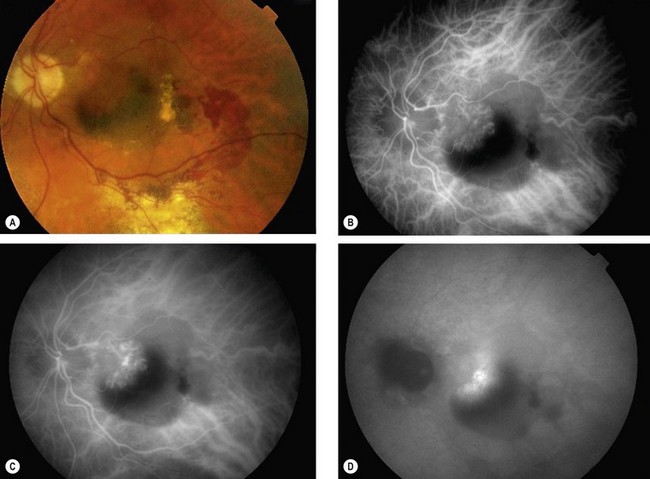
Fig. 14.66 Angioid streaks. (A) Histology shows a break in thickened Bruch membrane; (B) ‘peau d’orange’ and subtle angioid streaks; (C) advanced angioid streaks; (D) FA arteriovenous phase shows hypofluorescence of angioid streaks and three foci or CNV (arrows); (E) angioid streaks and optic disc drusen; (F) subretinal haemorrhage caused by a traumatic choroidal rupture
(Courtesy of J Harry and G Misson, from Clinical Ophthalmic Pathology, Butterworth-Heinemann 2001 – fig. A; P Saine – fig. C; S Milewski – fig. D)
Diagnosis
Complications
Though angioid streaks are typically asymptomatic at first, the prognosis is guarded because visual impairment occurs in over 70% of patients as a result of one or more of the following:
Systemic associations
Approximately 50% of patients with angioid streaks have one of the following conditions:
Pseudoxanthoma elasticum
Pseudoxanthoma elasticum (PXE) is by far the most common association of angioid streaks. Approximately 85% of patients develop ocular involvement, usually after the second decade of life. PXE is a hereditary disorder of connective tissue in which there is progressive calcification, fragmentation and degeneration of elastic fibres in the skin (Fig. 14.67A), eye and cardiovascular system. In almost all cases it is caused by homozygosity or compound heterozygosity for mutations of the ABCC6 gene, encoding for cellular transport protein; it is therefore an AR condition in which ocular manifestations are common but of variable severity. The signs are as follows.
Occasional associations
Choroidal folds
Pathogenesis
Choroidal folds are parallel grooves or striae involving the inner choroid, Bruch membrane, the RPE and sometimes the retina (chorioretinal folds). They are likely to develop in association with any process that induces sufficient compressive stress within the choroid, Bruch membrane, and retina. Primary mechanisms include choroidal congestion and scleral compression, and occasionally tissue contraction. Choroidal folds should be distinguished from retinal folds, which have a different pathogenesis (usually epimacular membrane).
Causes
Diagnosis
Hypotony maculopathy
Pathogenesis
Maculopathy is common in eyes developing hypotony, defined as IOP less than 5 mmHg. The most common cause is excessive drainage following glaucoma filtration surgery (higher risk with adjunctive antimetabolite), other causes including trauma (cyclodialysis cleft, penetrating injury), chronic uveitis (by directly impairing ciliary body function and by tractional ciliary body detachment due to cyclitic membrane), and retinal detachment. The development of secondary choroidal effusion may act to perpetuate the hypotony. With time the hypotonous process can itself lead to further damage, including sclerosis and atrophy of ciliary processes. Prolonged severe hypotony may lead to phthisis bulbi and loss of the eye. Treatment is aimed at restoring normal IOP.
Diagnosis
Vitreomacular traction syndrome
Idiopathic choroidal neovascularization
Idiopathic CNV is an uncommon condition which affects patients under the age of 50 years and is usually unilateral. The diagnosis is one of exclusion of other possible associations of CNV in younger patients such as angioid streaks, high myopia and chorioretinal inflammatory conditions such as presumed ocular histoplasmosis, MEWDS or PIC. The condition carries a better visual prognosis than that associated with AMD and in some cases spontaneous resolution may occur. The CNV lies predominantly above the RPE (type 2), often encircled by reactive RPE growth. PDT has met with variable results, but anti-VEGF agents show promise.