Clinical
Inflammation, Physical, and Functional Assessments
Nutrition and Inflammation
Nutrition assessment would be incomplete if the effects of inflammation on health status were not noted. Inflammation is a protective response by the immune system to infection, acute illness, trauma, toxins, many chronic diseases, and physical stress. Acute inflammation reactions are short term because of the involvement of negative feedback mechanisms (Calder et al., 2009). These acute inflammatory mediators have short half-lives and are quickly degraded.
Chronic inflammation begins as a short-term process, but is not extinguished. The body continues to synthesize inflammatory mediators, which alter normal physiological processes and affect innate immunity (Germolec, 2010). Loss of barrier function, responsiveness to a normally benign stimulus, infiltration of large numbers of inflammatory cells, overproduction of oxidants, cytokines, chemokines, eicosanoids, and matrix metalloproteinases all contribute to disease onset and progression (Calder et al., 2009). For example, insulin resistance in the setting of obesity results from a combination of altered functions of insulin target cells and the accumulation of macrophages that secrete proinflammatory mediators, which can promote the metabolic syndrome (Olefsky and Glass, 2010). The chronic inflammatory process also contributes to allergy, asthma, cancer, diabetes, autoimmune disease and some neurodegenerative disorders and infectious diseases.
Inflammatory conditions trigger the immune response to release eicosanoids and cytokines, which mobilize nutrients required to synthesize positive acute-phase proteins and white blood cells. Cytokines (interleukin 1β [IL-1β], tumor necrosis factor alpha [TFN-α], interleukin-6 [IL-6]) and eicosanoids (prostaglandin E2 [PGE2]) influence whole-body metabolism, body composition, and nutritional status. Cytokines reorient hepatic synthesis of plasma proteins and increase the breakdown of muscle protein to meet the demand for protein and energy during the inflammatory response. Moreover, there is a redistribution of albumin to the interstitial compartment, resulting in edema. Declining values of negative acute-phase proteins, serum albumin, prealbumin, and transferrin reflect inflammatory processes and severity of tissue injury. These laboratory values do not reflect current dietary intake or protein status (Dennis, 2008; Devakonda, 2008; Ramel, 2008). Improvements in albumin, prealbumin, and transferrin most likely reflect a change in hydration status rather than increased protein and energy intake. Table 6-1 lists acute phase reactants related to the inflammatory process.
TABLE 6-1
| Positive Acute-Phase Reactants | Negative Acute-Phase Proteins |
| C-reactive protein | Albumin |
| a-1 antichymotrypsin | Transferrin |
| a1-antitrypsin | Prealbumin (transthyretin) |
| Haptoglobins | Retinol-binding protein |
| Ceruloplasmin | |
| Serum amyloid A | |
| Fibrinogen | |
| Ferritin | |
| Complement and components C3 and C4 | |
| Orosomucoid |
Cytokines impair the production of erythrocytes and reorient iron stores from hemoglobin and serum iron to ferritin. During infection IL-1β inhibits the production and release of transferrin while stimulating the synthesis of ferritin. Therefore laboratory test results used to predict the risk of nutritional anemias are not useful in assessing the patient with an inflammatory response. The effects of cytokines on organ systems are noted in Table 6-2.
TABLE 6-2
Cytokine Actions and Nutritional Consequences
| Organ System | Cytokine-Modulated Behavior | Nutritional Consequences |
| Brain | Sickness syndrome, including fatigue, apathy, cognitive dysfunction, anorexia, sleepiness | ↓ food intake weight loss |
| Endocrine | Euthyroid sick syndrome, anorexia, ↑ in metabolic rate | ↓ food intake muscle wasting |
| Liver | ↑ synthesis of positive acute phase proteins, ↓ synthesis of negative acute phase proteins, ↑ fatty acid synthesis, ↑ lipolysis, ↓ LPL | ↑ edema hypertriglyceridemia |
| Muscles | ↑ insulin resistance | Hyperglycemia |
| Blood | ↓ product RBC, redistribution of albumin, prealbumin, and iron | anemia ↑ edema |
| GI Tract | ↓ gastric secretion, ↓ GI motility, ↓emptying time, ↑ protein degradation | ↓ food intake weight loss ↓ protein reserves |
GI, Gastrointestinal; LPL, lipoprotein lipase, RBC, red blood cell.
Litchford MD: Inflammatory biomarkers and metabolic meltdown, Greensboro, NC, 2009, Case Software and Books.
As the body responds to acute inflammation, TFN-α, IL-1β, IL-6, and PGE2 increase to a set threshold, then IL-6 and PGE2 inhibit TFN-α synthesis and IL-1β secretion, creating a negative feedback cycle. Hepatic synthesis of positive acute-phase proteins diminishes and synthesis of negative acute-phase proteins increases. Albumin shifts from interstitial compartment to the extravascular space. Iron stores shift from ferritin to transferrin and hemoglobin (Northrop-Clewes, 2008).
Inappropriate synthesis of inflammatory mediators can be triggered by an injury, reactive oxygen species, or abnormal levels of a body component such as glucose or visceral adipose tissue. Treatment with ω-3 fatty acids is associated with reductions in TNF-α and IL-1β in healthy subjects and reduction in TNF-α in subjects with diabetes (Riediger et al., 2009). Yet overall reduction in inflammatory biomarkers through increased consumption of fruits, vegetables, or nutrient supplements has generated mixed results (Bazzano et al., 2006; Ridker, 2008). More research is needed to identify how various dietary components modulate the predisposition to chronic inflammatory conditions (Calder et al., 2009).
Chronic inflammation is present in Crohn disease, rheumatoid arthritis, cardiovascular disease, diabetes, and obesity (Hye, 2005). Factors that have an important role in disease management decrease inflammatory mediator production through effects on cell signaling and gene expression (ω-3 fatty acids, vitamin E, plant flavonoids), reduce the production of damaging oxidants (vitamin E and other antioxidants), and promote gut barrier function and anti-inflammatory responses (prebiotics and probiotics) (Calder et al., 2009).
Inflammation and Immune Regulation
B cells help to regulate cellular immune responses and inflammation. There are phenotypically diverse B-cell subsets with regulatory functions related to inflammation and autoimmunity (Dililo et al., 2010). Total lymphocyte count (TLC) is an indicator of immune function reflective of B and T cells (see Chapter 27). Skin testing, or delayed cutaneous hypersensitivity (DH) reactivity, measures cell-mediated immunity. DH and TLC are affected by inflammatory metabolism, chemotherapy, and steroids, and thus are most useful in cases of uncomplicated nutrition depletion.
DH involves the intradermal injection of small amounts of antigen (tuberculin, Candida organisms, mumps, or trichophytin) just under the skin to determine the person’s reaction. A healthy person reacts with induration, indicating that exposure has probably taken place and that immunocompetence is intact. Because electrolyte imbalance, infection, cancer and its treatments, liver disease, renal failure, trauma, and immunosuppression can alter results, DH is not always used for the nutrition assessment of hospitalized patients (Russell and Mueller, 2007). Therapeutic approaches that alter the innate immune system response to inflammatory and microbial insults are exciting areas of study in both nutrition science and medical practice. See Chapter 8 for more details on biochemical assessment.
Physical and Functional Assessments
Anthropometry involves obtaining physical measurements of an individual, then relating them to standards that reflect the growth and development of that individual. These physical measurements are another component of the nutrition assessment that are useful for evaluating overnutrition or undernutrition. They can also be used to monitor the effects of nutrition interventions. Individuals conducting these measurements should be trained in the proper technique; if more than one professional is conducting these measurements, measures of accuracy between them should be established. Measurements of accuracy can be established by several clinicians taking the same measurement and comparing results. Anthropometric data are most valuable when they reflect accurate measurements recorded over time. Valuable measurements are height, weight, skinfold thicknesses, and girth measurements. Head circumference and length are used in pediatric populations. Birth weight and ethnic, familial, and environmental factors affect these parameters and should be considered when anthropometric measures are evaluated.
Interpretation of Height and Weight
Currently, reference standards are based on a statistical sample of the U.S. population. Therefore an individual measurement shows how a person’s measurement compares with that of the total population. Height and weight measurements of children are evaluated against various norms. They are recorded as percentiles, which reflect the percentage of the total population of children of the same sex who are at or below the same height or weight at a certain age. Children’s growth at every age can be monitored by mapping data on growth curves, known as height-for-age, length-for-age, weight-for-age, and weight-for-length curves. Appendixes 9 through 16 provide pediatric growth charts and percentile interpretations. Height and weight are also useful for evaluating nutrition status in adults. Both should be measured because the tendency is to overestimate height and underestimate weight, resulting in an underestimation of the relative weight or body mass index (BMI). In addition, many adults are shrinking as a result of osteoporosis, joint deterioration, and poor posture, and this should be noted (Box 6-1).
Length and Height
Height measurements are valuable when used in conjunction with other assessment measurements. Various methods may be used to measure length and height. Measurements of height can be obtained using a direct or an indirect approach. The direct method involves a measuring rod, or statiometer, and the person must be able to stand or recline flat. Indirect methods, including knee-height measurements, arm span, or recumbent length using a tape measure, may be options for those who cannot stand or stand straight such as individuals with scoliosis, kyphosis (curvature of the spine), cerebral palsy, muscular dystrophy, contractures, paralysis, or who are bedridden (see Appendix 20). Recumbent height measurements made with a tape measure while the person is in bed may be appropriate for individuals in institutions who are comatose, critically ill, or unable to be moved. However, this method can only be used with patients who do not have musculoskeletal deformities or contractures.
Sitting heights are used for children who cannot stand (see Chapter 45). Recumbent length measurements are used for infants and children younger than 2 or 3 years of age. Ideally these young children should be measured using a length board as shown in Figure 6-1. Recumbent lengths in children ages 2 and younger should be recorded on the birth to 24-month growth grids, whereas standing heights of children ages 2 to 3 years should be recorded on the 2- to 20-year growth grids, as in Appendixes 9 through 16. Recording on the proper growth grids provides a record of a child’s gain in height over time and compares the child’s height with that of other children of the same age. The rate of length or height gain reflects long-term nutritional adequacy.
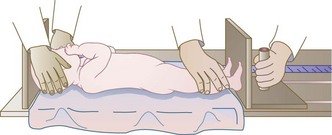
FIGURE 6-1 Measurement of the length of an infant. Crown-to-heel length of children 3 years and younger should be measured as follows: (1) Lay the child on a ruled board that has an attached piece of wood at one end and a movable piece at the other. (2) Stretch the child out on the board for the most accurate measurement. (3) Place the movable end flat against the bottom of the child’s foot and read the length from the side of the board.
Weight
Weight is another measure that is important to obtain. In children it is a more sensitive measure of nutritional adequacy than height because it reflects recent nutritional intake. Weight also provides a rough estimate of overall fat and muscle stores. For those who are obese or have edema, weight alone makes it difficult to assess overall nutritional status. Body weight is obtained and interpreted using various methods, including BMI, usual weight, and actual weight. Ideal weight for height reference standards such as the Metropolitan Life Insurance Tables from 1959 and 1983 or the National Health and Nutrition Examination Survey percentiles are no longer used. A commonly used method of determining ideal body weight is the Hamwi Equation (Hamwi, 1964). It does not adjust for age, race, or frame size and its validity is questionable. Nonetheless, it is in widespread use by clinicians as a quick method of estimation:


Actual body weight is the weight measurement obtained at the time of examination. This measurement may be influenced by changes in the individual’s fluid status. Weight loss can reflect dehydration but can also reflect an immediate inability to meet nutrition requirements; this may indicate nutritional risk. The percentage of weight loss is highly indicative of the extent and severity of an individual’s illness. The Blackburn formula (1977) is useful for determining the percentage of recent weight loss:


Another method for evaluating the percentage of weight loss is to calculate an individual’s current weight as a percentage of usual weight. Usual body weight (UBW) is a more useful parameter than ideal body weight for those who are ill. Comparing present weight to the UBW allows weight changes to be assessed. However, one problem with using UBW is that it may depend on the patient’s memory.
Body Mass Index
Another method to determine whether an adult’s weight is appropriate for height is the Quetelet index (W/H2) or the body mass index (BMI) (Lee and Nieman, 2003). The BMI calculation requires weight and height measurements and can indicate overnutrition or undernutrition. BMI accounts for differences in body composition by defining the level of adiposity and relating it to height, thus eliminating dependence on frame size (Stensland and Margolis, 1990). The BMI has the least correlation with body height and the highest correlation with independent measures of body fat for adults. The BMI does not measure body fat directly, but correlates with the direct body fat measures such as underwater weighing and dual x-ray absorptiometry (Keys et al., 1972; Mei et al., 2002). BMI is calculated as follows:


Nomograms are also available to calculate BMI, as are various charts (see Appendix 23). Clinical Insight: Calculating BMI and Determining Appropriate Body Weight gives an example of the BMI calculation for a woman.
 Clinical Insight
Calculating BMI and Determining Appropriate Body Weight
Formula (English) Weight (lb) ÷ (Height [in] × Height [in]) × 703 = BMI
Standards classify a BMI for an adult at less than 18.5 as underweight, a BMI between 25 and 29 as overweight, and a BMI greater than 30 as obese. A healthy BMI for adults is considered between 18.5 and 24.9 (CDC, 2009). Although a strong correlation exists between total body fat and BMI, individual variations need to be recognized before making conclusions (Russell and Mueller, 2007).
Differences in race, sex, and age must be considered when evaluating the BMI (Yajnik and Yudkin, 2004). BMI values tend to increase with age (Vaccarino and Krumholz, 2001). Although studies report an association between really high and low BMIs and mortality, the data suggest that a higher BMI range is protective in older adults (see Chapter 21). The standards for ideal weight (BMI of 18.5 to 25) may be too restrictive in the elderly. Therefore careful interpretation of risk factors must be part of the total assessment.
The method of calculation of BMI in children and teens is the same as that for adults, but the interpretation is different. Appendixes 11 and 15 allow for the plotting of the BMI on a growth grid used with children ages 2 to 20 years. Appendixes 12 and 16 provide sample grids for recording BMI measurements and changes for children and adolescents over time. For example, a BMI of only 17 is very appropriate for a 10-year-old girl (see Appendix 19), but would be a concern in an older adult.
Body Composition
Body composition is used along with other assessment factors to provide an accurate description of one’s overall health. Differences in skeletal size and the proportion of lean body mass can contribute to body weight variations among individuals of similar height. For example, muscular athletes may be classified as overweight because their excess muscle mass, not their adipose mass, increases their weight. Older adults tend to have lower bone density and reduced lean body mass and therefore may weigh less than younger adults of the same height. Variation in body composition exists among different population groups as well as within the same group (Deurenberg and Deurenberg-Yap, 2003). The majority of body composition studies that were performed on whites may not be valid for other ethnic groups. There are differences and similarities between blacks and whites relative to fat-free body mass, fat patterning, and body dimensions and proportions; blacks have greater bone mineral density and body protein as compared with whites (Wagner and Heyward, 2000). In addition, BMIs for Asian populations need to be in the lower ranges for optimal health to reflect their higher cardiovascular risks (Zheng et al., 2009). These factors must be considered to avoid inaccurate estimation of body fat and interpretation of risk.
Indirect methods for measuring body composition include triceps skin fold, midarm muscle circumference, and midarm circumference (MAC) (Russell and Mueller, 2007). The health professional must realize that these measures are useful in the assessment of individuals over time but not in critical- and acute-care settings; changes in body fluid and composition may skew the results. When conducting body composition measurements, strict adherence to established protocols must be followed to yield accurate results. For example, most North American investigators use the right side of the body to take skinfold measurements, and the standards are based on this. The methods used to gather meaningful data should be considered carefully.
Subcutaneous Fat in Skinfold Thickness
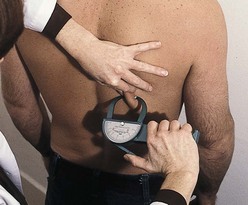
The fat-fold or skinfold thickness measurement is a means of assessing the amount of body fat in an individual. It is practical in clinical settings, although its validity depends on the accuracy of the measuring technique (see Box 6-2) and repetition of measurements over time. If changes are going to occur, they take 3 to 4 weeks to develop. Skinfold measurement assumes that 50% of body fat is subcutaneous (Figure 6-2).
BOX 6-2
Skinfold Measurement Techniques
1. Take measurement on the right side of the body.
2. Mark the site to be measured and use a flexible, nonstretchable tape.
3. The tape measure can be used to locate the midpoints on the body.
4. Firmly grasp the skinfold with the thumb and index finger of the left hand approximately 1 cm or  inch proximal to the skinfold site, pulling it away from the body.
5. Hold the caliper in the right hand, perpendicular to the long axis of the skin fold and with the caliper’s dial face up. Place the caliper tip on the site and approximately 1 cm or  inch distal to the fingers holding the skinfold. (Pressure from the fingers does not affect the measurement.)
6. Do not place the caliper too deeply into the skinfold or too close to the tip of the skinfold.
7. Read the caliper approximately 4 seconds after pressure from the measurer’s hand has been released from the lever. Exerting force longer than 4 seconds results in smaller readings because fluids are forced from the compressed tissue. Measurements should be recorded to the nearest 1 mm.
8. Take a minimum of two measurements at each site to verify results. Wait 15 seconds between measurements to allow the skinfold site to return to normal. Maintain pressure with thumb and index finger during measurements.
9. Do not take measurements immediately after the person has exercised or if the person is overheated because the shift in body fluid makes the result larger.
10. When measuring obese clients, it may be necessary to use both hands to pull the skin away while a second person makes the measurement. If the calipers do not fit, another technique may be required.
Data from Lee RD, Nieman DC: Nutritional assessment, ed 3, New York, 2003, McGraw-Hill.
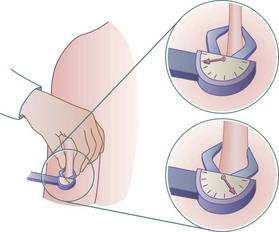
FIGURE 6-2 Skinfold calipers measuring the thickness of subcutaneous fat (in millimeters), giving a rough measurement of adiposity. Measurements are read counterclockwise. (Courtesy Dorice Czajka-Narins, PhD.)
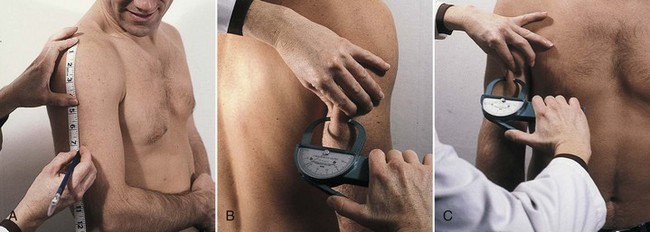
Accuracy decreases with increasing obesity. The skinfold sites identified as most reflective of body fatness are over the triceps and the biceps, below the scapula, above the iliac crest (suprailiac), and on the upper thigh. The triceps skinfold (TSF) and subscapular measurements are the most useful because the most complete standards and methods of evaluation are available for these sites (Figures 6-3 and 6-4; see Appendixes 24-26). Figure 6-5 shows the measurement of the suprailiac crest skinfold.
Circumference Measurements
If more complete information on actual body composition is needed, additional measurements can be obtained. For example, in the acute-care setting where the patient experiences more acute pathophysiologic changes such as daily fluid shifts, measures of arm circumference and TSF measurements are not usually performed. But in the long-term care setting, sports clinic, or home environment, these measurements can be tracked over time (e.g., monthly or quarterly) to provide valuable information on overall nutrition status.
Because fat distribution is an indicator of risk, circumferential or girth measurements may be used. The presence of excess body fat around the abdomen out of proportion to total body fat is a risk factor for chronic diseases associated with obesity and the metabolic syndrome. Waist-to-hip circumference ratio (WHR) is used to detect possible signs of excess fat deposition (lipodystrophy) in those infected with HIV. It also detects cardiovascular risk somewhat better than BMI (Elsayed et al., 2008). A ratio of 0.8 or above indicates risk in a woman, and 1 or more indicates risk in a man.
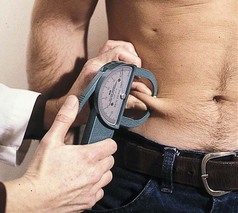
Waist circumference is obtained by measuring the distance around the smallest area below the rib cage and above the umbilicus with the use of a nonstretchable tape measure. A measurement of greater than 40 inches (102 cm) for men and greater than 35 inches (88 cm) for women is an independent risk factor for disease (CDC, 2009). These measurements may not be as useful for those less than 60 inches tall or with a BMI of 35 or above (CDC, 2009). Figure 6-6 shows the proper location to measure waist (abdominal) circumference.
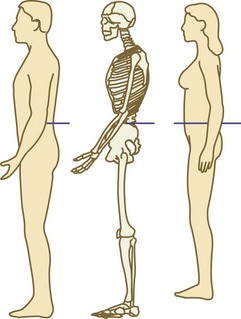
FIGURE 6-6 Measuring tape position for waist (abdominal) circumference measurement. (From www.nhlbi.nih.gov/guidelines/obesity/e_txtbk/txgd/4142.htm.)
Midarm circumference (MAC) is measured in centimeters halfway between the acromion process of the scapula and the olecranon process at the tip of the elbow (see Figure 6-4, A). Combining MAC with TSF measurements allows indirect determination of the arm muscle area (AMA) and arm fat area (see Appendixes 25 and 26). Bone-free AMA is calculated by using the formula shown in Figure 6-7. For men, a factor of 10 is subtracted from the AMA, whereas for women a factor of 6.5 is subtracted (Frisancho, 1984). The bone-free muscle area (AMA) is a good indication of lean body mass and skeletal protein reserves. The AMA is important in growing children and in evaluating possible protein-energy malnutrition as a result of chronic illness, stress, eating disorders, multiple surgeries, or an inadequate diet.
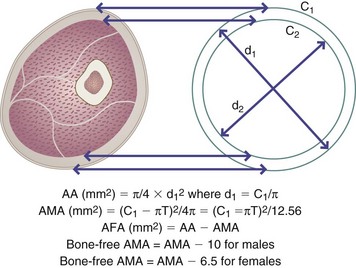
FIGURE 6-7 Upper arm area (AA), upper arm muscle area (AMA), and upper arm fat area (AFA) are derived from measurements of upper arm circumference in centimeters (C1) and triceps skinfold (T) in millimeters.
Head circumference measurements are useful in children younger than 3 years of age, primarily as an indicator of nonnutritional abnormalities. Undernutrition must be very severe to affect head circumference; see Box 6-3, Measuring Head Circumference.
BOX 6-3
Measuring Head Circumference
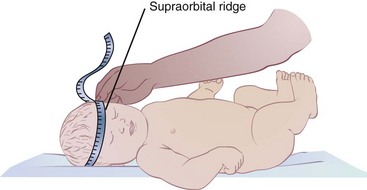
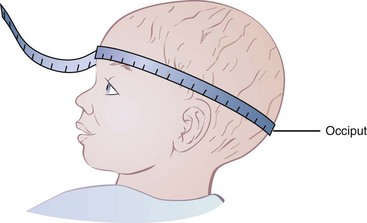
Head circumference is a standard measurement for serial assessment of growth in children from birth to 36 months and in any child whose head size is in question.
1. The head is measured at its greatest circumference.
2. The greatest circumference is usually above the eyebrows and pinna of the ears and around the occipital prominence at the back of the skull.
3. More than one measurement may be necessary because the shape of the head can affect the location of the maximum circumference.
4. Compare the measurement with the National Center for Health Statistics standard curves for head circumference (see Appendixes 10 and 14).
Data from Hockenberry MJ, Wilson D: Wong’s nursing care of infants and children, ed 8, St Louis, 2007, Mosby.
Other Methods of Measuring Body Composition
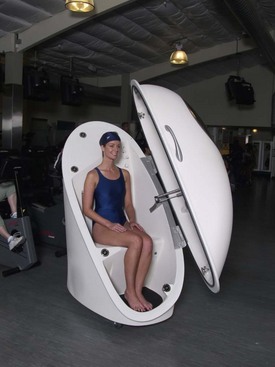
Air Displacement Plethysmogram: Air displacement plethysmogram (ADP) relies on measurements of body density to estimate body fat and fat-free masses. Performing an ADP with the BOD-POD device is a densitometry technique found to be an accurate method to measure body composition. ADP appears to be a reliable instrument in body composition assessment; it is of particular interest in the pediatric and obese individual. ADP does not rely on body water content to determine body density and body composition, which makes it potentially useful in those adults with end-stage renal disease (Flakoll et al., 2004). However, further research is needed in understanding possible sources of measurement error (Fields et al., 2005). The use of a BOD-POD is usually based on budget, the patient population, and the experience of the clinician (Figure 6-8).
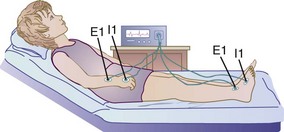
Bioelectrical Impedance Analysis: Bioelectrical impedance analysis (BIA) is a body composition analysis technique based on the principle that, relative to water, lean tissue has a higher electrical conductivity and lower impedance than fatty tissue because of its electrolyte content. BIA has been found to be a reliable measurement of body composition (fat-free mass and fat mass) when compared with BMI or skinfold measurements or even height and weight measurements. BIA involves attaching electrodes to the right hand, wrist, ankle, and foot of a patient and passing a small electrical current through the body (Figure 6-9). The BIA method is popular because it is safe, noninvasive, portable, and rapid. For accurate results the patient should be well hydrated; have not exercised in the previous 4 to 6 hours; and have not consumed alcohol, caffeine, or diuretics in the previous 24 hours. If the person is dehydrated, a higher percentage of body fat than really exists is measured. Fever, electrolyte imbalance, and extreme obesity may also affect the reliability of measurements.
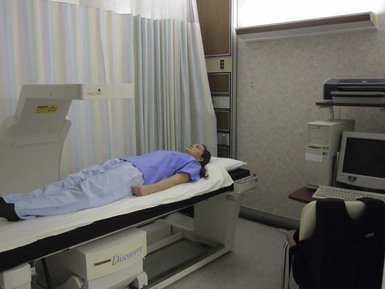
Dual-Energy X-Ray Absorptiometry: Dual-energy x-ray absorptiometry (DEXA) assesses bone mineral density and can be used for measuring fat and boneless lean tissue. The energy source in DEXA is an x-ray tube that contains an energy beam. The amount of energy loss depends on the type of tissue through which the beam passes; the result can be used to measure mineral, fat, and lean tissue compartments (Russell and Mueller, 2007). DEXA is easy to use, emits low levels of radiation, and is relatively available in the hospital setting, making it a useful tool. However, the patient must remain still for more than a few minutes, which may be difficult for older adults and those in chronic pain. Differences in hydration status and the presence of bone or calcified soft tissue can result in inaccurate measurements (Lee and Nieman, 2003). Figure 6-10 illustrates a DEXA scan.
Neutron Activation Analysis: Neutron activation analysis allows measurement of lean body mass. This analysis also distinguishes between intracellular and extracellular components of the body by creating unstable isotopes of calcium, nitrogen, and sodium, and then measuring gamma radiation from the same isotopes (Russell and Mueller, 2007). This type of measurement is expensive and impractical in a daily clinical setting.
Total Body Potassium: Total body potassium can be used to study body composition because more than 90% of the body’s potassium is found in fat-free tissues. Measurements are made with a special counter that is fitted with multiple gamma-ray detectors interfaced with a computer that is expensive and not always readily available. Not all researchers agree on the exact concentration of potassium in fat-free tissue and the differences between sexes, during the aging process, and in obese individuals.
Underwater Weighing: Underwater weighing is a direct measure of determining whole-body density. Densitometry includes underwater (hydrostatic) weighing based on Archimedes’ principle: the volume of an object submerged in water equals the volume of water the object displaces. Once the volume and mass are known, the density can be calculated. Although this method is considered the gold standard it is not always practical, involves significant training to perform, and requires considerable cooperation on the part of those being measured. Subjects must be submerged under water and remain motionless long enough for the measurements to be made (Lee and Nieman, 2003).
Ultrasound and Magnetic Resonance Imaging: Magnetic resonance imaging (MRI) can be used to measure the size of visceral organs, the size of the skeleton, and the amount and distribution of intraabdominal fat. MRI has several advantages, two of which are that it is noninvasive and involves no ionizing radiation, which makes it safe for children, females of childbearing age, and multiple studies on the same individual. The disadvantages of MRI include expense and limited availability (Russell and Mueller, 2007).
The Nutrition-Focused Physical Examination
The nutrition-focused physical examination is an important component of overall assessment because some nutritional deficiencies may not be identified by other approaches. Some signs of nutritional deficiency are not specific and must be distinguished from those with nonnutritional causal factors.
Approach
A systems approach is used when performing the examination, which should be conducted in an organized, logical way that progresses from head to toe to ensure efficiency and thoroughness. The examination moves from a global to a more defined or focused examination based on the results of the medical and nutrition histories. The nutrition-focused physical examination is tailored for each patient. In short, every body system may not have to be assessed; clinical judgment guides this decision according to the problems, history, and current complaints of the individual (Hammond, 2006).
Equipment
The extent of the nutrition-focused physical examination dictates the necessary equipment. Any or all of the following may be used: a stethoscope, a penlight or flashlight, a tongue depressor, scales, a reflex hammer, calipers, a tape measure, a blood pressure cuff, and an ophthalmoscope.
Examination Techniques and Findings
Four basic physical examination techniques are used during the nutrition-focused physical examination. These techniques include inspection, palpation, percussion, and auscultation (Table 6-3). Appendix 29 discusses the nutrition-focused physical examination in more detail.
TABLE 6-3
Physical Examination Techniques
| Technique | Description |
| Inspection | General observation that progresses to a more focused observation using the senses of sight, smell, and hearing; most frequently used technique |
| Palpation | Tactile examination to feel pulsations and vibrations; assessment of body structures, including texture, size, temperature, tenderness, and mobility |
| Percussion | Assessment of sounds to determine body organ borders, shape, and position; not always used in a nutrition-focused physical examination |
| Auscultation | Use of the naked ear or a stethoscope to listen to body sounds (e.g., heart and lung sounds, bowel sounds, blood vessels) |
From Hammond K: Nutrition focused physical assessment, Support Line 18(4):4, 1996.
Some nutritional findings from the physical examination that should alert the clinician to the need for further assessment and intervention include temporal wasting, proximal muscle weakness, depleted muscle bulk, dehydration, overhydration, poor wound healing, and chewing or swallowing difficulties. The appearance of the skin should be evaluated for any pallor, scaly dermatitis, wounds, quality of wound healing, bruising, and hydration status. Membranes such as in the conjunctiva or pharynx should be examined for integrity, hydration, pallor, and bleeding. Special attention should be given to the areas where signs of nutritional deficiencies appear most often, such as the skin, hair, teeth, gums, lips, tongue, and eyes. The hair, skin, and mouth are susceptible because of the rapid cell turnover of epithelial tissue. Symptoms of nutrient deficiencies may or may not be apparent during the physical examination, or may result from a lack of several nutrients or from nonnutritional causes.
Other Assessment Measures and Tools
Biochemical tests are the most objective and sensitive measures of nutrition status. Not all of them are purely related to nutrition. Caution must be used when interpreting results because they can be affected by disease state and therapies; see Chapter 8.
Functional Nutrition Assessment
Functional medicine is an evolving, evidence-based discipline that treats the body with its mutually interactive systems as a whole, rather than as a set of isolated signs and symptoms. The Institute of Functional Medicine (IFM) promotes an evaluation process that recognizes the biochemical, genetic, and environmental individuality of each person. The focus is patient-centered, not just disease-centered. Lifestyle and health-promoting factors include nutrition, exercise, adequate sleep, healthy relationships, and a positive mind-body-belief system. Assessment in the functional medicine mode identifies the following factors: pattern recognition, under- and overnutrition, reduction of toxin exposures, and antecedents or events in a person’s history that may act as triggers for a response beginning a disease process. IFM has established an interdisciplinary Functional Medicine Matrix Model to guide this holistic assessment process (Figure 6-11).
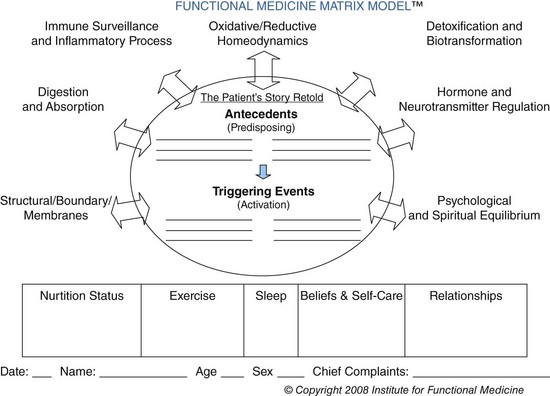
FIGURE 6-11 The Functional Medicine Matrix for assessment. (Courtesy Institute of Functional Medicine, 2010.)
For dietitians, the Functional Nutrition Assessment (FNA) expands traditional assessment by adding cellular, molecular, and genomic data to the process. This expanded determination of nutrition status quantifies the tissue nutrient reserves, cellular function, and genetic potential influenced by the interaction of diet, environment and lifestyle. See New Directions: Functional Nutrition Assessment.
 New Directions
Functional Nutrition Assessment
The expense of dealing with the global epidemic of chronic disease is forcing national health care systems to refocus on early diagnosis and treatment of these conditions. It is becoming critical for practitioners to understand the prominent role played by diet and lifestyle factors, as well as the interaction between genes and environmental factors. Following the recent recognition of the role of long-latency nutritional insufficiencies, there is also a growing appreciation for the understanding of the molecular mechanisms that underlie chronic disease. These considerations are an important part of the Functional Nutrition Assessment (FNA) approach.
This assessment technique is uniquely suited to the identification of the root causes of chronic disease by integrating traditional dietetic practice with nutritional genomics, the restoration of gastrointestinal function, the quelling of chronic inflammation, and the interpretation of nutritional biomarkers of cellular and molecular dysfunction. The Functional Nutrition Practitioner organizes the data collected from ingestion, digestion and utilization (IDU) factors, leading to identification of the root causes for each individual. Some factors related to chronic disease risk that are examined in the FNA include:
Utilization—Cellular and Molecular Functional Relationships
Antioxidants—water-soluble vitamin C, phytonutrients
Methylation and acetylation—dependence on adequate B complex and minerals
Oils and fatty acids—prostaglandin balance, cell membrane function, vitamin E function
Protein metabolism—connective tissue, enzymes, immune function, etc.
Vitamin D—in concert with functional metabolic partner nutrients vitamins A and K
The ability to assess a person’s nutrition status has benefited from recent, rapid advances in the science of nutrition, genomics and measurement technologies. A more thorough evaluation of cellular function is possible today. The identification of the human genome and the understanding of epigenetic effects of environment on gene expression have been especially informative. Nutrition assessment has been facilitated by additions to the nutritionist’s tool kit, including bioelectric impedance analysis, functional laboratory testing, and a more comprehensive health history with triggering events and genetic predisposition.
Thus the FNA method is rapidly gaining acceptance for guidance in the relief of many chronic diseases and conditions with nutritional implications (Jones et al., 2009). By using an IDU approach, dietitians can develop more personalized intervention plans, support the body’s natural mechanisms, and restore balance and health (Noland, 2010). In the future, the clinical encounter will require a collaborative, healing partnership. Phytonutrients, personalized dietary advice, exercise and energy requirements, meditation, and yoga may all one day be part of that therapeutic dialogue.
Gastrointestinal Function
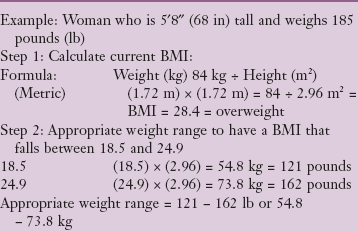
Assessment of the capacity for digestion, absorption, and transport as well as the hormonal status provides critical background information as to why a patient may be malnourished. Malabsorption syndrome, in which several nutrients are abnormally absorbed, is the most dramatic. Constipation, diarrhea, excessive vomiting, or flatulence also warrant further analysis. Mucosal changes in the gastrointestinal (GI) tract are indicated by problems such as diarrhea and anorexia. Tests may be done on a stool sample and can reveal excessive amounts of fat, an indication of malabsorption, the status of the GI flora and the amounts and types of bacteria present in the gut. The acidity of the stomach, important for maintaining an optimal milieu for digestion and absorption, can be assessed using manual intragastric titration, which gives an indication of gastric hydrochloric acid secretion.
Handgrip Dynamometry
Handgrip dynamometry can provide a baseline nutritional assessment of muscle function by measuring grip strength and endurance, and is useful in serial measurements. Measurements of handgrip dynamometry are expressed as a percentage of a standard. The assumption is that strong hands reflect strength elsewhere. Decreased grip strength is an important sign of frailty, especially in older adults. The Groningen Fitness Test for the Elderly was developed by Koen and colleagues (2001) for a longitudinal study in the Netherlands of age-related fitness and it continues to be useful. Low grip strength is consistently associated with a greater likelihood of premature mortality, the development of disability, and an increased risk of complications or prolonged length of stay after hospitalization or surgery in middle-aged and older adults (Bohannon, 2008).
Hydration
It is important to recognize the fluid volume status of an individual during the nutrition-focused physical examination. Fluid disturbances can be associated with other imbalances such as electrolyte imbalance.
Dehydration
Note excessive loss of water and electrolytes from vomiting, diarrhea, excessive laxative abuse, fistulas, GI suction, polyuria, fever, excessive sweating, edema (third-space fluid shifts), or decreased intake caused by anorexia, nausea, depression, or inadequate access to fluids. Characteristics include weight loss that occurs over a short period, decreased skin and tongue turgor, dry mucous membranes, postural hypotension, a weak and rapid pulse, slow-filling peripheral veins, a decrease in body temperature (95°-98° F), decreased urine output, elevated hematocrit, cold extremities, disorientation, or a blood urea nitrogen (BUN) level elevated out of proportion to serum creatinine.
Overhydration
Note any history of renal failure, congestive heart failure, cirrhosis of the liver, or Cushing syndrome, excess use of sodium-containing intravenous fluids, and excessive intake of sodium-containing food or medication products. Characteristics of fluid volume excess include weight gain that occurs over a short period, peripheral edema, distended neck veins, slow emptying of peripheral veins, rales in the lungs, polyuria, ascites, pleural effusion, a bounding and full pulse, decreased BUN, and low hematocrit. Pulmonary edema may occur in severe cases.
Physical Activity Assessment
Because diet and physical activity are lifestyle and behavioral factors that play a role in the cause and prevention of chronic diseases, inclusion of a physical activity assessment is part of a full nutrition assessment. Many instruments used to measure activity are difficult to use, and are prone to reporting errors. However, dietetic professionals can ask a few questions to gain insight into the activity levels of their clients. Box 6-4 provides a series of questions that can be asked to identify the current levels and interest in future activity levels for ambulatory patients and clients.
BOX 6-4 Physical Activity Assessment Questionnaire
To be considered physically active, you must get at least:
 30 minutes of moderate physical activity on 5 or more days a week, OR
20 minutes of vigorous physical activity on 3 or more days a week
How physically active do you plan to be over the next 6 months? (Choose the best answer.)
____ I am not currently active and do not plan to become physically active in the next 6 months.
____ I am thinking about becoming more physically active.
____ I intend to become more physically active in the next 6 months.
____ I have been trying to get more physical activity.
____ I am currently physically active and have been for the last 1-5 months.
____ I have been regularly physically active for the past 6 months or more.
Compared to how physically active you have been over the last 3 months, how would you describe the last 7 days: (Check one)
Recall your participation in activities or in sedentary behaviors, over the past 24 hours:
• Reading, watching TV, or computer time _____ minutes/day
• Fast walking ____ minutes/day
• Physical activity (swimming, tennis, racquetball, similar) ______ minutes/day
• Other physical activity (describe _________________) _______ minutes/day
What are the 3 most important reasons why you would consider increasing your physical activity?
| Improve my health |
Control my weight |
Lower my stress |
| Look better |
Improve my fitness |
Feel better |
| Lower my risk of disease |
Other: ___________ |
How confident are you that you could increase your physical activity if you decided to do so? (Check one)
Would you consider using a pedometer to count your steps per day? Yes ____ No ____
Record all of your activity what you did and amount of time spent, for the next two days and review with counselor.
Subjective Global Assessment
The Subjective Global Assessment (SGA) is a tool based on history, dietary data, GI symptoms, functional capacity, effects of disease on nutritional requirements, and physical appearance. This tool has been validated and more recently has been shown to correlate well with the nutrition risk index and other assessment data in hospitalized patients (DeLegge and Drake, 2007). Documentation of assessment data using the SGA allows other providers to identify the same factors as problematic, and provides a baseline for comparison in that individual over time (Box 6-5).
Once the nutrition assessment process is complete, the extent of nutritional adequacy, deficiency, or excess should be apparent. Severity of malnutrition can then be classified based on body weight, body fat, somatic and visceral protein stores, and laboratory values. When nutrition problems are noted, the appropriate nutrition diagnoses can be selected and the other steps in the nutrition care process may be implemented accordingly (see Chapter 11). Refer to the most current International Dietetics and Nutrition Terminology Reference Manual for updates and guidelines (American Dietetic Association, 2009).
 Clinical Scenario
Carl is a 32-year-old man who is 5 ft, 9 in tall. He was diagnosed as having acquired immune deficiency syndrome 1 year ago. In the past year his weight has gradually decreased from a usual weight of 175 lb to the current low of 130 lb. His visceral proteins are depleted, and a triceps skinfold measurement reveals a body fat value that is 55% of standard. Carl’s oral intake ability has gradually decreased; he can only take sips of an enteral supplement and occasional bites of food.
American Dietetic Association, Evidence Analysis Library
http://www.adaevidencelibrary.com/topic.cfm?cat=1225
Assessment Tools for Weight-Related Health Risks
http://www.columbia.edu/itc/hs/medical/nutrition/dat/dat.html
Body Mass Index Assessment Tool
http://www.nhlbisupport.com/bmi/
Centers for Disease Control and Prevention—Growth Charts
www.cdc.gov/ growthcharts/
Centers for Disease Control and Prevention—Weight Assessment
http://www.cdc.gov/healthyweight/assessing/index.html
References
American Dietetic Association. International dietetics and nutrition terminology reference manual. Chicago: American Dietetic Association; 2009.
Bazzano, LA, et al. Effect of folic acid supplementation on risk of cardiovascular diseases: a meta-analysis of randomized controlled trials. JAMA. 2006;296:2720.
Blackburn, GL. Nutritional and metabolic assessment of the hospitalized patient. JPEN J Parenter Enteral Nutr. 1977;1:11.
Bohannon, R. Hand-grip dynamometry predicts future outcomes in aging adults. J Geriatr Phys Ther. 2008;31:3.
Buchman, AL. Handbook of nutritional support. Baltimore: Williams & Wilkins; 1997.
Calder, PC, et al. Inflammatory disease processes and interactions with nutrition. Br J Nutr. 2009;101:S1.
Centers for Disease Control (CDC) and Prevention. Overweight and obesity. http://www.cdc.gov/obesity/, 2009.
DeLegge, M, Drake, L. Nutritional assessment. Gastroenterol Clin North Am. 2007;36:1.
Dennis, RA, et al. Changes in prealbumin, nutrient intake, and systemic inflammation in elderly recuperative care patients. J Am Geriatric Soc. 2008;56:1270.
Devakonda, A, et al. Transthyretin as a marker to predict outcome in critically ill patients. Clin Biochem. 2008;41:1126.
Deurenberg, P, Deurenberg-Yap, M. Validity of body composition methods across ethnic population groups. Acta Diabetol. 2003;40:246S.
Dililo, DJ, et al. B10 cells and regulatory B cells balance immune responses during inflammation, autoimmunity, and cancer. Ann N Y Acad Sci. 2010;1183:38.
Elsayed, EF, et al. Waist-to-hip ratio and body mass index as risk factors for cardiovascular events in CKD. Am J Kidney Dis. 2008;52:49.
Fields, DA, et al. Air-displacement plethysmography: here to stay. Curr Opin Clin Nutr Metabol Care. 2005;8:624.
Flakoll, PJ, et al. Bioelectrical impedance vs air displacement plethysmography and dual-energy X-ray absorptiometry to determine body composition in patients with end-stage renal disease. JPEN J Parenter Enteral Nutr. 2004;28:13.
Frisancho, AR. New standards of weight and body composition by frame size and height for assessment of nutritional status of adults and the elderly. Am J Clin Nutr. 1984;40:808.
Germolec, DR, et al. Markers of inflammation. Methods Mol Biol. 2010;598:53.
Hammond, KA. Physical assessment. In Lysen LK, ed.: Quick reference to clinical dietetics, ed 2, Boston: Jones and Bartlett, 2006.
Hamwi, GJ. Diabetes mellitus, diagnosis and treatment. New York: American Diabetes Association; 1964.
Hye, SP, et al. Relationship of obesity and visceral adiposity with serum concentrations of CRP, TNF-a and IL-6. Diabetes Res Clin Pract. 2005;69:29.
Jones, D, et al. 21st century medicine: a new model for medical education and practice. Gig Harbor, WA: Institute for Functional Medicine; 2009.
Keys, A, et al. Indices of relative weight and obesity. J Chronic Dis. 1972;25:329.
Koen, A, et al. Reliability of the Groningen Fitness Test for the elderly. J Aging Phys Act. 2001;9:194.
Lee, RD, Nieman, DC. Nutritional assessment, ed 3. New York: McGraw-Hill; 2003.
Litchford, MD. Inflammatory biomarkers and metabolic meltdown. Greensboro, NC: Case Software and Books; 2009.
Mei, Z, et al. Validity of body mass index compared with other body-composition screening indexes for the assessment of body fatness in children and adolescents. Am J Clin Nutr. 2002;75:978.
Noland, D. Functional nutrition therapy: principles of assessment. Gig Harbor, WA: Institute for Functional Medicine; 2010.
Northrop-Clewes, C. Interpreting indicators of iron status during an acute phase response—lessons from malaria and human immunodeficiency virus. Ann Clin Biochem. 2008;45:18.
Olefsky, JM, Glass, CK. Macrophages, inflammation, and insulin resistance. Annu Rev Physiol. 2010;72:219.
Ramel, A, et al. Anemia, nutritional status and inflammation in hospitalized elderly. Nutrition. 2008;24:1116.
Ridker, PM, et al. for the JUPITER Study Group: Rosuvastatin to prevent vascular events in men and women with elevated C-reactive protein. N Engl J Med. 2008;359:2195.
Riediger, N, et al. A systemic review of the roles of ω-3 fatty acids in health and disease. J Am Diet Assoc. 2009;109:668.
Russell, M, Mueller, C. Nutrition screening and assessment. In: Gottschlich M, et al, eds. The science and practice of nutrition support: American Society for Parenteral and Enteral Nutrition. Dubuque, IA: Kendall/Hunt, 2007.
Stensland, SH, Margolis, S. Simplifying the calculation of body mass index for quick reference. J Am Diet Assoc. 1990;90:856.
Vaccarino, HA, Krumholz, HM. An evidence-based assessment of federal guidelines for overweight and obesity as they apply to elderly persons. Arch Intern Med. 2001;161:1194.
Wagner, D, Heyward, V. Measures of body composition in blacks and whites: a comparative review. Am J Clin Nutr. 2000;71:1392.
Yajnik, CS, Yudkin, JS. Appropriate body mass index for Asian populations and its implications for policy and intervention strategies. Lancet. 2004;363:157.
Zheng, Y, et al. Evolving cardiovascular disease prevalence, mortality, risk factors, and the metabolic syndrome in China. Clin Cardiol. 2009;32:491.