Clinical
Biochemical Assessment
Laboratory tests are ordered to diagnose diseases, support nutrition diagnoses, monitor medication effectiveness, and evaluate nutrition care process (NCP) interventions. Acute illness or injury can trigger dramatic changes in laboratory test results, including rapidly deteriorating nutrition status. However, chronic diseases that develop slowly over time also influence these results, making them useful in preventive care. Laboratory test results provide objective data to use in the NCP. Furthermore, because numeric values do not themselves connote personal judgment, this data can often be shared with a patient without implicit or perceived blame.
Definitions And Usefulness Of Nutrition Laboratory Data
Laboratory assessment is a stringently controlled process. It involves comparing control samples with predetermined substance or chemical constituent (analyte) concentrations with every patient specimen. The results obtained must compare favorably with predetermined acceptable values before the patient data can be considered valid. Laboratory data are the only objective data used in nutritional assessment that are “controlled”—that is, the validity of the method of its measurement is checked each time a specimen is assayed by also assaying a sample with a known value.
Laboratory-based nutritional testing, used to estimate nutrient availability in biologic fluids and tissues, is critical for assessment of both clinical and subclinical nutrient deficiencies. As shown in Figure 8-1, the size of a nutrient pool can vary continuously from frankly deficient to adequate to toxic. Most of these states can be assessed in the laboratory so that nutritional intervention can occur before a clinical or anthropometric change or a frank deficiency occurs (Litchford, 2009). Single test results must be evaluated in light of the patient’s current medical condition, medications, lifestyle choices, age, hydration status, fasting status at the time of specimen collection, and reference standards used by the clinical laboratory. Single test results are useful for screening or to confirm an assessment based on changing clinical, anthropometric, and dietary status. Comparison of current test results to historic baseline test results from the same laboratory is desirable, when available. Changes in laboratory test results that occur over time are often an objective measure of nutrition or pharmacologic interventions.
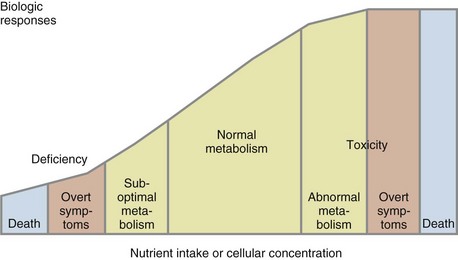
FIGURE 8-1 The size of a nutrient pool can vary continuously from frankly deficient, to adequate, to toxic.
Specimen Types
Ideally the specimen to be tested reflects the total body content of the nutrient to be assessed. However, the best specimen may not be readily available. The most common specimens for analysis for nutrients and nutrient-related substances include:
• Whole blood: Collected with an anticoagulant if entire content of the blood is to be evaluated; none of the elements are removed; contains red blood cells (RBCs), white blood cells(WBCs), and platelets suspended in plasma
• Serum: The fluid obtained from blood after the blood has been clotted and then centrifuged to remove the clot and blood cells
• Plasma: The transparent (slightly straw-colored) liquid component of blood, composed of water, blood proteins, inorganic electrolytes, and clotting factors
• Blood cells: Separated from anticoagulated whole blood for measurement of cellular analyte content
• Leukocytes: WBCs and leukocyte fractions
• Blood spots: Dried whole blood from finger or heel prick that is placed on paper and can be used for selected hormone tests and other tests such as infant phenylketonuria screening
• Other tissues: Obtained from scrapings or biopsy samples
• Urine (from random samples or timed collections): Contains a concentrate of excreted metabolites
• Feces (from random samples or timed collections): Important in nutritional analyses when nutrients are not absorbed and therefore are present in fecal material or to determine composition of gut flora
Less commonly used specimens include the following:
• Breath tests: Noninvasive tool to evaluate nutrient metabolism, use, and malabsorption, particularly of sugars
• Hair and nails: Easy-to-collect tissue for determining exposure to toxic metals; poor indicator of actual body levels of nutrients
• Saliva: Noninvasive medium with a fast turnover; currently is used to evaluate functional adrenal stress and hormone levels
• Sweat: Electrolyte test used to detect sweat chloride levels to determine presence of cystic fibrosis
The hair and nails specimens have significant drawbacks, including potential environmental contamination. Lack of standardized procedures exist for processing, assay, and quality control. Nutrient levels or indices may be less than the amounts that can be measured accurately. However, because these specimens can be collected at the point of care, considerable research is being done to improve their usefulness.
Hair analysis is not particularly useful for assessing levels of minerals such as sodium, magnesium, phosphorus, potassium, calcium, iron, and iodine and good tests already exist for evaluating body functions related to these minerals. However, hair analysis may be helpful in assessing levels of trace elements such as zinc, copper, chromium, and manganese—for which measurements of functional status are not well developed—and levels of mercury, cadmium, and lead, which have negative biologic effects. Hair can be used for deoxyribonucleic acid (DNA) testing and may be useful in the future as a noninvasive methodology to predict genetic predisposition to disease and effectiveness of medical nutrition therapy (see Chapter 5 for more information).
Assay Types
The two fundamental types of laboratory assays are static assays and functional assays. Static assays measure the actual level of nutrient in the specimen. Examples of this kind of assay include serum iron and white blood cell ascorbic acid. Although this kind of assay is absolutely specific for the nutrient of interest, specimen nutrient concentrations do not reflect the amount of that substance stored in body pools that are not sampled. Another major limitation of static assays is that recent dietary intake influences the amount of a nutrient found in serum, plasma, or any other fluid or tissue. This problem can be overcome, at least partially, by collecting the specimen following an overnight (8-12 hour) fast.
Functional assays quantitatively measure a biochemical or physiologic activity that depends on the nutrient of interest. This type of assay can be very sensitive for a nutrient at its functional site. A good example of a functional assay is serum ferritin. The concentration of ferritin released into the blood is a function of the iron present in the cellular storage pool. Unfortunately functional assays are not always specific for the nutrient of interest because many physiologic and biochemical functions depend on various biologic factors in addition to the specific nutrient.
Nutrition Interpretation Of Routine Medical Laboratory Tests
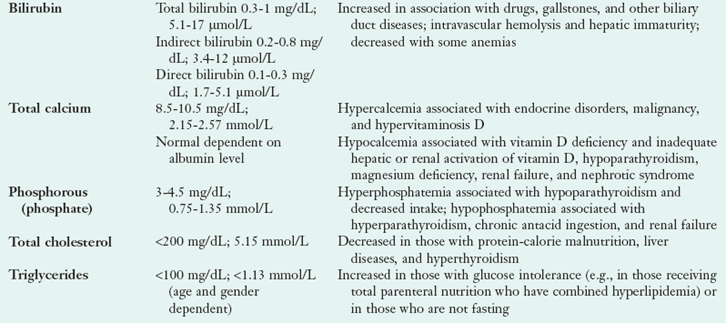
Laboratory tests are ordered as panels or groupings of tests or as individual tests. The most commonly ordered groups of tests are the basic metabolic panel (BMP) and the comprehensive metabolic panel (CMP) that include groups of laboratory tests defined by the Centers for Medicare and Medicaid Services for reimbursement purposes. The BMP includes eight tests used for screening, and the CMP includes all the tests in the BMP and six additional tests (Box 8-1). Table 8-1 briefly explains these tests, but the information is not exhaustive and reference norms may vary; see Appendix 30 to obtain more detailed information. Clinical chemistry panels provide nutrition-specific laboratory data that are used in conjunction with health history, physical examination findings, anthropometric data, nutrition-focused physical assessment and dietary intake data to identify nutrition diagnoses. Follow-up data are used to monitor and evaluate outcomes of various NCP interventions.
TABLE 8-1
Constituents of the Common Serum Chemistry Panels
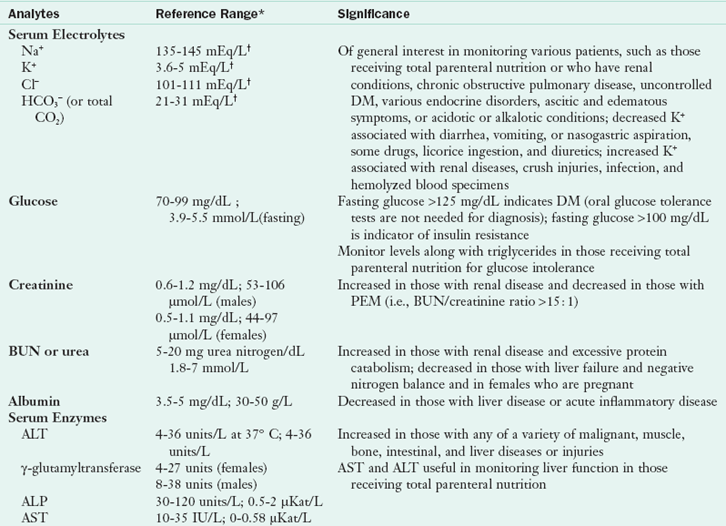
ALP, Alkaline phosphate; ALT, alanine aminotransferase; AST, aspartate aminotransferase; BUN, blood urea nitrogen; Cl−, chlorine; CO2, carbon dioxide; DM, diabetes mellitus; HCO3−, bicarbonate; K+, potassium; Na+, sodium; PEM, protein-energy malnutrition.
*Reference ranges may vary slightly among laboratories.
†mEq/L = 1 mmol/L.
Complete Blood Count
The complete blood count (CBC) provides a count of the cells in the blood and description of the RBCs. A hemogram is a CBC with a white blood cell differential count (often called a differential or diff). Table 8-2 provides a list of the basic elements of the CBC and differential, with reference ranges and explanatory comments.
TABLE 8-2
Constituents of the Hemogram: Complete Blood Count and Differential
| Analytes | Reference Range* | Significance |
| Red blood cells | 4.7-6.1 × 10⁶/µL (males); 4.7-6.1 1012/L 4.2-5.4 × 10⁶/µL (females); 4.2-5.4 1012/L |
In addition to nutritional deficits, may be decreased in those with hemorrhage, hemolysis, genetic aberrations, marrow failure, or renal disease or who are taking certain drugs; not sensitive for iron, vitamin B12, or folate deficiencies |
| Hemoglobin concentration | 14-18 g/dL; 8.7-11.2 mmol/L (males) 12-16 g/dL; 7.4-9.9 mmol/L (females) >11 g/dL; >6.8 mmol/L (pregnant females) 14-24 g/dL; 8.7-14.9 mmol/L (newborns) |
In addition to nutritional deficits, may be decreased in those with hemorrhage, hemolysis, genetic aberrations, marrow failure, or renal disease or who are taking certain drugs; not sensitive for iron, vitamin B12, or folate deficiencies |
| Hematocrit | 42%-52% (males) 35%-47% (females) 33% (pregnant females) 44%-64% (newborns) |
In addition to nutritional deficits, may be decreased in those with hemorrhage, hemolysis, genetic aberrations, marrow failure, or renal disease or who are taking certain drugs; not sensitive for iron, vitamin B12, or folate deficiencies |
| MCV | 80-99 fl 96-108 fl (newborns) |
Decreased (microcytic) in presence of iron deficiency, thalassemia trait and chronic renal failure, anemia of chronic disease; increased (macrocytic) in presence of vitamin B12 or folate deficiency and genetic defects in DNA synthesis; neither microcytosis nor macrocytosis sensitive to marginal nutrient deficiencies |
| MCH | 27-31 pg/cell 23-34 pg (newborns) |
Causes of abnormal values similar to those for MCV |
| MCHC | 32-36 g/dL; 32-36% 32-33 g/dL; 32-33% (newborns) |
Decreased in those with iron deficiency and thalassemia trait; not sensitive to marginal nutrient deficiencies |
| WBC | 5-10 × 109/L; 5,000-10,000/mm3 (2 yr-adult) 6-17 × 109/L; 6,000-17,000/mm3 (<2 yr) 9-30 × 109; 9,000-30,000/mm3 (newborns) |
Increased (leukocytosis) in those with infection, neoplasia, and stress decreased (leucopenia) in those with PEM, autoimmune diseases, or overwhelming infections or who are receiving chemotherapy or radiation therapy |
| Differential | 55%-70% neutrophils 20-40% lymphocytes 2-8% monocytes 1%-4% eosinophils 0.5%-1% basophils |
Neutrophilia: Ketoacidosis, trauma, stress, pus-forming infections, leukemia Neutropenia: PEM, aplastic anemia, chemotherapy, overwhelming infection Lymphocytosis: Infection, leukemia, myeloma, mononucleosis Lymphocytopenia: Leukemia, chemotherapy, sepsis, AIDS Eosinophilia: Parasitic infestation, allergy, eczema, leukemia, autoimmune disease Eosinopenia: Increased steroid production Basophilia: Leukemia Basopenia: Allergy |
AIDS, Acquired immune deficiency syndrome; DNA, deoxyribonucleic acid; MCH, mean corpuscular hemoglobin; MCHC, mean corpuscular hemoglobin concentration; MCV, mean corpuscular volume; PEM, protein-energy malnutrition.
Stool Testing
Fecal samples may be tested for the presence of blood, pathogens, and gut flora. The fecal occult blood test is routinely ordered for adults older than age 50 and younger adults with unexplained anemia. Stool culture testing may be ordered in patients with prolonged diarrhea, especially if food-borne illness is suspected. If pathogenic bacteria are isolated in stool culture, appropriate pharmacologic interventions are initiated. Patients with chronic gastrointestinal (GI) symptoms such as maldigestion or unexplained weight loss or gain may benefit from gut flora testing to identify pathologic flora or an imbalance of physiologic flora. In addition, stool tests may be helpful to evaluate the effectiveness of probiotic, prebiotic, and synbiotic use.
Urinalysis
The urinalysis test is used as a screening or diagnostic tool to detect substances or cellular material in the urine associated with different metabolic and kidney disorders. Some urinalysis data have broader medical and nutritional significance e.g., glycosuria suggests abnormal carbohydrate use and possibly diabetes. The full urinalysis includes a record of (1) the appearance of the urine, (2) the results of basic tests done with chemically impregnated reagent strips (often called dipsticks) that can be read visually or by an automated reader, and (3) the microscopic examination of urine sediment. Table 8-3 provides a list of the chemical tests performed in a urinalysis and their significance.
TABLE 8-3
Chemical Tests in a Urinalysis
| Analyte | Expected Value | Significance |
| Specific gravity | 1.010-1.025 | Can be used to test and monitor the concentrating and diluting abilities of the kidney and hydration status; low in those with diabetes insipidus, glomerulonephritis, or pyelonephritis; high in those with vomiting, diarrhea, sweating, fever, adrenal insufficiency, hepatic diseases, or heart failure |
| pH | 4.6-8 (normal diet) | Acidic in those with a high-protein diet or acidosis (e.g., uncontrolled DM or starvation), during administration of some drugs, and in association with uric acid, cystine, and calcium oxalate kidney stones; alkaline in individuals consuming diets rich in vegetables or dairy products and in those with a urinary tract infection, immediately after meals, with some drugs, and in those with phosphate and calcium carbonate kidney stones |
| Protein | 2-8 mg/dL | Marked proteinuria in those with nephrotic syndrome, severe glomerulonephritis, or congestive heart failure; moderate in those with most renal diseases, preeclampsia, or urinary tract inflammation; minimal in those with certain renal diseases or lower urinary tract disorders |
| Glucose | Not detected (2-10 g/dL in DM) | Positive in those with DM; rarely in benign conditions |
| Ketones | Negative | Positive in those with uncontrolled DM (usually type 1); also positive in those with a fever, anorexia, certain GI disturbances, persistent vomiting, or cachexia or who are fasting or starving |
| Blood | Negative | Indicates urinary tract infection, neoplasm, or trauma; also positive in those with traumatic muscle injuries or hemolytic anemia |
| Bilirubin | Not detected | Index of unconjugated bilirubin; increase in those with certain liver diseases (e.g., gallstones) |
| Urobilinogen | 0.1-1 units/dL | Index of conjugated bilirubin; increased in those with hemolytic conditions; used to distinguish among hepatic diseases |
| Nitrite | Negative | Index of bacteriuria |
| Leukocyte esterase | Negative | Indirect test of bacteriuria; detects leukocytes |
Assessment Of Hydration Status
Disorders of fluid balance include dehydration and overhydration. Dehydration is a state of negative fluid balance caused by decreased intake, increased losses, and fluid shifts. Overhydration, or edema, occurs when there is an increase in the extracellular fluid volume. The fluid shifts from the extracellular compartment to the interstitial fluid compartment. Overhydration is caused by an increase in capillary hydrostatic pressure or capillary permeability, a decrease in colloid osmotic pressure, or physical inactivity. Laboratory measures of hydration status include serum sodium, blood urea nitrogen, serum osmolality, and urine specific gravity. Although the laboratory tests are important, decisions regarding hydration should only be made in conjunction with other information from physical examination, nutrition-focused physical assessment, and the clinical condition of the patient (see the discussion of acid-base balance in Chapter 7).
Bioelectrical Impedance Analysis
Bioelectrical impedance analysis (BIA) estimates body composition based on the difference in electrical conductive properties of various body tissues. BIA instruments automatically calculate total body water, fat-free mass, and percent body fat. Normal hydration is critical for results to be valid. Individuals who are overhydrated have a lower percent of body fat and a dehydrated individual has an elevated reading for percent body fat.
Assessment Of Stress-Related Protein-Energy Malnutrition
Acute illness or trauma causes inflammatory stress. Hormones and cell-mediated responses trigger the breakdown of lean body mass to synthesize cytokines, positive acute-phase proteins, lactic acid, and white blood cells (see Chapter 39). Evaluation of nutrition status of acutely ill patients exhibiting inflammatory stress is difficult because none of the standard laboratory test results consistently reflect changes in protein status at either the onset of illness or with refeeding. It is clear that the acutely ill patient loses protein rapidly because of the inflammatory process. However, increasing exogenous protein intake alone does not attenuate the loss of endogenous protein. Nutrition therapy must be combined with physical therapy to reduce loss of muscle mass (Campbell, 2007; Hays et al., 2009). The following measures should be interpreted cautiously as components of nutritional status because stress changes parameters and values may not reflect nutritional intake of protein accurately.
C-Reactive Protein
Use of inflammatory biomarkers such as C-reactive protein (CRP) helps to identify when the acute hypermetabolic period of the inflammatory response wanes. High-sensitivity CRP (hs-CRP) is a sensitive measure of chronic inflammation seen in patients with atherosclerosis and other chronic diseases (Bajpai et al., 2010). Both CRP and hs-CRP are nonspecific markers and reflect any type of inflammation. Although the exact function of CRP is unclear, it increases in the initial stages of acute stress—usually within 4 to 6 hours of surgery or other trauma. Furthermore, its level can increase as much as 1000-fold, depending on the intensity of the stress response. When the CRP level begins to decrease, the patient has entered the anabolic period of the inflammatory response when more intensive nutrition therapy may be beneficial. Ongoing assessment and follow-up is required to address changes in nutrition status.
Creatinine
Creatinine is formed from creatine, found almost exclusively in muscle tissue. Serum creatinine is used along with BUN to assess kidney function. Urinary creatinine has been used to assess somatic (muscle) protein status. Creatine is synthesized from the amino acids glycine and arginine with addition of a methyl group from the folate- and cobalamin-dependent methionine–S-adenosylmethionine (SAM)–homocysteine cycle. Creatine phosphate is a high-energy phosphate buffer that provides a constant supply of adenosine triphosphate (ATP) for muscle contraction. When creatine is dephosphorylated, some of it is spontaneously converted to creatinine by an irreversible, nonenzymatic reaction. Creatinine has no specific biologic function; it is continuously released from the muscle cells and excreted by the kidneys with little reabsorption.
The use of urinary creatinine to assess somatic protein status is confounded by omnivorous diets. Because creatine is stored in muscle, muscle meats are rich sources. The creatinine formed from dietary creatine cannot be distinguished from endogenously produced creatinine. When a patient follows a meat-restricted diet, the size of the somatic (muscle) protein pool is directly proportional to the amount of creatinine excreted. Therefore men generally have higher serum levels and excrete larger amounts of creatinine than women, and individuals with greater muscular development have higher serum levels and excrete larger amounts than those who are less muscular. Total body weight is not proportional to creatinine excretion, but muscle mass is.
Daily creatinine excretion varies significantly within individuals, probably because of losses in sweat. In addition, the test is based on 24-hour urine collections, which are difficult to obtain. Because of these limitations, urinary creatinine concentration as a marker of muscle mass has limited use in health care settings and is typically used only for doing research. Creatinine excretion rate is related to muscle mass, and is expressed as a percentage of a standard value as shown by the following equation for creatinine-height index (CHI):
Calculated CHI >80% normal, 60-80% suggests mild skeletal muscle depletion, 40-60% suggests moderate depletion and <40% suggests severe depletion. See Table 8-4. (Blackburn, 1977)
TABLE 8-4
Expected Urinary Creatinine Excretions for Adults Based on Height
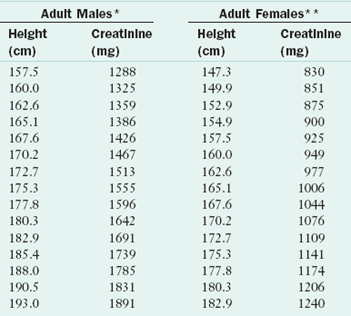
*Creatinine coefficient males 23 mg/kg “ideal” body weight.
**Creatinine coefficient females 18 mg/kg “ideal” body weight.
Another predictive equation used to estimate skeletal muscle that does not account for height or gender was proposed by Wang (1996),

Although this equation works well for some individuals, it is not used for sick or injured patients, older adults or for body builders.
Immunocompetence
Protein-energy malnutrition (PEM) is associated with impaired immunocompetence, including depressed cell-mediated immunity, phagocyte dysfunction, decreased levels of complement components, reduced mucosal secretory antibody responses, and lower antibody affinity. Assessing immunocompetence in critically ill patients may be useful in determining the extent of the inadequate nutrition and disease. Assessing immunocompetence is also useful in the patient who is being treated for allergies.
There is no single marker for immunocompetence except for the clinical outcome of infection or allergic response. Laboratory markers with a high degree of sensitivity include vaccine-specific serum antibody production, delayed-type hypersensitivity response, vaccine-specific or total secretory immunoglobulin A in saliva, and the response to attenuated pathogens. Less sensitive markers include natural killer cell cytotoxicity, oxidative burst of phagocytes, lymphocyte proliferation, and the cytokine pattern produced by activated immune cells. Using a combination of markers is currently the best approach to measure immunocompetence (Albers et al., 2005).
Nitrogen Balance
Nitrogen balance studies are used primarily in research studies to estimate the balance between exogenous nitrogen intake (orally, enterally, or parenterally) and renal removal of nitrogen-containing compounds (urinary, fecal, wound), and other nitrogen sources. These studies are not a measure of protein anabolism and catabolism because true protein turnover studies require consumption of labeled (stable isotope) protein to track protein use. Even if useful, nitrogen balance studies are difficult because valid 24-hour urine collections are tedious unless the patient has a catheter. In addition, changes in renal function are common in patients with inflammatory metabolism, making standard nitrogen balance calculations inaccurate without calculation of nitrogen retention (Gottschlich et al., 2001). Clinicians using nitrogen balance to estimate protein flux in critically ill patients must remember the limitations of these studies and that positive nitrogen balance may not mean that protein catabolism has decreased, particularly in inflammatory (disease and trauma) conditions. Adequate nutrition cannot circumvent the inflammatory metabolism.
Hepatic Transport Proteins
Unlike nitrogen balance measurements that assess only short-term changes in whole-body protein status, plasma protein levels integrate protein synthesis and degradation over longer periods. Albumin, prealbumin (PAB); transthyretin [TTHY]), retinol-binding protein, transferrin, and other transport proteins are synthesized in the liver and represent approximately 3% of total body protein. Serum levels of albumin and PAB have traditionally been used as part of nutrition assessment; however, levels may not reflect the patient’s protein status. Albumin, PAB, retinol binding protein, and transferrin are negative acute-phase proteins; they plummet during inflammatory stress, injury, and illness. Serum levels reflect the severity of illness, but may not reflect current protein status or the effects of nutrient-dense supplemental nutrition. Levels of both albumin and PAB remain nearly normal during uncomplicated starvation as redistribution from the interstitium to the plasma occurs. For these reasons, a well-nourished but stressed patient may have low levels of the hepatic transport proteins, whereas a patient who has had significant weight loss and undernutrition may have normal or close to normal levels.
Albumin
Albumin accounts for approximately 60% of total serum proteins. Albumin transports major blood constituents, hormones, enzymes, medications, minerals, ions, fatty acids, amino acids, and metabolites. However, its major purpose is to maintain colloidal osmotic pressure; providing approximately 80% of colloidal osmotic pressure of the plasma. When serum albumin levels decrease, the water in the plasma moves to the interstitial compartment and promotes edema. The loss of plasma fluid results in hypovolemia; this triggers renal retention of water and sodium. Albumin has a half-life of 18-21 days, and thus does not reflect current protein intake.
Prealbumin (Transthyretin)
Prealbumin (PAB), officially transthyretin (TTHY), is a hepatic protein transported in the serum as a complex of retinol-binding protein and vitamin A. It transports the thyroid hormones triiodothyronine and thyroxine (T4), along with T4-binding globulin. Because PAB has a short half-life ( = 2 days), it has been used as an indicator of protein status. Levels of PAB fall precipitously in inflammatory stress and often do not improve with aggressive nutrition support. Serum levels decrease with inflammation, malignancy, and protein-wasting diseases of the intestines or kidneys. Serum levels also decrease in the presence of a zinc deficiency because zinc is required for hepatic synthesis and secretion of PAB. Consider zinc status from dietary intake and medical history, in addition to inflammation, when interpreting low plasma PAB levels.
PAB levels are often maintained in “uncomplicated” malnutrition and decreased in well-nourished individuals who have undergone recent stress or trauma. During pregnancy, the changed estrogen levels stimulate PAB synthesis and serum levels may increase. In nephrotic syndrome, PAB levels may also be increased. Proteinuria and hypoproteinemia are common in nephrotic syndrome; because PAB is rapidly synthesized, a disproportionate percentage of PAB can exist in the blood, whereas other proteins take longer to produce (Litchford, 2010).
Retinol-Binding Protein
The hepatic protein with the shortest half-life ( = 12 hr) is retinol-binding protein (RBP), a small plasma protein that does not pass through the renal glomerulus because it circulates in a complex with PAB. As implied by its name, RBP binds retinol, and transport of this vitamin A metabolite seems to be its exclusive function. RBP is synthesized in the liver and released with retinol. After RBP releases retinol in peripheral tissue, its affinity for PAB decreases, leading to dissociation of the PAB-RBP complex and filtration of apoprotein (apo)-RBP by the glomerulus. The protein is then catabolized in the renal tubule.
The plasma RBP concentration has been shown to decrease in uncomplicated protein calorie malnutrition. However, as a negative acute-phase protein, RBP levels fall in the presence of inflammatory stress and may not improve with refeeding. RBP may not reflect protein status in acutely stressed patients; however, it is not as affected by inflammatory stress as albumin, transferrin, or PAB. Simultaneous secretion of RBP and retinol from the liver means that retinol status also complicates the interpretation of reduced RBP values. RBP cannot reliably be used to assess protein status when the vitamin A status is compromised.
The use of RBP in assessing PEM is complicated by the normal catabolism of apo-RBP by the kidney. Patients with renal failure are likely to have elevated RBP levels, regardless of their protein-energy status, because the RBP is not being catabolized by the renal tubule.
RBP4 is an adipocyte-derived peptide of RBP that influences glucose homeostasis and may play a role in lipoprotein metabolism. Human clinical trials have demonstrated increased RBP4 levels in obesity, insulin resistance, gestational diabetes, proliferative diabetic retinopathy, and non-diabetic stage 5 chronic kidney disease, suggesting a possible relationship between these conditions. Larger clinical trials are needed (Axelsson, 2009; Choi, 2008; Klein, 2010; Li, 2010).
Transferrin
Transferrin is a globulin protein that transports iron to the bone marrow for production of hemoglobin (Hgb). The plasma transferrin level is controlled by the size of the iron storage pool. When iron stores are depleted, transferrin synthesis increases. It has a shorter half-life ( = 8 days) than albumin. Levels diminish with acute inflammatory reactions, malignancies, collagen vascular diseases, and liver diseases. Although the half-life of transferrin is shorter than that of albumin, it still does not respond rapidly enough to changes in nutrient intake to be useful as a measure of protein status in acute-care settings.
Laboratory Data To Assess For Nutritional Anemias
Anemia is a condition characterized by a reduction in the number of erythrocytes per unit of blood volume or a decrease in the Hgb of the blood to below the level of usual physiologic need. By convention, anemia is defined as a Hgb concentration below the 95th percentile for healthy reference populations of men, women, or age-grouped children. Anemia is not a disease but a symptom of various conditions, including extensive blood loss, excessive blood cell destruction, or decreased blood cell formation. It is observed in many hospitalized patients and is often a symptom of a disease process; its cause should be investigated. Clinical nutritionists must distinguish between anemia caused by nutritional inadequacies and that caused by other factors. See Chapter 33 for discussion of the management of anemias. For example, hydration problems can mask nutritional anemias or may result in falsely low blood values.
Classification of Anemia
Nutritional deficits are a major cause of decreased Hgb and erythrocyte production. The initial descriptive classification of anemia is derived from the hematocrit (Hct) value or CBC as explained in Table 8-2. Anemias associated with a mean RBC volume of less than 80 fl (femtoliters) are microcytic; those with values of 80 to 99 fl are normocytic; those associated with values of 100 fl or more are macrocytic. (See Chapter 33 on Anemias.) Data from the CBC are helpful in differentiating any nutritional causes of anemia. Microcytic anemia is most often associated with iron deficiency, whereas macrocytic anemia is generally caused by either folate- or vitamin B12–deficient erythropoiesis. However, because of the low specificity of these indexes, additional data are needed to distinguish between the various nutritional causes and nonnutritional causes, such as thalassemia trait and chronic renal insufficiency. Normocytic anemia is associated with the anemia of chronic and inflammatory diseases (ACD). This type of anemia is associated with rheumatic diseases, chronic heart failure, chronic infection, cancer, severe tissue injury, multiple fractures, and Hodgkin disease. ACD does not respond to iron supplementation.
Other information from the CBC that helps to differentiate the nonnutritional causes of anemia includes leukocyte, reticulocyte, and platelet counts. When these levels are low, marrow failure is indicated; high counts are associated with anemia caused by leukemia or infection. Erythrocyte sedimentation rate testing is ordered when symptoms are nonspecific and if inflammatory autoimmune diseases are suspected. Reticulocytes are large, nucleated, immature RBCs that are released in small numbers with mature cells. When RBC production rates increase, reticulocyte counts also increase. Any time anemia is accompanied by a high reticulocyte count, elevated erythropoietic activity in response to bleeding should be considered. In such cases, stool specimens can be tested for occult blood to rule out chronic GI blood loss. Other causes of a high reticulocyte count include intravascular hemolysis syndromes and an erythropoietic response to therapy for iron, vitamin B12, or folic acid deficiencies.
Normocytic or microcytic anemia may be caused by chronic or acute blood loss, such as from recent surgery, injury, or positive occult stool tests. Note that in those with hemolytic anemias and early iron deficiency anemia, the RBC size may still be normal. Macrocytic anemias include megaloblastic anemia or folate deficiency and pernicious anemia or vitamin B12 deficiency. The presence of macrocytic RBCs requires evaluation of both folate and vitamin B12 status. Both nutrients arrest DNA synthesis resulting in impaired RBC synthesis and maturation of RBCs. These changes cause large, nucleated cells to be released into the circulation. Although pernicious anemia is categorized as a macrocytic normochromic anemia, approximately 40% of the cases are normocytic.
Tests for Iron Deficiency Anemias
Hematocrit or Packed Cell Volume and Hemoglobin
Hematocrit (Hct) and hemoglobin (Hgb) are part of a routine CBC and are used together to evaluate iron status. Hct is the measure of the percentage of RBCs in total blood volume. Usually the Hct percentage is three times the Hgb concentration in grams per deciliter. The Hct value is affected by an extremely high WBC count and hydration status. Individuals living in high altitudes often have increased values. It is common for individuals older than age 50 to have slightly lower levels than younger adults.
The Hgb concentration is a measure of the total amount of Hgb in the peripheral blood. It is a more direct measure of iron deficiency than Hct because it quantifies total Hgb in RBCs rather than a percentage of total blood volume. Hgb and Hct are below normal in the four types of nutritional anemias and should always be evaluated in light of other laboratory values and recent medical history.
Serum Ferritin
Ferritin is the storage protein that sequesters the iron normally gathered in the liver (reticuloendothelial system), spleen, and marrow. As the iron supply increases, the intracellular level of ferritin increases to accommodate iron storage. A small amount of this ferritin leaks into the circulation. This ferritin can be measured by assays that are available in most clinical laboratories. In individuals with normal iron storage, 1 ng/mL of serum ferritin equals approximately 8 mg of stored iron. In healthy adults, the measurement of ferritin that has leaked into the serum is an excellent indicator of the size of the body’s iron storage pool.
Ferritin is a positive acute-phase protein, meaning that synthesis of ferritin increases in the presence of inflammation. Ferritin is not a reliable indicator of iron stores in patients with acute inflammation, uremia, metastatic cancer or alcoholic-related liver diseases. Cytokines and other inflammatory mediators can increase ferritin synthesis, ferritin leakage from cells, or both. Elevations in ferritin occur 1 to 2 days after the onset of the acute illness and peak at 3 to 5 days. If iron deficiency also exists, it may not be diagnosed because the level of ferritin would be falsely elevated.
ACD is the primary condition in which ferritin fails to correlate with iron stores. ACD, a common form of anemia in hospitalized patients, occurs in those with cancer or inflammatory or infectious disorders (Thomas and Thomas, 2005). It occurs during inflammation because red cell production decreases as the result of inadequate mobilization of iron from its storage sites. This is caused by the release of cytokines such as interleukin-1 and tumor necrosis factor (TNF), which also inhibit division of erythroid progenitors and may inhibit erythropoietin production. In those with arthritis, depletion of stored iron develops partly because of reduced absorption of iron from the gut. Also the regular use of nonsteroidal antiinflammatory drugs can cause occult GI blood loss. This form of anemia is usually mild and normocytic.
In 30% to 50% of patients, hypochromic (i.e., having inadequate amounts of Hgb), microcytic red cells are made, serum iron levels and total iron-binding capacity (TIBC) are low, and iron stores are normal or elevated. Because iron stores do not decrease, normal amounts of ferritin should be present in the plasma. Although iron stores may be depleted, inflammatory mediators may cause ferritin levels to remain normal. Patients with chronic inflammatory diseases such as rheumatoid arthritis may have reduced or deficient stores. ACD has many forms and must be distinguished from iron deficiency anemia so that inappropriate iron supplementation is not initiated.
Serum Iron
Serum iron measures the amount of circulating iron that is bound to transferrin. However, it is a relatively poor index of iron status because of large day-to-day changes, even in healthy individuals. Diurnal variations also occur, with the highest concentrations occurring midmorning (from 6 AM to 10 AM), and a nadir, averaging 30% less than the morning level, occurring midafternoon. Serum iron should be evaluated in light of other laboratory values and recent medical history to assess iron status.
Total Iron-Binding Capacity and Transferrin Saturation
Total iron-binding capacity (TIBC) is a direct measure of all proteins available to bind mobile iron and depends on the number of free binding sites on the plasma iron-transport protein transferrin. Each transferrin molecule binds ferric ions at each of two binding sites and two bicarbonate ions at separate sites. Intracellular iron availability regulates the synthesis and secretion of transferrin. Therefore the plasma transferrin concentration increases in those with iron deficiency. In addition, when the amount of stored iron available for release to transferrin decreases and dietary iron intake is low, saturation of transferrin decreases.
There are exceptions to the general rule that transferrin saturation decreases and TIBC increases in patients with iron deficiency. For example, TIBC increases in those with hepatitis. It also increases in people with hypoxia, women who are pregnant, or those taking oral contraceptives or receiving estrogen replacement therapy. On the other hand, TIBC decreases in those with malignant disease, nephritis, and hemolytic anemias. Furthermore, the plasma level of transferrin may be decreased in those with PEM, fluid overload, and liver disease. Thus, although TIBC and transferrin saturation are more specific than Hct or Hgb values, they are not perfect indicators of iron status.
An additional concern about the use of serum iron, TIBC, and transferrin saturation values is that normal values persist until frank deficiency actually develops. Thus these tests cannot detect decreasing iron stores and preanemic iron deficiencies.
Tests for Macrocytic Anemias from B Vitamin Deficiencies
Macrocytic anemias include megaloblastic anemia from folate deficiency and pernicious anemia with vitamin B12 deficiency. The nutritional causes of macrocytic anemia are related to the availability of folate and vitamin B12 (cobalamin) in the bone marrow and require evaluation of both nutrient levels. Both nutrients arrest DNA synthesis by preventing the formation of thymidine monophosphate. Folate and vitamin B12 are used at different steps of the synthetic pathway. Impaired RBC synthesis occurs and large, nucleated RBCs are then released into the circulation.
Assessing Folate and Vitamin B12 Status
Evaluation for macrocytic anemia includes static measurement of folate and vitamin B12 deficiency in blood. They can be assayed using tests of the ability of the patient’s blood specimen to support the growth of microbes that require either folate or vitamin B12, radiobinding assays, or immunoassays.
Serum Homocysteine: Folate and vitamin B12 are required for the synthesis of SAM, the biochemical precursor involved in the transfer of one-carbon (methyl) groups during many biochemical syntheses. SAM is synthesized from the amino acid methionine by a reaction that includes the addition of a methyl group and the purine base adenine (from ATP). For example, when SAM donates a methyl group for the synthesis of thymine, choline, creatine, epinephrine, and protein and DNA methylation, it is converted to S-adenosylhomocysteine. After losing the adenosyl group, the remaining homocysteine can either be converted to cysteine by the vitamin B6–dependent transsulfuration pathway or converted back to methionine in a reaction that depends on adequate folate and vitamin B12.
When either folate or vitamin B12 is lacking, the homocysteine-to-methionine reaction is virtually blocked, causing homocysteine to build up in the affected tissue and spill into the circulation. The vitamin B6–dependent transsulfuration pathway can metabolize excess homocysteine. Homocysteine has been shown to be very sensitive to folate and vitamin B12 deficiency.
Therefore an elevated homocysteine level indicates either genetic defects involved in the enzymes that catalyze these reactions or a deficiency in folate, vitamin B12, or vitamin B6. Research indicates that several folate gene polymorphisms contribute risk for several chronic cardiovascular and neurologic disorders (Albert et al., 2009; Fan et al., 2010).
Folate Assessment: Folate is most often simultaneously measured in whole blood with its combined plasma and blood cells, and in the serum alone. The difference between whole-blood folate and serum folate levels is then used to calculate total RBC folate concentration. RBC folate concentration is a better indicator of folate status than serum folate, because folate is much more concentrated in RBCs than in the serum. RBC folate measurement more closely reflects tissue stores and is considered the most reliable indicator of folate status. Folate is absorbed in the jejunum, and its malabsorption has several causes, but a specific test for folate absorption is not available. The presence and extent of deficiency should be assessed in patients with celiac disease, those who have had bariatric surgery, those with a history of long-term use of medications such as anticonvulsants and sulfasalazine, and chronic alcohol consumption. Chapter 5 discusses genetic markers affecting folate absorption and metabolism.
Vitamin B12 Assessment: Vitamin B12 is measured in the serum, and all indications are that the serum level gives as much information about vitamin B12 status as does the RBC level. If vitamin B12 status is compromised, intrinsic factor antibodies and parietal cell antibodies are measured; the presence of antibodies suggests the main cause of pernicious anemia. Historically the Schilling test was used to detect defects in vitamin B12 absorption; it is rarely used today because the test requires that the patient be given radioactive vitamin B12. Methylmalonic acid (MMA) levels in serum or urine are also useful to assess B12 status.
Vitamin B12 and Methylmalonic Acid: Once a genetic cause is ruled out, the most straightforward biochemical method for differentiating between folate and vitamin B12 deficiencies is to monitor the hyperhomocysteinemia by measuring the serum or urinary MMA level. MMA is formed during the degradation of the amino acid valine and odd-chain fatty acids. MMA is the side product in this metabolic pathway that increases when the conversion of methylmalonic coenzyme A (CoA) to succinyl CoA is blocked by lack of vitamin B12, a coenzyme for this reaction. Therefore deficiency leads to an increase in the MMA pool, which is reflected by the serum or urinary MMA level. The urinary MMA test is more sensitive than the serum B12 test because it indicates true tissue B12 deficiency. The serum MMA test may give falsely high values in renal insufficiency and intravascular volume depletion. The urinary MMA test is the only B12 deficiency assay that has been validated as a screening tool (Morris et al., 2005). Homocysteine and MMA tend to detect impending vitamin deficiencies better than the static assays. This is especially important when assessing the status of certain patients such as vegans or older adults, who could have vitamin B12 deficiency associated with central nervous system impairment.
Fat-Soluble Vitamins
Fat malabsorption often results in impaired absorption of vitamins A, E, D, and K. Factors including low luminal pH, bile salts below the critical micellar concentration, and inadequate triglyceride hydrolysis can interfere with normal bile salt micelle formation, causing impaired absorption of fat-soluble vitamins. Individuals with fat malabsorptive disorders, including those who have had bariatric surgery, are at greatest risk of deficiencies of fat-soluble vitamins. See Appendix 30 for further discussion of tests for assessing specific vitamin adequacy.
Vitamin A
Vitamin A status can be estimated using serum retinol and the normal level in adults is 30-80 mcg/dL. A primary deficiency of vitamin A can result from inadequate intake, fat malabsorption, or liver disorders. A secondary deficiency of vitamin A may be due to decreased bioavailability of provitamin A carotenoids or interference with vitamin A absorption, storage, or transport (e.g., celiac disease, cystic fibrosis, pancreatic insufficiency, malabsorptive weight loss surgery, or bile duct obstruction). Vitamin A deficiency is common in prolonged PEM. Because of shared absorptive mechanisms with vitamin D, serum retinol should always be assessed in the presence of vitamin D supplementation (see Chapter 3). Acute or chronic vitamin A toxicity is defined as retinol levels greater than 100 mcg/dL. Chronic vitamin A toxicities are associated with loss of hair; dry mucous membranes; dry, rough skin; and even cortical bone loss and fractures.
Vitamin D
Individual vitamin D status can be estimated by measuring plasma 25-hydroxy vitamin D (25-[OH]D3) levels. Current clinical practice reference ranges have been updated by the 2011 IOM (IOM, 2011). Traditional levels defining vitamin D sufficiency have been based on the lowest threshold value for plasma 25-(OH)D3 (approximately 80 nmol/L or 32 ng/mL) that prevents secondary hyperparathyroidism, increased bone turnover, bone mineral loss, or seasonal variations in plasma parathyroid hormone. The IOM review concluded that individuals are at risk of deficiency at serum 25(OH)D3 levels below 30 nmol or 12 ng/mL and that practically all persons have sufficient serum levels at 50 nmol or 20 ng/mL. Current clinical practice reference ranges define insufficiency as 50-80 nmol/L or 20-31 ng/mL, and deficiency is defined as less than 50 nmol/L or 20 ng/mL. Serum levels even higher at 90-100 nmol/L (36-40 ng/mL) are recommended by some (Bischoff-Ferrari et al., 2006). Optimal levels of 25(OH)D3 have not been defined and the measurement of serum levels lacks standardization and calibration.
A deficiency may be caused by inadequate dietary intake, inadequate exposure to sunlight, or malabsorption. Deficiency of vitamin D can also lead to secondary malabsorption of calcium. Calcium malabsorption occurs in chronic renal failure because renal hydroxylation is required to activate vitamin D, which promotes synthesis of a calcium-binding protein in intestinal absorptive cells (Mosekilde, 2005). See Chapter 36.
Vitamin K
Vitamin K status can be estimated using prothrombin time (PT). PT is used to evaluate the common pathway of blood clotting. The synthesis of clotting factors II, VII, IX, and X are vitamin K–dependent. Osteocalcin or bone G1a protein (BGP), a bone turnover marker, may also be used to assess vitamin K status. BGP is a vitamin K–dependent protein that is increased with bone formation and depressed with increased bone loss. A reduced vitamin K status is associated with reduced BGP or serum osteocalcin levels. The relationship may explain the pathophysiologic findings of vitamin K–deficiency osteoporosis.
Water-Soluble Vitamins And Trace Minerals
Vitamin B12 and folate are the most common water-soluble vitamin deficiencies reported in adults. Frank deficiencies of other water-soluble vitamins and trace minerals are uncommon in populations that consume a variety of whole foods and fortified foods. Thiamin deficiency has been reported in individuals who chronically consume high levels of alcohol with inadequate thiamin intake, in those with persistent vomiting, and in those with impaired absorption because of disease or surgery. To assess thiamin status, thiamin diphosphate in whole blood is measured because plasma and serum levels reflect recent dietary changes and may be misleading. Subclinical deficiencies of water-soluble vitamins and other trace minerals may be present in some individuals. However the current methodologies for evaluating nutritional status of these components are both expensive and controversial. See Appendix 30 for further discussion of tests for assessing specific vitamin and trace mineral adequacy.
Chronic Disease Risk Assessment
Lipid Indices of Cardiovascular Risk
Serum lipoprotein and cholesterol levels are directly implicated in the development of atherosclerosis and are affected by modifiable factors, including diet. Patients undergoing lipid assessments should be fasting for 12 hours at the time of blood sampling. Fasting is necessary primarily because triglyceride levels rise and fall dramatically in the postprandial state, and low-density lipoprotein (LDL) cholesterol values are calculated from measured total serum cholesterol and high-density lipoprotein cholesterol concentrations. This calculation, based on the Friedewald equation, is most accurate when triglyceride concentrations are less than 400 mg/dL. The Friedewald equation gives an estimate of fasting LDL cholesterol levels that is generally within 4 mg/dL of the true value when triglyceride concentrations are less than 400 mg/dL.
Risk for cardiovascular disease (CVD) appears to be more related to the number of atherogenic lipoprotein particles in the serum than it is to the total volume of cholesterol. Differentiating subparticles of LDL by size and grouping by pattern has been used; however, the subparticle testing is costly and findings do not serve as independent markers for risk (Box 8-2). In patients with metabolic syndrome, lowering LDL does not reflect similar reductions in LDL particle levels (Rosenson, 2008). LDL contains the atherogenic apolipoprotein B (apoB). Some researchers propose that measuring the concentration of apoB provides a direct measure of the number of circulating atherogenic lipoprotein particles and is superior to LDL for predicting probability of CVD (Barter, 2006; Brunzell, 2008). Clinicians may suggest testing the genetic profile for the apolipoprotein E (apoE) phenotype, which precedes CVDs in some populations (Chasman et al., 2009). Other inflammatory genes are under study. See Chapter 34 for further discussion of the lipid profile and cardiovascular risk.
Hemoglobin A1C and Diabetes
In adults with normal glucose control, approximately 4% to 6% of the total Hgb is glycosylated. The percent of glycohemoglobin in the blood is directly related to the average blood glucose levels for the preceding 2-3 months. Hemoglobin A1C (Hgb A1C) does not reflect more recent changes in glucose levels. It is useful in differentiating between short-term hyperglycemia in individuals under stress or who have had an acute myocardial infarction and diabetes. It has been added as a diagnostic criteria for diagnosis of diabetes mellitus once the initial value is confirmed by a repeat Hgb A1C >6.5% or plasma glucose >200 mg/dL (11 mmol/L). Hgb A1C is not used as a diagnostic criterion for gestational diabetes because of changes in red cell turnover (American Diabetes Association [ADA], 2011).
Hgb A1C can be correlated with daily mean plasma glucose. Each 1% change in Hgb A1C represents approximately 35 mg/dL change in mean plasma glucose. Test results are useful to provide feedback to patients about changes they have made in their nutritional intakes (ADA, 2011). See Chapter 31 for further discussion of Hgb A1C and diabetes management.
Oxidative Stress
Aging and many diseases, including CVD, Alzheimer disease, Parkinson disease, inflammatory bowel disease, and cancer, are initiated in part by oxidative stress as evidenced by free radical oxidation of lipids, nucleic acids, or proteins (Figure 8-2). Oxidative stress is imposed on cells as a result of three factors: (1) an increase in oxidant generation, (2) a decrease in antioxidant protection, or (3) a failure to repair oxidative damage. Cell damage is caused by reactive oxygen species (ROS). ROS are either free radicals, reactive anions containing oxygen atoms, or molecules containing oxygen atoms that can either produce free radicals or are chemically activated by them (Blanck et al., 2003). These products include the superoxide radical (O2−) hydroxyl radical (OH), and hydrogen peroxide. The formation of ROS is sometimes, but not always, mediated by certain essential trace elements (e.g., iron, copper, chromium, and nickel).
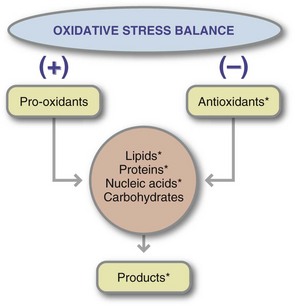
FIGURE 8-2 Steps in maintaining the balance between prooxidants (reactive oxygen species) and antioxidants. The compounds marked with an asterisk (*) have been used as markers of oxidative stress balance.
In the case of CVD, the ROS react with unsaturated fatty acids in LDL, creating lipid peroxides, another free radical species. Like all free radicals, lipid peroxides initiate the oxidation of other compounds, including apolipoprotein, the protein present in lipoproteins. This oxidation leads to the formation of free radical products throughout the large, heterogeneous lipoprotein particle. Cells associated with the arterial wall ingest the resulting oxidized lipoproteins. Once present in these cells, additional metabolism of this modified complex does not seem to occur. Over time, other pathophysiologic responses stabilize the deposited oxidized lipoprotein as atherosclerotic plaque.
Antioxidant Status
An indirect way of assessing the level of oxidative stress is to measure the levels of antioxidant compounds present in body fluids. Oxidative stress is related to levels of the following:
• Antioxidant vitamins (tocopherols and ascorbic acid)
• Dietary phytochemicals with antioxidant properties (e.g., carotenoids)
• Minerals with antioxidant roles (e.g., selenium)
• Endogenous antioxidant compounds and enzymes (e.g., superoxide dismutase, glutathione)
More precisely, the concentration of these compounds correlates with the balance between their intake and production and their use during the inhibition of free radical compounds.
Markers of Oxidative Stress
Biomarkers of oxidative stress status and inflammation have been associated with many chronic conditions and risk factors. Measurement of intracellular antioxidant thiols such as glutathione can be estimated using the free oxygen radical test via spectrophotometric techniques on specimens obtained from finger sticks. However, further standardization of protocols for assays and methods of combining and integrating multiple panels of biomarkers of oxidative stress and inflammation are needed to facilitate evaluation of biomarkers for risk factor prediction. Although some intervention studies examining the effects of dietary supplements, diet, and exercise on biomarkers of oxidative stress and inflammation have been done, the data have been inconclusive, and more studies are needed to understand the underlying mechanisms.
The most commonly used chemical markers of oxidative stress are presented in Table 8-5. Some tests measure the presence of one class of free radical products, and others measure the global antioxidant capacity of plasma or a plasma fraction. These tests have been promoted on the assumption that knowledge of the total antioxidant capacity of the plasma or plasma fraction might be more useful than knowledge of the individual concentrations of free radical markers or antioxidants. This total antioxidant activity is determined by a test that assesses the combined antioxidant capacities of the constituents. Unfortunately, the results of these tests include the antioxidant capacities of compounds such as uric acid and albumin, which are not compounds of interest. In other words, no one type of assay is likely to provide a global picture of the oxidative stress to which an individual is exposed. A new noninvasive method that may become useful in the future is a method that uses Raman spectroscopy in the biophotonic antioxidant laser scanner (see New Directions: Raman Spectroscopy Used to Measure Antioxidant Capacity).
TABLE 8-5
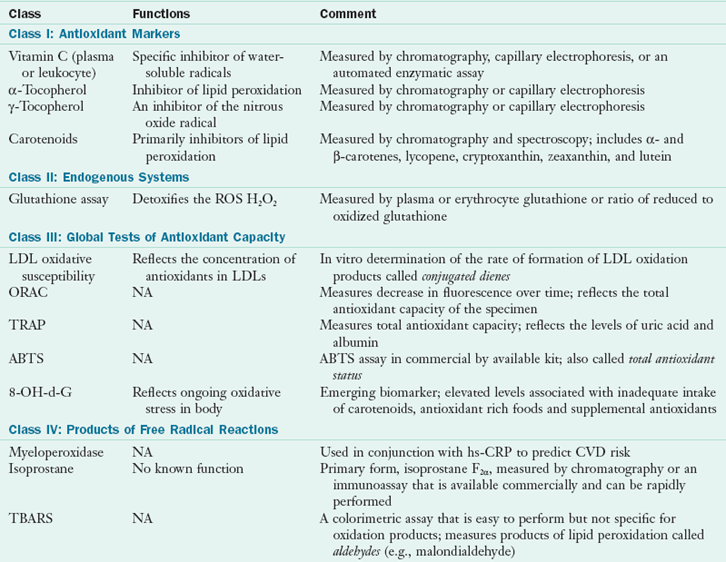
ABTS, 2,2′-Azino-bis (3-ethyl benzytiazoline-sulfonic acid); CVD, cardiovascular disease; H2O2, hydrogen peroxide; hs-CRP, high-sensitivity C-reactive protein; LDL, low-density lipoprotein; ORAC, oxygen radical absorbance capacity; NA, not applicable; ROS, reactive oxygen species; TBARS, thiobarbituric acid reactive substances; TRAP, total peroxyl radical trapping parameter; 8-OH-d-G, urinary 8-hydroxy-2′deoxyguanosine.
 New Directions
Raman Spectroscopy Used to Measure Antioxidant Capacity
Noninvasive measurements of clinical parameters are always preferable to those requiring blood, urine, or tissue. Raman spectroscopy is just such a measurement technique and may become widely used in the future. A laser light is pointed toward the fat pad of the palm. As the laser light penetrates the skin, the amount of carotenoids (all-trans-beta-carotene, lycopene, alpha-carotene, gamma-carotene, phytoene, phytofluene, sepapreno-betacarotene, dihydro-beta-carotene, astaxanthin, canthaxanthin, zeaxanthin, lutein, beta-apo-8′ carotenal, violaxanthins, and rhodoxanthin) is measured at the cellular level. Because all carotenoids have a carbon backbone with alternating carbon double and single bonds, the vibration of these bonds can be detected with Raman spectroscopy. Raman spectroscopy has been used to assess carotenoids in precancerous skin lesions as well as in the retina to assess early stages of macular degeneration (Ermakov et al., 2005).
Carotenoids are powerful antioxidants, and because they are part of the “antioxidant network,” a measure of their presence can give a good assessment of the antioxidant capacity of the cell. The Raman spectroscopy score also correlates inversely with urinary isoprostanes, a measure of oxidative stress (Carlson et al., 2006).
Serum carotenoids significantly correlate with skin carotenoids, as measured using Raman spectroscopy and the biophotonic laser scanner (Smidt et al., 2004; Zidichouski et al., 2004). Serum carotenoids are a good measure of the absorptive capacity of the individual (see Chapters 1 and 3). Thus an individual with a diet high in fruits and vegetables, and therefore large amounts of dietary carotenoids, usually has a high carotenoids antioxidant score. The antioxidant score, or the numeric result from this scan, can be used to determine how well a person is processing carotenoid antioxidants and whether the antioxidants are reaching the cell where they exert their protective functions. The number, which seems to be in the range of 40,000 and higher in those with optimal health, increases with greater consumption of carotenoid-containing fruits and vegetables, consumption of carotenoid-containing nutritional supplements, smoking cessation, and loss of excess body fat (Carlson et al., 2006). The measurement is quick, easy, and inexpensive, making it a possible assessment tool for nutrition professionals in the future.
Despite this lack of correlation or specificity of assays of oxidative stress, two assays seem promising. One is the immunoassay myeloperoxidase used in conjunction with CRP to predict CVD mortality risk (Heslop, 2010). The second assay is the measurement of the compounds F2 isoprostanes either in plasma or urine (Harrison and Nieto, 2004). This test measures the presence of a continuously formed free radical compound that is produced by free radical oxidation of specific polyunsaturated fatty acids. Isoprostanes are prostaglandin-like compounds that are produced by free radical mediated peroxidation of lipoproteins. Elevated isoprostane levels are associated with oxidative stress, and clinical situations of oxidative stress such as hepatorenal syndrome, rheumatoid arthritis, atherosclerosis, and carcinogenesis (Roberts and Fessel, 2004).
 Clinical Scenario 1
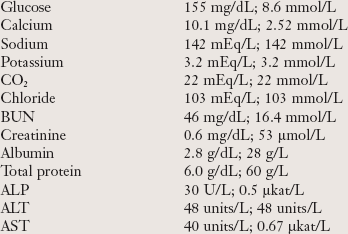
Clara is seen at County Hospital emergency room. She has a long history of yo-yo dieting and alcohol abuse. In the last 6 months she has had the stomach flu that lasted 4 days, seasonal flu, and colitis. She works at a retirement community as a kitchen assistant. One of the benefits of her job is one free meal the days she works. Clara keeps snack foods, beer, and soft drinks in her apartment and eats most meals at fast-food restaurants when she is not at work. Clara has called in sick to work for the past 3 days. She has a poor work history, and her employer questions her motives for missing work. Her employer told her if she is really too sick to come to work, she must see her doctor for a medical release to return to work. The emergency department doctor orders laboratory tests and Clara is admitted to the hospital. She tells the doctor that she cannot remember what has happened in the last few days. Her medical profile today is:
| Age | 32 years old |
| Height | 5′9″ |
| Weight | 285 lb |
| Frame | Large |
| Glucose | 142 mg/dL; 7.8 mmol/L |
| Calcium | 9.1 mg/dL; 2.27 mmol/L |
| Sodium | 149 mEq/L; 149 mmol/L |
| Potassium | 3.8 mEq/L; 3.8 mmol/L |
| CO2 | 25 mEq/L/ 25 mmol/L |
| Chloride | 106 mEq/L; 106 mmol/L |
| BUN | 30 mg/dL; 10.7 mmol/L |
| Creatinine | 0.9 mg/dL; 79.6 µmol/L |
| Albumin | 4.8 g/dL; 48 g/L |
| Total protein | 8.5 g/dL; 85 g/L |
| ALP | 35 U/L; 0.5 µkat/L |
| ALT | 28 units/L; 28 units/L |
| AST | 23 units/L; 0.38 µkat/L |
| Bilirubin, total | 1.5 mg/dL; 25.65 µmol/L |
| RBC | 5.1 × 10⁶ mL; 5.1 × 10¹² L |
| Hgb | 11.5 g/dL; 7.1 mmol/L |
| Hct | 28%; 0.28 |
| MCV | 102 mm3; 102 fL |
| MCH | 33 pg |
| MCHC | 26 g/dL; 26% |
| WBC | 12 × 10 9 |
ALP, Alkaline phosphate; ALT, alanine aminotransferase; AST, aspartate aminotransferase; BUN, blood urea nitrogen; CO2, carbon dioxide; Hct, hematocrit; Hgb, hemoglobin; MCH, mean corpuscular hemoglobin; MCHC, mean corpuscular hemoglobin concentration; MCV, mean corpuscular volume; RBC, red blood cell; WBC, white blood cell.
Clara is referred for medical nutrition therapy. Assess her nutrition status using the data provided. Note that Clara is scheduled for a series of tests. She is given intravenous fluids, a blood transfusion and is made NPO which means no food or fluid by mouth. The preliminary findings indicate several tumors obstructing the gall bladder. Exploratory surgery is scheduled tomorrow.
Nutrition Diagnostic Statement
Altered laboratory values related to disordered eating pattern as evidenced by signs of nutritional anemia and dehydration.
1. Estimate Clara’s energy and protein needs based on her anthropometric data.
2. Considering Clara’s medical history, what does her laboratory report for hemoglobin, hematocrit, mean corpuscular volume, mean corpuscular hemoglobin, and mean corpuscular hemoglobin concentration suggest?
3. What does her laboratory report for ALP, AST, and ALT values suggest?
4. What does her laboratory report for sodium, blood urea nitrogen, and creatinine suggest about her hydration status?
5. What does her laboratory report for blood urea nitrogen and creatinine suggest about her renal status?
6. How would you expect Clara’s laboratory tests to change 24 hours after major surgery?
7. What additional laboratory tests would be helpful for a comprehensive nutrition assessment?
Clinical Scenario 2
Omar is seen at the Western Medical Clinic today complaining of fatigue, fluttery heart beat, and tightness in his chest after he walks up two flights of steps. He works in a high-stress job as a computer software engineer. Omar has a history of high blood pressure and takes medication daily. He is concerned about his risk for heart disease. He has gained 18 pounds after quitting smoking and getting married a year ago. Omar eats breakfast and lunch at fast-food restaurants. His favorite foods are sweet rolls and fast foods. His wife prepares the evening meal. Omar reports drinking three to five beers nightly while watching television. He does not get any regular exercise except walking up two flights of steps at his office building. His medical profile is a follows: 39-year-old male; height: 5′10″; weight: 225 lb, large frame.
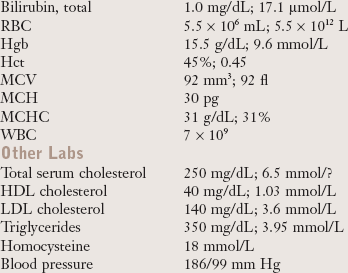
ALP, Alkaline phosphate; ALT, alanine aminotransferase; AST, aspartate aminotransferase; BUN, blood urea nitrogen; CO2, carbon dioxide; Hct, hematocrit; HDL, high-density lipoprotein; Hgb, hemoglobin; LDL, low-density lipoprotein; MCH, mean corpuscular hemoglobin; MCHC, mean corpuscular hemoglobin concentration; MCV, mean corpuscular volume; RBC, red blood cell; WBC, white blood cell.
Nutrition Diagnostic Statement
Altered laboratory values related to recent weight gain and smoking cessation as evidenced by elevated blood pressure, symptoms of metabolic syndrome, and dietary history.
1. Based on the health history, social history, fasting laboratory report, and medical profile, what risk factors does Omar have for chronic diseases?
2. Considering Omar’s medical profile, what does his laboratory report for glucose, blood urea nitrogen, sodium, potassium, and creatinine suggest?
3. What does his laboratory report for alkaline phosphate, aspartate aminotransferase, and alanine aminotransferase suggest?
4. What does his lipid profile and homocysteine suggest?
5. Omar is referred for medical nutrition therapy. Assess his nutrition status based on the data provided.
National Center for Health Statistics, National Health and Nutrition Examination Survey
http://www.cdc.gov/nchs/nhanes.htm
National Cholesterol Education Program—ATPIII Guidelines
http://www.nhlbi.nih.gov/guidelines/cholesterol/index.htm
The Merck Manual of Diagnosis and Therapy Section I—Nutritional Disorders
References
Albers, R, et al. Markers to measure immunomodulation in human nutrition intervention studies. Br J Nutr. 2005;94:452.
Albert, MA, et al. Candidate genetic variants in the fibrinogen, methylenetetrahydrofolate reductase, and intercellular adhesion molecule-1 genes and plasma levels of fibrinogen, homocysteine, and intercellular adhesion molecule-1 among various race/ethnic groups: data from the Women’s Genome Health Study. Am Heart J. 2009;157:777.
American Diabetes Association (ADA). Diagnosis and classification of diabetes mellitus. Diabetes Care. 2011;34(3):62.
Axelsson, J, et al. Serum retinol-binding protein concentration and its association with components of the uremic metabolic syndrome in nondiabetic patients with chronic kidney disease stage 5. Am J Nephrol. 2009;29:447.
Bajpai, A, et al. Should we measure C-reactive protein on earth or just on JUPITER? Clin Cardiol. 2010;33:190.
Barter, PJ, et al. Apo B versus cholesterol in estimating cardiovascular risk and in guiding therapy: report of the thirty person/ten-country panel. J Intern Med. 2006;259:247.
Bischoff-Ferrari, HA, et al. Estimation of optimal serum concentrations of 25-hydroxyvitamin D for multiple health outcomes. Am J Clin Nutr. 2006;84:18.
Blackburn, G, et al. Nutritional and metabolic assessment of the hospitalized patient. JPEN. 1977;1:11–21.
Blanck, HM, et al. Laboratory issues: use of nutritional biomarkers. J Nutr. 2003;133:888S.
Brunzell, JD, et al. Lipoprotein management in patients with cardiometabolic risk: consensus conference report from the American Diabetes Association and the American College of Cardiology Foundation. J Am Coll Cardiol. 2008;51:1512.
Campbell, WW. Synergistic use of higher-protein diets or nutritional supplements with resistance training to counter sarcopenia. Nutr Rev. 2007;65:416.
Carlson, JJ, et al. Associations of antioxidant status, oxidative stress with skin carotenoids assessed by Raman spectroscopy (RS). FASEB J. 2006;20:1318.
Chasman, DI, et al. Forty-three loci associated with plasma lipoprotein size, concentration, and cholesterol content in genome-wide analysis. PLoS Genet. 2009;5:e1000730.
Choi, S, et al. High plasma retinol binding protein-4 and low plasma adiponectin concentrations are associated with severity of glucose intolerance in women with previous gestational diabetes mellitus. J Clin Endocrinol Metab. 2008;93:3142.
Ermakov, IV, et al. Resonance Raman detection of carotenoids antioxidants in living human tissue. J Biom Opt. 2005;10:064028.
Fan, AZ, et al. Gene polymorphisms in association with emerging cardiovascular risk markers in adult women. BMC Med Genet. 2010;11:6.
Gottschlich MM, et al, eds. The science and practice of nutrition support: a case-based core curriculum. Dubuque, Ia: Kendall/Hunt Publishing, 2001.
Harrison, DG, Nieto, FJ. NHLBI Workshop on Oxidative Stress/Inflammation meeting proceedings. Bethesda, Md, 29 November 2004. Accessed 18 April 2010 from http://www.nhlbi.nih.gov/meetings/workshops/oxidative-stress.htm.
Hays, NP, et al. Effects of whey and fortified collagen hydrolysate protein supplements on nitrogen balance and body composition in older women. J Am Diet Assoc. 2009;109:1082.
Heslop, C, et al. Myeloperoxidase and C-reactive protein have combined utility for long-term prediction of cardiovascular mortality after coronary angiography. J Am Coll Cardiol. 2010;55:1102.
IOM (Institute of Medicine). Dietary Reference Intakes for Calcium and Vitamin D. Washington, DC: The National Academies Press.; 2011.
Klein, K, et al. Retinol-binding protein 4 in patients with gestational diabetes mellitus. J Women’s Health. Feb 2010. [E-pub ahead of print.].
Li, Z, et al. Serum retinol-binding protein 4 levels in patients with diabetic retinopathy. J Int Med Res. 2010;38:95.
Litchford, MD. Common denominators of declining nutritional status. Greensboro, N.C.: CASE Software & Books; 2009.
Litchford, MD. Laboratory assessment of nutritional status: bridging theory and practice. Greensboro, N.C.: CASE Software & Books; 2010.
Morris, MC, et al. Dietary folate and B12 intake and cognitive decline among community-dwelling older persons. Arch Neurol. 2005;62:641.
Mosekilde, L. Vitamin D and the elderly. Clin Endocrinol. 2005;62:265.
Roberts, LJ, Fessel, JP. The biochemistry of the isoprostane, neuroprostane, and isofuran pathways of lipid peroxidation. Chem Phys Lipids. 2004;128:173.
Rosenson, R, et al. Lipoprotein particles identify residual risk after lipid goal achievement in patients with the metabolic syndrome. Circulation. 2008;118:1151.
Smidt, CR, et al. Non-invasive Raman spectroscopy measurement of human carotenoid status. FASEB J. 2004;18:A480. [Abstract].
Thomas, C, Thomas, L. Anemia of chronic disease: pathophysiology and laboratory diagnosis. Lab Hematol. 2005;11:14.
Wang, ZM, Gallagher, D, Nelson, M. Total-body skeletal muscle mass: evaluation of 24-h urinary creatinine excretion by computerized axial tomography. AJCN. 1996;63(6):863–869.
Zidichouski, et al. Clinical validation of a novel Raman spectroscopic technology to non-invasively assess carotenoid status in humans. Am Coll Nutr. 2004;23:468.