Nutrition in Aging
The Older Population
Older adults in the United States are living longer, healthier, and more functionally fit lives than ever before. Life expectancy increased by 30 years in the twentieth century. Those born today can expect to live an average of 77.9 years. Women who reach age 65 can expect to live an additional 19.9 years, and men, 17.2 years. By the year 2020 the population older than age 65 will grow from approximately 40 million to 55 million, increasing from 13% to 20% of the population. The fastest-growing segment is those older than age 85, currently almost 6 million and increasing to almost 7 million in 2020. Members of minority groups will also increase from 20% to 24% of the older population (U.S. Administration on Aging [USAoA], 2010). See Figures 21-1 and 21-2.
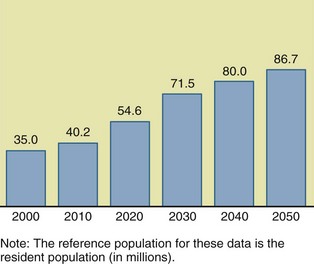
FIGURE 21-1 Population ages 65 and older: 2000 to 2050. (Data from He W et al: U.S. Census Bureau, current population reports, P23-209, 65+ in the United States: 2005, Washington, DC, 2005, U.S. Government Printing Office.)
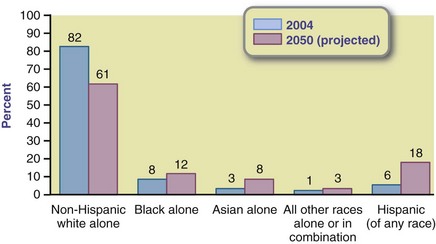
FIGURE 21-2 Percent of people ages 65 and older in poverty by sex, race, and Hispanic origin. Note: The term non-Hispanic white alone is used to refer to people who reported being white and no other race and who are not Hispanic. The term black alone is used to refer to people who reported being black or African American and no other race, and the term Asian alone is used to refer to people who reported only Asian as their race. Reference population: These data refer to the resident population. (U.S. Census Bureau: Population estimates and projections, 2000.)
By 2030 the number of older adults will exceed the number of school-age children in 10 states—Florida, Pennsylvania, Vermont, Wyoming, North Dakota, Delaware, New Mexico, Montana, Massachusetts, and West Virginia. A few years ago no state had more people older than age 65 than those younger than 18. Twenty-six states will double their older-than-65 population by 2030, when the oldest of the baby boomer generation enter their 80s. Growth in the older-than-65 population will equal 3.5 times the U.S. growth as a whole. This demographic shift has enormous social, economic, and political implications (He, 2005).
Women live longer than men. The older-than-65 female/male ratio is 136 : 100; it increases to 216 : 100 among those older than age 85. More than 72% of older men are married, whereas only 42% of older women are married. Half of women over age 75 live alone; thus more men die married and most women die unmarried.
Classification
Everyone knows people older than themselves, but those considered “old” depends a lot on one’s own age. Youngsters consider their 20- or 30-something parents old. Today gray hair color, wrinkles, retirement, or age 65 no longer defines old. Yet qualifying as an “older adult” is based on the minimum eligibility age of 65 in many federal programs. The U.S. Census Bureau uses a stratified system to define this generation-spanning age-group; those aged 65 to 74 are the young old; 75 to 84, old; and 85 or older, oldest old. Some consider today’s new old to be those in their 90s. The more than 100,000 centenarians alive today are no longer considered unique and many of them still live independently. See Focus On: Centenarians…Life in the Blue Zone.
 Focus On
Centenarians…Life in the Blue Zone
Centenarians are the fastest growing segment of older adults in the United Stated and in developed nations, including Japan. The worldwide estimate of centenarians is 450,000. The U.S. Census Bureau estimates for 2009 there are about 65,000 centenarians and more than 1 million by 2050. As with the aging population as a whole, women represent 85% of the long-lived. A new group of individuals older than age 110, supercentenarians, have sufficient numbers to merit dedicated research.
What is known about extremely long-lived individuals? Centenarians generally have delays in functional decline. They also tend to either never develop a chronic disease or develop one late in life. Much has been written about longevity in the southern Japanese prefecture of Okinawa. The ongoing Okinawa Centenarian Study suggests that low caloric intake may produce fewer destructive free radicals. This intake plus an active lifestyle, natural ability to combat the stresses of life, and a genetic predisposition favor a healthy, functional, longer life.
Buettner and colleagues (2008) worked with the National Institute on Aging to identify communities around the world where people are living longer and living measurably better. They called these areas, where people reach the age of 100 at rates 10 times greater than in the United States, the Blue Zones. One such community was Okinawa. Others included the Nicoya Peninsula in Costa Rica and Sardinia in Italy. Residents of Loma Linda in California boast the longest life spans in America. They found that these groups had common characteristics related to food: very little animal protein and four to six servings of fruits, vegetables, legumes, and nuts. But eating wisely is only part of what seems to be a prescription for long life. The people of these communities don’t smoke and make regular low-intensity exercise part of their daily routine (e.g., gardening, walking). They are people who can articulate their purpose in life, are spiritually fulfilled, and have strong social networks.
In the New England Centenarian Study, independent function to at least age 90 is a predominant feature. Other important factors are that few centenarians are obese, they rarely smoke, and they consume little or no alcohol. At least 50% of centenarians have first-degree relatives or grandparents who also achieved very old age, and many have exceptionally old siblings (Boston University School of Medicine, 2010).
Gerontology + Geriatrics = The Spectrum Of Aging
Gerontology is the study of normal aging, including factors in biology, psychology, and sociology. Geriatrics is the study of the chronic diseases frequently associated with aging, including diagnosis and treatment. Although medical nutrition therapy has commonly been practiced in hospitals, nutrition services have moved out of hospitals and into homes and communities where the focus is on health promotion, risk reduction, and disease prevention.
Nutrition In Health Promotion And Disease Prevention
In aging nutrition care is not only disease management or medical nutrition therapy; it has broadened with a stronger focus on healthy lifestyles and disease prevention. Without increased emphasis on better diets and more physical activity at all ages, health care expenditures will rise exorbitantly as the population ages. Thus it is never too late to emphasize nutrition for health promotion and disease prevention. Older Americans, more than any other age group, want health and nutrition information and are willing to make changes to maintain their independence and quality of life. They often need help in improving self-care behaviors. They want to know how to eat healthier, exercise safely, and stay motivated.
Nutrition may include three types of preventive services. In primary prevention, the emphasis is on nutrition in health promotion and disease prevention. Pairing healthy eating with physical activity is equally important.
Secondary prevention involves risk reduction and slowing the progression of chronic nutrition-related diseases to maintain functionality and quality of life. Functionality is perceived as a positive way to discuss fitness versus disability and dependence, because the term exercise is not appealing. Many community dining centers funded through the Older Americans Act (OAA) Nutrition Programs attract participants through new fitness programs
In tertiary prevention, case management and discharge planning often involve chewing and appetite problems, modified diets, and functional limitations. Complicated cases are often influenced by nutrition issues; case managers can benefit from consulting with dietitians (see New Directions: Providing Health Care for Older Americans Means Jobs).
 New Directions
Providing Health Care for Older Americans Means Jobs
Registered dietitians (RDs) were identified by the Institute of Medicine in 2000 as “the single group with the standardized education and clinical training necessary to be directly reimbursed through Medicare as providers of nutrition therapy.” The projected growth for dietitians is 15% overall, but a remarkable 70% in home and residential care. The Centers for Medicare and Medicaid Services is contracting with chronic care improvement programs for individuals with nutrition-related conditions, including heart failure, diabetes, and chronic obstructive pulmonary disease. RDs have more opportunities because of the major expansion of medical nutrition therapy under the Medicare Reform/Prescription Drug Law.
There are few college nutrition courses on healthy aging, but many on maternal and child health. Nutrition textbooks have focused on geriatric illnesses and malnutrition (O’Neill et al., 2005). There is a need to better prepare future RDs for these new opportunities. Nutrition students are encouraged to work with older adults because jobs are growing rapidly and financial incentives are strong.
Improving knowledge and attitudes about aging takes exposure to positive RD role models and older adults in a wide variety of settings. There are opportunities in service projects, internship placements, and summer externships at community dining centers, retirement centers, and assisted living and continuous-care facilities. Volunteering at food banks on days when older adults are scheduled to pick up groceries, teaming up with volunteers who deliver meals to the frail homebound, and participating in mealtime assistance for nursing home residents who cannot eat independently are good opportunities. Student associations can sponsor activities that foster interactions across the spectrum of aging, from the well active to the frail needy.
Full-time RDs have been shown to improve the quality of nursing home care because their expertise is essential to prevent unintended weight loss, dehydration, and pressure ulcers. Assisted living facilities and continuous-care communities present job opportunities as they expand and serve more at-risk persons. Positive experiences are sure to reduce ageist stereotypes, increase interest, and develop the skills needed to ride America’s age wave.
Theories On Aging
Gerontologists study aging and have diverse theories about why the body ages. No single theory can fully explain the complex processes of aging. A good theory should integrate knowledge and tell how and why phenomena are related. Broadly, theories can be grouped into two categories: predetermined and accumulated damage. A loss of efficiency comes about as some cells wear out, die, or are not replaced. This is sometimes referred to as the one percent rule; most organ systems lose approximately 1% of their functioning each year, starting at age 30. A recent theory is that the cause of age-related health decline is malfactioning telomeres. So far the studies are in mice (Sahin et al., 2011). Most likely several theories explain the heterogeneity in older populations. See Table 21-1.
TABLE 21-1
| Category | Theory | Description |
| Predetermination: A built-in mechanism determines when aging begins and time of death | Pacemaker theory | “Biologic clock” is set at birth, runs for a specified time, winds down with aging, and ends at death. |
| Genetic theory | Life span is determined by heredity. | |
| Rate of living theory | Each living creature has a finite amount of a “vital substance,” and, when it is exhausted, the result is aging and death. | |
| Oxygen metabolism theory | Animals with the highest metabolisms are likely to have the shortest life spans. | |
| Immune system theory | Cells undergo a finite number of cell divisions that eventually cause deregulation of immune function, excessive inflammation, aging, and death. | |
| Accumulated damage: Systemic breakdown over time | Crosslink theory | With time proteins, DNA and other structural molecules in the body make inappropriate attachments, or crosslinks, to each other, leading to decreased mobility, elasticity, and cell permeability. |
| Wear-and-tear theory | Years of damage to cells, tissues, and organs eventually take their toll, wearing them out and ultimately causing death. | |
| Free radical theory | Accumulated, random damage caused by oxygen radicals slowly cause cells, tissues, and organs to stop functioning. | |
| Somatic mutation theory | Genetic mutations caused by oxidizing radiations and other factors accumulate with age, causing cells to deteriorate and malfunction. |
Physiologic Changes
Aging is a normal biologic process. However, it involves some decline in physiologic function. Organs change with age. The rates of change differ among individuals and within organ systems. It is important to distinguish between normal changes of aging and changes caused by chronic disease such as atherosclerosis.
The human growth period draws to a close at approximately age 30, when senescence begins. Senescence is the organic process of growing older and displaying the effects of increased age. Disease and impaired function are not inevitable parts of aging. Nevertheless, there are certain systemic changes that occur as part of growing older. These changes result in varying degrees of efficiency and functional decline. Factors such as genetics, illnesses, socioeconomics, and lifestyle all determine how aging progresses for each person. Indeed, one’s outward expression of age may or may not reflect one’s chronologic age and there is a need to eliminate ageist stereotypes. See Figure 21-3.

FIGURE 21-3 Enjoying a meal together, these older people are interested in knowing how good nutrition can keep them vigorous and healthy. (© 2011 Photos.com a division of Getty Images. All rights reserved.)
Body Composition
Body composition changes with aging. Fat mass and visceral fat increase, whereas lean muscle mass decreases. Sarcopenia, the loss of muscle mass, strength, and function, can be age-related, and can significantly affect an older adult’s quality of life by decreasing mobility, increasing risk for falls, and altering metabolic rates (Janssen, 2009; Thomas, 2010). Sarcopenia accelerates with a decrease in physical activity, but weight-bearing exercise can slow its pace. Although inactive persons have faster and greater losses of muscle mass, sarcopenia is also found in active older individuals, to a lesser degree. Currently no specified degree of lean body mass loss determines the diagnosis of sarcopenia. All losses are important because of the close connection between muscle mass and strength. By the fourth decade of life evidence of sarcopenia is detectable, and the process accelerates after approximately age 75.
Sarcopenic obesity is the loss of lean muscle mass in older persons with excess adipose tissue. Together the excess weight and decreased muscle mass exponentially compound to further decrease physical activity, which in turn accelerates sarcopenia. An extremely sedentary lifestyle in obese persons is a major detractor from quality of life.
Sedentary lifestyle choices can lead to sedentary death syndrome (SeDS), a phrase coined by The President’s Council on Physical Fitness. It describes the life-threatening health problems caused by a sedentary lifestyle. Sedentary lifestyle can be defined as a level of inactivity below the threshold of the beneficial health effects of regular physical activity or, more simply, burning fewer than 200 calories in physical activity per day. The Surgeon General’s Vision for a Healthy and Fit Nation 2010 emphasizes health consequences of inactivity as greater risk for cardiovascular disease (CVD), hypertension, diabetes, dyslipidemia, obesity, overweight, and even death (U.S. Department of Health and Human Services, 2010).
Few older adults achieve the minimum recommended 30 or more minutes of moderate physical activity on 5 or more days per week. Only 22% of adults older than age 65 report engaging in regular leisure time physical activity (Centers for Disease Control and Prevention, 2006). Inactivity is more common in older people than younger people; women often report no leisure-time activity. The American College of Sports Medicine position emphasizes that all older adults should engage in regular physical activity and avoid an inactive lifestyle (American College of Sports Medicine, 2009). The Centers for Disease Control and Prevention (2010) quantifies the amount of exercise older adults need and the National Institute on Aging (2010) has a guide for physical activity.
Taste and Smell
Sensory losses affect people to varying degrees, at varying rates, and at different ages (Benelam, 2009; Schiffman, 2009). Genetics, environment, and lifestyle are all part of the decline in sensory competence. Age-related alterations to the sense of taste, smell, and touch can lead to poor appetite, inappropriate food choices, and lower nutrient intake. Although some dysgeusia (altered taste), loss of taste, or hyposmia (decreased sense of smell) are attributable to aging, many changes are due to medications. Other causes include conditions such as Bell’s palsy; head injury; diabetes; liver or kidney disease; hypertension; neurologic conditions, including Alzheimer’s disease and Parkinson’s disease; and zinc or niacin deficiency. Untreated mouth sores, tooth decay, poor dental or nasal hygiene, and cigarette smoking also can decrease these senses.
Because taste and smell sensation thresholds are higher, older adults may be tempted to over-season foods, especially to add more salt, which may have a negative effect in many older adults. Because taste and smell stimulate metabolic changes such as salivary, gastric acid, and pancreatic secretions and increases in plasma levels of insulin, decreased sensory stimulation may impair these metabolic processes as well.
Hearing and Eyesight
In the United States 30% to 35% of adults ages 65 to 75 and 50% of those older than age 75 have some degree of hearing loss (National Institute on Deafness, 2006). Approximately one in four older adults who need a hearing aid actually use one. The most common type of hearing loss is presbycusis. This loss is usually greater in the high-pitched tonal range (e.g., telephone ring). The cumulative effect of exposure to daily noises such as traffic, construction, loud music, noisy office, and machines causes a change to the inner ear complex. The change occurs slowly over time, and sufferers may not be aware of the loss.
Some vitamins may play a part in hearing loss. Vitamin B12, a nutrient often found to be deficient in the diets of older adults, has been associated with increased ringing in the ears, presbycusis, and reduced auditory brainstem response. Vitamin D may have an effect on hearing loss because of the role it plays in calcium metabolism, fluid and nerve transmission, and bone structure.
Vision loss is not a part of normal aging. However, everyone’s vision changes with age. For most the changes are small and correctable with glasses, improved lighting, or large print. Reading glasses often become necessary in the fourth decade of life.
Immunocompetence
As immunocompetence declines with age, immune response is slower and less efficient. Changes occur at all levels of the immune system, from chemical alterations within the cells to differences in the kinds of proteins found on the cell surface and even to mutations to entire organs. The progressive decline in T-lymphocyte function and cell-mediated immunity contributes to the increased infection and cancer rates seen in aging populations. The mechanisms of age-related changes in immune function are not fully understood but likely depend on environmental factors and lifestyle choices that affect overall immune function. Maintaining good nutritional status promotes good immune function.
Oral
Diet and nutrition can be compromised by poor oral health. Tooth loss, use of dentures, and xerostomia (dry mouth) can lead to difficulties in chewing and swallowing. Decreases in taste sensation and saliva production make eating less pleasurable and more difficult. Oral diseases and conditions are common among Americans who grew up without the benefit of community water fluoridation and other fluoride products. Missing, loose, or rotten teeth or poor-fitting, painful dentures make it difficult to eat some foods. People with these mouth problems often prefer soft, easily chewed foods and avoid some nutritionally dense options such as whole grains, fresh fruits and vegetables, and meats.
The nutrition-related consequences of taking five or more medications or over-the-counter drugs daily (polypharmacy) are significant. More than 400 commonly used medications can cause dry mouth. See Chapter 9. Preparing foods that are moisture-rich such as hearty soups and stews, adding sauces, and pureeing and chopping foods can all make meals easier to eat. In addition, those with poor oral health may benefit from fortified foods with increased nutrient density. Although 30% of today’s adults 65 years and older no longer have any natural teeth, tooth loss is no longer part of normal aging.
Gastrointestinal
Some gastrointestinal (GI) changes may be age-related. Rather than ascribing any of these disorders to aging, the true clinical cause should be determined. GI changes can negatively affect a person’s nutrient intake, starting in the mouth. Dysphagia, a dysfunction in swallowing, is commonly associated with neurologic diseases and senility. It increases the risk for aspiration pneumonia, an infection caused by food or fluids entering the lungs. Thickened liquids and texture-modified foods can help people with dysphagia eat safely. The National Dysphagia Diet is in Appendix 35 and appropriate levels of texture modification are also defined in Chapter 41.
Gastric changes can also occur. Decreased gastric mucosal function leads to an inability to resist damage such as ulcers, cancer, and infections. Gastritis causes inflammation and pain, delayed gastric emptying, and discomfort. These all affect the bioavailability of nutrients such as calcium and zinc and increase the risk of developing a chronic deficiency disease such as osteoporosis.
Achlorhydria is the insufficient production of stomach acid. Approximately 30% of those older than age 50 have achlorhydria. Sufficient stomach acid and intrinsic factor are required for the absorption of vitamin B12. Although substantial amounts are stored in the liver, B12 deficiency does occur. Symptoms, often misdiagnosed because they mimic Alzheimer’s disease or other chronic conditions, include extreme fatigue, dementia, confusion, and tingling and weakness in the arms and legs (see Chapters 3, 33 and 41).
The incidence of diverticulosis increases with age. Half of the population older than age 60 develop it, but only 20% of them have clinical manifestations. The most common problems with diverticular disease are lower abdominal pain and diarrhea (see Chapter 29).
Constipation is defined as having fewer bowel movements than usual, having difficulty or excessive straining at stool, painful bowel movements, hard stool, or incomplete emptying of the bowel. Older adults are more likely than younger adults to become constipated. Primary causes include insufficient fluids, lack of physical activity, and low intake of dietary fiber. Constipation is also caused by delayed transit time in the gut and some medications like narcotics. (See Chapter 9).
Cardiovascular
CVD includes heart disease and stroke. Although the effects of CVD are often measured by deaths in later life, it is not a disease of aging. This nutrition-related disease has its roots in unhealthy food choices made throughout one’s lifetime (Neidert, 2005). CVD is the leading cause of deaths in both genders in the United States, in all racial and ethnic groups. CVD age-related changes are extremely variable and are affected by environmental influences such as smoking, exercise, and diet. Changes include decreased arterial wall compliance, decreased maximum heart rate, decreased responsiveness to b-adrenergic stimuli, increased left ventricle muscle mass, and slowed ventricular relaxation. Often the end result of hypertension and artery disease is chronic heart failure. A low sodium diet and fluid restriction is integral to the treatment of this condition. These necessary diet restrictions in conjunction with other side effects of heart failure often lead to decreased nutrient consumption. See Chapter 34 for discussion of the multifaceted approach required to manage CVD in the elderly.
Renal
Age-related changes in renal function vary tremendously. Some older adults experience little change, whereas others can have devastating, life-threatening change. On average glomerular filtration rate, measured in creatinine clearance rates, declines by approximately 8 to 10 mL/min/1.73m2/decade after age 30 to 35. The resulting increase in serum creatinine concentrations should be considered when determining medication dosages. The progressive decline in renal function can lead to an inability to excrete concentrated or dilute urine, a delayed response to sodium deprivation or a sodium load, and delayed response to an acid load. Renal function is also affected by dehydration, diuretic use, and medications, especially antibiotics.
Neurologic
There can be significant age-related declines in neurologic processes. Cognition, steadiness, reactions, coordination, gait, sensations, and daily living tasks can decline as much as 90% or as little as 10%. On average, the brain loses 5% to 10% of its weight between the ages of 20 and 90, but most if not all neurons are functional until death unless a specific pathologic condition is present.
It is important to make the distinction between normal, age-related decline and impairment from conditions such as dementia, a disease process. Memory difficulties do not necessarily indicate dementia, Alzheimer’s disease, Parkinson’s disease, or any mental disorder (see Chapter 41). Many changes in memory can be attributed to environmental factors, including stress, chemical exposure, and poor diet rather than to physiologic processes. However, even mild cognitive impairment that affects approximately 20% of those older than age 70 may affect eating, chewing, and swallowing, thus increasing the risk of malnutrition.
Common Health Problems
Age-related macular degeneration (AMD) is the leading cause of blindness in people older than age 65 in the United States; it may also be linked to an increased risk for stroke (Wong, 2006). AMD occurs when the macula, the center part of the retina, degrades. The result is central vision loss. The macular pigment is composed of two chemicals, lutein and zeaxanthin. A diet rich in fruits and vegetables may help delay or prevent the development of AMD. Zinc has also been shown to decrease the risk of developing AMD. Finally, correcting obesity and smoking are modifiable factors that can reduce progression of AMD (Clemons, 2006).
Glaucoma is damage to the optic nerve resulting from high pressure in the eye. It is the second most common cause of vision loss in the United States and affects approximately 3 million Americans. Hypertension, diabetes, and CVD all increase the risk of glaucoma.
A cataract is a clouding of the lens of the eye. Approximately half of Americans 65 and older have some degree of clouding of the lens. The most common treatment is surgery; the clouded lens is removed and replaced with a permanent prosthetic lens. A diet high in antioxidants such as beta-carotene, selenium, resveratrol, and vitamins C and E may delay cataract development. Studies show that a high sodium intake may increase risk of cataract development. Ultraviolet (UV) radiation exposure is directly related to 5% of worldwide cataracts. When the UV index is 3 and above, protective sunglasses are recommended (World Health Organization, 2009).
Diabetic retinopathy is a complication of diabetes (see Chapter 31). It occurs when blood vessels of the retina leak and produce spotty hemorrhages. Not all persons with diabetes develop retinopathy; blood glucose control can help protect the retina from damage.
All forms of vision loss can negatively affect nutritional status. Those with moderate-to-severe vision loss may have difficulty shopping for, identifying, and preparing foods and self-feeding.
Depression
Psychological changes often manifest as depression and its extent can vary widely from person to person. Among older persons depression is often caused by other conditions such as heart disease, stroke, diabetes, cancer, grief, or stress. Depression in older people is frequently undiagnosed or misdiagnosed because symptoms are confused with other medical illnesses. Untreated depression can have serious side effects for older adults. It diminishes the pleasures of living, including eating; it can exacerbate other medical conditions; and it can compromise immune function. It is associated with decreased appetite, weight loss, and fatigue. Nutritional care plays an important role in addressing this condition (see Chapter 42). Providing nutrient- and calorie-dense foods, additional beverages, texture-modified foods, and favorite foods at times when people are most likely to eat the greatest quantity can be very effective. In that comorbidities lead to polypharmacy and concern regarding drug-drug interactions, providers may choose to omit antidepressants, which leaves the depression untreated.
Pressure Ulcers
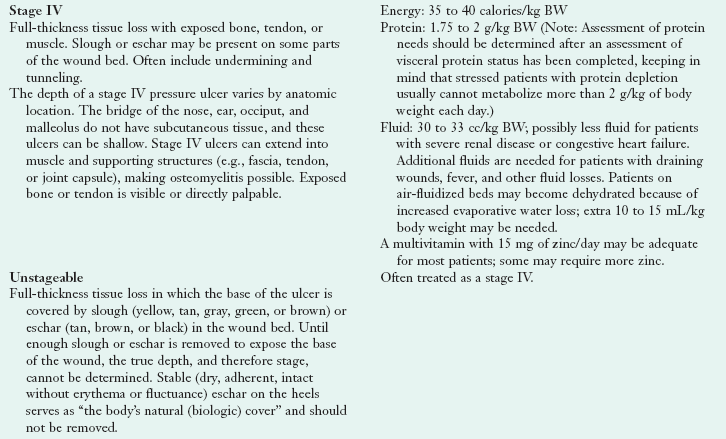
Pressure ulcers, formerly called bedsores or decubitus ulcers, develop from continuous pressure that impedes capillary blood flow to skin and underlying tissue. Several factors contribute to the formation of pressure ulcers, but impaired mobility and urinary incontinence are key. Older adults with neurologic problems, those heavily sedated, and those with dementia are often unable to shift positions to alleviate pressure. Paralysis, incontinence, sensory losses, and rigidity can all contribute to the problem. Notably malnutrition (inadequate protein) and undernutrition (inadequate energy intake) set the stage for its development and can delay wound healing. The escalating chronic nature of pressure ulcers in bed-ridden or sedentary elderly requires vigilant attention to nutrition.
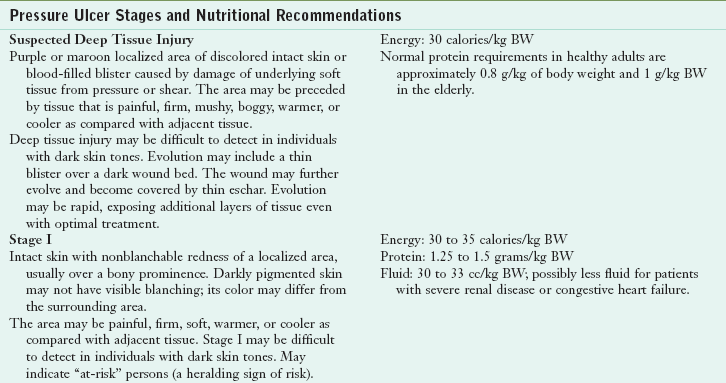
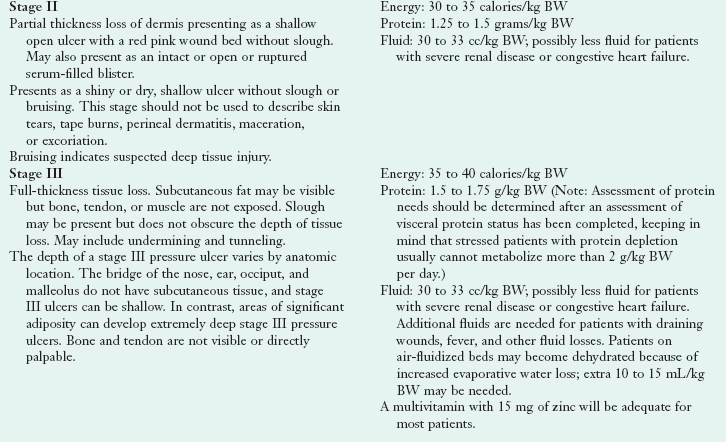
Several classification systems exist to describe pressure ulcers. The four stages of pressure ulcers, based on the depth of the sore and level of tissue involvement, are described in Table 21-2. Thomas (2009) suggests that wound nutrition equals whole-body nutrition, and coordinated efforts of a multidisciplinary treatment team are important. Nutrition recommendations for the treatment of pressure ulcers are as follows (Doley, 2010; Thomas, 2009):
Frailty and Failure to Thrive
The four syndromes known to be predictive of adverse outcomes in older adults that are prevalent in patients with frailty or “geriatric failure to thrive” include impaired physical functioning, malnutrition, depression, and cognitive impairment. Symptoms include weight loss, decreased appetite, poor nutrition, dehydration, inactivity, and impaired immune function. Interventions should be directed at easily remediable contributors in the hope of improving overall functional status. Nutrition interventions, especially those rectifying protein-energy malnutrition (PEM), are essential.
Quality Of Life
Quality of life is a general sense of happiness and satisfaction with one’s life and environment. Health-related quality of life is the personal sense of physical and mental health and the ability to react to factors in the physical and social environments. To assess health-related quality of life, common measures and scales, either general or disease-specific, can be used. Because older age is often associated with health problems and decrease in functionality, quality-of-life issues become relevant.
Food and nutrition contribute to one’s physiologic, psychological, and social quality of life. A measure of nutrition-related quality of life has been proposed to document quality-of-life outcomes for individuals receiving medical nutrition therapy. Effective strategies to improve eating and thereby improve nursing home residents’ quality of life are well established but could be more widely implemented (Kamp et al., 2010; Neidert, 2005).
Functionality
Functionality and functional status are terms used to describe physical abilities and limitations in, for example, ambulation. Functionality, the ability to perform self-care, self-maintenance, and physical activities, correlates with independence and quality of life. Disability rates among older adults are declining, but the actual number considered disabled is increasing as the size of the aging population grows. Limitations in activities of daily living (ADLs) (toileting, bathing, eating, dressing) and instrumental activities of daily living (IADLs) such as managing money, shopping, telephone use, travel in community, housekeeping, preparing meals, taking medications correctly, and other individual self-performance skills needed in everyday life, are used to monitor physical function.
Many nutrition-related diseases affect functional status in older individuals. Inadequate nutrient intake may hasten loss of muscle mass and strength, which can have a negative effect on performing ADLs. Among the older adults who have one or more nutrition-related chronic diseases, impaired physical function may cause greater disability, with increased morbidity, nursing home admissions or death.
Weight Maintenance
The prevalence of obesity in all ages has increased during the past 25 years in the United States; older adults are no exception. Obesity rates are greater among those ages 65 to 74 than among those age 75 and older. Obesity is associated with increased mortality and contributes to many chronic diseases: type 2 diabetes, heart disease, hypertension, arthritis, dyslipidemia, and cancer. Obesity causes a progressive decline in physical function, which may lead to increased frailty. Overweight and obesity can lead to a decline in IADLs.
Current data demonstrate that weight-loss therapy improves physical function, quality of life, and reduces the medical complications associated with obesity in older persons (Villareal, 2005). Accordingly, weight loss therapies that maintain muscle and bone mass are recommended for obese older adults. Lifestyle changes that include diet, physical activity, and behavior modification techniques are the most effective. The goals of weight loss and management for adults are the same for the general population, and should include prevention of further weight gain, or reduction of body weight, and maintenance of long-term weight loss.
Weight loss of 10% of total body weight over 6 months should be the initial goal. After that, strategies for maintenance should be implemented. Dietary changes include an energy deficit of 500-1000 kcal/day. Usual caloric goals range from 1200-1800 kcal/day but should not be less than 800 kcal/day. It is critical for the older adult on a calorie-restricted diet to meet nutrient requirements. This may necessitate the use of a multivitamin or mineral supplement as well as nutrition education.
Underweight and Malnutrition
The actual prevalence of underweight among older adults is quite low; older women older than age 65 are three times as likely as their male counterparts to be underweight (Federal Interagency Forum, 2008). However, many older adults are at risk for undernutrition and malnutrition. Among those hospitalized, 40% to 60% are malnourished or at risk for malnutrition, 40% to 85% of nursing home residents have malnutrition, and 20% to 60% of home care patients are malnourished. Many community-residing older persons consume fewer than 1000 kcal/day, an amount not adequate to maintain good nutrition. Some causes of undernutrition include medications, depression, decreased sense of taste or smell, poor oral health, chronic diseases, dysphagia, and other physical problems that make eating difficult. Social causes may include living alone, inadequate income, lack of transportation, and limitations in shopping for and preparing food.
Health care professionals frequently overlook PEM. The physiologic changes of aging, as well as changes in living conditions and income, all contribute to the problem. Symptoms of PEM are often attributed to other conditions, leading to misdiagnosis. Some common symptoms are confusion, fatigue, and weakness. Older adults with low incomes, who have difficulty chewing and swallowing meat, who smoke, or engage in little or no physical activity are at increased risk of developing PEM.
Strategies to decrease PEM include increased caloric and protein intake. In a clinical setting nutritional oral supplements and enteral feedings may be used. Frailty is often related to micronutrient deficiencies, especially in women (Michelon, 2006). Older malnourished adults are at risk of refeeding syndrome when they begin to receive nutrition support, and this should be assessed (see Chapter 14).
In a community setting older adults should be encouraged to eat energy-dense and high-protein foods. Diet restrictions should be liberalized to offer more choices. Adding gravies and creams can increase calories and soften foods for easier chewing (Joshipura, 2009). Federal food and nutrition services are also available for older adults.
Nutrition Screening And Assessment
The Mini Nutritional Assessment (MNA) (Bauer, 2008) includes two sections: screening and assessment. The Short Form is the most widely used screening method to identify malnutrition in noninstitutionalized older adults. It includes six questions and a body mass index (BMI) evaluation, or a calf circumference, if a BMI is not possible. The MNA Short Form has been validated (Kaiser, 2009). For a complete nutrition assessment, the full MNA is used. It is the most commonly used assessment tool in long-term care (see Figs 4-4 and 4-5.).
Some assessment measures are not necessarily accurate or feasible to use with older adults (Morley, 2009). Physical and metabolic changes of aging can yield inaccurate results. An illustration of this is anthropometric measurements such as height and weight, and BMI. With aging, fat mass increases and height decreases as a result of vertebral compression (Villareal, 2005). An accurate height measure may be difficult in those unable to stand up straight, the bed bound, those with spinal deformations such as a dowager’s hump, and those with osteoporosis. Measuring arm span or knee height may give more accurate measurements. See Appendix 20. BMIs based on questionable heights are inaccurate. Clinical judgment is needed for accuracy.
Body composition measures may also be ineffective. Skin-fold thickness and mid-arm circumference used to detect changes in body fat are limited in their ability to distinguish between changes in fat and muscle mass, because of decreased elasticity and increased compressibility of older skin. Mid-arm muscle circumference measures may be more accurate and sensitive to weight change than overall body composition measurements.
Nutrition Needs
Many older adults have special nutrient requirements because aging affects absorption, use, and excretion of nutrients (Kuczmarski and Weddle, 2005). The dietary reference intakes (DRIs) separate the cohort of people age 50 and older into two groups, ages 50-70 and 71 and older. Based on the Healthy Eating Index, older Americans need to increase their intakes of whole grains, dark green and orange vegetables, legumes, and milk; choose more nutrient-dense forms of foods, that is, foods low in solid fats and free of added sugars; and lower their intake of sodium and saturated fat (Juan, 2008). Other studies show that older persons have low intakes of calories, total fat, fiber, calcium, magnesium, zinc, copper, folate, and vitamins B12, C, E, and D (Box 21-1).
The Mifflin-St. Jeor energy equation can be used to assess calorie needs in older adults (see Chapter 2). DRI tables (Table 21-3; see inside cover) can also be used. Here, DRIs for energy suggest 3067 kcal/day for men and 2403/day for women 18 years; subtract 10 kcal/day for men and 7 kcal/day for women for each year of age older than 19 years.
TABLE 21-3
Nutrient Needs Change With Aging
| Nutrient | Changes with Aging | Practical Solutions |
| Energy | Basal metabolic rate decreases with age because of changes in body composition. Energy needs decrease ∼3% per decade in adults. |
Encourage nutrient-dense foods in amounts appropriate for caloric needs. |
| Protein 0.8 g/kg minimum |
Minimal change with age but research is not conclusive. Requirements vary with chronic disease, decreased absorption, and synthesis. | Protein intake should not be routinely increased; excess protein could unnecessarily stress aging kidneys. |
| Carbohydrates 45%-65% of total calories Men 30 g fiber Women 21 g fiber |
Constipation may be a serious concern for many. | Emphasize complex carbohydrates: legumes, vegetables, whole grains, fruits to provide fiber, essential vitamins, minerals. Increase dietary fiber to improve laxation especially in older adults. |
| Lipids 20%-35% total calories |
Heart disease is a common diagnosis. | Overly severe restriction of dietary fats alters taste, texture, and enjoyment of food; can negatively affect overall diet, weight, and quality of life. Emphasize healthy fats rather restricting fat. |
| Vitamins and Minerals | Understanding vitamin and mineral requirements, absorption, use, and excretion with aging has increased but much remains unknown. | Encourage nutrient-dense foods in amounts appropriate for caloric needs. Oxidative and inflammatory processes affecting aging reinforce the central role of micronutrients, especially antioxidants. |
| Vitamin B12 2.4 mg |
Risk of deficiency increases because of low intakes of vitamin B12, and decline in gastric acid, which facilitates B12 absorption. | Those 50 and older should eat foods fortified with the crystalline form of vitamin B12 such as in fortified cereals or supplements. |
| Vitamin D 800-1,000 IU |
Risk of deficiency increases as synthesis is less efficient; skin responsiveness as well as exposure to sunlight decline; kidneys are less able to convert D3 to active hormone form. As many as 30%-40% of those with hip fractures are vitamin D insufficient. | Supplementation may be necessary. This supplement is inexpensive, whereas testing for vitamin D deficiency is costly and the laboratory methods are not completely assured at this point. A supplement is indicated in virtually all institutionalized older adults. |
| Folate 400 µg |
May lower homocysteine levels; possible risk marker for atherothrombosis, Alzheimer disease, and Parkinson disease. | Fortification of grain products has improved folate status. When supplementing with folate, must monitor B12 levels. |
| Calcium 1200 mg |
Dietary requirement may increase because of decreased absorption; only 4% of women and 10% of men age 60 and older meet daily recommendation. | Recommend naturally occurring and fortified foods. Supplementation may be necessary. |
| Potassium 4700 mg |
Potassium-rich diet can blunt the effect of sodium on blood pressure. | Recommend meeting potassium recommendation with food, especially fruits and vegetables. |
| Sodium 1500 mg |
Risk of hypernatremia caused by dietary excess and dehydration. Risk of hyponatremia caused by fluid retention. |
Recommend consuming 1500 to no more than 2300 mg/d. |
| Zinc Men 11 mg Women 8 mg |
Low intake associated with impaired immune function, anorexia, loss of sense of taste, delayed wound healing, and pressure ulcer development. | Encourage food sources: lean meats, oysters, dairy products, beans, peanuts, tree nuts and seeds. |
| Water | Hydration status can easily be problematic. Dehydration causes decreased fluid intake, decreased kidney function, increased losses caused by increased urine output from medications (laxatives, diuretics). Symptoms: electrolyte imbalance, altered drug effects, headache, constipation, blood pressure change, dizziness, confusion, dry mouth and nose. |
Encourage fluid intake of at least 1500 mL/day or 1 mL per calorie consumed. Risk increases because of impaired sense of thirst, fear of incontinence, and dependence on others to get beverages. Dehydration is often unrecognized; it can present as falls, confusion, change in level of consciousness, weakness or change in functional status, or fatigue. |
The DRIs are not specific for protein in older adults. After age 65, the minimum protein requirement is 1 g protein/kg of body weight (Chernoff, 2004). New evidence supports 1 g/kg, even up to 1.2 gm/kg. In those individuals with impaired renal function or long-standing diabetes, .8g/kg to 1.0 g/kg may be more appropriate. Even protein distribution throughout the day with no single serving exceeding 30 g (Symons et al., 2009) should be a goal.
Medicare Benefits
The Social Security Act of 1965 created the Medicare program to cover most of the health care costs of those 65 and older and persons with disabilities. However, this federally funded health insurance program does not cover the entire cost of long-term care (LTC). A portion of payroll taxes and monthly premiums deducted from Social Security payments finance Medicare.
Medicare benefits are provided in four parts. Part A covers inpatient hospital care, some skilled nursing care, hospice care, and some home health care costs for limited periods of time. It is premium-free for most citizens. Part B has a monthly premium that helps pay for doctors, outpatient hospital care, and some other care not covered by Part A (physical and occupational therapy, for example). Part C allows private insurers, including health maintenance organizations (HMOs) and referred provider organizations (PPOs), to offer health insurance plans to Medicare beneficiaries. These must provide the same benefits the original Medicare plan provides under Parts A and B. Part C HMOs and PPOs may also offer additional benefits, such as dental and vision care. Part D provides prescription drug benefits through private insurance companies.
The 2010 health care reform legislation changed Medicare to include an annual wellness visit and a personalized prevention assessment and plan with no copayment or deductible. Prevention services include referrals to education and preventive counseling or community-based interventions to address risk factors. The new law mandates the creation of the Independence at Home Demonstration Project, a demonstration program to begin by 2012. It will enroll chronically ill Medicare beneficiaries to test a payment incentive and service delivery system that uses physician- and nurse practitioner–directed home-based primary care teams aimed at reducing costs and improving health outcomes. The 2010 law expands medical nutrition therapy reimbursement for registered dietitians to cover therapy considered reasonable and necessary for the prevention of an illness or disability.
The Home and Community-Based Services (HCBS) Waivers, Section 1915 (c), provide service to nursing home–appropriate older adults to help prevent or decrease nursing home or LTC institutionalization. States may offer an unlimited variety of services under this waiver. These waiver programs may provide both traditional medical services (dental, skilled nursing) and nonmedical services (meal delivery, case management, environmental modifications). States have the discretion to choose the number of older persons served. Forty-eight states (Michigan and Utah are the exceptions) and the District of Columbia offer services through HCBS waivers; currently there are approximately 287 active programs.
Nutrition Support Services
U.S. Department of Health and Human Services Older Americans Act Nutrition Program (OAA)
The OAA Nutrition Program is the largest, most visible, federally funded community-based nutrition program for older persons. Primarily a state-run program, it has few federal regulations and considerable variation in state-to-state policies and procedures. This nutrition program provides congregate and home-delivered meals (usually 5 days/week), nutrition screening, education, and counseling, as well as an array of other supportive and health services. Although frequently called meals on wheels, that term accurately refers only to the home-delivered meals. Participants are poorer, older, sicker, frailer, more likely to live alone, be members of minority groups, and live in rural areas (USAoA, 2008). The OAA Nutrition Program, available to persons age 60 and older, successfully targets those in greatest economic and social need, with particular attention to low-income minorities and rural individuals. More than half of the OAA annual budget supports the Nutrition Program, which provides approximately 240 million congregate and home-delivered meals to 2.6 million older adults annually. Home-delivered meals have grown to more than 60% of all meals served; almost half of the programs have waiting lists. To receive home-delivered meals, an individual must be assessed to be homebound or otherwise isolated. Home-delivered meal recipients are especially frail; half are at high nutrition risk or are malnourished and approximately one-third qualify as nursing-home appropriate.
At congregate sites, the Nutrition Program provides access and linkages to other community-based services. It is the primary source of food and nutrients for many program participants and presents opportunities for active social engagement and meaningful volunteer roles. Participants have higher daily intakes of key nutrients than similar nonparticipants. The meals are nutritionally dense per calorie and each meal supplies more than 33% of the recommended dietary allowances (an OAA requirement) and provides 40% to 50% of daily intakes of most nutrients (USAoA, 2008). Otherwise, inadequate nutrient intake affects approximately 37% to 40% of community-dwelling individuals 65 years of age and older (Federal Interagency Forum, 2008).
The OAA Nutrition Program has neither received the research or evaluation attention that a program its size deserves, nor the growth in federal funding to keep pace with inflation and the growing numbers of older adults (Wellman, 2010). The program reaches fewer than 5% of older Americans, and those served average fewer than three meals per week. The OAA Nutrition Program is closely linked to home- and community-based services (HCBS) through cross-referrals through the Aging Network. Because older adults are being discharged earlier from hospitals and nursing homes, many require a care plan that includes home-delivered meals and other nutrition services (e.g., nutrition screening, assessment, education, counseling, and care planning). Many states are creating programs to provide necessary medical, social, and supportive HCBS, including home-delivered meals, nutrition education, and counseling services (Kuczmarski and Weddle, 2005).
USDA Food Assistance Programs
Several U.S. Department of Agriculture (USDA) food and nutrition assistance programs (www.fns.usda.gov/fns/default.htm) are available to older adults. All USDA programs are means tested (i.e., recipients must meet income criteria). These programs are discussed further in Chapter 10.
Supplemental Nutrition Assistance Program
The Supplemental Nutrition Assistance Program (SNAP) program (formerly Food Stamps) is designed to end hunger and improve nutrition and health of low-income Americans. Beneficiaries use electronic benefit transfer (EBT) cards to purchase certain foods at authorized retail food stores. The program is operated by state and local welfare offices under USDA guidance. Currently SNAP serves less than one third of eligible older adults—the lowest participation rate of all demographic groups. Reasons for the low participation rate include the myth that only a $10 monthly benefit is provided, feeling stigmatized as a welfare recipient, feeling the application process is overly intrusive, eligibility confusion, mistrusting the EBT cards, and lack of outreach.
The goal of SNAP nutrition education is to make healthy choices within a limited budget and choose active lifestyles consistent with the current Dietary Guidelines for Americans and MyPlate. State cooperative extension offices, nutrition education networks, public health departments, welfare agencies, and university centers generally provide the nutrition education. Unfortunately, little outreach specific to older adults is offered.
Commodity Supplemental Food Program
The Commodity Supplemental Food Program (CSFP) strives to improve the health of low-income Americans by supplementing their diets with nutritious USDA commodity foods. It provides food and administrative funds to states, but not all are enrolled. In states, CSFP administration may be located in diverse sites such as public health, nutrition services, or agriculture departments. Eligible populations include adults age 60 and older with incomes less than 130% of the poverty level. Local CSFP agencies determine eligibility, distribute the foods, and provide nutrition education. The food packages do not provide a complete diet, but may be good sources of nutrients frequently lacking in low-income diets.
Seniors’ Farmers Market Nutrition Program
The Seniors’ Farmers Market Nutrition Program (SFMNP) is administered by state departments of agriculture, aging and disability services, health and human service, markets, public health, state units on aging, or state food and nutrition services. SFMNP provides coupons to low-income older individuals to purchase fresh, unprepared foods at farmers’ markets, roadside stands, and community-supported agriculture programs. It provides eligible older adults with local, seasonal access to fresh fruits, vegetables, and herbs.
Medicaid and Nutrition Services
The Social Security Act suggests seven core HCBS waiver program services: case management, homemaker services, home health aide services, personal care services, adult day health, rehabilitation, and respite care. Note that nutrition service is not a core Medicaid service. Older persons who are eligible for nursing home placement are not usually able to shop for food, store food safely, or plan and prepare nutritionally appropriate meals. Thus a strong argument can be made to fund all or some meals and nutrition services based on health and nutrition risk criteria. Yet only 38 states include meals or nutrition services among the specified benefits available through Medicaid waivers. Approved nutrition services include home-delivered meals, nutrition risk reduction counseling, and nutritional supplements as appropriate.
Assisted Living And Skilled Care Facilities
Several million older adults live in senior housing of various types, (assisted living or residential care communities, skilled senior apartments, continuing care communities, independent retirement living). Some sites have supportive services available to their residents, including meals and services through the older adult nutrition program.
Assisted living communities (ALCs) generally serve the fastest growing population segment—those ages 85 and older. The estimated 33,000 licensed ALCs are home to approximately 1 million persons. They combine housing and personalized supportive and health care for those who need help with ADLs. Often residents move to ALCs when they can no longer safely live alone, have some cognitive impairment, and require supervision and “cueing” about their daily routine. ALCs usually involve the resident’s family, neighbors, and friends. Care is provided in ways that promote maximum independence and dignity. Assisted living residences cost less than nursing home care. Residents are encouraged to maintain active social lives with planned activities, exercise classes, religious and social functions, and field trips directed by the facilities. These facilities are not required to provide therapeutic diets and can be a problem for patients with special requirements, such as those with heart failure.
Comprehensive state regulations for food and nutrition services in ALCs are rare, but there is early consensus of what should be regulated (Chao, 2009). Emphasizing that food and nutrition matter at every age, it is essential that support for nutrition and quality of life extend beyond food availability and safety. Dietitian expertise is needed for nutrition assessment and care planning to meet special needs such as type and amounts of macronutrients and micronutrients, texture modifications, and quality of food choices and presentation.
Surprisingly, fewer than 4% or 1.4 million seniors live in the approximately 15,730 skilled nursing facilities (SNFs) or LTC facilities (Centers for Medicare and Medicaid Services, 2010). The percentage of the population that lives in institutional settings, including nursing homes, increases dramatically with age, especially for those older than age 85. These percentages have declined since 1990, likely because of healthier aging, the federal cost-containment policy to rebalance LTC away from nursing homes to HCBS, and increased availability of hospice (He, 2005).
Skilled nursing facilities are federally regulated under the auspices of the Centers for Medicare and Medicaid Services; ALCs are subject to individual state regulations. More residents are there for short-stay, postacute care; thus more comprehensive medical nutrition therapy is needed. Nutritional care within long-term living facilities must be directed toward identifying and responding to changing physiologic and psychological needs over time that protect against avoidable decline. Attractive and palatable food served in an atmosphere that encourages eating independence, or assistance with eating provided when necessary, helps to promote nutritional well-being. For older adults, overall health goals may not warrant implementation of strict therapeutic diets that are often unpalatable and lessen quality of life. In terminal care for hospice patients, interventions include providing comfort foods and emotional support for family and friends.
In 1987 Congress approved reform legislation as a part of the Omnibus Reconciliation Act (OBRA) to improve quality of care in SNFs by strengthening standards that must be met for Medicare and Medicaid reimbursement. SNFs are required to conduct periodic assessments to determine the residents’ needs; to provide services that ensure residents maintain the highest practical physical, mental and psychological well being; and to ensure that no harm is inflicted. This is accomplished using the Minimum Data Set (MDS), which is part of the federally mandated process for clinical assessment of residents of LTC facilities licensed under Medicare or Medicaid. Section K of the MDS is specific to nutrition and is generally the responsibility of the dietitian to complete, but can be done by nursing staff (Figure 21-4). This form documents “triggers” that may place a resident at nutrition risk and therefore requires an intervention. This assessment must be done at admission and if there is a significant change in the resident’s condition such as weight loss or skin breakdown. Reassessment is required quarterly and annually. The entire process is known as the Resident Assessment Instrument (RAI). It provides the individual assessment of each resident’s functional capabilities and helps identify problems and develop a care plan.
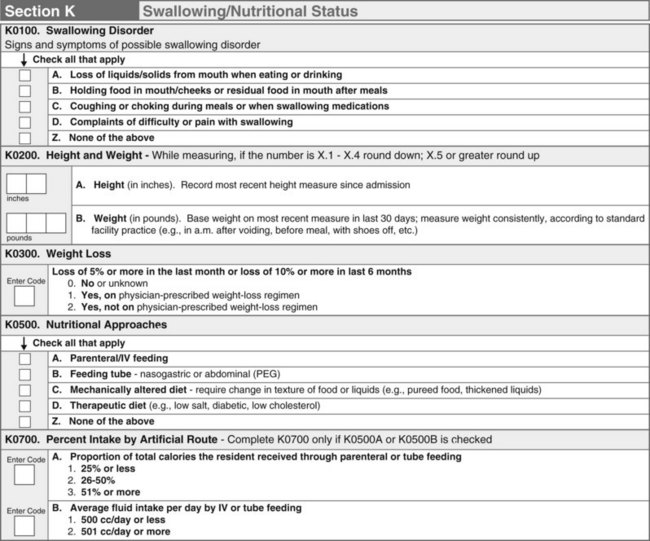
FIGURE 21-4 The Minimum Data Set, Section K version 3.0. (From the Centers for Medicare & Medicaid Services, Baltimore, MD.)
 Clinical Scenario
MF is an 84-year-old white woman resident in a skilled nursing facility with unintentional weight loss. She was admitted 3 months ago from the hospital after a hip fracture. She had been residing in an independent living facility for several years. She reports she has been eating poorly because of difficulty moving around, being generally uncomfortable, and states, “If I am not active I don’t need to eat so much.” Intake is less than 50% of regular diet. No problems chewing or swallowing are noted after a speech language pathologist’s evaluation. Admission weight was 112 pounds; current weight is 95 pounds. Self-reported height is 5′3″; albumin, 3.2; Hgb/Hct, normal; total cholesterol, 135; and Mini Nutrition Assessment score, 3. Hip scans show slow fracture healing and no improvement in bone density; currently being supplemented with calcium 1000 mg/d and vitamin D 400 IU/d. Blood pressure, 128/80 with furosemide (Lasix); other medications are lorazepam (Ativan), oxycodone, senna (Senokot-S), docusate (Colace), and megestrol acetate (Megace).
Nutrition Diagnostic Statement
Unintentional weight loss related to intake of less than 50% at meals with limited physical activity as evidenced by weight loss of 17 lb.
1. Comment on the appropriateness of and use for each medication. Would you suggest any changes or additional medications?
2. What strategies could you use to help improve this resident’s food and fluid intake?
3. What suggestions are appropriate to promote fracture healing and increase bone density?
4. Do you suspect that this client is constipated? What would you recommend in terms of food choices to deal with this?
American Association of Homes and Services for the Aging
American Association of Retired Persons
http://www.americangeriatrics.org
Centers for Medicare and Medicaid Services
International Longevity Center
http://www.cms.gov/IdentifiableDataFiles/10_LongTermCareMinimumDataSetMDS.asp
Meals on Wheels Association of America
http://www.mna-elderly.com/default.html
National Association of Area Agencies on Aging
National Association of Nutrition and Aging Services Programs
National Citizen’s Coalition for Nursing Home Reform
National Institutes of Health Senior Health
Older Americans Act Nutrition Program
http://www.aoa.gov/AoARoot/AoA_Programs/HCLTC/Nutrition_Services/index.aspx
U.S. Food and Drug Administration: To Your Health—Food Safety for Seniors
http://www.fda.gov/Food/ResourcesForYou/Consumers/Seniors/default.htm
References
American College of Sports Medicine, Position stand: exercise and physical activity for older adults. Med Sci Sports Exerc 2009;41:1510. Accessed 1 June 2010 from. http://journals.lww.com/acsm-msse/Fulltext/2009/07000/Exercise_and_Physical_Activity_for_Older_Adults.20.aspx
Bauer, JM, et al. The Mini Nutritional Assessment—its history, today’s practice, and future perspectives. Nutr Clin Pract. 2008;23:388.
Benelam, B. Satiety and the anorexia of ageing: review. Br J Comm Nurs. 2009;14:332.
Boston University School of Medicine. Why study centenarians? An overview. http://www.bumc.bu.edu/centenarian/overview/, 2010. [Accessed 3 July 2010 from].
Buettner, D. The blue zones. Washington, DC: The National Geographic Society; 2008.
Centers for Disease Control and Prevention, How much physical activity do older adults need?. U.S. Department of Health and Human Services; 2006. Accessed 1 June 2010 from. http://www.cdc.gov/physicalactivity/everyone/guidelines/olderadults.html
Centers for Medicare and Medicaid Services. http://www.cms.hhs.gov/ [Accessed 12/12/10].
Chao, SY, et al. What food and nutrition services should be regulated in assisted-living facilities for older adults? J Am Diet Assoc. 2009;109:1048.
Chernoff, R. Protein and older adults. J Am Coll Nutr. 2004;23:627S–630S.
Clemons, TE, et al. Cognitive impairment in the age-related eye disease study: AREDS report no. 16. Arch Ophthalmol. 2006;124:537.
Doley, J. Nutrition management of pressure ulcers. Nutr Clin Prac. 2010;25:50.
Federal Interagency Forum on Aging-Related Statistics, Older Americans 2008: key indicators of well-being. Washington, DC: U.S. Government Printing Office; 2008. Accessed 1 June 2010 from. http://www.agingstats.gov/
He, W, et al, U.S. Census Bureau, Current Population Reports, P23-209, 65+ in the United States: 2005. Washington, DC: U.S. Government Printing Office; 2005. Accessed 1 June 2010 from. http://www.census.gov/prod/2006pubs/p23-209.pdf
Institute of Medicine, Committee on Nutrition Services for Medicare Beneficiaries. The role of nutrition in maintaining health in the nation’s elderly. Washington, DC: National Academies Press; 2000.
Janssen, I. Sarcopenia. In Bales CW, Ritchie CS, eds.: Handbook of clinical nutrition and aging, ed 2, Totowa, N.J.: Humana Press, 2009.
Joshipura, K, Dietrich, T. Nutrition and oral health: a two-way relationship. In Bales CW, Ritchie CS, eds.: Handbook of clinical nutrition and aging, ed 2, Totowa, N.J.: Humana Press, 2009.
Juan, WY, et al, Diet quality of older Americans in 1994-96 and 2001-02 as measured by the healthy eating index-2005, Nutrition Insight 41. Washington, DC: U.S. Department of Agriculture, Center for Nutrition Policy and Promotion; 2008. Accessed 1 June 2010 from. http://www.cnpp.usda.gov/Publications/NutritionInsights/Insight41.pdf
Kaiser, MJ, et al. Validation of the mini nutritional assessment short-form (MNA®-SF): a practical tool for identification of nutritional status. J Nutr Health Aging. 2009;13:782.
Kamp, B, et al. Position statement of the American Dietetic Association, American Society for Nutrition, and Society for Nutrition Education: food and nutrition programs for community-residing older adults. J Am Diet Assoc. 2010;110:463.
Kuczmarski, MF, Weddle, DO, American Dietetic Association position statement: nutrition across the spectrum of aging. J Am Diet Assoc 2005;105:616. Accessed 1 June 2010 from. http://www.eatright.org/About/Content.aspx?id=8374
Michelon, E, et al. Vitamin and carotenoid status in older women: associations with the frailty syndrome. J Gerontol A: Biol Sci Med Sci. 2006;61:600.
Morley, JE. Update on nutritional assessment strategies. In Bales CW, Ritchie CS, eds.: Handbook of Clinical Nutrition and Aging, ed 2, Totowa, N.J.: Humana Press, 2009.
National Institute on Aging. Exercise and physical activity for older adults guide. http://nihseniorhealth.gov/exerciseforolderadults/toc.html, 20 January 2010. [Accessed 1 June 2010 from].
National Institute on Deafness and Other Communicative Disorders, National Institutes of Health. What is presbycusis? http://www.nidcd.nih.gov/health/hearing/presbycusis.htm#what, 2006. [Accessed 1 June 2010 from].
Neidert, KC. American Dietetic Association position statement: liberalization of the diet prescription improves quality of life for older adults in long-term care. J Am Diet Assoc. 2005;105:1955.
O’Neill, PS, et al. Aging in community nutrition, diet therapy, and nutrition and aging textbooks. Gerontol Geriatr Educ. 2005;25:65.
Sahin, E, et al. Telomere dysfunction induces metabolic and mitochondrial compromise. Nature. 2011;470:359.
Schiffman, S. Sensory impairment: taste and smell impairments with aging. In Bales CW, Ritchie CS, eds.: Handbook of clinical nutrition and aging, ed 2, Totowa, N.J.: Humana Press, 2009.
Symons, TB, et al. A moderate serving of high-quality protein maximally stimulates skeletal muscle protein synthesis in young and elderly subjects. J Am Diet Assoc. 2009;109:1582.
Thomas, DR. The relationship of nutrition and pressure ulcers. In Bales CW, Ritchie CS, eds.: Handbook of clinical nutrition and aging, ed 2, Totowa, N.J.: Humana Press, 2009.
Thomas, DR. Sarcopenia. Clin Geriatr Med. 2010;26(2):331.
U.S. Administration on Aging. National survey of OAA participants. http://www.agidnet.org/, 2008. [Aging Integrated Database. Accessed 1 June 2010 from].
U.S. Administration on Aging (USAoA). Profile of older Americans 2010. Accessed 1 June 2010 from http://www.aoa.gov/AoARoot/Aging_Statistics/Profile/index.aspx.
U.S. Department of Health and Human Services (USDHHS), 2010 Surgeon General’s vision for a healthy and fit nation. Rockville, Md: U.S. Department of Health and Human Services, Office of the Surgeon General; 2010. Accessed 1 June 2010 from. http://www.surgeongeneral.gov/
U.S. Department of Health and Human Services (USDHHS), U.S. Department of Agriculture (USDA), Dietary Guidelines for Americans, 2010. ed 7. Washington, DC: U.S. Government Printing Office; 2010. Accessed 1 June 2010 from. http://www.healthierus.gov/dietaryguidelines/
Villareal, DT, et al. Obesity in older adults: position statement of the American Society for Nutrition and The Obesity Society. Am J Clin Nutr. 2005;82:923.
Wellman, NS. Aging at home: more research on nutrition and independence, please. Am J Clin Nutr. 2010;91:1151.
World Health Organization (WHO). Fact sheet No 305: ultraviolet radiation and human health. http://www.who.int/mediacentre/factsheets/fs305/en/, December 2009. [Accessed 1 June 2010 from].
Wong, TY, et al. Age-related macular degeneration and risk for stroke. Ann Intern Med. 2006;145:98.