
Walter F. Boron
Blood carries O2 in two forms. More than 98% of the O2 normally binds to hemoglobin within the erythrocytes, also known as red blood cells (RBCs). A tiny fraction physically dissolves in the aqueous phases of both blood plasma and the cytoplasm of blood cells (predominantly RBCs). What is the significance of the O2 that is bound to hemoglobin?
Imagine that we expose a liter of blood plasma, initially free of O2, to an atmosphere having the same PO2 as alveolar air—100 mm Hg. Oxygen will move from the atmosphere to the plasma until an equilibrium is established, at which time the concentration of dissolved O2 ([O2]Dis) in the blood obeys Henry’s law (see Chapter 26 for the box on this topic):
If we express PO2 in millimeters of mercury (mm Hg) and [O2]Dis in milliliters of O2 gas (measured at standard temperature and pressure or STP) per 100 mL (or dL) of blood, then the solubility kO2 is ~0.003 mL O2 for each deciliter of blood and each millimeter of mercury of O2 partial pressure at 37°C. For arterial blood:
Is such an O2-carrying capacity adequate to supply O2 to the systemic tissues? If these tissues could extract all the O2 dissolved in arterial blood so that no O2 remained in venous blood, and if cardiac output were 5000 mL/min, then—according to the Fick principle (see Chapter 17)—the delivery of dissolved O2 to the tissues would be
However, the average 70-kg human at rest consumes O2 at the rate of ~250 mL/min. Dissolved O2 could supply the body’s metabolic demands only if cardiac output increased by a factor of 250/15 or nearly 17-fold! Thus, the body cannot rely on dissolved O2 as a mechanism for O2 carriage.
Normal adult hemoglobin (Hb) is a tetramer having a molecular mass of ~68 kDa, each monomer consisting of a heme and a globin (Fig. 29-1A). The heme is a porphyrin compound coordinated to a single iron atom. The globin is a polypeptide, either an α chain (141 amino acids) or a β chain (146 amino acids). The homology between the α and β chains is sufficient that they have similar conformations, a series of seven helices enveloping a single heme. Thus, the complete Hb molecule has the stoichiometry [α (heme)]2 [β (heme)]2 and can bind as many as four O2 molecules, one for each iron atom. The erythroblasts that synthesize Hb closely coordinate the production of α chains, β chains, and heme.
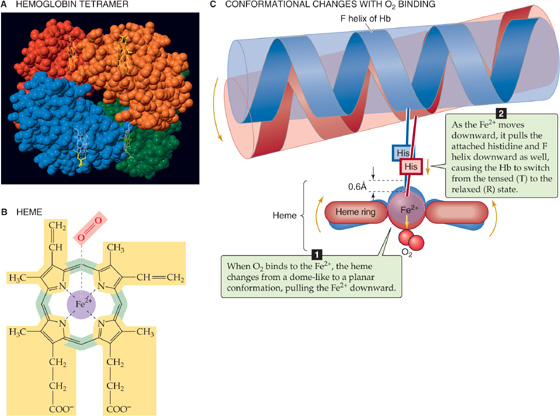
Figure 29-1 The structure of hemoglobin (Hb).
Heme is a general term for a metal ion chelated to a porphyrin ring. In the case of Hb, the metal is iron in the Fe2+ or ferrous state (Fig. 29-1B). The porphyrin consists of four linked pyrrole rings that through their nitrogen atoms coordinate a single, centrally located Fe2+. Because the iron-porphyrin complex is rich in conjugated double bonds, it absorbs photons of relatively low energy (i.e., light in the visible range). The interaction among O2, Fe2+, and porphyrin causes the complex to have a red color when it is fully saturated with O2 (e.g., arterial blood) and a purple color when it is devoid of O2 (e.g., venous blood).
Hb can bind O2 only when the iron is in the Fe2+ state. The Fe2+ in Hb can become oxidized to ferric iron (Fe3+), either spontaneously or under the influence of compounds such as nitrites and sulfonamides. The result of such an oxidation is methemoglobin (metHb), which is incapable of binding O2. Inside the RBC, the heme-containing enzyme methemoglobin reductase uses the reduced form of nicotinamide adenine dinucleotide (NADH) to reduce metHb back to Hb, so that only about 1.5% of total Hb is in the metHb state. In the rare case in which a genetic defect results in a deficiency of this enzyme, metHb may represent 25% or more of the total Hb. Such a deficiency results in a decreased O2-carrying capacity, leading to tissue hypoxia. (See Note: Methemoglobinemia)
The environment provided by the globin portion of Hb is crucial for the O2-heme interaction. To be useful, this interaction must be fully reversible under physiological conditions, allowing repetitive capture and release of O2. The interaction of O2 with free Fe2+ normally produces Fe3+, the simplest example of which is rust. Even with isolated heme, O2 irreversibly oxidizes Fe2+ to Fe3+. However, when heme is part of Hb, interactions with ~20 amino acids cradle the heme in the globin, so that O2 loosely and reversibly binds to Fe2+. The crucial residue is a histidine that bonds to the Fe2+ and donates negative charge that stabilizes the Fe2+-O2 complex. This histidine is also crucial for transmitting, to the rest of the Hb tetramer, the information that an O2 molecule is or is not bound to the Fe2+. When all four hemes are devoid of O2, each of the four histidines pulls its Fe2+ above the plane of its porphyrin ring by ~0.06 nm (the blue conformation in Fig. 29-1C), distorting the porphyrin ring. Thus, the Fe2+-histidine bond is under strain in deoxyhemoglobin, a strain that it transmits to the rest of the α or β subunit and thence to the rest of the Hb molecule. The various components of the Hb tetramer are so tightly interlinked, as if by a snugly fitting system of levers and joints, that no one subunit can leave this tensed (T) state unless they all leave it together. Because the shape of the heme in the T state sterically inhibits the approach of O2, empty Hb has a very low affinity for O2.
When one O2 binds to one of the Fe2+ atoms, the Fe2+ tends to move down into the plane of the porphyrin ring. If the Fe2+ actually could move, it would flatten the ring and relieve the strain on the Fe2+-histidine bond. When enough O2 molecules bind, enough energy builds up and all four subunits of the Hb simultaneously snap into the relaxed (R) state, whether or not they are bound to O2. In this R state, with its flattened heme, the Hb molecule has an O2 affinity that is ~150-fold greater than that in the T state. Thus, when PO2 is zero, all Hb molecules are in the T state and have a low O2 affinity. When PO2 is very high, all Hb molecules are in the R state and have a high O2 affinity. At intermediate PO2 values, an equilibrium exists between Hb molecules in the T and R states.
Myoglobin (Mb) is another heme-containing, O2-binding protein that is specific for muscle (see Chapter 9). The globin portion of Mb arose in a gene duplication event from a primordial globin. Additional duplications along the nonmyoglobin branch of the globin family led first to the α and β chains of Hb and then to other α-like and β-like chains (see the box on forms of hemoglobin). Mb functions as a monomer, homologous to either an α or a β chain of Hb. Although it is capable of binding only a single O2, Mb has a much higher O2 affinity than Hb does. In the capillaries, Hb can thus hand off O2 to an Mb inside a muscle cell; this Mb then transfers its O2 to the next Mb, and so on, speeding diffusion of O2 through the muscle cell. Because of the low solubility of O2, this action is essential. There is insufficient dissolved O2, by itself, to establish an intracellular O2 gradient large enough to deliver adequate O2 to mitochondria.
Imagine that we expose whole blood to a gas phase with a PO2 that we can set at any one of several values (Fig. 29-2). For example, we could incubate the blood with a PO2 of 40 mm Hg, typical of mixed-venous blood, and centrifuge a sample to separate plasma from erythrocytes, as one would for determination of the hematocrit (see Chapter 5). Next, we individually determine the O2 content of the plasma (i.e, dissolved O2) and packed RBCs. If we know how much water is inside the RBCs, we can subtract the amount of O2 dissolved in this water from the total O2, arriving at the amount of O2 bound to Hb.
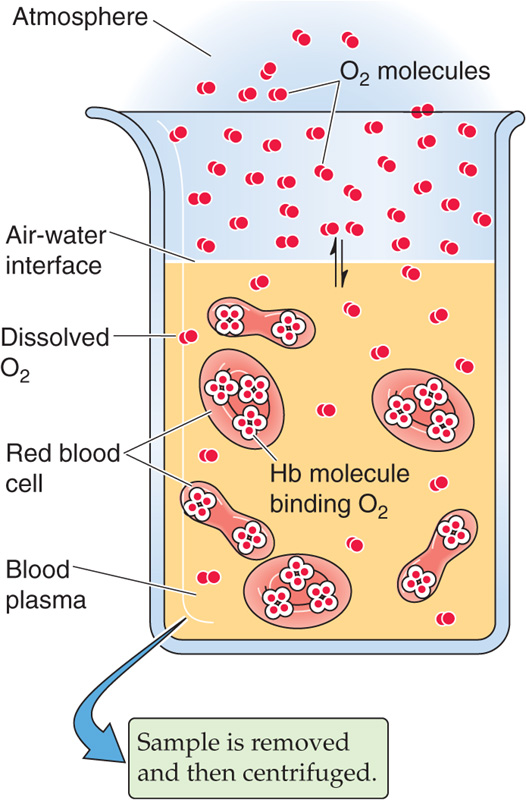
Figure 29-2 Determination of O2 content in blood plasma and erythrocytes. RBCs, red blood cells; WBCs, white blood cells.
Repeating this exercise over a range of PO2 values, we obtain the red curve in Figure 29-3. The right-hand ordinate gives the O2 bound to Hb (in the units of mL O2/dL blood). The left-hand ordinate gives the same data in terms of % O2 saturation of Hb (SO2 or “Sat”). To compute SO2, we need to know the maximal amount of O2 that can bind to Hb at extremely high PO2 values. Expressed in terms of grams of Hb protein, this O2 capacity is ~1.39 mL O2/g Hb—assuming that no metHb is present. In real life, the O2 capacity may be closer to 1.35 mL O2/g Hb because O2 cannot bind to Hb that is either in the Fe3+ state (e.g., metHb) or, as discussed later, bound to carbon monoxide. We can translate this O2 capacity to a value for the maximal amount of O2 that can bind to Hb in 100 mL of blood. If the Hb content is 15 g Hb/dL blood (i.e., normal for an adult man), then

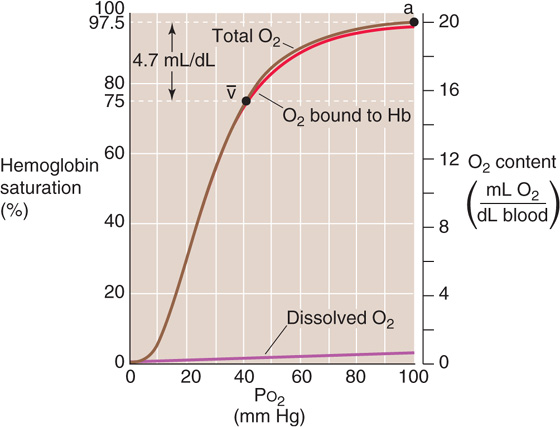
Figure 29-3 A normal Hb-O2 dissociation curve. The y-axis on the right shows O2 content. For the red curve (O2 content of Hb), we assume 15 g Hb/dL of blood and an O2 capacity of 1.35 mL O2/g Hb. The brown curve is the sum of the red and purple curves. The y-axis on the left, which pertains only to the red curve, gives the percentage of Hb saturation or SO2.
The percent saturation of Hb is
Notice that the curve in Figure 29-3 is sigmoidal or S shaped because of the cooperativity among the four O2 binding sites on the Hb molecule. At low PO2 values, increases in PO2 produce relatively small increases in O2 binding, reflecting the relatively low O2 affinity of Hb in the T state. At moderate PO2 values, the amount of bound O2 increases more steeply with increases in PO2, reflecting the increased O2 affinity as more Hb molecules shift to the R state. The PO2 at which the Hb is half saturated is known as the P50. Finally, the Hb-O2 versus PO2 curve flattens at high PO2 values as the Hb saturates. The difference in Hb saturation at low versus high PO2 values is the basis for an important clinical tool, the pulse oximeter (see the box on measuring O2 saturation).
At the PO2 prevailing in normal arterial blood (PaO2), ~100 mm Hg, the Hb saturation (SaO2) is ~97.5% or 19.7 mL O2/dL bound to Hb (Table 29-1). The dissolved O2 (purple curve in Fig. 29-3) would add an additional 0.3 mL O2/dL for a total O2 content of 20.0 mL O2/dL (point a on the brown curve in Fig. 29-3). In mixed-venous blood, in which PO2 (Pv–O2) is ~40 mm Hg, the Hb saturation (Sv–O2) is ~75% or 15.2 mL O2/dL bound to Hb (Table 29-1). The dissolved O2 would add 0.1 mL O2/dL for a total of 15.3 mL O2/dL (point  in Fig. 29-3). The difference in total O2 content between points a and , the a- difference, is the amount of O2 that the lungs add to the blood in the pulmonary capillaries, which is the same amount that all the tissues extract from the blood in the systemic capillaries:
Table 29-1 Summary of a- Difference in O2 Composition of Blood
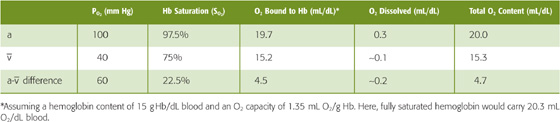
Of the total a- difference of 4.7 mL O2/dL, Hb provides 4.5 mL O2/dL or nearly 96% of the O2 that the lungs add and the systemic tissues extract from blood (Table 29-1). Is this a- difference in O2 content enough to satisfy the metabolic demands of the body (i.e., ~250 mL O2/min)? Using the Fick principle, as we did in Equation 29-3, we see that the combination of a cardiac output of 5 L/min and an a- difference of 4.7 mL/dL would be nearly adequate:
By either increasing cardiac output by ~6% or decreasing the PO2 of mixed-venous blood, the body could meet a demand of 250 mL O2/min. We spend our lives moving endlessly from point a in Figure 29-3 to point v– (as we deliver O2 to the tissues) and then back to point a (as we take up more O2 from alveolar air).
Because the plot of [O2]Dis versus PO2 is linear (Fig. 29-3, purple curve), the amount of O2 that can dissolve in blood plasma has no theoretical maximum. Thus, breathing of 100% O2 would raise arterial PO2 by ~6-fold, so that ~1.8 mL of O2 would be dissolved in each deciliter of arterial blood. Although dissolved O2 would make a correspondingly greater contribution to overall O2 carriage under such unphysiological conditions, Hb would still carry the vast majority of O2. Hence, a decrease in Hb content of the blood—known as anemia—can markedly reduce O2 carriage. The body can compensate for decreased Hb content in the same two ways that, in the earlier example, we increased the  O2 from 235 to 250 mL O2/min. First, it can increase cardiac output. Second, it can increase O2 extraction, thereby reducing mixed-venous O2 content. Anemia leads to pallor of the mucous membranes and skin, reflecting the decrease in the red Hb pigment. Impaired O2 delivery may cause lethargy and fatigue. The accompanying increase in cardiac output may be manifested as palpitations and a systolic murmur. Shortness of breath may also be a part of the syndrome.
If decreased Hb levels are detrimental, then increasing Hb content should increase the maximal O2 content, thus providing a competitive advantage for athletes. Even in normal individuals, [Hb] in RBC cytoplasm is already extremely high. Hypoxia (e.g., adaptation to high altitude) leads to the increased production of erythropoietin, a hormone that somewhat increases the amount of Hb per erythrocyte but especially increases RBC number. Indeed, a few instances have been highly publicized in the international press in which elite athletes have infused themselves with erythrocytes or injected themselves with recombinant erythropoietin. However, an excessive increase in hematocrit—polycythemia—has the adverse effect of increasing blood viscosity and thus vascular resistance (see Chapter 17). The consequences include increased blood pressure in both the systemic and pulmonary circulations and a mismatch of ventilation to perfusion within the lung. Such a ventilation-perfusion mismatch leads to hypoxia (see Chapter 31) and thus desaturation of arterial Hb. Thus, the optimal hematocrit—presumably ~45%—is one that achieves a high maximal O2 content but at a reasonable blood viscosity. (See Note: Erythropoietin)
The purplish color of desaturated Hb produces the physical sign known as cyanosis, a purplish coloration of the skin and mucous membranes. Cyanosis results not from the absence of saturated or oxygenated Hb but from the presence of desaturated Hb. Thus, an anemic patient with poorly saturated Hb might have too little unsaturated Hb for it to be manifested as cyanosis. The physician’s ability to detect cyanosis also depends on other factors, such as the subject’s skin pigmentation and the lighting conditions for the physical examination.
Metabolically active tissues not only have a high demand for O2, they also are warm, produce large amounts of CO2, and are acidic. Indeed, high temperature, high PCO2, and low pH of metabolically active tissues all decrease the O2 affinity of Hb by acting at nonheme sites to shift the equilibrium between the T and R states of Hb more toward the low-affinity T state. The net effect is that metabolically active tissues can signal Hb in the systemic capillaries to release more O2 than usual, whereas less active tissues can signal Hb to release less. In the pulmonary capillaries—where temperature is lower than in active tissues, PCO2 is relatively low, and pH is high—these same properties promote O2 uptake by Hb.
Temperature Increasing the temperature causes the Hb-O2 dissociation curve to shift to the right, whereas decreasing the temperature has the opposite effect (Fig. 29-4). Comparing the three Hb-O2 dissociation curves in Figure 29-4 at the PO2 of mixed-venous blood (40 mm Hg), we see that the amount of O2 bound to Hb becomes progressively less at higher temperatures. In other words, high temperature decreases the O2 affinity of Hb, releasing O2. One mechanism of this temperature effect may be small shifts in the pK values of various amino acid side chains, which cause shifts in net charge and thus a conformational change.
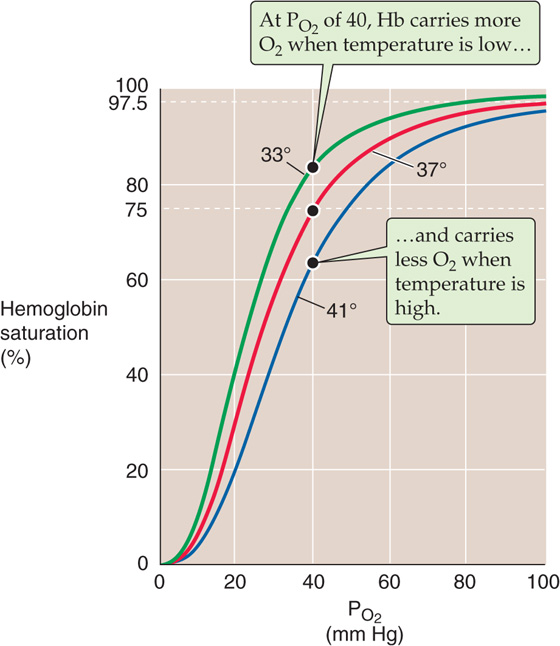
Figure 29-4 The effect of temperature changes on the Hb-O2 dissociation curve.
Forms of Hemoglobin
The normal adult form of hemoglobin (α2β2), known as HbA, is only one of several normal forms that are present in prenatal or postnatal life. Some of these other hemoglobins contain naturally occurring α-like chains (e.g., α and ζ) or β-like chains (e.g., β, γ, δ, and  ); others reflect post-translational modifications. Three genes for α-like chains (all encoding 141 amino acids) cluster on chromosome 16; at the 5′ end of the cluster is one gene for a ζ chain, followed by two for the α chain. Pseudogenes for ζ and α are also present. Five genes for β-like chains (all encoding 146 amino acids) are clustered on chromosome 11; starting at the 5′ end is one for , followed by two for γ (γG coding for glycine at position 136, γA for alanine), and one each for δ and β. A pseudogene for β is also present. A locus control region regulates the expression of these β-like chains during development (see Chapter 4).
The four prenatal hemoglobins (Table 29-2) consist of various combinations of two α-like chains (e.g., α and ζ) and two β-like chains (e.g., and γ). Very early in life, when erythropoiesis occurs in the yolk sac, the Hb products are the three embryonic hemoglobins. When erythropoiesis shifts to the liver and spleen at ~10 weeks of gestation, the Hb product is fetal hemoglobin, or HbF (α2γ2). Erythrocytes containing HbF have a higher O2 affinity than do those containing HbA owing to special properties of γ chains. The newborn’s blood contains both HbA and HbF; the HbF gradually falls by 1 year of age to the minute levels that are characteristic of the adult (rarely more than 1% to 2% of total Hb). With severe stress to the erythroid system—such as marked hemolysis, bone marrow failure, or recovery from bone marrow transplantation—immature erythroid precursors may be forced to mature before they have differentiated sufficiently to produce HbA. In these conditions, circulating levels of HbF may increase considerably. In some hereditary cases, normal HbF persists in the adult, with no clinically significant consequences.
Table 29-2 Subunit Structures of Prenatal and Minor-Component Hemoglobins
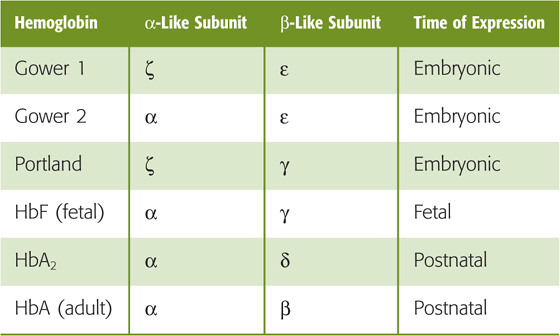
Even adult blood contains several normal minor-component hemoglobins (Table 29-3), which account for 5% to 10% of the total blood Hb. In HbA2 (~2.5% of total Hb), δ chains replace the β chains of HbA. Although the physiological significance of HbA2 is unknown, the δ chains reduce the sickling of sickle hemoglobin (see later). Three other minor-component hemoglobins are the result of the nonenzymatic glycosylation of HbA. HbA1a, HbA1b, and HbA1c form when intracellular glucose 6-phosphate (G6P) reacts with the terminal amino groups of the β chains of HbA. In poorly controlled diabetes mellitus, a disease characterized by decreased insulin or insulin sensitivity (see Chapter 51), blood glucose concentrations rise and, with them, intracellular concentrations of G6P. As a result, glycosylated hemoglobins may represent 10% or more of the total Hb. Because Hb glycosylation is irreversible, and because the RBC has a mean lifetime of 120 days, levels of these glycosylated hemoglobins are clinically useful for assessing the long-term control of blood glucose levels in diabetics.
Table 29-3 Makeup of Total Hemoglobin in Adult Human Blood
Hemoglobin Type |
Fraction of Total Hemoglobin |
HbA |
~92% |
HbA1a |
0.75% |
HbA1b |
1.5% |
HbA1c |
3%-6% |
HbA2 |
2.5% |
Total |
100% |
Numerous abnormal hemoglobins exist, most of which are caused by single amino acid substitutions on one of the polypeptide chains. One of the most clinically important is HbS, or sickle hemoglobin, in which a valine replaces the glutamate normally present at position 6 of the β chain. Although oxygenated HbS has a normal solubility, deoxygenated HbS is only about half as soluble as deoxygenated HbA. As a result, in low-O2 environments, HbS can crystallize into long fibers, giving the cells a sickle-like appearance. The sickled erythrocytes may disrupt blood flow in small vessels, causing many of the acute symptoms of sickle cell crisis, including pain, renal dysfunction, retinal bleeding, and aseptic necrosis of bone. In addition, sickle cells are prone to hemolysis (mean lifetime, <20 days), leading to a chronic hemolytic anemia.
The maximal temperatures achieved in active muscle are ~40°C. Of course, very low temperatures can prevail in the skin of extremities exposed to extreme cold.
Acid In 1904, Christian Bohr, a physiologist and father of atomic physicist Niels Bohr, observed that respiratory acidosis shifts the Hb-O2 dissociation curve to the right (Fig. 29-5A). This decrease in O2 affinity has come to be known as the Bohr effect. A mild respiratory acidosis occurs physiologically as erythrocytes enter the systemic capillaries. There, the increase in extracellular PCO2 causes CO2 to enter erythrocytes, leading to a fall in intracellular pH (see Chapter 28). Other acidic metabolites may also lower extracellular and therefore intracellular pH. Thus, this intracellular respiratory acidosis has two components—a decrease in pH and an increase in PCO2. We now appreciate that both contribute to the rightward shift of the Hb-O2 dissociation curve observed by Bohr.
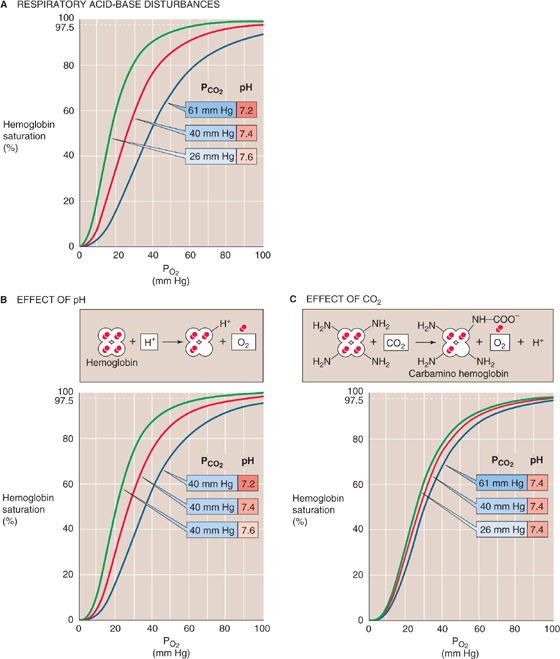
Figure 29-5 The effect of acidosis and hypercapnia on the Hb-O2 dissociation curve (Bohr effect).
The effect of acidosis on the Hb-O2 dissociation curve (Fig. 29-5B)—pH-Bohr effect—accounts for most of the overall Bohr effect. One can readily demonstrate the pH-Bohr effect in a solution of Hb by imposing a metabolic acidosis (e.g., decreasing pH at a fixed PCO2). It should not be surprising that Hb is sensitive to changes in pH because Hb is an outstanding H+ buffer (see Chapter 28):

Although Hb has many titratable groups, the ones important here are those with pK values in the physiological pH range. As we acidify the solution, raising the ratio [Hb-H+]/[Hb] for susceptible groups, we change the conformation of the Hb molecule, thus lowering its O2 affinity: (See Note: Interactions of H+ with Hemoglobin)

This is an extreme example in which we added enough H+ to cause Hb to dump all of its O2. Under more physiological conditions, the binding of ~0.7 mol of H+ causes Hb to release 1 mole of O2. This property is important in the systemic tissues, where [H+] is high. The converse is also true: O2 binding causes a conformational change in the Hb molecule, which lowers the affinity of Hb for H+.
Carbon Dioxide The isolated effect of hypercapnia on the Hb-O2 dissociation curve (Fig. 29-5C) represents a small portion of the overall Bohr effect. Demonstration of such a CO2-Bohr effect requires that we study the O2 affinity of Hb at a fixed pH, increasing PCO2 and HCO−3 proportionally—an example of isohydric hypercapnia. As PCO2 increases, CO2 combines with unprotonated amino groups on Hb (Hb–NH2) to form carbamino groups (Hb–NH–COO−). Although Hb has other amino groups, only the four amino termini of the globin chains are susceptible to appreciable carbamino formation, the β chains more so than the α chains. Because amino groups exist in a protonated form (Hb-NH+3) in equilibrium with an unprotonated form, the reaction of CO2 with Hb-NH2 tends to shift Hb away from the Hb-NH+3 form and toward the Hb-NH-COO− form: (See Note: Interactions of CO2 with Hemoglobin)
The overall effect of carbamino formation is therefore a negative shift in the charge on one amino acid side chain, causing a shift in the conformation of Hb and reducing its O2 affinity:
Thus, an increased PCO2 causes Hb to unload O2, which is important in the systemic tissues. Conversely, an increased PO2 causes Hb to unload CO2, which is important in the lungs.
In conclusion, the Hb-O2 dissociation curve shifts to the right under conditions prevailing in the capillaries of metabolically active systemic tissues—increased temperature (Fig. 29-4), decreased pH (Fig. 29-5B), and increased PCO2 (Fig. 29-5C). These right shifts are synonymous with decreased O2 affinity. Thus, high metabolic rates promote the unloading of O2 from Hb. Clearly, blood cannot unload O2 unless the blood gets to the tissues. Indeed, in most systemic arterioles, local hypercapnia and acidosis also are powerful stimuli for vasodilation (see Chapter 24), enhancing O2 delivery to metabolically active tissues.
The affinity of Hb for O2 is very sensitive to the presence of the glycolytic metabolite 2, 3-diphosphoglycerate (2, 3-DPG) and, to a lesser extent, organic phosphates such as adenosine triphosphate (ATP). The concentration of 2, 3-DPG is about the same as that of Hb. Indeed, 2, 3-DPG binds to Hb in a 1 : 1 stoichiometry, interacting with a central cavity formed by the two β chains. At physiological pH, 2, 3-DPG has an average of ~3.5 negative charges, which interact with 8 positively charged amino acid residues in this central cavity. O2 binding, however, changes the shape of the central cavity, destabilizing DPG-bound Hb. As a result, deoxygenated Hb has a 100-fold higher affinity for 2, 3-DPG than does oxygenated Hb. Conversely, binding of 2, 3-DPG to Hb destabilizes the interaction of Hb with O2, promoting the release of O2: (See Note: 2, 3-DPG)

The result is a right shift in the Hb-O2 dissociation curve (Fig. 29-6). This effect of 2, 3-DPG on the O2 affinity of Hb is important both in hypoxia and in understanding the physiology of fetal Hb.
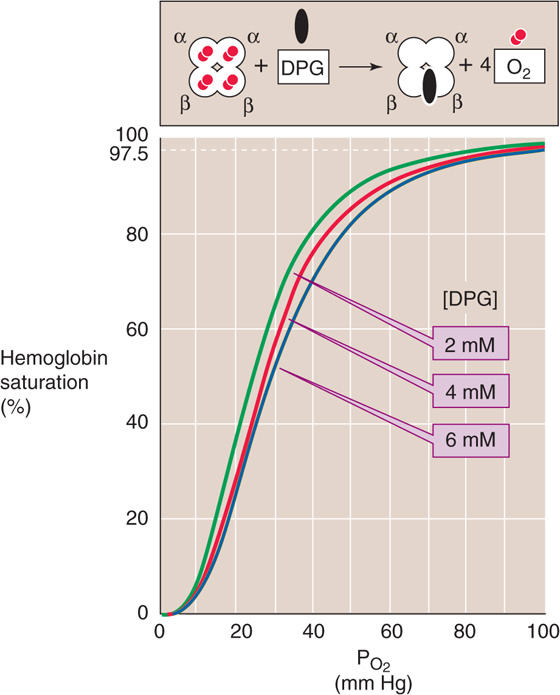
Figure 29-6 The effect of 2, 3-diphosphoglycerate (2, 3-DPG) on O2 affinity of hemoglobin. After lowlanders spent about 2 days at an altitude of ~4500 m, their cytosolic [2, 3-DPG] increased by ~50%, shifting the Hb-O2 dissociation curve to the right.
Decrease of the PO2 of RBCs stimulates glycolysis, leading to increased levels of 2, 3-DPG. Indeed, chronic hypoxia, anemia, and acclimation to high altitude are all associated with an increase in 2, 3-DPG levels, thus lowering the O2 affinity of Hb. Reducing the affinity is a two-edged sword. At the relatively high PO2 in alveoli, where the Hb-O2 dissociation curve is fairly flat, this decrease in O2 affinity reduces O2 uptake—but only slightly. At the low PO2 in systemic tissues, where the Hb-O2 dissociation curve is steep, this decrease in O2 affinity markedly increases the O2 release. The net effect is enhanced O2 unloading to metabolizing tissues, which is more important than PO2 per se.
In Figure 29-7, the blue Hb-O2 dissociation curve represents pure or “stripped” Hb (i.e., in the absence of CO2, 2, 3-DPG, and other organic phosphates). The O2 affinity of pure Hb is quite high, as evidenced by the left shift of the curve. Adding only CO2 (orange curve) or only 2, 3-DPG (green curve) to the solution shifts the curve somewhat to the right, and adding both yields the brown curve that is indistinguishable from the red curve for intact RBCs under physiological conditions.
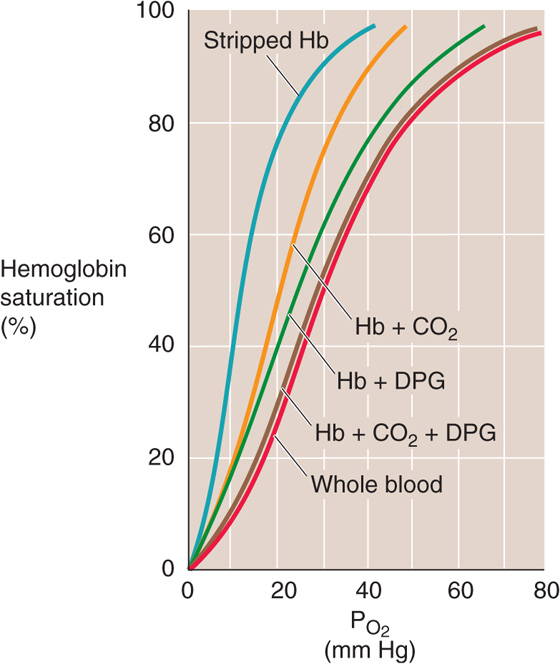
Figure 29-7 The effect of adding CO2 or 2, 3-DPG to stripped Hb. The four brown curves are Hb-O2 dissociation curves for pure Hb (2 mM) in artificial solutions. Stripped Hb is devoid of both CO2 and 2, 3-DPG. When CO2 or 2, 3-DPG was present, PCO2 was 40 mm Hg and [2, 3-DPG] was 2.4 mM. The cytosol of erythrocytes in blood (red curve) had the same composition as the artificial solutions.
Measuring the Oxygen Saturation of Hemoglobin Clinically: The Pulse Oximeter
The different colors of venous and arterial blood reflect the difference in light absorbance between oxygenated Hb and deoxygenated Hb. Clinicians now routinely exploit these differences to obtain simple, noninvasive measurements of the arterial O2 saturation (SaO2) of Hb in patients. The pulse oximeter has a probe that one attaches to the ear, finger, or any part of the body at which pulsating blood vessels are accessible externally. On one side of the pulsating vascular bed, the pulse oximeter shines red and infrared light; on the other side, it detects the light transmitted through the bed and calculates absorbances. These total absorbances have two components: (1) a nonpulsatile component that arises from stationary tissues, including blood inside capillaries and veins; and (2) a pulsatile component that arises from blood inside arterioles and arteries. The difference between the total and nonpulsatile absorbance is thus the pulsatile component, which represents only arterial or oxygenated blood. Because oxygenated Hb and deoxygenated Hb absorb red and infrared light differently, the pulse oximeter can calculate SaO2 from the ratio of pulsatile light absorbed at the two wavelengths. The pulse oximeter accomplishes this magic by using a sophisticated microprocessor and software to produce results that strongly agree with those provided by blood gas analysis of a sample of arterial blood.
The pulse oximeter measures SaO2 in arterial blood. Because systemic capillaries and veins do not pulsate, they do not contribute to the measurement. Thus, a patient with peripheral cyanosis (e.g., purple fingertips caused by cold-induced vasoconstriction) may have a perfectly normal “central” (i.e., arterial) SaO2. Pulse oximetry cannot detect carbon monoxide poisoning because the absorbance spectra of Hb-CO and Hb-O2 are similar.
Health professionals widely employ pulse oximetry in hospitalized patients, particularly those in intensive care units, where continuous monitoring of SaO2 is critical. These patients include those on mechanical ventilators and others, less severely ill, who suffer some degree of respiratory compromise. Pulse oximetry has also become popular as an outpatient tool for assessment of the presence of hypoxemia during sleep and thus for screening of sleep apnea (see Chapter 32 for the box on sleep apnea). Because of the insidious nature of hypoxia, pilots of light aircraft have begun to use pulse oximeters to detect developing hypoxia at high altitudes.
The fetal Hb (HbF) in fetal erythrocytes (see the box on forms of hemoglobin) has a higher O2 affinity than the Hb inside adult RBCs (HbA). This difference is crucial for the fetus, whose blood must abstract O2 from maternal blood in the placenta (see Chapter 56). The difference in O2 affinities does not, however, reflect differences in O2 affinities of stripped HbA and HbF, which are nearly identical. The crucial difference is that the γ chains of HbF bind 2, 3-DPG less avidly than do the β chains of HbA. With less 2, 3-DPG bound, the dissociation curve of HbF is left shifted, similar to the HbA curve labeled Hb + CO2 in Figure 29-7.
O2 is not the only gas that can bind to the Fe2+ of Hb; carbon monoxide (CO), nitric oxide (NO), and H2S can also bind to Hb and snap it into the R state. In carbon monoxide poisoning, CO binds to Hb with an affinity that is ~200-fold greater than that of O2. Thus, the maximal O2 capacity falls to the extent that CO binds to Hb. However, the major reason that CO is toxic is that as it snaps Hb into the R state, CO increases the O2 affinity of Hb and shifts the Hb-O2 dissociation curve far to the left. Thus, when Hb reaches the systemic capillaries in CO poisoning, its tenacity for O2 is so high that the bright red blood cannot release enough O2 to the tissues. (See Note: Other Gases That Bind to Hemoglobin)
The blood carries CO2 and related compounds in five forms: (See Note: Total CO2)
1. Dissolved CO2. [CO2]Dis follows Henry’s law (see Chapter 26 for the box on that topic), and it is in the millimolar range in both blood plasma and blood cells. It makes up only ~5% of the total CO2 of arterial blood (gold portion of leftmost bar in Fig. 29-8).

Figure 29-8 Constituents of total CO2 in blood. The left bar (a) represents arterial blood; the middle bar (v–), mixed-venous blood; and the right bar, the incremental CO2 that the blood picks up in the systemic capillaries.
2. Carbonic acid. H2CO3 can form either from CO2 and H2O or from H+ and HCO−3 (see Chapter 28). Because the equilibrium constant governing the reaction CO2 + H2O ⇄ H2CO3 is ~0.0025, [H2CO3] is only 1/400 as large as [CO2]. Thus, H2CO3 is not quantitatively important for CO2 carriage.
3. Bicarbonate. HCO−3 can form in three ways. First, H2CO3 can dissociate into HCO−3 and H+. Second, CO2 can combine directly with OH− to form HCO−3, the reaction catalyzed by carbonic anhydrase. Third, HCO−3 forms when carbonate combines with H+. In arterial blood, HCO−3 is ~24 mM, so that HCO−3 represents ~90% of total CO2 (purple portion of leftmost bar in Fig. 29-8). (See Note: Carbonic Anhydrases)
4. Carbonate. CO2−3 forms from the dissociation of bicarbonate: HCO−3 → CO2−3 + H+. Because the pK of this reaction is so high (~10.3), [CO2−3] is only ~1/1000 as high as HCO−3 at pH 7.4. Thus, like H2CO3, CO2−3 is not quantitatively important for CO2 carriage.
5. Carbamino compounds. By far the most important carbamino compound is carbamino hemoglobin (Hb-NH-COO−), which forms rapidly and reversibly as CO2 reacts with free amino groups on Hb. In arterial blood, carbamino compounds account for ~5% of total CO2 (blue portion of leftmost bar in Fig. 29-8).
The reason we group together these five CO2-related compounds under the term total CO2 is that the method Van Slyke introduced in the 1920s—which remains the basis for assay of blood HCO−3 in modern clinical laboratories—cannot distinguish among the five. (See Note: Van Slyke’s Manometric Method for Determining Total CO2)
The total CO2 concentration of arterial blood is ~26 mM, or ~48 mL of CO2 gas per deciliter (measured at STP). HCO−3 constitutes ~90% of this 48 mL/dL, with CO2 and carbamino compounds contributing ~5% each (a bar in Fig. 29-8). As blood courses through the systemic capillary beds, it picks up ~4 mL/dL of CO2, so that the total CO2 of mixed-venous blood is ~52 mL/dL ( bar in Fig. 29-8). In what forms does blood carry this incremental 4 mL/dL of CO2 to the lungs? About 10% of the incremental CO2 moves as dissolved CO2, ~69% as HCO−3, and ~21% as carbamino compounds (rightmost two bars in Fig. 29-8). Therefore, dissolved CO2 and carbamino CO2 are far more important for carrying incremental CO2 to the lungs than we might have surmised, given their contribution to total CO2 in arterial blood.
Figure 29-9 summarizes the events that occur as incremental CO2 enters systemic capillaries. As fast as biological oxidations in the mitochondria produce CO2, this gas diffuses out of cells, through the extracellular space, across the capillary endothelium, and into the blood plasma. Some of the incremental CO2 (~11%) remains in blood plasma throughout its journey to the lungs, but most (~89%), at least initially, enters the RBCs.
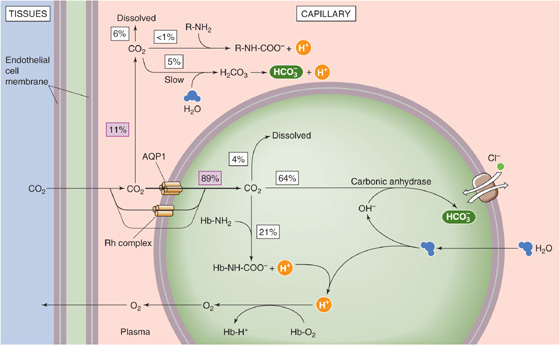
Figure 29-9 Carriage of CO2 from systemic capillaries to the lungs.
The ~11% of the incremental CO2 in plasma travels in three forms:
1. Dissolved CO2. About 6% of incremental CO2 remains dissolved in blood plasma (assuming a hematocrit of 40%).
2. Carbamino compounds. An insignificant amount forms carbamino compounds with plasma proteins.
3. Bicarbonate. About 5% of incremental CO2 forms HCO−3 in the plasma and remains in the plasma: CO2 + H2O → H2CO3 → H+ + HCO−3. The amount of HCO−3 that follows this path depends critically on non-HCO−3 buffering power (see Chapter 28), which is very low in plasma (~5 mM/pH unit).
The remaining ~89% of incremental CO2 enters the RBCs, predominantly through two “gas channels,” AQP1 and the Rh complex. This CO2 also has three fates: (See Note: Gas Channels)
1. Dissolved CO2. About 4% of incremental CO2 remains dissolved inside the RBC.
2. Carbamino compounds. About 21% of incremental CO2 forms carbamino compounds with Hb. Why does so much CO2 travel as carbamino compounds inside the red cell, whereas so little does in the blood plasma? First, the Hb concentration inside RBCs (~33 g/dL) is far higher than that of albumin and globulins in plasma (~7 g/dL). Second, Hb forms carbamino compounds far more easily than do major plasma proteins. Moreover, Hb forms carbamino compounds even more easily as it loses O2 in the systemic capillaries (reverse of the CO2-Bohr effect). Finally, Hb is a far better buffer than the plasma proteins for the H+ formed as a byproduct in carbamino formation and becomes an even better buffer as it loses O2 in the systemic capillaries (reverse of the pH-Bohr effect).
3. Bicarbonate. About 64% of the incremental CO2 forms HCO−3. Why does so much more CO2 form HCO−3 in the erythrocyte than in plasma? First, erythrocytes contain a high level of carbonic anhydrases, greatly accelerating the conversion of CO2 to HCO−3. In the absence of enzyme, hardly any HCO−3 would form inside erythrocytes during the brief time the cells spend in their passage through a typical systemic capillary. Second, the Cl-HCO3 exchanger AE1 (see Chapter 5) transports some of the newly formed HCO−3 out of the cell, promoting formation of more HCO−3. This uptake of Cl− in exchange for HCO−3 is known as the chloride or Hamburger shift. Third, the buffering of H+ by Hb (see point 2) also pulls the reaction to the right. (See Note: Carbonic Anhydrases)
The combined effects of the described intracellular and extracellular events is that ~10% of incremental CO2 formed in systemic tissues moves to the lungs as dissolved CO2, 6% in plasma and 4% inside erythrocytes (gold portion of rightmost bar in Fig. 29-8). About 21% moves as carbamino compounds, almost exclusively inside erythrocytes as carbamino Hb (blue portion of rightmost bar in Fig. 29-8). Finally, ~69% of incremental CO2 moves as HCO−3, 5% that forms in plasma and 64% that forms inside the RBC (purple portion of rightmost bar in Fig. 29-8). Because H2O enters the cell during HCO−3 formation, erythrocytes swell as they pass through systemic capillaries.
When mixed-venous blood (with a PCO2 of ~46 mm Hg) reaches the pulmonary capillaries (surrounded by alveoli with a PCO2 of only ~40 mm Hg), CO2 moves from the erythrocytes and blood plasma into the alveolar air space. All of the reactions discussed earlier reverse. In the process, Cl− and H2O leave the erythrocytes, and the cells shrink.
The carriage of total CO2 in the blood depends on the three blood gas parameters—PCO2, plasma pH, and PO2. The three plots in the main portion of Figure 29-10 are CO2 dissociation curves. Each plot shows how changes in PCO2 affect the total CO2 content of blood. Although pH per se does not appear in this diagram, pH decreases as PCO2 increases along the x-axis (i.e., respiratory acidosis; see Chapter 28). The blue plot is the CO2 dissociation curve when PO2 is zero (SO2 ≅ 0% Hb). The next two plots are CO2 dissociation curves for PO2 values of 40 mm Hg (SO2 ≅ 75%; purple) and 100 mm Hg (SO2 ≅ 97.5%; red). The green line at the bottom of Figure 29-10 shows that the dissolved component of total CO2 rises only slightly with increases in PCO2.
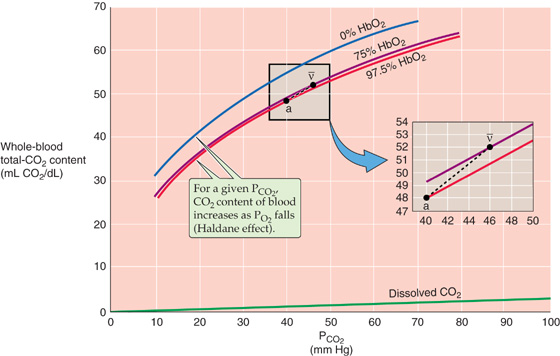
Figure 29-10 CO2 dissociation curves (Haldane effect).
Three features of the CO2 dissociation curves in Figure 29-10 are noteworthy:
1. Near-linear relationship in the physiological range of PCO2 and PO2 values (Fig. 29-10, inset). In contrast, the O2 dissociation curve is highly nonlinear in its physiological range (i.e., 40 to 100 mm Hg).
2. Up-shift of curve with decreasing PO2. At any PCO2, total CO2 content rises as PO2 (or Hb saturation) falls—the Haldane effect. Thus, as blood enters systemic capillaries and releases O2, the CO2-carrying capacity rises so that blood picks up extra CO2. Conversely, as blood enters the pulmonary capillaries and binds O2, the CO2-carrying capacity falls so that blood dumps extra CO2 (Table 29-4). The Haldane effect is the flip side of the coin from the pH-Bohr and CO2-Bohr effects. First, just as H+ binding lowers the O2 affinity of Hb (Equation 29-9), O2 binding destabilizes protonated hemoglobin (Hb-H+), promoting H+ release. By mass action, this H+ reduces CO2-carrying capacity by favoring the formation of CO2 from both carbamino Hb and HCO−3 (Fig. 29-9). Second, just as carbamino formation lowers the O2 affinity of Hb (Equation 29-11), O2 binding destabilizes carbamino Hb (Hb-NH-COO−), promoting CO2 release. (See Note: John Scott Haldane)
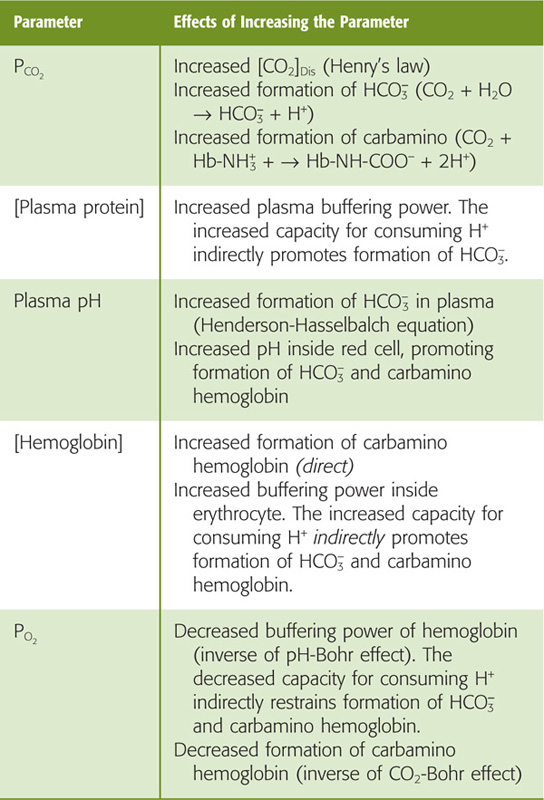
Table 29-4 Factors Affecting the Amount of Total CO2 Carried by Blood
3. Steepness. Because CO2 dissociation curves (Fig. 29-10) are much steeper than O2 dissociation curves (Fig. 29-3), PCO2 must increase from 40 mm Hg in arterial blood to only 46 mm Hg in mixed-venous blood to increase the CO2 content by the ~4 mL/dL of CO2 required to remove CO2 as fast as the mitochondria produce it. In contrast, PO2 must decrease from 100 to 40 mm Hg to dump enough O2 to meet metabolic demands.
In the inset to Figure 29-10, point a on the red curve represents arterial blood, with a PCO2 of 40 mm Hg and a PO2 of 100 mm Hg (SO2 ≅ 97.5%). Point v– on the purple curve represents mixed-venous blood, with a PCO2 of 46 mm Hg but a PO2 of only 40 mm Hg (SO2 ≅ 75%). The difference between the total CO2 contents represented by the two points (i.e., 52 versus 48 mL/dL) represents the 4 mL/dL of CO2 the blood takes up as it passes through systemic capillaries. If it were not for the Haldane effect, the blood would remain on the red curve, and the PCO2 increase would cause the CO2 content to increase by only ~2.7 mL/dL. Thus, at a PCO2 of 46 mm Hg, the fall in PO2 that occurs as blood flows through systemic capillaries allows the blood to pick up ~50% more CO2 (i.e., 4 versus 2.7 mL/dL). Viewed differently, if it were not for the Haldane effect, mixed-venous PCO2 would have to increase to ~49 mm Hg for blood to carry 4 mL/dL of CO2. Table 29-4 summarizes how changes in blood parameters can influence the amount of total CO2 that the blood is able to carry.
We have seen that Hb plays a key role in transporting O2 from the lungs to peripheral tissues, transporting CO2 in the opposite direction, and buffering H+. These functions are intimately interrelated: PCO2 and pH influence the O2-Hb dissociation curve (Bohr effects; Fig. 29-5), and PO2 influences the CO2 dissociation curve (Haldane effect; Fig. 29-10). A useful way of illustrating this mutual dependence is the O2-CO2 diagram, which we will revisit in Chapter 31 to understand regional differences between alveolar PO2 and PCO2.
On a coordinate system with PCO2 on the ordinate and PO2 on the abscissa, each blue curve in Figure 29-11 represents an isopleth of identical O2 content in whole blood (from the Greek isos [equal] + plethein [to be full]). For example, arterial blood (point a) lies on the isopleth for an O2 content of 20.0 mL/dL, with coordinates of PO2 = 100 mm Hg and PCO2 = 40 mm Hg. Following this isopleth from a PCO2 of 40 mm Hg (point a) to, say, 46 mm Hg, we see that the blood could carry the same 20.0 mL/dL of O2 only if we increase PO2 from 100 to nearly 105 mm Hg. Thus, as PCO2 increases, the O2 content of blood decreases (Bohr effect). If it were not for the Bohr effect, all blue curves would be vertical lines. Mixed-venous blood (point v–) is on the O2 content isopleth for 15.3 mL/dL, at a PO2 of 40 mm Hg and a PCO2 of 46 mm Hg. If blood were equilibrated with inspired air (point I), it would have a PO2 of 150 mm Hg and a PCO2 of 0.
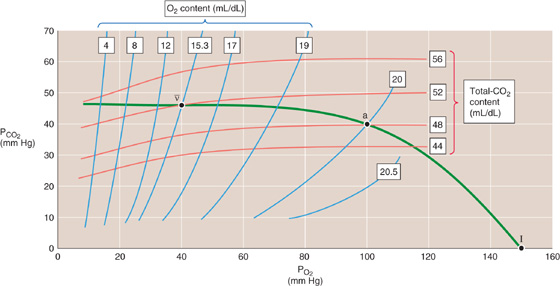
Figure 29-11 The O2-CO2 diagram.
Each red curve is an isopleth of identical CO2 content. Arterial blood (point a) lies on the isopleth for 48 mL/dL. Similarly, mixed-venous blood (point v–) lies on the isopleth for 52 mL/dL. Following this 52 mL/dL isopleth from a PO2 of 40 mm Hg (point v–) to, say, 100 mm Hg, we see that the blood could carry the same 52 mL/dL of CO2 only if we increase PCO2 from 46 to nearly 50 mm Hg. Thus, as the PO2 increases, the CO2 content of blood decreases (Haldane effect). If it were not for the Haldane effect, all red curves would be horizontal lines. Blood equilibrated with inspired air (point I) would have a CO2 content of 0.
In Figure 29-11, the green curve connecting the points v–, a, and I represents all possible combinations of PO2 and PCO2 in normal lungs.
Books and Reviews
Bauer C: Structural biology of hemoglobin. In Crystal RG, West JB (eds): The Lung, pp 1215-1223. New York: Lippincott-Raven, 1991.
Jelkmann W: Erythropoietin: Structure, control of production, and function. Physiol Rev 1992; 72:449-487.
Kilmartin JV, Rossi-Bernardi L: Interactions of hemoglobin with hydrogen ion, carbon dioxide and organic phosphates. Physiol Rev 1973; 53:836-890.
Klocke RA: Carbon dioxide. In Crystal RG, West JB (eds): The Lung, pp 1233-1239. New York: Lippincott-Raven, 1991.
Percy MJ, McFerran NV, Lappin TR: Disorders of oxidised haemoglobin. Blood Rev 2005; 19:61-68.
Journal Articles
Arnone A: X-ray studies of the interaction of CO2 with human de-oxyhaemoglobin. Nature 1974; 247:143-145.
Benesch R, Benesch RE: Intracellular organic phosphates as regulators of oxygen release by haemoglobin. Nature 1969; 221:618-622.
Endeward V, Musa-Aziz R, Boron WF, et al: Evidence that aquaporin 1 is a major pathway for CO2 transport across the human erythrocyte membrane. FASEB J 2006; 20:1974-1981.
Perutz MF, Kilmartin JV, Nishidura K, et al: Identification of residues contributing to the Bohr effect of human haemoglobin. J Mol Biol 1980; 138:649-670.
Perutz MF, Lehmann H: Molecular pathology of human haemoglobin. Nature 1968; 219:902-909.