Nutrition in Adolescence
Adolescence is one of the most exciting yet challenging periods in human development. Generally thought of as the period of life that occurs between 12 and 21 years of age, adolescence is a period of tremendous physiologic, psychologic, and cognitive transformation during which a child becomes a young adult. The gradual growth pattern that characterizes early childhood changes to one of rapid growth and development, affecting both physical and psychosocial aspects of health. Changes in cognitive and emotional functioning allow teens to become more independent as they mature. Peer influence and acceptance may become more important than family values, creating periods of conflict between teens and parents. Because all of these changes have a direct effect on the nutrient needs and dietary behaviors of adolescents, it is important that health care providers develop a full understanding of how these developmental changes of adolescence can affect nutritional status.
Growth and Development
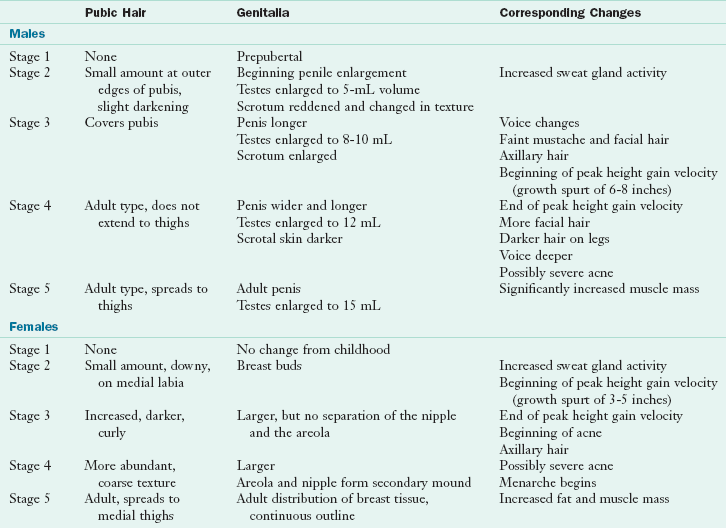
Puberty is the period of rapid growth and development during which a child physically develops into an adult and becomes capable of sexual reproduction. It is initiated by the increased production of reproductive hormones such as estrogen, progesterone, and testosterone and is characterized by the outward appearance of secondary sexual characteristics such as breast development in females and the appearance of facial hair in males (Table 19-1).
TABLE 19-1
Ratings of Sexual Maturation*
*See Appendixes 17 and 18.
Modified from Tanner JM: Growth at adolescence, ed 2, Oxford, 1962, Blackwell Scientific Publications.
Psychological Changes
Adolescence is often depicted as a time of irrational behavior. The physical growth of puberty transforms the teen body into an adultlike form, leading adults to believe that adolescent development is complete. However, the social and emotional development of adolescence lags behind. The mismatch between how teens look and how they act may lead adults to deduce that the adolescent is “not acting his or her age.” The rebellion that is associated with the teen years is actually the manifestation of their search for independence and a sense of autonomy. Food can be, and often is, used as a means of exerting autonomy. Adolescents may choose to become vegetarian as a way to differentiate themselves from their meat-eating parents or to express their moral and ethical concerns over animal welfare or the environment. Eating fast food becomes a strong social factor for adolescents that differentiates them from their parents and older generations. In their minds, asking teens to stop eating fast food is equivalent to asking them to stop being adolescents.
Cognitive and emotional development is best understood when it is divided into three periods: early, middle, and late adolescence (Ingersoll, 1992). Each period has unique features in terms of the ability to synthesize information and apply health concepts, and this has a direct bearing on methods used when providing nutritional counseling and designing educational programs.
Early adolescence, occurring between the ages of 13 and 15, is characterized by the following:
• Preoccupation with body size and shape, and body image (the mental self-concept and perception of personal body size) as a result of the rapid growth and development that has occurred
• Continuation of trust and respect for adults as authority figures; however, this diminishes during this phase of psychosocial development
• Strong influence of peers, especially around areas of body image and appearance, with peer pressure peaking at approximately 14 years of age
• Desire for autonomy but still wanting parental approval for major decisions and still seeking parental security when experiencing stress
• Expanded cognitive ability, including abstract reasoning
• Increased spending money resulting in more independent purchasing power, including for snacks and meals
Middle adolescence, occurring between the ages of 15 and 17, is characterized by the following:
• Persistence of peer group influence; however, teens are influenced by fewer individuals with whom they closely bond
• Decreased trust in adult authority and wisdom
• Less pronounced body image issues as the adolescent becomes more comfortable in his or her adultlike body shape and size
• More pronounced social, emotional, and financial independence, leading to increased independent decision making related to food and beverage intake
• Significant cognitive development as abstract reasoning is nearly complete and egocentrism decreases
Late adolescence, occurring between the ages of 18 and 21, is characterized by the following:
• Fully developed abstract reasoning; however, teens may still revert to less complex thinking patterns when they are stressed
• Developed future orientation, which is required to understand the link between current behavior and chronic health risks
• Development of social, emotional, financial, and physical independence from family as teens leave home to attend college or seek full-time employment
• Development of a core set of values and beliefs that guides moral, ethical, and health decisions
The psychosocial development of adolescents has a direct bearing on the foods and beverages they choose. Teens in early to mid-adolescence are at risk for restricting calories as a means of dieting because of body image concerns. Because abstract reasoning ability is not yet fully developed, teens of this age are generally unable to see the relationship between their current behaviors and their future health risk. Nutrition education and counseling methods that focus on how adolescents look, such as improving skin appearance or promoting hair growth, are most likely to be effective with young teens.
Sexual Maturity
Sexual maturity rating (SMR), also known as Tanner stage, is used to clinically assess the degree of sexual maturation during puberty (Tanner, 1962). Among males SMR is based on genital and pubic hair development (see Figure 19-1 and Table 19-1). Among females SMR is assessed by breast and pubic hair development. SMR is measured through a series of five stages, with stage 1 marking prepubertal development and stage 5 marking the completion of physical growth and development. See Appendix Tables 17 and 18. The five stages of SMR correlate highly with other markers of growth and development during puberty such as alterations in height, weight, body composition, and endocrine functioning. A thorough understanding of the relationship between physical growth and development and SMR enables health care professionals to assess an adolescent’s potential for future growth.
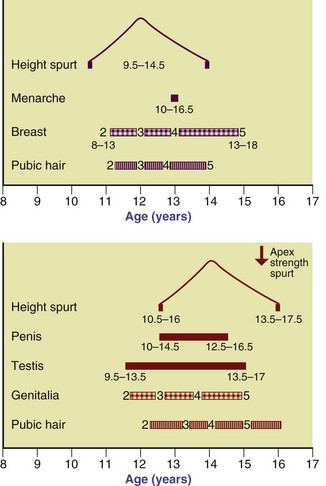
FIGURE 19-1 Sequence of events during puberty in females (upper chart) and males (lower chart). Breast, genitalia, and pubic hair development are numbered 2 to 5 based on the Tanner developmental stages. (From Marshall WA, Tanner JM: Variations in the pattern of pubertal changes in males, Arch Dis Child 45:13, 1970.)
In general, females enter puberty earlier than males. An example of ethnic variation in female development is shown in data from the National Health and Nutrition Examination Study III (NHANES III). It suggests that most non-Hispanic black and Mexican American females reach breast development stage 2 (thelarche) at 9.6 years of age, 8 months earlier than non-Hispanic white females (Rosenfield, 2009). Racial and ethnic differences in maturation are also seen for pubic hair stage 3 (pubarche), which occurs earlier among most non-Hispanic black females (10.6 years) compared with Mexican American and white females (11.6 years). Most females enter puberty at least 2.5 years earlier than their male counterparts, with Mexican American youth showing the greatest gender variance in age at pubarche.
Data from NHANES III also suggest variation in the timing of pubarche among males of different racial and ethnic backgrounds (Rosenfield, 2009). The median age among non-Hispanic white and black males (12.3 and 12.5 years) is approximately 6 months earlier than among Mexican American males (13.2 years).
Adolescent females with a body mass index (BMI) in the 85th percentile or higher are four times more likely to have reached thelarche by age 8 and twice as likely by 9.6 years of age than normal weight females (Rosenfeld, 2009). Excessive body weight among young females plays a larger role in the timing and duration of puberty among females than among males.
Menarche, the onset of menses or menstruation, is often considered the hallmark of puberty among females (at 12.5 years in the average girl). However, the onset of menses can occur anywhere between the ages of 8 and 17 years (Rosenfeld, 2009; Tanner, 1962). The median age of menarche is 12.1 years for black, 12.3 years for Mexican American, and 12.6 years for white females (Rosenfeld, 2009).
Excessive body weight among females was associated with both earlier onset of puberty as well as earlier menses among females of all racial and ethnic groups. Females with a BMI in the 85th percentile or higher are four times as likely to have experienced menses by age 10.6 years of age.
In summary, puberty may begin earlier but last longer for nonwhite females (Rosenfeld, 2009). Although racial and ethnic differences in the age of pubarche were noted for males, the differences were not as pronounced. No significant relationship between weight status and pubarche was found among males.
Linear Growth
The velocity of physical growth during adolescence is much higher than that of early childhood (Figure 19-2). On average, adolescents gain approximately 20% of their adult height during puberty. There is a great deal of variability in the timing and duration of growth among adolescents, illustrated in Figure 19-3 by a group of 13-year-old males.
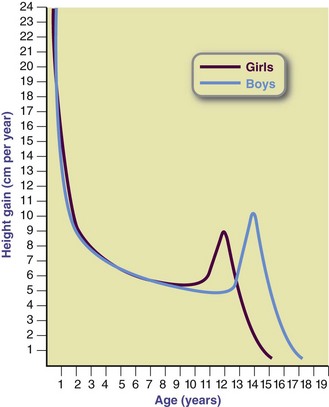
FIGURE 19-2 Typical individual velocity curves for supine length or height in males and females. Curves represent the growth velocity of the typical boy and girl at any given age.

FIGURE 19-3 These males are all 13 years old, but their energy needs vary according to their individual growth rates.
Linear growth occurs throughout the 4 to 7 years of pubertal development in most teens; however, the largest percentage of height is gained during an 18- to 24-month period commonly referred to as the growth spurt. The fastest rate of growth during the growth spurt is labeled the peak height gain velocity. Although growth slows after the achievement of sexual maturity, linear growth and weight acquisition continue into the late teens for females and early 20s for males and young men. Most females gain no more than 2 to 3 inches after menarche, although females who have early menarche tend to grow more after its onset than do those having later menarche.
Increases in height are accompanied by increases in weight during puberty. Teens gain 40% to 50% of adult body weight during adolescence. The majority of weight gain coincides with increases in linear height. However, it should be noted that teens may gain more than 15 pounds after linear growth has ceased. Changes in body composition accompany changes in weight and height. Males gain twice as much lean tissue as females, resulting in differentiation in percent body fat and lean body mass. Body fat levels increase from prepuberty averages of 15% for males and 19% for females to 15% to 18% in males and 22% to 26% in females. Differences in lean body mass and body fat mass affect energy and nutrient needs throughout adolescence and differentiate the needs of females from those of males.
Nutrient Requirements
The dietary reference intakes (DRIs) for adolescents are listed by chronologic age and gender. Although the DRIs provide an estimate of the energy and nutrient needs for an individual adolescent, actual need varies greatly between teens as a result of differences in body composition, degree of physical maturation, and level of physical activity. Therefore health professionals should use the DRIs as a guideline during nutritional assessment, but should rely on clinical judgment and indicators of growth and physical maturation to make a final determination of an individual’s nutrient and energy requirements.
Energy
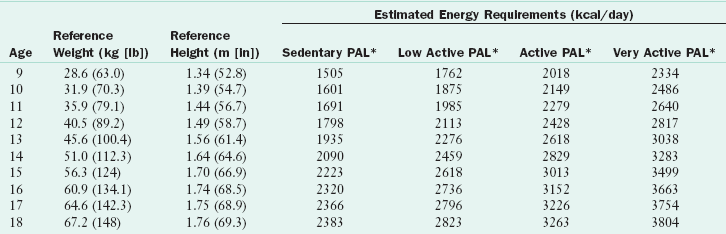
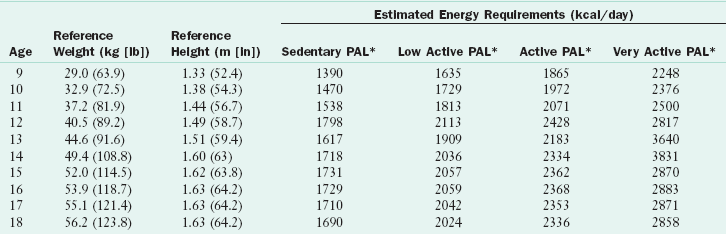
Estimated energy requirements (EERs) vary greatly among males and females because of variations in growth rate, body composition, and physical activity level (PAL). EERs are calculated using an adolescent’s gender, age, height, weight, and PAL, with an additional 25 kcal/day added for energy deposition or growth (Institute of Medicine [IOM], 2006). To determine adequate energy intake (in kilocalories), physical activity assessment is required. The energy requirements allow for four levels of activity (sedentary, low active, active, and very active), which reflect the energy expended in activities other than the activities of daily living. Tables 19-2 and 19-3 show the EER (kcal/day) for each activity level based on PALs.
TABLE 19-2
Estimated Energy Requirements for Adolescent Males
*PAL categories, which are based on walking per day at 2-4 mph, are as follows: sedentary, no additional activity; low active, 1.5-2.9 miles/day; active, 3-5.8 miles/day; and very active, 7.5-14 miles/day (see Table 2-3).
Data from Institute of Medicine, Food and Nutrition Board: Dietary reference intakes for energy, carbohydrate, fiber, fat, fatty acids, cholesterol, protein, and amino acids, Washington, DC, 2002, National Academies Press.
TABLE 19-3
Estimated Energy Requirements for Adolescent Females
*PAL categories, which are based on walking per day at 2-4 mph are as follows: sedentary, no additional activity; low active, 1.5-2.9 miles/day; active, 3-5.8 miles/day; and very active, 7.5-14 miles/day (see Table 2-3).
Data from Institute of Medicine, Food and Nutrition Board: Washington, DC, 2002, National Academies Press.
Adequacy of energy intake for adolescents is best assessed by monitoring weight and BMI. Excessive weight gain indicates that energy intake is exceeding energy needs, whereas weight loss or a drop in BMI below an established percentile curve suggests that energy intake is inadequate to support the body’s needs. Groups of adolescents who are at elevated risk for inadequate energy intake include teens who “diet” or frequently restrict caloric intake to reduce body weight; individuals living in food-insecure households, temporary housing, or on the street; adolescents who frequently use alcohol or illicit drugs, which may reduce appetite or replace food intake; and teens with chronic health conditions such as cystic fibrosis, Crohn disease, or muscular dystrophy.
Recent concerns about excessive energy intake among youths have centered on the intakes of added fats and sugars in their diets. The mean daily intake of added sugars by 9- to 13-year-old males is 29.2 tsp, among 14- to 18-year-old males is 34.4 tsp, among 9- to 13-year-old females is 23.2 tsp, and among 14- to 18-year-old females is 25.2 tsp (National Cancer Institute, 2010). When one considers that a cup of sugar is approximately 48 tsp, it is apparent that adolescents consume a great deal of energy through added sugars. Soft drinks provide 37% of added sugars in the U.S. diet (Bachman et al., 2008). NHANES data revealed that 9- to 13-year-olds consume 1.5 servings of soft drinks daily, whereas 14- to 18-year-olds consume 2.7 servings, the highest intake of any age group (Frazao, 2005). Added fats are consumed by adolescents largely through snack foods, baked goods, and fast food (Bachman et al., 2008). Corn, potato, and other chips have been shown to provide 16% of added fats in the U.S. diet, and half of all potatoes were fried potatoes or chips (Bachman et al., 2008). Counseling related to excessive energy intakes among adolescents should focus on intake of discretionary calories, especially those from added sweeteners consumed through soft drinks and candy and from added fats consumed through snack foods and fried food.
Protein
During adolescence protein requirements vary with degree of physical maturation. The DRIs for protein intake are estimated to allow for adequate pubertal growth and positive nitrogen balance (IOM, 2006). Table 19-4 illustrates the protein requirements for adolescents. Actual protein needs are best determined based on a per kilogram of body weight method during puberty to account for differences in rates of growth and development among teens.
TABLE 19-4
Protein: Estimated Average Requirements and Recommended Dietary Allowances for Adolescents
| Age (yr) | EAR (g/kg/day) | RDA (g/kg/day) |
| 9-13 | 0.76 | 0.95 or 34 g/day* |
| 14-18 Males | 0.73 | 0.85 or 52 g/day* |
| 14-18 Females | 0.71 | 0.85 or 46 g/day* |
EAR, Estimated average requirement; RDA, recommended dietary allowance.
*Based on average weight for age.
Data from Institute of Medicine, Food and Nutrition Board: Dietary reference intakes for energy, carbohydrate, fiber, fat, fatty acids, cholesterol, protein, and amino acids, Washington, DC, 2002, National Academies Press.
Insufficient protein intake is uncommon in the U.S. adolescent population. However, as with energy intake, food security issues, chronic illness, frequent dieting, and substance use may compromise protein intakes among adolescents. Teens who follow vegan or macrobiotic diets are also at elevated risk for inadequate protein intake.
When protein intake is inadequate, alterations in growth and development are seen. In the still-growing adolescent, insufficient protein intake results in delayed or stunted increases in height and weight. In the physically mature teen, inadequate protein intake can result in weight loss, loss of lean body mass, and alterations in body composition. Impaired immune response and susceptibility to infection may also be seen.
Carbohydrates and Fiber
Carbohydrate requirements of adolescents are estimated to be 130 g/day (IOM, 2006). The requirements for carbohydrates, as for most nutrients, are extrapolated from adult needs and should be used as a starting point for the determination of an individual adolescent’s actual need. Teens who are very active or are actively growing need additional carbohydrates to maintain adequate energy intake, whereas teenagers who are inactive or have a chronic condition that limits mobility may require fewer carbohydrates. Whole grains are the preferred source of carbohydrates because these foods provide vitamins, minerals, and fiber. Intake of carbohydrates is adequate in most teens, with less than 3% of adolescents in the United States reporting intakes less than the recommended dietary allowance value (Moshfegh et al., 2005).
Fiber intakes of youth are low, however, because of poor intake of whole grains, fruits, and vegetables. The adequate intake (AI) values for fiber intake among adolescents are 31 g/day for males 9 to 13 years old, 38 g/day for males 14 to 18 years old, and 26 g/day for 9- to 18-year-old females (IOM, 2006). These values are derived from calculations that suggest that an intake of 14 g/1000 calories provides optimal protection against cardiovascular disease (CVD) and cancer (IOM, 2006). Adolescents who require less energy intake because of activity restrictions may have needs that are lower than the AI values.
Data from the 2005-2006 What We Eat in America survey, a component of the NHANES, suggest that median intakes of fiber are 15.2 g/day for teenage males and 12.3 g/day for females (U.S. Department of Agriculture [USDA], 2008). The disparities between fiber recommendations and actual intakes suggest that more emphasis needs to be placed on educating adolescents about optimal sources of carbohydrates, including whole grains, fruits, vegetables, and legumes.
Fat
DRI values for absolute fat intake have not been established for adolescents. Instead it is recommended that fat intakes not exceed 30% to 35% of total caloric intake, with no more than 10% of calories coming from saturated fatty acids. However, specific recommendations for intakes of ω-6 and ω-3 fatty acids have been set in an attempt to ensure that teens consume adequate essential fatty acids to support growth and development, as well as to reduce chronic disease risk later in life. The AI for ω-6 polyunsaturated fatty acids (linoleic acid) are 12 g/day for 9- to 13-year-old males, 10 g/day for 9- to 13-year-old females, 16 g/day for 14- to 18-year-old males and 11 g/day for 14- to 18-year-old females (IOM, 2006). Estimated requirements for ω-3 polyunsaturated fatty acids (α-linolenic acid) among teens are 1.2 g/day for 9- to 13-year-old males, 1 g/day for 9- to 13-year-old females, 1.6 g/day for 14- to 18-year-old males, and 1.1 g/day for 14- to 18-year-old females (IOM, 2006).
Minerals and Vitamins
Micronutrient needs of youth are elevated during adolescence to support physical growth and development. However, micronutrients involved in the synthesis of lean body mass, bone, and red blood cells are especially important during adolescence. Vitamins and minerals involved in protein, ribonucleic acid, and deoxyribonucleic acid synthesis are needed in greatest amounts during the growth spurt. Needs decline after physical maturation is complete. However, the requirements for vitamins and minerals involved in bone formation are elevated throughout adolescence and into adulthood, because bone density acquisition is not completed by the end of puberty.
In general, adolescent males require greater amounts of most micronutrients during puberty, with the exception of iron. Micronutrient intakes during adolescence are inadequate among some subgroups of teens, especially among females. Tables 19-5 and 19-6 based on the 2005-2006 What We Eat in America survey, illustrates the adequacy of micronutrient intakes among U.S. adolescents compared with DRI recommendations. These data suggest that in all age and gender categories the intakes of vitamin E, calcium, and fiber are too low. Teenage females between the ages of 14 and 18 years old are most likely to consume inadequate intakes of the most vitamins and minerals, and benefit the most from nutrition intervention.
TABLE 19-5
Mean Intakes of Select Nutrients Compared to DRIs: Adolescent Males
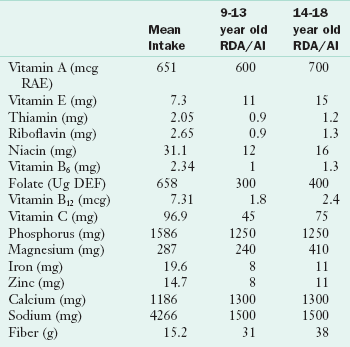
AI, Adequate intake; DRI, dietary reference intake; NA, not available; RDA, recommended dietary allowance.
Data sources: U.S. Department of Agriculture, Agricultural Research Service. 2008. Nutrient Intakes from Food: Mean Amounts Consumed per Individual, One Day, 2005-2006. Available: www.ars.usda.gov/ba/bhnrc/fsrg. Accessed Jan 29, 2010.
TABLE 19-6
Mean Intakes of Select Nutrients Compared to DRIs: Adolescent Females
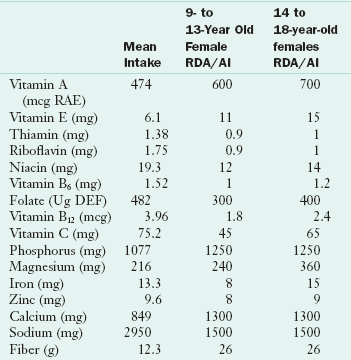
AI, Adequate intake; DRI, dietary reference intake; NA, not available; RDA, recommended dietary allowance.
Data sources: U.S. Department of Agriculture, Agricultural Research Service. 2008. Nutrient Intakes from Food: Mean Amounts Consumed per Individual, One Day, 2005-2006. Available: www.ars.usda.gov/ba/bhnrc/fsrg. Accessed Jan 29, 2010.
Calcium
Because of accelerated muscular, skeletal, and endocrine development, calcium needs are greater during puberty and adolescence than during childhood or adult years. Bone mass is acquired at much higher rates during puberty than any other time of life; rates of bone accretion during adolescence may be four times as high as rates during early childhood or adulthood (Stransky and Rysava, 2009). In fact, females accrue approximately 92% of their bone mass by the age of 18 years, making adolescence a crucial time for osteoporosis prevention (IOM, 2006; Word Health Organization, 2003).
The AI for calcium is 1300 mg for all adolescents with an upper level intake of 3000 mg/day. Calcium intake declines with age during adolescence, especially among females. Research suggests that high soft drink consumption in the adolescent population contributes to low calcium intake by displacing milk consumption. Increasing intakes of sweetened soft drinks are found to be related to decreasing numbers of servings of dairy foods and a decrease in the adequacy of calcium intake among children and adolescents (Rajeshwari et al., 2005). Interventions to promote calcium consumption among youth should focus not only on increasing dairy product intake, but also on decreasing intakes of soft drinks and increasing intakes of calcium-fortified foods such as orange juice, bread, dark-green vegetables, nuts, and ready-to-eat cereals.
Iron
Iron requirements are increased during adolescence for the deposition of lean body mass, increase in red blood cell volume, and to support iron lost during menses among females. Iron needs are highest during periods of active growth among all teens, and are especially elevated after the onset of menses in adolescent females. The DRI for iron among females increases from 8 mg/day before age 13 (or before the onset of menses) to 15 mg/day after the onset of menses. Among adolescent males recommended intakes increase from 8 to 11 mg/day, with higher levels required during the growth spurt. Iron needs remain elevated for women after age 18, but fall back to prepubescent levels in men once growth and development are completed.
Median intakes of iron among adolescents less than desirable. Increased needs for iron, combined with low intakes of dietary iron, place adolescent females at risk for iron deficiency and anemia. It is estimated that 9% of adolescent females 12 to 15 years old and 11% to 16% of females 16 to 19 years old are iron deficient, with 2% to 3% classified as having iron-deficiency anemia (Centers for Disease Control and Prevention [CDC], 1998).
Rapid growth may temporarily decrease circulating iron levels, resulting in physiologic anemia of growth. Other risk factors for iron-deficiency anemia are listed in Box 19-1. Recent data suggest that overweight adolescents are almost three times more likely to experience iron deficiency than their normal-weight peers despite having similar dietary intakes of iron and vitamin C (Tussing-Humphreys et al., 2009). During adolescence, iron deficiency anemia may impair the immune response, decrease resistance to infection, and decrease cognitive functioning and short-term memory.
Folic Acid
The DRI for folate intake among teens is 300 mcg/day for 9- to 13-year-old males and females, increasing to 400 mcg/day for 14- to 18-year-olds (IOM, 2006). The need for folate increases during later adolescence to support accretion of lean body mass and to provide AI among females of reproductive age as a preventive measure against neural tube defects. Food sources of folate should include both naturally occurring folate, found in dark green leafy vegetables and citrus fruit, as well as folic acid found in fortified grain products.
Median intakes of folate reported in the 2005-2006 What We Eat in America survey suggest that adolescent females are at greater risk for inadequate intake of folate than are males (USDA, 2008). This is cause for concern among adolescent females who have achieved menses and are sexually active, as having adequate folic acid status prior to conception is important for the prevention of birth defects.
Vitamin D
Vitamin D plays an important role in facilitating calcium and phosphorus absorption and metabolism, which has important implications for bone development during adolescence (IOM, 2010). Vitamin D can be synthesized by the exposure of skin to sunlight; however, many individuals live in latitudes that prevent them from synthesizing vitamin D for 6 or more months each year (Ginde et al., 2009). Individuals with darkly pigmented skin may also have a limited capacity for vitamin D production by the body (McDowell et al., 2008). The current RDA for vitamin D requirements among adolescents is 600 IU/day (IOM 2010).
NHANES data collected during the preceding few decades has established that serum 25 (OH) vitamin D levels decreased among adolescents over time (Ginde et al., 2009). The reductions were especially obvious among black participants. Greater declines in serum vitamin D status were found among females than males. The reduction in vitamin D status is troubling for adolescent females because of their poor intake of calcium and elevated lifetime risk for osteoporosis.
A criteria of less than 10 ng/mL for deficiency and 30 ng/mL or more for sufficiency has been suggested; however, this is an area of current debate. Using this definition, less than 1% of white adolescents are vitamin D–deficient and 39% of females and 29% of males are not vitamin D–sufficient (Ginde et al., 2009). Mexican American females have a vitamin D deficiency prevalence of 2%, whereas less than 1% of their male peers are deficient. More than half (59%) of Mexican American teen males and 76% of females are thought to be vitamin D–insufficient. Black teens appear to have the highest rates of vitamin D deficiency and insufficiency, probably because of their dark pigmentation, with 4% of adolescent black males and 10% of adolescent black females deficient; 75% of black males and 92% of black females are vitamin D–insufficient.
Thus low vitamin D intake is a potential health risk for adolescents and deserves greater attention during nutrition assessment, education, and intervention. Vitamin D intake and adequacy should be assessed for all adolescents who live in northern climates, who have limited sun exposure, who have lactose intolerance or milk allergy, who have developmental disabilities that may limit outdoor activities, or who have darkly pigmented skin.
Supplement Use by Adolescents
The consumption of moderate portions of a wide variety of foods is preferred to nutrient supplementation as a method for obtaining adequate nutrient intake. Despite this recommendation, studies show that adolescents do not consume nutrient-dense foods and usually have inadequate intakes of many vitamins and minerals; thus supplements may be beneficial for many teens. National surveys show that 30% to 40% of adolescents report using vitamin or mineral supplements (Shaikh et al., 2009). The adolescents most likely to use supplements are those with a higher household income, a high degree of food security, and health insurance. Supplement users usually meet national guidelines for physical activity, dietary intake, and screen time.
The use of herbal and botanical supplements is not well documented. It is estimated that 29% of adolescents consume nonnutritional supplements, including herbal weight loss products (Yussman et al., 2006). Surveys suggest that herbal weight loss products are most commonly used, with up to 18% of youth reporting their use (Calfee and Fadale, 2006). Creatine, guarana, energizers (e.g., bee pollen), L-carnitine, and coenzyme Q10 are other products that are commonly reported by adolescents. The short- and long-term effects of nonnutritional supplement use by children and adolescents are not known. Health professionals should screen adolescents for supplement use and should counsel them accordingly.
Food Habits and Eating Behaviors
Food habits that are seen more frequently among teens than other age groups include irregular consumption of meals, excessive snacking, eating away from home (especially at fast-food restaurants), dieting, and meal skipping. Many factors contribute to these behaviors, including decreasing influence of family, increasing influence of peers, exposure to media, employment outside the home, greater discretionary spending capacity, and increasing responsibilities that leave less time for teens to eat meals with their families. Socioeconomic status, family meal frequency, and home availability of healthy foods have been positively associated with vegetable, fruit and starchy food patterns (Cutler et al., 2011). Most adolescents are aware of the importance of nutrition and the components of a healthy diet; however, they may have many barriers to overcome.
Teens perceive taste preferences, hectic schedules, the accessibility of different foods at home and school, and social support from family and friends to be key factors that affect their food and beverage choices (Goh et al., 2009; Powers et al., 2010). For example, parents may positively influence the food and beverage choices of teens by modeling healthy eating habits, selecting healthy foods for family meals, encouraging healthy eating, and setting limits on the consumption of unhealthy snack foods. Friends influence each other through modeling and shared activities, such as eating out at fast-food restaurants and purchasing snacks at convenience stores near school.
Developmentally, many teens lack the ability to associate current eating habits with future disease risk. Teens are often more focused on “fitting in” with their peers. They adopt health behaviors that demonstrate their quest for autonomy and make them feel more like adults such as drinking alcohol, smoking, and engaging in sexual activity. Nutrition education and counseling should focus on short-term benefits, such as improving school performance, looking good, and having more energy. Messages should be positive, developmentally appropriate, and concrete. Specific skills such as choosing water or milk over sugar-sweetened drinks, ordering broiled rather than fried meats, and choosing baked rather than fried snack chips are key concepts to include.
Irregular Meals and Snacking
Meal skipping is a common behavior among adolescents. Meal skipping increases throughout adolescence as teens try to sleep longer, try to lose weight through calorie restriction, and try to manage their busy lives. Breakfast is the most commonly skipped meal. National data suggest that 30% of adolescents (12-19 years) skip breakfast on a given day (Moshfegh, 2005). Adolescent males are more likely than females (38% vs. 27%) to report having breakfast daily, whereas females are more likely than males (16% vs. 13%) to report never eating breakfast (Timlin et al., 2008). Breakfast skipping has been associated with poor health outcomes including higher BMI; poorer concentration and school performance; and increased risk of inadequate nutrient intake, especially of calcium and fiber (Rampersaud et al., 2005).
Teens who skip meals often snack in response to hunger instead of eating a meal. Most teens (89%) consume at least one snack per day and the majority of teens who report snacking consume two or more snacks per day (Sebastian et al., 2008). On a given day, more than one third of all fruit servings, approximately one fourth of all grain and milk servings, and approximately 15% of vegetable servings are consumed at snacking occasions. However, snacks also provide more than one third of discretionary calories and added sugars, and approximately one fourth of solid fats (Sebastian et al., 2008). Snack foods consumed by teens are often high in added fats, sweeteners, and sodium. Soft drinks and other sugar-sweetened beverages are commonly consumed, accounting for 13% of daily caloric intake among teens (Wang et al., 2008). Because snacks are prevalent and often consumed in place of meals, teens should be encouraged to make healthy choices when choosing these snack foods and beverages. Box 19-2 provides ideas for healthy snacks or meal alternatives for teens.
Fast Foods and Convenience Foods
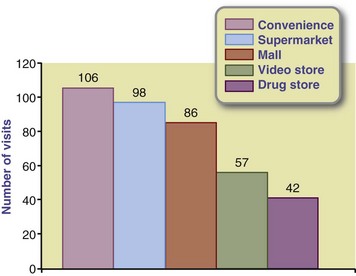
Convenience foods include foods and beverages from vending machines, canteens, school stores, fast-food restaurants, and convenience stores. As adolescents spend considerable amounts of time in and around schools, convenience foods available at school and in the surrounding neighborhood may have a great influence on their eating patterns. National data indicate vending machines are available in 62% of middle schools and 86% of high schools (O’Toole et al., 2007). One third of middle schools and half of all high schools have a school store or canteen where students can purchase food or beverages (O’Toole et al., 2007). In addition, one third of U.S. middle schools and high schools have at least one fast-food restaurant or convenience store within walking distance (Zenk and Powell, 2008). Fast-food restaurants and convenience stores are socially acceptable places for teens to work and spend time with their friends.
Convenience foods tend to be low in vitamins, minerals, and fiber, but high in calories, added fat, sweeteners, and sodium (Gordon et al., 2007). National data suggest that 59% of adolescents (12-19 years) consume at least one item from a fast-food restaurant and 44% to 55% consume at least one convenience food item at school on a given day (Fox et al., 2009; Sebastian et al., 2009). Few teens are willing to stop purchasing convenience foods; the low price, convenient access, and taste appeal to them (Figure 19-4). Health professionals should refrain from asking teenagers to not eat these foods and should instead counsel them on how to make wise and healthy choices. Concrete guidelines, such as choosing snacks or vending and fast-food options with fewer than 5 g of fat per serving, are easy for adolescents to remember. Teens can also be encouraged to check labels to determine if foods are made from whole grains or are high in added sweeteners or sodium.
Family Meals
The frequency with which adolescents eat meals with their families decreases with age (National Center on Addiction and Substance Abuse, 2007). Half of 12-year-olds eat dinner with their families every day in a typical week compared with just 27% of 17-year-olds. Adolescents who eat meals with their families have been found to have better academic performance and to be less likely to engage in risky behaviors such as drinking alcohol and smoking compared with peers who do not frequently engage in family meals (Neumark-Sztainer et al., 2010).
Developing healthful eating patterns at family meals during adolescence may improve the likelihood that individuals will choose to consume nutritious foods in adulthood (Larson et al., 2007). Family meals not only allow for more communication between teens and their parents, but they also provide an ideal environment during which parents can model healthy food and beverage choices and attitudes toward eating. Teens who eat at home more frequently have been found to consume fewer soft drinks and more calcium-rich foods, fruit, and vegetables (see Focus On: Family Meals and Nutritional Benefits for Teens).
 Focus On
Family Meals and Nutritional Benefits for Teens
When teens regularly share mealtimes with their families, they are more likely to have diets of higher nutritional quality (Neumark-Sztainer et al., 2010). One study examined whether this relationship may hold true not only for the general population, but also for racially diverse teens at risk for academic failure (Fulkerson et al., 2009). Students at six alternative high schools in the Minneapolis-St. Paul metropolitan area of Minnesota were surveyed about their dietary practices and other aspects of health. More than half (60%) of students at these schools qualified for free or reduced-price school meals. Among these students, 50% reported eating family dinners five to seven times per week, 24% reported eating family dinners one to four times per week, and 26% reported not eating family dinners in the past week. The results showed that family dinner frequency was related to higher daily fruit consumption and lower rates of overweight. However, in contrast to other studies, family dinner frequency was not related to vegetable consumption, high-fat food intake, regular soda consumption, or use of weight-loss practices. Health professionals should be aware that intervention programs to promote family meals may be beneficial, but such programs need to direct attention to the specific needs of at-risk teens, including the affordability of healthful foods for families.
Media and Advertising
Marketing to teenagers has become a multibillion-dollar business. It is estimated that the nation’s largest food and beverage companies spend $1.6 billion per year to market their products to youth (Federal Trade Commission, 2008). Food and beverage companies promote their products to youth using a number of different techniques (e.g., contests, product placements, sponsorships, celebrity endorsements, viral marketing) and multiple platforms.
American youth spend 7.5 hours per day with media and, given the amount of time they spend using more than one medium at a time, they are exposed to more than 10.5 hours of media content (Rideout et al., 2010). Outside of school work, on an average day, youth spend 4.5 hours watching television and movies, 2.5 hours listening to radio or recorded music, 1.5 hours using a computer, 1.2 hours playing video games, and 38 minutes reading magazines or books. The majority of youth (71%) have a television and 33% have Internet access in their bedroom. As the time that youth spend with media has increased over time (Rideout et al., 2010), so has the ability for advertisers to influence their eating behaviors. It is estimated that teenagers (13-17 years) view more than 28,000 television advertisements per year or more than 217 hours of advertising (Gantz et al., 2007). More than 20% of television advertisements viewed by teens are for food products (Gantz et al., 2007), and most viewed food advertisements (89%) are for products high in fat, sugar, or sodium (Powell et al., 2007). In addition, more than two thirds of the nation’s largest food and beverage companies market their products to youth online (Federal Trade Commission, 2008). Media literacy education can and should be taught to teens to assist them in determining the accuracy and validity of media and advertising messages.
Dieting and Body Image
Body image concerns are common during adolescence. Many teens describe themselves as being overweight despite being of normal weight, signifying a disturbance in their body image. Data from the Youth Risk Behavior Survey (YRBS) found that 16% of U.S. high school students described themselves as being overweight despite being of normal weight (Talamayan et al., 2006). Females were more likely to report this misperception than males (25% vs. 7%).
Poor body image can lead to weight control issues and dieting. Data from the 2007 YRBS show that 45% of U.S. high school students were attempting to lose weight. White and Hispanic females had the highest prevalence of dieting at 62%, followed by black females (49%), Hispanic males (38%), white males (29%), and black males (25%) (Eaton et al., 2008). The prevalence of dieting increased with age among females, but decreased with age among males.
Approximately half (53%) of females and 28% of males reported eating fewer calories or less fat in the previous month to either lose weight or prevent weight gain (Eaton et al., 2008). Additionally, 67% of females and 55% of males had exercised in the previous month to lose weight or prevent weight gain. These behaviors can be viewed as healthy weight loss behaviors when used in moderation, and can be a starting point for nutrition education and counseling to improve eating behaviors.
Not all dieting behaviors have the potential to improve health, however. High-risk dieting practices are used by many teens and carry with them the risk of poor nutritional status and increased risk for disordered eating (see Chapter 23). Fasting, or refraining from eating for more than 24 hours, was practiced by 16% of female and 7% of male U.S. high school students in the past month as a means of dieting (Eaton et al., 2008). Seven percent of females and four percent of males had used diet pills to lose weight; the prevalence of this behavior was higher among white and Hispanic students and increased with age. The use of purging methods, including vomiting and laxative or diuretic use, was reported by 6% of females and 2% of males. White and Hispanic females were more likely to report purging behaviors than black females. In contrast, black and Hispanic males were more likely to report purging behaviors than white males.
Nutrition Screening, Assessment, and Counseling
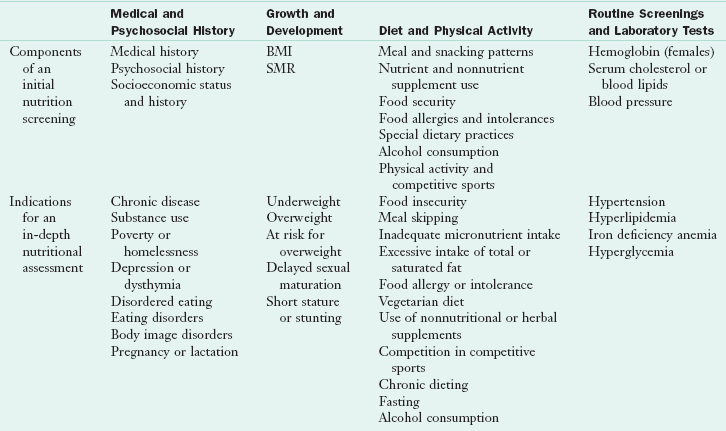
The Guidelines for Adolescent Preventive Services recommend that adolescents have an annual health screening to determine risk factors for acute and chronic disease, with screening for nutrition risk (American Medical Association, 2006). Nutrition screening should include the assessment of height, weight, and BMI to determine weight status; detection of potentially high-risk dietary habits such as calorie restriction, vegetarianism, and dealing with food allergies; and the evaluation of the presence of iron-deficiency anemia (females only). See Chapters 6-9.
Weight, height, and BMI should be plotted using the Centers for Disease Control and Prevention National Center for Health Statistics BMI tables to determine appropriateness of weight for height. Although BMI is not a direct measure of body fatness and thus cannot be used to clinically assess obesity, it is highly correlated with body fatness and is the recommended screening method for weight status among youth (Freedman and Sherry, 2009). A BMI below the fifth percentile may signal the presence of chronic or metabolic disease, growth failure, or an eating disorder. A BMI at or above the 85th percentile, but below the 95th percentile, indicates that an adolescent is at risk for overweight, whereas a BMI at or above the 95th percentile indicates the presence of overweight. All BMI values that indicate the presence of overweight risk should be corroborated with a direct measure of body fat to determine that excessive fat, or obesity, is truly indicated.
When nutrition screening indicates the presence of nutritional risk, a full assessment should be conducted. Components of a full nutrition assessment are listed in Table 19-7. Nutrition assessment should include a complete evaluation of food intake through a 24-hour recall, dietary records, or brief food frequency questionnaire (see Chapter 6). The adequacy of energy, fiber, macronutrients, and micronutrients should be determined, as well as excessive intake of any dietary components such as sodium or sweeteners.
TABLE 19-7
Elements of a Nutritional Screening and Assessment for Adolescents
BMI, Body mass index; SMR, sexual maturity rating.
Reprinted with permission from Stang J, Story M, editors: Guidelines for adolescent nutrition services, Minneapolis, 2005, Center for Leadership Education and Training in Maternal and Child Nutrition, Division of Epidemiology and Community Health, School of Public Health, University of Minnesota.
Nutritional assessments also should include an evaluation of the nutritional environment, including parental, peer, school, cultural, and personal lifestyle factors. The attitude of the adolescent toward food and nutrition is also important; helping them overcome their perceived barriers to eating well is an essential component of nutrition counseling,
Teens who live in food-insecure households, temporary housing, or shelters, or who have run away from home are at especially high nutritional risk, as are adolescents who use alcohol and street drugs. It is important that health professionals working with high-risk teens develop partnerships with community-based food assistance programs to ensure that youths have access to a steady, nutritious food supply. Homeless teens, as well as those living in temporary shelters, benefit from nutrition counseling focusing on lightweight, low-cost, prepackaged foods that do not require refrigeration or cooking facilities. Dried fruit, nuts, granola bars, cereal bars, tuna in pouches, and meat jerky are foods that should be available for runaway or homeless teens.
Education and counseling should be tailored to meet any specific nutrition diagnoses identified during the assessment. A teen who has been found to be overweight with type 2 diabetes requires a different type and intensity of counseling than a teen who has been diagnosed with iron-deficiency anemia. Knowledge, attitude, and behavior must be addressed when guiding adolescents toward acquiring healthful food habits. For a plan to succeed, the adolescent must be willing to change; therefore an assessment of a teenager’s desire to change is essential. Encouraging the desire to change usually requires much attention (see Chapter 15).
Information can be provided in various settings ranging from the classroom to the hospital. The clinician must understand the change process and how to meaningfully communicate this process. Parents may be included in the process and are encouraged to be supportive. Recommended eating plans based on recommended energy intakes for adolescents are shown in Table 19-8.
TABLE 19-8
Recommended Number of Servings for Adolescents Ages 13 and 16 Years Based on Activity Level
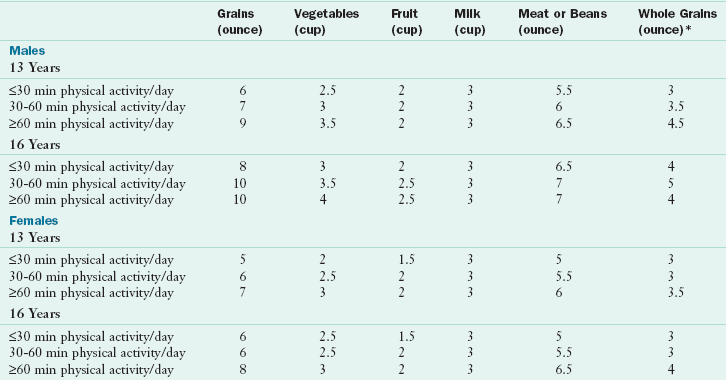
*Number of servings of whole grains are not in addition to but are included in the number of servings of grains.
Special Concerns
As adolescents mature they begin to develop autonomous social, moral, and ethical values. These values may lead to vegetarian eating practices because of concerns about animal welfare, the environment, or personal health. Concerns about body weight also motivate some adolescents to adopt a vegetarian diet because it is a socially acceptable way to reduce dietary fat. Recent data confirm that adolescents who consume vegetarian diets are less likely to be overweight or obese than their omnivorous peers (Robinson-O’Brien et al., 2009). Well-planned vegetarian diets that include a variety of legumes, nuts, and whole grains can provide adequate nutrients for teens who have completed the majority of their growth and development (Figure 19-5).

FIGURE 19-5 Teenagers who help to prepare safe, nutritious meals become engaged in the healthy eating process.
Vegetarian diets that become increasingly more restrictive should be viewed with caution, however, because this may signal the development of disordered eating, with the vegetarian diet used as a means to hide a restriction of food intake (Robinson-O’Brien et al., 2009). Both teen males and females who adopt vegetarian dietary patterns have been found to use more high-risk weight control behaviors, especially vomiting, to lose weight (Robinson-O’Brien et al., 2009). This increased risk for unhealthy weight control behaviors seems to persist even after the vegetarian eating style is discontinued, suggesting that although the issues are related, vegetarian diets likely do not cause disordered eating and instead may serve as an early symptom.
Vegetarian adolescents often have high intakes of iron, vitamin A, and fiber and low intakes of dietary cholesterol. Vegetarian diets that include eggs or dairy products are consistent with the Dietary Guidelines for Americans and can meet the DRIs for all nutrients. A sample eating plan to assist vegetarian teens in achieving adequate energy and nutrient intakes is listed in Table 19-9. Vegan and macrobiotic diets, which do not include animal products of any kind, do not provide natural sources of vitamin B12 and may be deficient in calcium, vitamin D, zinc, and iron (Kirby & Danner, 2009). Therefore it is imperative that vegan adolescents choose foods that are fortified with these nutrients or take a daily multivitamin-mineral supplement. Adolescents and their caregivers should be instructed on the planning of well-balanced vegetarian diets and fortified foods that can prevent potential nutrient deficiencies.
TABLE 19-9
Suggested Daily Food Intake Guide for Vegetarian Adolescents
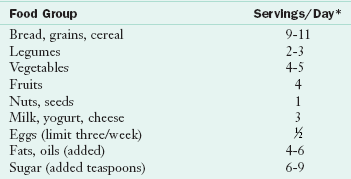
*Age 11 years or older; 2200-2800 kcal.
Modified from Story M, Holt K, Sofka D, editors: Bright futures in practice: nutrition, ed 2, Arlington, Va, 2002, National Center for Education in Maternal and Child Health.
Disordered Eating and Eating Disorders
It is estimated that 10% to 20% of teens engage in disordered eating behaviors, such as binge-purge behavior, compensatory exercise, laxative and diuretic abuse, and binge eating (CDC 2008). These behaviors do not occur with enough regularity or frequency to be diagnosed as an eating disorder, but may still have significant health implications for teens. Symptoms that may signal the presence of disordered eating behaviors include recurring gastrointestinal complaints, amenorrhea, or unexplained weight loss. Overweight females have been found to be twice as likely to engage in disordered eating behaviors. A screening for disordered eating can easily be done and should include questions about body dissatisfaction, fear of becoming obese, frequency of dieting and fasting, use of laxatives and diuretics, use of diet pills, fear of certain foods (e.g., foods containing fat or sugar), vomiting, bingeing, and compensatory exercise (see Chapter 23).
Eating disorders are the third most common chronic illness in adolescent females, with an incidence of from 1.5% to 5%. In general, anorexia nervosa is characterized by a dangerously low body weight, preoccupation with thinness, and restrictive dietary behaviors. Bulimia nervosa is characterized by a body weight that is close to normal, episodes of uncontrollable eating (bingeing), and efforts to eliminate calories or food from the body (purging). Binge eating disorder is characterized by frequent, recurrent episodes of binge eating and loss of control over eating.
Diagnostic criteria for eating disorders provided by the Diagnostic and Statistical Manual of Mental Disorders, 4th edition, need to be used judiciously with adolescents because of issues surrounding normal growth and development. The wide variability in the rate, timing, and velocity of height and weight gain during normal puberty; the absence of menstrual periods in early puberty combined with the unpredictability of menses soon after menarche; and the cognitive inability to understand abstract concepts limit the application of the diagnostic criteria to adolescents (American Dietetic Association, 2006). Adolescents are particularly vulnerable to the complications of eating disorders. The effect of malnutrition on linear growth, brain development, and bone acquisition can be persistent and irreversible. Yet with early and aggressive treatment, adolescents have the potential for a better outcome than adults who have had the disease longer (Steinhausen, 2008).
Obesity
Adolescent obesity has both short- and long-term health consequences. Adolescents who are overweight are at higher risk for hyperlipidemia, hypertension, insulin resistance, and type 2 diabetes compared with normal weight peers (Cali and Carpior, 2008; Daniels et al., 2005). Data from NHANES suggest that the prevalence of metabolic syndrome is increasing among adolescents, from a rate of 9.2% in the 1988-1994 survey to 12.7% in the 1999-2000 survey (de Ferranti et al., 2006). Epidemiologic studies of obesity and disease risk demonstrate an increased risk of morbidity from coronary heart disease, arteriosclerosis, specific types of cancer, gout, and arthritis among individuals who were overweight or obese during adolescence (van Dam et al., 2006).
Adolescent weight status is evaluated based on BMI (weight/height2 [kg/m2]) as shown in Appendixes 12 and 16. Among 12- to 19-year-olds in the United States, the prevalence of overweight, characterized by a BMI higher than the 85th percentile, is 34.2% (Ogden et al., 2010). The prevalence of obesity (BMI ≥95th percentile) is 18.1%. Obesity is a complex, multifactorial health issue that is influenced by genetics, metabolic efficiency, PAL, dietary intake, and environmental and psychosocial factors. Adolescents who are found to be overweight should have a fasting lipid profile completed and should be assessed for additional risk factors for chronic disease, such as personal history of hypertension, hyperlipidemia, and tobacco use, and family history of hypertension, early cardiovascular death, stroke, hyperlipidemia, and type 2 diabetes mellitus (Krebs et al., 2007). If risk factors are noted, aspartate aminotransferase and alanine aminotransferase measurements to assess liver function should be obtained as well.
A fasting glucose level should be drawn on any overweight adolescent with two or more risk factors for CVD or with a family history of diabetes. Obese teens should undergo the same laboratory assessments as overweight children, with the addition of microalbumin/creatinine or microalbumin/creatinine ratio. Additional assessments for conditions such as sleep apnea, orthopedic disorders, polycystic ovary disease, and hormonal abnormalities should be performed based on presenting symptoms.
Recent guidelines for adolescent overweight and obesity suggest a staged care treatment process based on a teen’s BMI, age, motivation, and the presence of comorbid conditions (Spear et al., 2007). Four stages are recommended, with progress through the stages based on age, biological development, level of motivation, weight status, and success with previous stages of treatment. Each of the stages is briefly described in the following text.
Overweight adolescents start out in Stage 1 if they do not display comorbid conditions or have not completed the adolescent growth spurt. Stage 1 consists of general nutrition and physical activity advice to promote health and prevent disease. Educational components for this stage of treatment include consuming 5 or more servings of fruits and vegetables per day, reducing consumption of sweetened beverages, participating in at least 60 minutes of physical activity each day, and limiting screen time (movies, Internet, television, and computer and video games) to no more than 2 hours per day. Nutrition topics that are particularly important to discuss with overweight adolescents during Stage 1 include the importance of breakfast consumption, limiting food eaten outside the home or school (including fast food), eating meals with their family at least five times per week, and appropriate portion size. This stage of obesity treatment can be provided by a single health care provider, including physicians, nurses, and dietitians who have training in pediatric weight management.
Stage 2 builds on the same concepts as Stage 1, but in a more structured way. A key component of Stage 2 is the monitoring of food and beverage intake by adolescents or their parents, usually done through daily food and exercise journals or record books. Screen time is more limited in Stage 2 to less than 1 hour per day and a meal plan is introduced to provide further guidance for dietary intake. Successful lifestyle changes should be reinforced through the use of age-appropriate, nonfood rewards such as tickets to a local event or museum, jewelry, clothing, or music. Stage 2 can be provided by a single health care provider with training in motivational counseling. Referrals for additional services such as physical therapy or counseling may be necessary for some adolescents during Stage 2. Monthly follow-up and assessment of progress is suggested for both Stages 1 and 2.
Stage 3 is more structured than Stage 2 and is provided by a multidisciplinary team consisting of a physician or pediatric nurse practitioner, a counselor (psychologist or social worker), a registered dietitian, and an exercise physiology or physical therapist. This treatment stage recommends 8-12 weeks of weekly appointments with the adolescent and their family, followed by monthly or bimonthly follow-up appointments. A highly structured meal plan and physical activity schedule are implemented, along with a formal behavior modification program.
Stage 4 treatment is reserved for severely obese adolescents or those who have significant comorbidities that require concerted intervention. This treatment stage is available only in clinical settings that employ a full range of health professionals who are specifically trained in the behavioral and medical management of pediatric obesity. Intensive dietary regimens such as meal replacement, protein-sparing modified fasts, oral medication, and bariatric surgery may be used in this stage.
Concern has been expressed regarding the use of bariatric surgery in adolescents. Recommendations for bariatric surgery suggest that it is only appropriate in severely overweight teens (BMI >40) with severe comorbid medical conditions or those with a BMI of more than 50 who have completed most of their physical growth and development (Pratt et al., 2009). Difficulty in complying with dietary restrictions following surgery may lead to complications such as dumping syndrome following high carbohydrate intake, voluntary excessive food intake, meat impacted in a gastrojejunal anastomosis, and B vitamin deficiency caused by poor compliance with vitamin-mineral supplementation
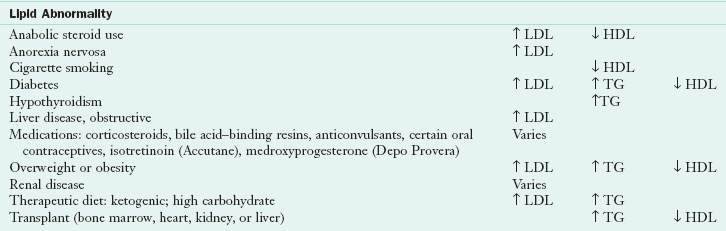
Hyperlipidemia and Hypertension
Hyperlipidemia and hypertension, both risk factors for CVD, are apparent in adolescence and have been shown to be predictive of CVD risk in later life (Celermajer and Ayer, 2006; Gidding, 2007). Table 19-10 lists the classification criteria for the diagnosis of hyperlipidemia among youth. National data suggest that one in five adolescents 12-19 years old has elevated blood lipid levels (CDC, 2010). The prevalence of hyperlipidemia among adolescents was not consistent, however. The prevalence of hyperlipidemia was 14% among normal weight, 22% among overweight, and 43% among obese teens. The prevalence of low high-density lipoprotein (HDL) cholesterol and high triglyceride levels appeared to increase with age. Adolescent males were almost three times more likely to have low HDL cholesterol levels compared with females at any age. These youth are considered candidates for therapeutic lifestyle counseling with emphasis on nutrition and physical activity intervention.
TABLE 19-10
Classification of LDL and Total Cholesterol Levels in Adolescents*
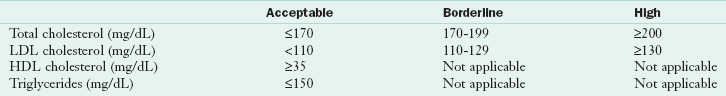
HDL, High-density lipoprotein; LDL, low-density lipoprotein.
*Based on the average of two measurements.
Data from National Cholesterol Education Program (U.S.): Report of the expert panel on blood cholesterol levels in children and adolescents, NIH publication no. 91-2732, Bethesda, Md, 1991, National Institutes of Health, National Heart, Lung, and Blood Institute; National Cholesterol Education Program: Cholesterol in childhood (RE9805) policy statement, Am Acad Pediatr 101(1):141, 1998. Accessed 10 November 2006 from http://www.aappolicy.aappublications.org/.
It is important to consider secondary causes of hyperlipidemia when determining dietary treatment options (Table 19-11). Nutrition intervention for elevated blood lipids focuses on reducing the intake of total, saturated, and trans fat and limiting dietary cholesterol intakes. Promoting healthy lifestyle behaviors to reduce CVD risk should include a discussion of the benefits of regular physical activity in addition to dietary recommendations.
TABLE 19-11
Secondary Causes of Hyperlipidemia
HDL, High-density lipoprotein; LDL, low-density lipoprotein; TG, triglyceride.
Reprinted with permission from Stang J, Story M, editors: Guidelines for adolescent nutrition services, Minneapolis, 2005, Center for Leadership Education and Training in Maternal and Child Nutrition, Division of Epidemiology and Community Health, School of Public Health, University of Minnesota.
National screening criteria for blood pressure levels among adolescents are listed in Tables 19-12 and 19-13. Teenagers 17 years of age and younger are determined to have prehypertension if their average blood pressure readings fall between the 90th and 94th percentiles. Hypertension is diagnosed when the average of three blood pressure measurements exceed the 95th percentile for age, gender, and height.
TABLE 19-12
90th and 95th Percentiles for Blood Pressure for Adolescent Males by Height Percentiles
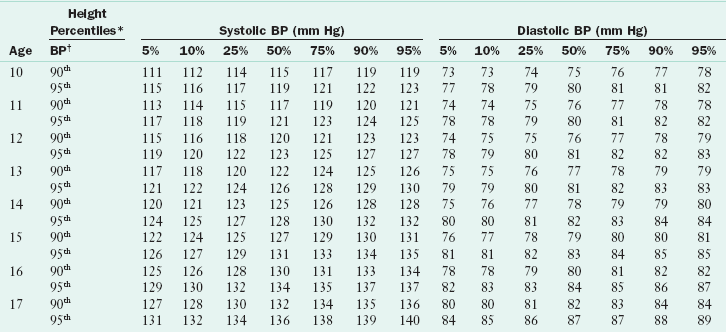
*Height percentile determined by standard growth curves.
†Blood pressure percentile determined by a single measurement.
From National High Blood Pressure Education Program Working Group on High Blood Pressure in Children and Adolescents: Fourth report on the diagnosis, evaluation, and treatment of high blood pressure in children and adolescents, Pediatrics 114(2):555-576, 2004. This supplement is a work of the U.S. government, published in the public domain by the American Academy of Pediatrics. Available at http://www.pediatrics.org/cgi/content/full/114/2/S2/555.
TABLE 19-13
90th and 95th Percentiles for Blood Pressure for Adolescent Females by Height Percentiles
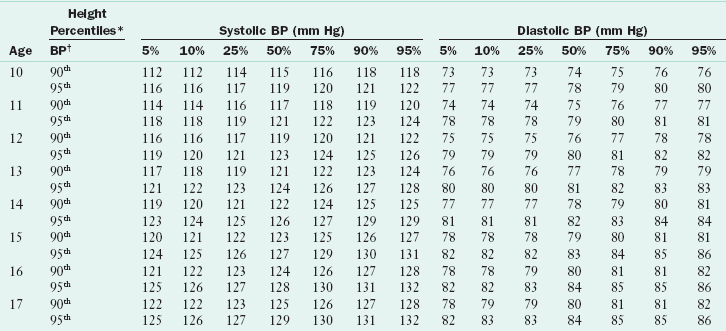
*Height percentile determined by standard growth curves.
†Blood pressure percentile determined by a single measurement.
From National High Blood Pressure Education Program Working Group on High Blood Pressure in Children and Adolescents: Fourth report on the diagnosis, evaluation, and treatment of high blood pressure in children and adolescents, Pediatrics 114(2):555-576, 2004. This supplement is a work of the U.S. government, published in the public domain by the American Academy of Pediatrics. Available at http://www.pediatrics.org/cgi/content/full/114/2/S2/555.
Dietary counseling and weight management are integral components of hypertension treatment. The Dietary Approaches to Stop Hypertension (DASH) eating pattern has been shown to be effective in reducing blood pressure in many individuals (see Chapter 34 and Appendix 33). In addition to the DASH diet, teens with elevated blood pressure should be counseled to reduce sodium intake to less than 2000 mg/day and to achieve and maintain a healthy body weight.
Physical Activity
National recommendations for physical activity suggest that all youth should be active at least 60 minutes each day, including participating in vigorous activity at least 3 days each week (U.S. Department of Health and Human Service, 2008). In addition, muscle-strengthening and bone-strengthening activities should each be included in the 60 minutes of physical activity at least three times a week. However, many youths do not meet these recommendations. Only 35% of U.S. students report being physically active for 5 days or more per week, with males nearly twice as likely to meet recommendations as females (CDC, 2008).
Teenage athletes have unique nutrient needs. Adequate fluid intake to prevent dehydration is especially critical for young athletes. Young adolescents are at higher risk for dehydration because they produce more heat during exercise but have less ability to transfer heat from the muscles to the skin. They also sweat less, which decreases their capacity to dissipate heat through the evaporation of the sweat (see Chapter 24).
Athletes who participate in sports that use competitive weight categories or emphasize body weight are at elevated risk for the development of disordered eating behaviors. A concern among female athletes is the female athlete triad relationship, a constellation of low body weight and inadequate body fat levels, amenorrhea, and osteoporosis (see Chapter 23). Female athlete triad may lead to premature bone loss, decreased bone density, increased risk of stress fractures, and eventual infertility (Gottschlich and Young, 2008). Nutrition assessment and education for teenaged athletes should focus on obtaining adequate energy and macro- and micronutrients to meet the needs for growth and development and to maintain a healthy body weight. The use of anabolic agents (such as steroids or insulin) and other ergogenic supplements should also be included in nutrition screening. Survey data suggest that up to 8% of high school students use creatine, 5% use steroids, and 4% use androstenedione (Castillo and Comstock, 2007; CDC, 2008).
Pregnancy
Adolescent females who become pregnant are at particularly high risk for nutritional deficiencies because of elevated nutrient needs. Pregnant adolescents with a gynecologic age (the number of years between the onset of menses and current age) of less than 4 and those who are undernourished at the time of conception have the greatest nutritional needs. As with adult women, pregnant teens require additional folic acid, iron, zinc, calcium, and other micronutrients to support fetal growth (see Chapter 16). Pregnant teens should have a full nutrition assessment done early in pregnancy to determine any nutrient deficiencies and to promote adequate weight gain. Weight gain recommendations for pregnancy are listed in Chapter 16. Referral to appropriate food assistance programs such as the Special Supplemental Food Program for Women, Infants and Children is an important part of prenatal nutrition education.
 Clinical Scenario
Shawna is a 17-year-old girl who is being seen at the pediatric clinic today for a preemployment physical. The physician has recommended that she talk with you, the nutritionist, about her eating habits because her hemoglobin level was low. When you question Shawna about her eating habits, she reveals that she skips breakfast each day because she doesn’t have time to eat in the morning, but she does have a cup of coffee on her way to school at 7:15 am. Shawna’s first food intake is usually a snack from the vending machine at 10:30 am, which consists of a candy bar or a bag of chips and a soft drink. Occasionally she purchases ala carte lunches of tacos or a burger, but generally she skips lunch. Shawna gets out of school at 2 pm and goes to work at the mall. She has a half-hour break in the late afternoon, so she goes to the food court for dinner. The evening meal usually consists of one to two slices of pizza, two tacos, or one to two pieces of chicken with a soft drink. About half of the time she also orders fries or chips. When Shawna gets home from work at 9 pm, she usually has a snack of ice cream, tortilla chips, spicy cheese puffs, or microwave popcorn. She usually has a large glass of juice or lemonade with her snack.
When you suggest to Shawna that she might benefit from eating meals rather than snacks, she says she doesn’t have time to cook meals, especially in the morning. She also tells you that there are no other food choices besides fast foods at the mall where she works.
1. What types of foods might you suggest to Shawna to have for breakfast? Why would you choose these foods?
2. What is the recommended iron intake for a girl of Shawna’s age? Does it appear that she is getting adequate iron intake from her diet? What food choices would you recommend for Shawn to increase her hemoglobin level?
3. How much calcium does a 17-year-old teen girl need? What suggestions could you make to increase Shawna’s calcium intake based on the foods she likes and the places she eats?
4. What types of foods might you suggest that Shawna choose at the mall fast food court to improve her nutrient intake and to help treat her anemia?
American Academy of Pediatrics Media Matters Program
www.aap.org/advocacy/mmcamp.htm
American Alliance for Health, Physical Education, Recreation and Dance
American School Health Association
Centers for Disease Control and Prevention
National Collegiate Athletics Association
National Eating Disorder Association
References
American Dietetic Association. Position of the American Dietetic Association: nutrition intervention in the treatment of anorexia nervosa, bulimia nervosa, and eating disorders not otherwise specified (EDNOS). J Am Diet Assoc. 2006;106:2073.
American Medical Association. Guidelines for adolescent preventive services recommendations monograph. www.ama-assn.org/ama/upload/mm/39/gapsmono.pdf, 2006. [Accessed 12 December 2006 from].
Bachman, JL, et al. Sources of food group intakes among the US populations, 2001-2002. J Am Diet Assoc. 2008;108:804.
Calfee, R, Fadale, P. Popular ergogenic drugs and supplements in young athletes. Pediatrics. 2006;117:e577.
Cali, AMG, Caprio, S. Obesity in children and adolescents. J Clin Endocrinol Metab. 2008;93:S31.
Castillo, EM, Comstock, RD. Prevalence of performance-enhancing substances among United States adolescents. Pediatr Clin N Am. 2007;54:663.
Celermajer, DS, Ayer, JG. Childhood risk factors for adult cardiovascular disease and primary prevention in childhood. Heart. 2006;92:1701.
Centers for Disease Control and Prevention, Recommendations to prevent and control iron deficiency in the United States. MMWR. 1998;47(RR-3):1–29. Available online at. http://www.cdc.gov/mmwr/preview/mmwrhtml/00051880.htm [through www.cdc.gov. Accessed Jan 11, 2011].
Centers for Disease Control and Prevention (CDC). Youth risk behavior surveillance—United States 2007. MMWR Morb Mortal Wkly Rep. 57(SS-4), 2008.
Centers for Disease Control and Prevention (CDC). Prevalence of abnormal lipid levels among youths—United States, 1999-2006. MMWR Morb Mortal Wkly Rep. 2010;59(2):29.
Cutler, GJ, et al. Multiple Sociodemographic and Socioenvironmental Characteristics Are Correlated with Major Patterns of Dietary Intake in Adolescents. J Am Diet Assoc. 2011;111:230.
Daniels, SR, et al. Overweight in children and adolescents: pathophysiology, consequences, prevention, and treatment. Circulation. 2005;111:1999.
De Ferranti, SD, et al. Inflammation and changes in metabolic syndrome abnormalities in US adolescents: findings from the 1988-1994 and 1999-2000 National Health and Nutrition Examination surveys. Clin Chem. 2006;52:1325.
Eaton, DK, et al. Youth risk behavior surveillance—United States, 2007. MMWR Surveill Summ. 2008;57(4):1.
Federal Trade Commission. Marketing food to children and adolescents: a review of industry expenditures, activities, and self-regulation. Washington, DC: Federal Trade Commission; 2008.
Fox, C, et al. Availability and consumption of competitive foods in US public schools. J Am Diet Assoc. 2009;109:S57.
Frazao, E, Meal patterns, milk and soft drink consumption and supplement use. Agriculture Information Bulletin 796-804, February 2005, USDA Economic Research Service. Accessed from. http://www.ers.usda.gov/publications/aib796/aib796-4/aib796-4.pdf
Freedman DS, Sherry B. The Validity of BMI as an Indicator of Body Fatness and Risk Among Children. PEDIATRICS Vol. 124 Supplement September 2009, pp. S23-S34.
Fulkerson, J, et al. Are there nutritional and other benefits associated with family meals among at-risk youth? J Adolesc Health. 2009;45:389.
Gantz, W, et al. Food for thought: television food advertising to children in the United States. Menlo Park, Calif: Kaiser Family Foundation; 2007.
Gidding, SS. Physical activity, physical fitness and cardiovascular risk factors in childhood. Am J Lifestyle Med. 2007;1:499.
Ginde, AA, et al. Demographic differences and trends of vitamin D insufficiency in the US population, 1988-2004. Arch Intern Med. 2009;169:626.
Goh, YY, et al. Using community-based participatory research to identify potential interventions to overcome barriers to adolescents’ healthy eating and physical activity. J Behav Med. 2009;32:491.
Gordon, A, et al. School Nutrition Dietary Assessment Study-III: volume I: school foodservice, school food environment, and meals offered and served. Princeton, N.J.: Mathematica Policy Research, Inc; 2007.
Gottschlich, LM, Young, CC. Female athlete triad, eMedicine specialties. 30 May 2008. Accessed 1 March 2010 from http://emedicine.medscape.com/article/89260-overview.
Ingersoll, GM. Psychological and social development. In: McAnarney ER, Kreipe RE, eds. Textbook of adolescent medicine. Philadelphia: Saunders, 1992.
Institute of Institute of Medicine (IOM) Food and Nutrition Board. Dietary Reference Intakes for Calcium and Vitamin D. Washington, DC: National Academies Press; 2010.
2006. Institute of Medicine (IOM), et al. Dietary reference intakes: the essential guide to nutrient requirements. Washington, DC: National Academies Press; 2006.
Kirby, M, Danner, E. Nutritional deficiencies in children on restricted diets. Pediatr Clin N Am. 2009;56:1085.
Krebs, NF, et al. Assessment of child and adolescent overweight and obesity. Pediatrics. 2007;120:S193.
Larson, xxx, et al. Family meals during adolescence are associated with higher diet quality and healthful meal patterns during young adulthood. J Am Diet Assoc. 2007;107:1502.
McDowell, MA, et al, Blood folate levels: the latest NHANES results. NCHS Data Brief 2008;6:1. Accessed 30 June 2008 from. http://www.cdc.gov/nchs/data/databriefs/db06.htm
Moshfegh, A, et al. What we eat in America, NHANES 2001-2002: usual nutrient intakes from food compared to dietary reference intakes. http://www.ars.usda.gov/Services/docs.htm?docid=9098, 2005. [Accessed 6 December 2005 from].
National Cancer Institute. Risk factor monitoring and methods. http://riskfactor.cancer.gov/diet/usualintakes/pop/t35.html, 2010. [Accessed 8 February 2010 from].
National Center on Addiction and Substance Abuse. The importance of family dinners IV. September 2007. Accessed 10 February 2010 from http://casafamilyday.org/familyday/files/themes/familyday/pdf/Family-Dinners-IV.pdf.
Neumark-Sztainer, D, et al. Family meals and adolescents: what have we learned from Project EAT (Eating Among Teens). Public Health Nutr. 2010;13:1113.
O’Toole, T, et al. Nutrition services and foods and beverages available at school: results from the School Health Policies and Programs Study 2006. J Sch Health. 2007;77:500.
Ogden, CL, et al. Prevalence of high body mass index in US children and adolescents, 2007-2008. JAMA. 2010;303:242.
Powell, L, et al. Nutritional content of television food advertisements seen by children and adolescents in the United States. Pediatrics. 2007;120:576.
Powers, TG, et al. Obesity prevention in early adolescence: student, parent, and teacher views. J Sch Health. 2010;80:13.
Pratt, JSA, et al. Best practice updates for pediatric/adolescent weight loss surgery. Obesity. 2009;17:901.
Rajeshwari, R, et al. Secular trends in children’s sweetened beverage consumption (1973 to 1994): The Bogalusa Heart Study. J Am Diet Assoc. 2005;105:208.
Rampersaud, GC, et al. Breakfast habits, nutritional status, body weight, and academic performance in children and adolescents. J Am Diet Assoc. 2005;105(5):743.
Rideout, VJ, et al. Generation M2: media in the lives of 8- to 18-year-olds. Menlo Park, Calif: Kaiser Family Foundation; 2010.
Robinson-O’Brien, R, et al. Adolescent and young adult vegetarianism: better dietary intake and weight outcomes but increased risk of disordered eating behaviors. J Am Diet Assoc. 2009;109:648.
Rosenfield, RL, et al. Thelarche, pubarche and menarche attainment in children with normal and elevated body mass index. Pediatrics. 2009;123(1):84.
Sebastian, RS, et al. Effect of snacking frequency on adolescents’ dietary intakes and meeting national recommendations. J Adolesc Health. 2008;42:503.
Sebastian, RS, et al. US adolescents and MyPyramid: Associations between fast-food consumption and lower likelihood of meeting recommendations. J Am Diet Assoc. 2009;109:226.
Shaikh, U, et al. Vitamin and mineral supplement use by children and adolescents in the 1999-2004 National Health and Nutrition Examination Survey. Arch Pediatr Adolesc Med. 2009;163:150.
Spear, BA, et al. Recommendations for treatment of child and adolescent overweight and obesity. Pediatrics. 2007;120:S254.
Steinhausen, HC. Outcome of eating disorders. Child Adolesc Adol Psych. 2008;18:225.
Stransky, M, Rysava, L. Nutrition as prevention and treatment of osteoporosis. Physiolog Res. 2009;58:S7.
Talamayan, KS, et al. Prevalence of overweight misperception and weight control behaviors among normal weight adolescents in the United States. ScientificWorldJournal. 2006;6:365.
Tanner, J. Growth at adolescence. Oxford: Blackwell Scientific Publications; 1962.
Timlin, MT, et al. Breakfast eating and weight change in a 5-year prospective analysis of adolescents: Project EAT (Eating Among Teens). Pediatrics. 2008;121:e638.
Tussing-Humphreys, LM. Excess adiposity, inflammation and iron-deficiency in female adolescents. J Am Diet Assoc. 2009;109:297.
U.S. Department of Agriculture, Agricultural Research Service. Nutrient intakes from food: mean amounts consumed per individual, one day, 2005-2006. www.ars.usda.gov/ba/bhnrc/fsrg, 2008. [Accessed 29 January 2010 from].
U.S. Department of Health and Human Services, Physical Activity Guidelines Steering Committee. 2008 physical activity guidelines for Americans. www.health.gov/paguidelines, 2008. [Available at Accessed Jan 14, 2011].
Van Dam, RM, et al. The relationship between overweight in adolescence and premature death in women. Ann Intern Med. 2006;145:91.
Wang, YC, et al. Increasing caloric contribution from sugar-sweetened beverages and 100% fruit juices among US children and adolescents, 1988-2004. Pediatrics. 2008;121:e1604.
World Health Organization, Prevention and management of osteoporosis. Report of a Scientific Group, WHO Technical Report Series no. 921. Geneva: World Health Organization; 2003.
Yussman, SM, et al. Herbal products and their association with substance use in adolescents. J Adolescent Health. 2006;38:395.
Zenk, S, Powell, L. U.S. secondary schools and food outlets. Health Place. 2008;14:336.