Medical Nutrition Therapy for Cardiovascular Disease
Cardiovascular disease (CVD) is a group of interrelated diseases that include coronary heart disease (CHD), atherosclerosis, hypertension, ischemic heart disease, peripheral vascular disease, and heart failure (HF). These diseases are interrelated and often coexist. An estimated 81,100,000 adult Americans (one in three) have one or more types of CVD (Box 34-1).
Sections of this chapter were written by Debra Krummel, PhD, RD for the previous edition of this text.
CVD remains the number one killer of both men and women in the United States; one of every 2.9 deaths is attributed to CVD. In 2010 it is estimated that 1.26 million Americans had a new or recurrent coronary attack. Every 25 seconds an American suffers a coronary event and about every minute someone will die from one (American Heart Association [AHA], 2010). The lifetime risk for CVD in American men is two in three and for women is one in two (AHA, 2010).
Of all causes of death, CHD, cancer, and stroke are the leaders (AHA, 2010). Coronary heart disease (CHD) involves the narrowing of small vessels that oxygenate the heart muscle. Myocardial infarction (MI), or ischemia, in one or more of the coronary arteries with tissue damage, is the main form of heart disease responsible for CVD deaths. Heart disease and stroke cause the most deaths in both sexes of all ethnic groups, increasing with age. Until the age of 65 years, black men have the highest rates of CHD deaths; thereafter white men have the highest rates. Black women have higher rates than white women at all ages. Among whites older than age 18, 12.1% have CVD. In the same age group 10.2% of African Americans have heart disease and in Hispanics the incidence is 8.1%. The incidence in adult Native Americans is 12.1%, in Native Hawaiians or other Pacific Islanders it is 19.7 %, and in Asians it is 5.2%. This chapter discusses the incidence, pathophysiologic findings, prevention, and treatment of each of the CVDs.
Atherosclerosis and Coronary Heart Disease
Atherogenesis is the process leading to development of atherosclerosis. It is a chronic, local, inflammatory response to risk factors, such as high levels of low-density lipoprotein (LDL) cholesterol, that are injurious to the arterial wall (Badimon et al., 2006; Heinecke, 2006 et al.). Hence lesion formation, progression, and eventual plaque rupture result from the release of inflammatory cytokines. Proinflammatory (e.g., tumor necrosis factor-alpha [TNF-α], interleukin [IL]-6, and C-reactive protein [CRP]) and antiinflammatory cytokines (e.g., IL-9, IL-10) are the key proteins that must be balanced to prevent plaque rupture and subsequent clinical events (Tedgui and Mallat, 2006).
Pathophysiology
Atherosclerotic heart disease (ASHD) involves narrowing and loss of elasticity in the blood vessel wall caused by accumulation of plaque. Plaque forms when inflammation stimulates a response by phagocytic white blood cells (monocytes). Once in the tissue, monocytes evolve into macrophages that ingest oxidized cholesterol, and become foam cells and then fatty streaks in these vessels. Intracellular microcalcification occurs, forming deposits within the vascular smooth muscle cells of the surrounding muscular layer (Figure 34-1).
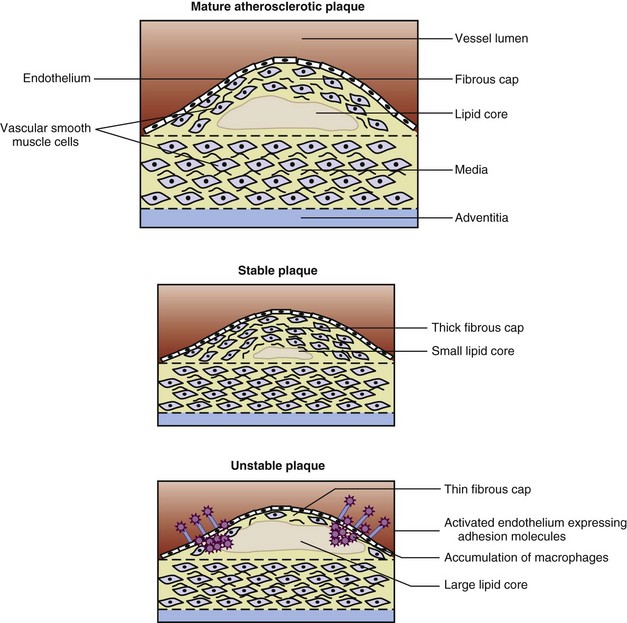
FIGURE 34-1 The structure of mature, stable, and unstable plaque. (From Rudd JHF et al: Imaging of atherosclerosis—can we predict plaque rupture? Trends Cardiovasc Med 15:17, 2005.)
A protective fibrin layer (atheroma) forms between the fatty deposits and the artery lining. Atheromas produce enzymes that cause the artery to enlarge over time, thus compensating for the narrowing caused by the plaque. This “remodeling” of the shape and size of the blood vessel may result in an aneurysm. Atheromas can rupture or break off, forming a thrombus, where they attract blood platelets and activate the clotting system in the body. This response can result in a blockage and restricted blood flow.
Only high-risk or vulnerable plaque forms thrombi. Vulnerable plaque are lesions with a thin fibrous cap, few smooth muscle cells, many macrophages (inflammatory cells), and a large lipid core (Figure 34-2). Arterial changes begin in infancy and progress asymptomatically throughout adulthood if the person has risk factors, is susceptible to arterial thrombosis, or has a genetic susceptibility (Naghavi et al., 2006) (Figure 34-3). Consequently, atherosclerosis is a “silent” disease because many individuals are asymptomatic until the first, often fatal, MI.
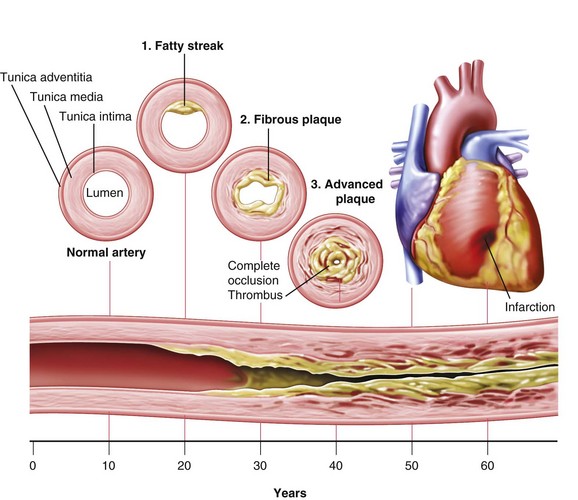
FIGURE 34-2 Natural progression of atherosclerosis. (From Harkreader H: Fundamentals of nursing: caring and clinical judgment, Philadelphia, 2007, Saunders.)
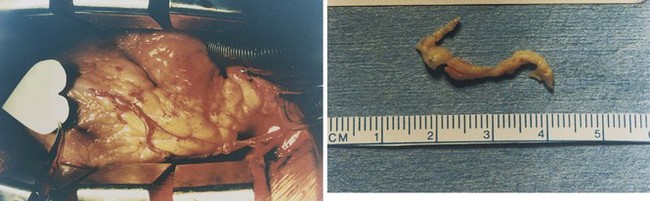
FIGURE 34-3 Plaque that can be surgically removed from the coronary artery. (Photographs courtesy Ronald D. Gregory and John Riley, MD.)
The clinical outcome of impaired arterial function arising from atherosclerosis depends on the location of the impairment. In the coronary arteries atherosclerosis causes angina or chest pain, MI, and sudden death; in the cerebral arteries it causes strokes and transient ischemic attacks; and in the peripheral circulation it causes intermittent claudication, limb ischemia, and gangrene (Figure 34-4). Thus atherosclerosis is the underlying cause of many forms of CVD.
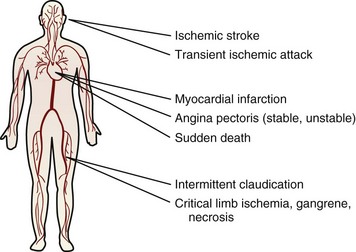
FIGURE 34-4 Major clinical manifestations of atherothrombotic disease. (From Viles-Gonzalez JF et al: Atherothrombosis: a widespread disease with unpredictable and life-threatening consequences, Eur Heart J 25:1197, 2004.)
Cholesterol is delivered into cell walls by low-density lipoprotein (LDL), especially smaller particles. To attract and stimulate the macrophages, the cholesterol must be released from the LDL particles and oxidized, a key step in the ongoing inflammatory process. Additionally, macrophages must move excess cholesterol quickly into high-density lipoprotein (HDL) particles to avoid becoming foam cells and dying. Dyslipidemia refers to a blood lipid profile that increases the risk of developing atherosclerosis. Typically it is a condition in which LDL levels are elevated and HDL levels are low. Three important biochemical measurements in CVD include lipoproteins, total cholesterol, and triglycerides.
Lipoproteins
Because lipid is not water soluble, it is carried in the blood bound to protein. These complex particles, called lipoproteins, vary in composition, size, and density. Lipoproteins measured in clinical practice—chylomicrons, very-low-density lipoprotein (VLDL), low-density lipoproteins (LDL), and high-density lipoproteins (HDL)—consist of varying amounts of triglyceride, cholesterol, phospholipid, and protein. Each class of lipoprotein actually represents a continuum of particles. The ratio of protein to fat determines the density; thus particles with higher levels of protein are the most dense (e.g., HDLs have more protein than LDLs). The physiologic role of lipoprotein includes transporting lipid to cells for energy, storage, or use as substrate for synthesis of other compounds such as prostaglandins, thromboxanes, and leukotrienes.
The largest particles, chylomicrons, transport dietary fat and cholesterol from the small intestine to the liver and periphery. Once in the bloodstream, the triglycerides within the chylomicrons are hydrolyzed by lipoprotein lipase (LPL), located on the endothelial cell surface in muscle and adipose tissue. Apolipoproteins carry lipids in the blood and also control the metabolism of the lipoprotein molecule. Apo C-II, one of the apolipoproteins, is a cofactor for LPL. When approximately 90% of the triglyceride is hydrolyzed, the particle is released back into the blood as a remnant. The liver metabolizes these chylomicron remnants, but some deliver cholesterol to the arterial wall and thus are considered atherogenic. Consumption of high-fat meals produces more chylomicrons and remnants. When fasting plasma studies are done, chylomicrons are normally absent.
Very-low-density lipoprotein (VLDL) particles are synthesized in the liver to transport endogenous triglyceride and cholesterol. Triglyceride accounts for 60% of the VLDL particle. The large, buoyant VLDL particle is believed to be nonatherogenic. Vegetarian and low-fat diets increase the formation of large VLDL particles. Smaller VLDL particles (i.e., remnants) are formed from triglyceride hydrolysis by LPL. Normally these remnants, called intermediate-density lipoproteins (IDLs), are atherogenic and are taken up by receptors on the liver or converted to LDLs. In metabolic syndrome, the remnants are atherogenic (Olufadi and Byrne, 2006). Some of the smaller LDL particles stay in the blood, are oxidized, and are then taken into the arterial wall. Clinically, a total triglyceride level is a measurement of the triglycerides carried on both the VLDL and the IDL remnants.
LDL is the primary cholesterol carrier in blood, formed by the breakdown of VLDL. After LDL formation, 60% is taken up by LDL receptors on the liver, adrenals, and other tissues. The remainder is metabolized via nonreceptor pathways. Both the number and activity of these LDL receptors are major determinants of LDL cholesterol levels in the blood. Apo B-100 (apo B) constitutes 95% of the apolipoproteins in LDL. Persons with a high triglyceride level usually have high apo B levels, giving these particles a longer time to deposit lipid in the arterial wall (Marcovina and Packard, 2006). High LDL cholesterol is specifically associated with atherosclerosis.
HDL particles contain more protein than any of the other lipoproteins, which accounts for their metabolic role as a reservoir of the apolipoproteins that direct lipid metabolism. Apo A-I, the main apolipoprotein in HDL, is an antiinflammatory, antioxidant protein that also helps to remove cholesterol from the arterial wall to the liver (Barter and Rye, 2006). Numerous groups promote evaluation of apo A-I or the ratio of apo B to apo A-I to determine risk and treatment (Marcovina and Packard, 2006; Walldius and Jungner, 2006). The lower the ratio, the lower the CHD risk. Both apo C and apo E on HDL are transferred to chylomicrons. Apo E helps receptors metabolize chylomicron remnants and also inhibits appetite (Gotoh et al., 2006). Therefore high HDL levels are associated with low levels of chylomicrons; VLDL remnants; and small, dense LDLs. Subsequently, high HDL implies lower atherosclerotic risk, except in patients with familial hypercholesterolemia (FH) who can have a triglyceride-enriched HDL3 fraction that is proatherogenic (Ottestad et al., 2006).
Total Cholesterol
A total cholesterol measurement captures cholesterol contained in all lipoprotein fractions: 60% to 70% is carried on LDL, 20% to 30% on HDL, and 10% to 15% on VLDL. Studies have consistently shown that a high serum cholesterol level (specifically high LDL cholesterol) is one of the key causes of CHD, stroke, and mortality.
Triglycerides
The triglyceride-rich lipoproteins include chylomicrons, VLDLs, and any remnants or intermediary products formed in metabolism. Of these triglyceride-rich lipoproteins, chylomicrons and VLDL remnants are known to be atherogenic because they activate platelets, the coagulation cascade, and clot formation (Olufadi and Byrne, 2006). All contain the apo B lipoprotein. Fasting triglyceride levels are classified as normal (<150 mg/dL), borderline high (150 to 199 mg/dL), high (200 to 499 mg/dL), and very high (<500 mg/dL) (National Cholesterol Education Program [NCEP], 2002).
Patients with familial dyslipidemias have high triglyceride levels (hypertriglyceridemia). Triglycerides in the very high range place the patient at risk for pancreatitis. These patients usually have hyperchylomicronemia and require diets very low in fat (i.e., 10% to 15% of calories derived from fat) and medications. Triglyceride measurements are now considered along with glucose intolerance, hypertension, low HDL cholesterol, and high LDL cholesterol as part of the metabolic syndrome.
Genetic Hyperlipidemias
The study and identification of the genes responsible for the familial forms of hyperlipidemia have provided insight into the roles of enzymes, apolipoproteins, and receptors on cells involved in lipid metabolism. Several forms of hyperlipidemia have strong genetic components and are described here.
Familial Hypercholesterolemia
FH (type IIa hyperlipidemia) is a monogenetic disorder that is seen around the world, with an estimated 10,000,000 people being affected. It is major risk factor for CHD; 85% of men and 50% of women with FH will have a coronary event before the age of 65 years unless the hypercholesterolemia is successfully treated (Civeira, 2004). Defects in the LDL receptor gene cause FH; 800 mutations have been identified and screening is possible (Lombardi et al., 2006). Early detection is critical. Treatment with statin drugs improves arterial function and structure (Masoura, 2011). Ultrasound of the Achilles tendon for xanthomas (cholesterol deposits from LDL) correctly identifies the majority of FH patients.
Polygenic Familial Hypercholesterolemia
Polygenic FH is the result of multiple gene defects. The apo E-4 allele is common in this form. The diagnosis is based on two or more family members having LDL cholesterol levels above the 90th percentile without any tendon xanthomas. Usually these patients have lower LDL cholesterol levels than patients with the nonpolygenic form, but they remain at high risk for premature disease. The treatment is lifestyle change in conjunction with cholesterol-lowering drugs.
Familial Combined Hyperlipidemia
Familial combined hyperlipidemia (FCHL) is a disorder in which two or more family members have serum LDL cholesterol or triglyceride levels above the 90th percentile. Several lipoprotein patterns may be seen in patients with FCHL. These patients can have (1) elevated LDL levels with normal triglyceride levels (type IIa), (2) elevated LDL levels with elevated triglyceride levels (type IIb), or (3) elevated VLDL levels (type IV). Often these patients have the small, dense LDL associated with CHD. Consequently all forms of FCHL cause premature disease; approximately 15% of patients who have an MI before the age of 60 have FCHL. The defect in FCHL is hepatic overproduction of apo B-100 (VLDL) or a defect in the gene that produces hepatic lipase, the liver enzyme involved in triglyceride removal from the bloodstream. Patients with FCHL usually have other risk factors such as obesity, hypertension, diabetes, or metabolic syndrome. If lifestyle measures are ineffective, treatment includes medication. Patients with elevated triglyceride levels also need to avoid alcohol.
Familial Dysbetalipoproteinemia
Familial dysbetalipoproteinemia (type III hyperlipoproteinemia) is relatively uncommon. Catabolism of VLDL and chylomicron remnants is delayed because apo E-2 replaces apo E-3 and apo E-4. For dysbetalipoproteinemia to be seen, other risk factors such as older age, hypothyroidism, obesity, diabetes, or other dyslipidemias such as FCHL must be present. Total cholesterol levels range from 300 to 600 mg/dL, and triglyceride levels range from 400 to 800 mg/dL. This condition creates increased risk of premature CHD and peripheral vascular disease. Diagnosis is based on determining the isoforms of apo E. Treatment involves weight reduction, control of hyperglycemia and diabetes, and dietary restriction of saturated fat and cholesterol. If the dietary regimen is not effective, drug therapy is recommended.
Medical Diagnosis
Noninvasive tests such as electrocardiograms, treadmill stress tests, thallium scans, and echocardiography are used initially to establish a cardiovascular diagnosis. A more definitive, invasive test is angiography (cardiac catheterization), in which a dye is injected into the arteries and radiographic images of the heart are obtained. Most narrowing and blockages from atherosclerosis are readily apparent on angiograms; however, neither smaller lesions nor lesions that have undergone remodeling are visible.
Magnetic resonance imaging scans show the smaller lesions and can be used to follow atherosclerosis progression or regression following treatments. To predict MI or stroke, measuring the intimal thickness of the carotid artery may be used. Intracoronary thermography helps to determine the presence of vulnerable plaque.
Finally, the calcium in atherosclerotic lesions can be assessed. Electron beam computed tomography can measure calcium in the coronary arteries; persons with a positive scan are far more likely to have a future coronary event than those with a negative scan. Despite these findings, atherosclerosis imaging in asymptomatic individuals is a controversial public health topic because of the costs associated with screening (O’Malley, 2006; Raggi, 2006).
Approximately two thirds of cases of acute coronary syndromes (unstable angina and acute MI) happen in arteries that are minimally or mildly obstructed. This illustrates the role of thrombosis in clinical events. In the ischemia of an infarction, the myocardium or other tissue is deprived of oxygen and nourishment. Whether the heart is able to continue beating depends on the extent of the musculature involved, the presence of collateral circulation, and the oxygen requirement.
Prevention and Management of Risk Factors
The identification of risk factors for atherosclerosis, CHD, and stroke has been a landmark achievement. The primary prevention of these disorders involves the assessment and management of the risk factors in the asymptomatic person. Persons with multiple risk factors are the target population, especially those with modifiable factors (Box 34-2).
Risk factor reduction has been shown to reduce CHD in persons of all ages. Approximately one quarter of the decline in CHD is attributable to improved treatment; more than half is from the reduction in risk factors. Many coronary events could be prevented with adoption of a healthy lifestyle (eating a heart-healthy diet, exercising regularly, managing weight, and not using tobacco) and adherence to lipid and hypertension drug therapy (Chiuve et al., 2006). The Framingham Study, conducted over several decades, has given much useful information to researchers (see Focus On: Framingham Heart Study). An algorithm also used to screen for risk factors is shown in Figure 34-5.
 Focus On
Framingham Heart Study
Since 1948 various leading investigators (Dr. Joseph Mountain, Dr. Thomas Dawber, Dr. William Kannel, and Dr. William Castelli) have been studying the population (28,000) of Framingham, Massachusetts, to determine the prevalence and incidence of cardiovascular disease and factors related to its development. This is the largest epidemiologic study of cardiovascular disease in the world. Initial study participants (n = 5209) were healthy adults between 30 and 62 years of age. The study continues today, looking at the children and grandchildren of the original cohort. Through this cohort study, the concept of risk factors and thus prevention was born. Modifiable risk factors not only predict disease in healthy adults but also contribute to the disease process in those who have atherosclerotic disease. The seven major risk factors identified by the Framingham study are age, sex, blood pressure, total and high-density lipoprotein cholesterol, smoking, glucose intolerance, and left-ventricular hypertrophy (Opie et al., 2006).
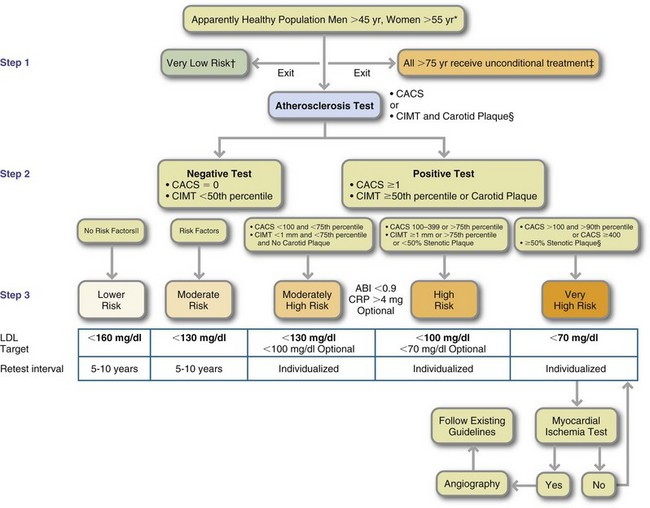
FIGURE 34-5 Flow chart of the first Screening for Heart Attack Prevention and Education (SHAPE) Guideline. ABI, Ankle-brachial index; CACS, coronary artery calcium score; CIMT, carotid intima-media thickness; CRP, C-reactive protein; LDL, low-density lipoprotein.
*No history of angina, heart attack, stroke, or peripheral arterial disease.
†Population age older than 75 years is considered high risk and must receive therapy without testing for atherosclerosis.
‡Must not have any of the following: total cholesterol level 200 mg/dL (5.18 mmol/L), blood pressure higher than 120/80 mm Hg, diabetes mellitus, smoking, family history of coronary heart disease, or the metabolic syndrome.
§Pending the development of standard practice guidelines.
¶High cholesterol, high blood pressure, diabetes, smoking, family history of coronary heart disease, or the metabolic syndrome.
¶For stroke prevention, follow existing guidelines. (From Vulnerable plaque to vulnerable patient. Part III: Executive summary of the screening for heart attack prevention and education [SHAPE] task force report, Am J Cardiol 98[2A]:2H, 2006.)
Milestones of the Framingham Study
1960 Cigarette smoking found to increase the risk of heart disease.
1961 Cholesterol level, blood pressure, and electrocardiogram abnormalities found to increase the risk of heart disease.
1967 Physical activity found to reduce the risk of heart disease, and obesity found to increase the risk of heart disease.
1970 High blood pressure found to increase the risk of stroke.
1976 Menopause found to increase the risk of heart disease.
1978 Psychosocial factors found to affect heart disease.
1988 High levels of high-density lipoprotein cholesterol found to reduce risk of death.
1994 Enlarged left ventricle (one of two lower chambers of the heart) found to increase the risk of stroke.
1996 Progression from hypertension to heart failure described.
2006 Genetic Research Study begins to identify genes underlying cardiovascular diseases in 9000 participants from three generations.
2008 Discovery and publication of four risk factors that raise probability of developing precursor of heart failure; new 30-year risk estimates developed for serious cardiac events.
2009 Researchers find parental dementia may be linked to poor memory in middle-aged adults.
In 1971 the offspring study was begun to measure the influence of heredity and environment on the offspring of the original cohort. The younger group appears to be more health conscious because they have lower rates of smoking, lower blood pressures, and lower cholesterol levels than their parents at the same age. The Generation III Cohort Study of the grandchildren is presently underway.
Data from http://www.framingham.com/heart/timeline.htm. Accessed March 19, 2011.
In the medical model, primary prevention of CHD and stroke involves altering similar risk factors toward a healthy patient profile. For ischemic stroke, atherosclerosis is the underlying disease. Therefore optimal lipid levels, as determined by the National Cholesterol Education Program (NCEP) for hypercholesterolemia, are also the target levels to prevent stroke. Guidelines for cholesterol management were released as the Third Report of the Expert Panel on Detection, Evaluation, and Treatment of High Blood Cholesterol in Adults (Adult Treatment Panel or ATP III). In the past the recommended dietary approach was a Step I and Step II diet, but this has been replaced by the Therapeutic Lifestyle Changes (TLC) Diet. Updates of the NCEP guidelines are due by the fall of 2011.
Although the National Heart, Lung and Blood Institute created the NCEP, the American Heart Association (AHA) has endorsed it. AHA suggests that primary prevention of CHD should begin in children older than age 2 (Gidding et al., 2009). Dietary recommendations for children are a bit more liberal than those for adults. Activity is emphasized in maintaining ideal body weight. Early screening for dyslipidemia is recommended for children with a family history of hypercholesterolemia or CHD. Goals for total cholesterol levels for 2- to 19-year-olds are shown in Table 34-1.
TABLE 34-1
Cholesterol Levels for 2- to 19-Year-Olds
| Levels | Total Cholesterol (mg/dL) | LDL-C (mg/dL) |
| Acceptable | <170 | <110 |
| Borderline | 170-199 | 110-129 |
| High | ≥200 | ≥130 |
LDL-C, Low-density lipoprotein cholesterol.
Modified from Fletcher B et al: Managing abnormal blood lipids: a collaborative approach, Circulation 112:3184, 2005.
For adults, a desirable lipoprotein profile is a total cholesterol level of less than 200 mg/dL, LDL cholesterol less than 130 mg/dL, HDL cholesterol greater than 40 mg/dL, and triglyceride level less than 150 mg/dL (NCEP, 2002). An LDL cholesterol level less than 100 mg/dL is recommended for persons with two or more risk factors (high-risk patients). See Fig. 34-5 for AHA recommendations.
Inflammatory Markers
Increasing knowledge about the role of inflammation in CVD gives credence to the use of inflammatory markers to indicate the presence of atherosclerosis in asymptomatic individuals or the extent of atherosclerosis in patients with symptoms. Several markers have been suggested (Box 34-3), and research continues to look at the effects of diet on these biomarkers (Esposito and Giugliano, 2006). A recent study showed that the plasma levels of ω-3 fatty acids were inversely associated with the inflammatory markers CRP, IL-6, fibrinogen, and homocysteine (Kalogeropoulos, 2010). In addition, genetic factors also play a role.
Fibrinogen: Most MIs are the result of an intracoronary thrombosis. Prospective studies have shown that plasma fibrinogen is an independent predictor of CHD risk. Factors associated with an elevated fibrinogen are smoking, diabetes, hypertension, obesity, sedentary lifestyle, elevated triglycerides, and genetic factors. More clinical trials are needed to determine if fibrinogen is involved in atherogenesis or is just a marker of vascular damage. Blood thrombogenicity increases with high LDL cholesterol and in diabetes. To date the most widely studied preventive factor for thrombogenesis is the use of aspirin; 75 mg/day of aspirin reduces total CHD, nonfatal MI, and CVD events but does not have any effect on stroke or cardiovascular mortality (Bartolucci and Howard, 2006).
C-Reactive Protein: C-reactive protein (CRP) is synthesized in the liver as the acute-phase response to inflammation. Thus in a normal individual without infection or inflammation, CRP levels are very low <0.6 mg/dL. Because atherogenesis is an inflammatory process, CRP has been shown to be elevated (>3 mg/dL) in people with angina, MI, stroke, and peripheral vascular disease; the elevated levels are independent of other risk factors (Scirica et al., 2006). CRP has been found in arterial atheroma and therefore is now considered both a risk factor and a causal agent for atherothrombosis (Scirica et al., 2006).
CRP levels are categorized for risk as low (<1 mg/L); average (2 to 3 mg/L) and high (>3 mg/L) after the average of two measurements are taken at least 2 weeks apart (American Heart Association, 2010). Because CRP is a general measure of inflammation, it is not specific to the heart or vascular system and therefore an increased level requires further investigation to determine the source of the inflammation.
Few studies have investigated the effects of dietary variables on CRP, but higher intakes of fruits and vegetables tend to lower CRP levels. For instance, the “Daniel Fast” has shown improvement in multiple cardiovascular indicators, including CRP. This is a 21-day diet without animal products and preservatives that highlights fruits, vegetables, whole grains, legumes, nuts, and seeds (Bloomer et al., 2010). Dietary intervention trials are needed.
Homocysteine: Homocysteine, an amino acid metabolite of methionine, is a risk factor. It was first observed that children who were deficient in cystathionine B synthase, the essential enzyme for breakdown of homocysteine, had premature atherosclerosis in some veins. Although the original homocysteine hypothesis for atherothrombotic disease has fallen out of favor, prior studies did not comprehensively adjust for confounding factors. Indeed, elevated total homocysteine (tHcy) independently increases the odds of stroke, especially in younger individuals (Towfighi et al., 2010). Tests for folate alleles in susceptible individuals are useful, giving vitamins B6, B12, and methylated folate when needed.
Modifiable Lifestyle Factors
The AHA supports diet and lifestyle recommendations to reduce risk of CVD, shown in Box 34-4.
Poor Diet Quality
It is known that diet is the predominant environmental cause of coronary atherosclerosis and that diet modification unequivocally can reduce risk of CHD. Not surprisingly, caloric intake increased by approximately 300 kcal between 1985 and 2000 (Thom et al., 2006). A major environmental, dietary contributor to obesity is the increase in portion sizes that has occurred during the last 20 years. Most Americans consume less than the recommended amount of fiber (Anderson, 2009); only 22% of adults consume five servings of fruits and vegetables daily. Nutrition diagnoses common in this population include the following (Brindle, 2006):
• Excessive fat intake (saturated)
• Inadequate vitamin intake (e.g., B-complex)
• Inadequate mineral intake (e.g., potassium, calcium)
• Inadequate intake of bioactive substances (e.g., stanols or sterols)
• Food- and nutrition-related knowledge deficit
• Limited adherence to nutrition-related recommendations
Physical Inactivity
Physical inactivity and a low level of fitness are independent risk factors for CHD. Physical activity is associated with CVD, independent of the common cardiometabolic risk factors of obesity, serum lipids, serum glucose and hypertension, in both men and women (McGuire, 2009). Despite public health recommendations to increase activity levels, 40% of Hispanic women, 34% of black women, 32% of American Indian and Alaskan Native women, and 22% of white women reported no leisure-time physical activity in the Behavioral Risk Factor Surveillance System survey (2007). Approximately 20% of all men were inactive. With the high prevalence of obesity, physical activity is a high priority. Physical activity lessens CHD risk by retarding atherogenesis, increasing vascularity of the myocardium, increasing fibrinolysis, increasing HDL cholesterol, improving glucose tolerance and insulin sensitivity, aiding in weight management, and reducing blood pressure.
Stress
Stress activates a neurohormonal response in the body that results in increased heart rate, blood pressure, and cardiac excitability. The stress hormone angiotensin II is released following stimulation of the sympathetic nervous system (SNS); exogenous infusion of angiotensin II accelerates the formation of plaque (Mehta and Griendling, 2007). The INTERHEART study found that the effect of stress is comparable to that of hypertension.
Tobacco Use
The increased risk of CVD and stroke from cigarette smoking has been recognized for more than 40 years, with definitive evidence presented in several Surgeon General reports. Smoking is the number one cause of preventable death in the United States; 35% of deaths from tobacco use are from CVD (Thom et al., 2006). Smoking is synergistic with other risk factors (i.e., the risk of CHD is much higher with multiple risk factors) and directly influences acute coronary events, including thrombus formation, plaque instability, and arrhythmias (abnormal heart rhythm). Thus tobacco causes subclinical atherosclerosis. Women who smoke and use oral contraceptives have 10 times the risk of developing CHD than women who do not smoke and who do not use contraceptives. Risk also increases with the number of cigarettes smoked each day; low-tar brands do not reduce the risk. Furthermore, any exposure, including second-hand smoke, increases the risk (Thom et al., 2006).
Controllable Risk Factors
Diabetes is both a disease and a risk factor. The prevalence of diabetes mirrors that of obesity in the United States. Since 1990, a 61% increase in the prevalence of diabetes has been observed, and it is becoming more prevalent in obese children (Thom et al., 2006). Any form of diabetes increases the risk for CHD, with occurrence at younger ages. Most people with diabetes die from CVD. Similarly, 75% of people with diabetes have more than two risk factors for CHD (McCollum et al., 2006). Some of the increased risk for CHD seen in diabetic patients is attributable to the concurrent presence of other risk factors, such as dyslipidemia, hypertension, and obesity. Thus diabetes is now considered a CHD risk factor (see Chapter 31).
Metabolic Syndrome
Since the early findings of the Framingham study, it has been known that a clustering of risk factors markedly increases the risk of CVD. See Chapter 22 for an in-depth discussion of metabolic syndrome.
Obesity
Obesity has now reached epidemic levels in children and adults in many developed countries. Body mass index (BMI) and CHD are positively related; as BMI goes up, the risk of CHD also increases. The prevalence of overweight and obesity is the highest that it has ever been in the United States; 65% of adults are overweight, and 31% are obese (Blumenthal et al., 2010). Obesity rates vary by race and ethnicity in women. Non-Hispanic black women have the highest prevalence, followed by Mexican-American women, American Indians and Alaskan natives, and non-Hispanic whites. In men the rates of obesity vary from 25% to 28% of the population. The epidemic of obesity and diabetes could reverse the downward trend in CHD mortality if it is not soon controlled, especially given the increasing rates seen in children and adolescents (Thompson et al., 2007) (see Chapter 22).
Carrying excess adipose tissue greatly affects the heart through the many risk factors that are often present: hypertension, glucose intolerance, inflammatory markers (IL-6, TNF-α, CRP), obstructive sleep apnea, prothrombotic state, endothelial dysfunction, and dyslipidemia (small LDL, increased apo B, low HDL, high triglyceride levels) (Poirier et al., 2006). Many inflammatory proteins are now known to come from the adipocyte (Berg, Scherer, 2006). These concurrent risk factors may help to explain the high morbidity and mortality rates observed in people who are obese.
Weight distribution (abdominal versus gynoid) is also predictive of CHD risk, glucose tolerance, and serum lipid levels. Central adiposity has also been strongly related to markers of inflammation, especially CRP. Therefore a waist circumference of less than 35 inches for women and 40 inches for men is recommended.
Small weight losses (10 to 20 lb) can improve LDL cholesterol, HDL cholesterol, triglycerides, high blood pressure, glucose tolerance, and CRP levels, even if an ideal BMI is not achieved. Weight loss has also been correlated with lower CRP levels. However, to restore vascular function, the amount of weight that must be lost, the time of weight maintenance, or the amount of improvement in endothelial function that lessens cardiovascular events is still unknown.
Nonmodifiable Risk Factors
With increasing age, higher mortality rates from CHD are seen in both genders. However, gender is a factor for the assessment of risk. The incidence of premature disease in men 35 to 44 years of age is three times as high as the incidence in women of the same age. Therefore being older than 45 years of age is considered a risk factor for men (NCEP, 2002). For women the increased risk comes after the age of 55 years, which is after menopause for most women. Overall the increased risk for CHD parallels increase in age.
Family History and Genetics
A family history of premature disease is a strong risk factor, even when other risk factors are considered. A family history is considered to be positive when MI or sudden death occurs before the age of 55 years in a male first-degree relative or the age of 65 in a female first-degree relative (parents, siblings, or children). The presence of a positive family history, although not modifiable, influences the intensity of risk factor management.
Menopausal Status
Endogenous estrogen confers protection against CVD in premenopausal women, probably by preventing vascular injury. Loss of estrogen following natural or surgical menopause is associated with increased CVD risk. Rates of CHD in premenopausal women are low except in women with multiple risk factors. During the menopausal period total cholesterol, LDL cholesterol, and triglyceride levels increase; HDL cholesterol level decreases, especially in women who gain weight.
Medical Nutrition Therapy
Medical nutrition therapy (MNT), which includes discussion of physical activity, is the primary intervention for patients with elevated LDL cholesterol (Box 34-5). Physicians are encouraged to refer patients to registered dietitians (RDs) to help patients meet goals for therapy based on LDL cholesterol levels.
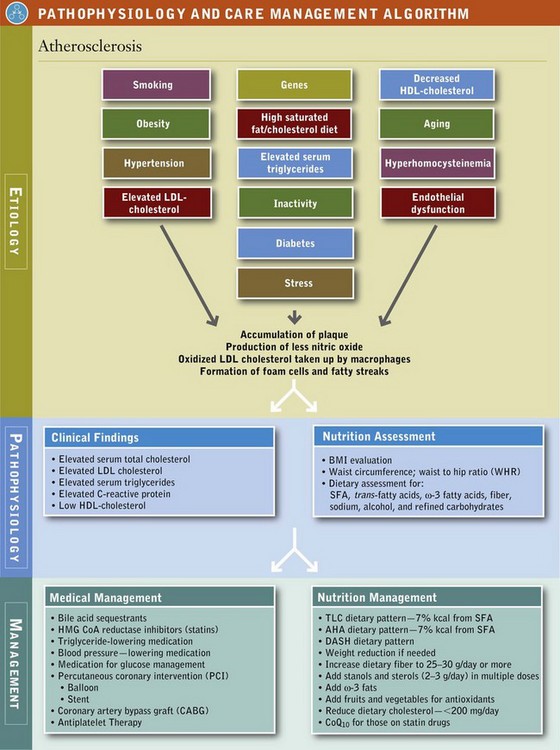
With diet, exercise, and weight reduction, patients can often reach serum lipid goals and reduce body inflammation. The complexity of changes, number of changes, and motivation of the patient will dictate how many patient visits it will take for the adherent client to be successful. An initial visit of 45 to 90 minutes followed by two to six visits of 30 to 60 minutes each with the RD is recommended (American Dietetic Association [ADA] Evidence Library, 2006). Consequently these interventions are tried before drug therapy and also continue during pharmacologic treatment to enhance effectiveness of the medication (see Pathophysiology and Care Management Algorithm: Atherosclerosis).
Therapeutic Lifestyle Changes
The TLC dietary pattern is used for primary and secondary prevention of CHD; its updated version can be found in Table 34-2. The AHA recommends diet and lifestyle changes to reduce CVD risk in all people older than the age of 2 (Lichtenstein et al., 2006). Recommendations include saturated fat less than 7% of calories and total fat content 25% to 35% of calories.
TABLE 34-2
Therapeutic Lifestyle Change Dietary Pattern
| Nutrient | Recommended Intake |
| Total fat | 25%-35% of total calories |
| Saturated fat | Less than 7% of total calories |
| Trans-fatty acids | Zero or as low as possible |
| Polyunsaturated fat | Up to 10% of total calories |
| Monounsaturated fat | Up to 20% of total calories |
| Carbohydrate† | 50% to 60% of total calories, especially from whole grains, fruits and vegetables |
| Fiber | 25-30 g/day (soluble forms such as psyllium at 10-25 g) |
| Plant sterols | 2 g/day |
| Protein | Approximately 15% of total calories |
| Cholesterol | Less than 200 mg/day |
| Total calories (energy) | Balance energy intake and expenditure to maintain desirable body weight/prevent weight gain. Daily energy expenditure should include at least moderate physical activity of approximately200 kcal/day). |
Updated by authors in 2010 from National Heart, Lung, and Blood Institute: Detection, evaluation, and treatment of high blood cholesterol in adults (adult treatment panel III), Final report, U.S. Department Of Health and Human Services, NIH Publication No. 02-5215, Bethesda, Md, September 2002.
Consuming 30% to 35% of calories from fat while maintaining a low saturated fatty acid (SFA) and trans-fatty acid intake is the dietary pattern recommended for individuals with insulin resistance or metabolic syndrome. This higher fat intake, emphasizing polyunsaturated fatty acids (PUFAs) and monounsaturated fatty acids (MUFA), can lower triglycerides, and raise HDL cholesterol and lower LDL cholesterol without exacerbating blood glucose levels.
Planned MNT requires a 3- to 6-month time frame. Lowering SFAs and trans-fats is the first level of behavior change. The TLC diet is followed for 6 weeks. At visit two the LDL response is evaluated and therapy is intensified if warranted. Adjuncts such as plant sterols and stanols, and fiber are incorporated into education at the second visit (dietary compliance must be monitored during this period). At visit three, metabolic syndrome treatment begins if target LDL is not reached. Once the maximum LDL reduction has occurred, management of metabolic syndrome or the cluster of risk factors becomes the target for MNT interventions.
Increasing physical activity, decreasing energy intake, and weight loss are critical for normalizing multiple risk factors. Behavioral strategies for weight management and cardiovascular risk reduction have been provided in Box 34-6. Learning outcomes for the client include planning meals that fit the TLC plan, reading food labels, modifying recipes, preparing or purchasing appropriate foods, and choosing healthier choices when dining out.
Along with the TLC dietary pattern, the Dietary Approaches to Stop Hypertension (DASH) pattern, discussed later in this chapter, is also very appropriate for CVD prevention and treatment. These dietary patterns emphasize grains, cereals, legumes, vegetables, fruits, lean meats, poultry, fish, and nonfat dairy products.
Because animal fats provide approximately two thirds of the SFAs in the American diet, these foods are limited. High-fat choices are omitted, but low-fat choices can be included. Similarly with dairy products, nonfat choices are recommended. Meat is limited to 5 oz/day. Lean meats are high in protein, zinc, and iron; thus if patients wish to consume meat, a 5-oz portion or less can be fit into the dietary plan if other low SFA choices are made. Eggs are restricted to four per week; however, eggs do not contribute to high cholesterol levels in the same way as other animal protein. Most people should add the recommended two servings of fatty fish per week.
For highly motivated patients who want to avoid drug therapy, sometimes very-low-fat diets are effective for reaching blood lipid goals. These diets can also be used as an adjunct to drug therapy for secondary prevention and possible regression of lesions. Such diets contain minimum amounts of animal products; thus SFA (<3%), cholesterol (<5 mg/day), and total fat (<10%) intakes are very low. The emphasis is on low-fat grains, legumes, fruits, vegetables, and nonfat dairy foods. Because egg whites are allowed, the plan is a lacto-ovo-vegetarian regimen.
For more than 40 years epidemiologic studies, experimental studies, and clinical trials have shown that numerous dietary risk factors affect serum lipids, atherogenesis, and CHD. To ensure nutritional adequacy, consulting with an RD is recommended. Key discussion points follow.
Saturated Fatty Acids: The predominant sources of SFAs in the American diet are animal foods (meat and dairy). SFAs are restricted because they have the most potent effect on LDL cholesterol, which rises in a dose-response fashion when increasing levels of SFAs are consumed. In the National Health and Nutrition Examination Survey (NHANES) IV, the mean consumption of SFAs was 11% of kilocalories, versus the goal of less than 7% of energy. SFAs raise serum LDL cholesterol by decreasing LDL receptor synthesis and activity. Regardless of form, all fatty acids lower fasting triglycerides if they replace carbohydrate in the diet.
Trans-fatty Acids: Trans-fatty acids (stereoisomers of the naturally occurring cis-linoleic acid) are produced in the hydrogenation process used in the food industry to increase shelf life of foods and to make margarines, made from oil, firmer. Most trans-fatty acids intake comes from partially hydrogenated vegetable oils. These fatty acids are limited because they raise LDL cholesterol (Basu et al., 2006). No more than 1% of calories (approximately 1-3 g/day) should come from trans-fatty acids (Lichtenstein et al., 2006).
Monounsaturated Fatty Acids: Oleic acid (C18:1) is the most prevalent MUFA in the American diet. Substituting oleic acid for carbohydrate has almost no appreciable effect on blood lipids. However, replacing SFAs with MUFAs (as would happen when substituting olive oil for butter) lowers serum cholesterol levels, LDL cholesterol levels, and triglyceride levels to about the same extent as PUFAs. The effects of MUFAs on HDL cholesterol depend on the total fat content of the diet. When intakes of both MUFA (>15% of total kilocalories) and total fat (>35% of kilocalories) are high, HDL cholesterol does not change or increases slightly compared with levels with a lower-fat diet. Oleic acid as part of the Mediterranean diet (Figure 34-6) has been shown to have antiinflammatory effects.
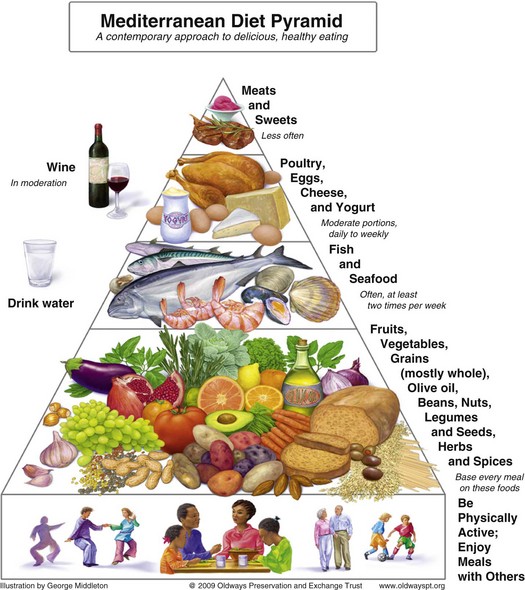
FIGURE 34-6 The Traditional Healthy Mediterranean Diet Pyramid. (Courtesy Oldways Preservation and Exchange Trust, www.oldwayspt.org.)
In epidemiologic studies, high-fat diets of people in Mediterranean countries have been associated with low blood cholesterol levels and CHD incidence. Among other factors, the main fat source is olive oil, which is high in MUFA. This observation led to many studies on the benefits of high-fat and high-MUFA diets. A Mediterranean-type step I diet may reduce recurrent CVD by 50% to 70% and has been shown to positively affect lipoprotein levels in high-risk populations (Carter et al., 2010). This diet emphasizes fruits, root vegetables (carrots, turnips, potatoes, onions, radishes), leafy green vegetables, breads and cereals, fish, foods high in α-linolenic acid (flax, canola oil), vegetable oil products (salad dressing and other products made with nonhydrogenated oils), and nuts and seeds (walnuts and flaxseed).
Red wine is considered a key part of the Mediterranean diet. Resveratrol, a polyphenolic compound, is found in the skin of red grapes. Resveratrol in large quantities appears to lower blood pressure by increasing nitric oxide levels. Its role in smaller quantities found in the 1-2 glasses of red wine recommended in the Mediterranean diet is not yet clear (Carter, 2010). Grape juice is another good source of resveratrol.
Polyunsaturated Fatty Acids: The essential fatty acid linoleic acid (LA) is the predominant PUFA consumed in the American diet; its effect depends on the total fatty acid profile of the diet. When added to study diets, large amounts of LA diminish HDL serum cholesterol levels. High intakes of ω-6 PUFAs may exert adverse effects on the function of vascular endothelium or stimulate production of proinflammatory cytokines. Thus a low ratio of ω-6:ω-3 PUFAs is recommended (Basu et al., 2006; Gebauer et al., 2006). Replacing PUFAs for carbohydrate in the diet results in a decline in serum LDL cholesterol. When SFAs are replaced with PUFAs in a low-fat diet, LDL and HDL cholesterol levels are lowered. Overall, eliminating SFAs is twice as effective in lowering serum cholesterol levels as increasing PUFAs.
Omega-3 Fatty Acids: The main ω-3 fatty acids (eicosapentaenoic acid [EPA] and docosahexaenoic acid [DHA]) are high in fish oils, fish oil capsules, and ocean fish. Many studies have shown that eating fish is associated with a decreased CVD risk. The recommendation for the general population for fish consumption is to eat fish high in ω-3 fatty acids (salmon, tuna, mackerel, sardines) at least twice a week (Psota et al., 2006). For patients who have CVD, 1 g of EPA and DHA combined is recommended from fish if possible but, if not, then from supplements (Lichtenstein et al., 2006). Patients who have hypertriglyceridemia need 2 to 4 g of EPA and DHA per day for effective lowering. Omega-3 fatty acids lower triglyceride levels by inhibiting VLDL and apo B-100 synthesis, thereby decreasing postprandial lipemia.
An ω-3 fatty acid from vegetables, α-linolenic acid (ALA), has antiinflammatory effects. CRP levels are reduced when patients consume 8 g of ALA daily (Basu et al., 2006). Omega-3 fatty acids are cardioprotective because they interfere with blood clotting and alter prostaglandin synthesis. Omega-3 fat stimulates production of nitric oxide, a substance that stimulates relaxation of the blood vessel wall (vasodilation). Unfortunately, high intakes prolong bleeding time, a common condition among Eskimo populations with high ω-3 fat dietary intakes and low incidence of CHD.
Total Fat: Total fat intakes are related to obesity, which affects many of the major risk factors for atherosclerosis. Also, high-fat diets increase postprandial lipemia and chylomicron remnants, both of which are associated with increased risk of CHD. When fat is reduced in the diet and carbohydrate is the replacement source of calories, triglycerides and HDL levels are affected. Low-fat diets (<25% of total kilocalories from fat) raise triglyceride levels and lower HDL cholesterol levels. However, research on the role of fat in prevention and treatment of CVD is now aimed at moderate-fat diets with a low ω-6:ω-3 fat ratio that includes MUFA, such as from nuts. Nuts are part of a heart-healthy diet; a 37% lower risk of CHD in those consuming nuts at least four times a week has been noted (Kelly and Sabate, 2006).
Dietary Cholesterol: Dietary cholesterol raises total cholesterol and LDL cholesterol but to a lesser extent than SFAs. The AHA and TLC dietary patterns contain no more than 200 mg of cholesterol each day. There is a threshold beyond which addition of cholesterol to the diet has minimal effects. When cholesterol intakes reach 500 mg/day, only small increments in blood cholesterol occur. Cholesterol responsiveness also varies widely among individuals. Some people are hypo-responders (i.e., their plasma cholesterol level does not increase after dietary cholesterol challenge), whereas others are hyper-responders (i.e., their plasma cholesterol level responds more strongly than expected to a cholesterol challenge). Hyper-responders may have the apo E-4 allele and poor rates of conversion of cholesterol to bile acids, which causes elevated LDL cholesterol. Feeding cholesterol to animals enriches lipoproteins, which are atherogenic beyond just the rise in serum cholesterol. The effect of dietary cholesterol on inflammatory factors has been inconsistent (Basu et al., 2006).
Fiber: High intake levels of dietary fiber are associated with significantly lower prevalence of CHD and stroke (Anderson, 2009). The AHA, TLC, and DASH dietary patterns emphasize fruits, vegetables, legumes, and whole grains, so they contain adequate fiber to lower LDL cholesterol. In particular, the soluble fibers in pectins, gums, mucilages, algal polysaccharides, and some hemicelluloses lower LDL cholesterol. The quantity of fiber needed to produce the lipid-lowering effect varies by food source; higher quantities of legumes are needed than of pectin or gums. Proposed mechanisms for the hypocholesterolemic effect of soluble fiber include the following: (1) the fiber binds bile acids, which lowers serum cholesterol as it repletes the bile acid pool; and (2) bacteria in the colon ferment the fiber to produce acetate, propionate, and butyrate, which inhibit cholesterol synthesis. The role of fiber, if any, on inflammatory pathways is not well established (Erkkila and Lichtenstein, 2006). Minerals, vitamins, and antioxidants that are components of a high-fiber diet further enrich the diet.
Insoluble fibers such as cellulose and lignin have no effect on serum cholesterol levels. Of the total recommended fiber intake (25 to 30 g daily for adults), approximately 6 to 10 g should be from soluble fiber. This level is easy to achieve with the recommended five or more servings of fruits or vegetables per day and six or more servings of grains (if whole grains and high-fiber cereals are chosen).
Antioxidants: Two dietary components that affect the oxidation potential of LDL cholesterol are the level of LA in the particle and the availability of antioxidants. Vitamins C, E, and β-carotene at physiologic levels have antioxidant roles in the body. Vitamin E is the most concentrated antioxidant carried on LDLs, the amount being 20 to 300 times greater than any other antioxidant. A major function of vitamin E is to prevent oxidation of PUFAs in the cell membrane. The AHA does not recommend vitamin E supplementation for CVD prevention. However, RRR-α-tocopherol, the natural form of vitamin E, shows promise as an antiinflammatory agent (Basu et al., 2006). Foods with concentrated amounts of catechins have been found to improve vascular reactivity. Red grapes, red wine, tea (especially green tea), chocolate, and olive oil should be in any preventive eating plan (Kay et al., 2006).
Stanols and Sterols: Since the early 1950s plant stanols and sterols isolated from soybean oils or pine tree oil have been known to lower blood cholesterol by inhibiting absorption of dietary cholesterol. When esterified and made into margarines, 2 to 3 g/day may lower cholesterol up to 20%. ATP)–III includes stanols as part of dietary recommendations for lowering LDL cholesterol in adults. Because these esters can also affect the absorption of and cause lower β-carotene, α-tocopherol, and lycopene levels, further safety studies are needed for use in normocholesterolemic individuals, children, and pregnant women.
Weight Loss: Weight loss improves endothelial function measured using different methods (Brook, 2006). In a group of patients with extreme obesity (BMI = 52), flow-mediated dilation, which is an estimate of endothelial function, improved after the patients lost a mean of 23 kg (Williams et al., 2005). Overall, it is not known how much weight has to be lost, how long the effect lasts, and whether the improvement in endothelial function reduces coronary events (Brook, 2006).
Medical Management
Determination of drug therapy depends on risk category and attainment of the LDL cholesterol goal. Many drugs are available for LDL lowering (see Chapter 9). Regardless of the drug used or category of risk, the TLCs underpin all treatment. The classes of drugs include the following: (1) bile acid sequestrants such as cholestyramine (adsorbs bile acids); (2) nicotinic acid; (3) statins, or 3-hydroxy-3-methylglutaryl–coenzyme A (HMG-CoA) reductase inhibitors, which inhibit the rate-limiting enzyme in cholesterol synthesis; (4) fibric acid derivatives; and (5) probucol. Classes 1, 2, and 3 have been the first choices for treatment.
Medical Intervention
Medical interventions such as percutaneous coronary intervention (PCI) are now performed in patients with asymptomatic ischemia or angina. PCI, previously known as percutaneous transluminal coronary angioplasty, is a procedure that uses a catheter with a balloon that, once inflated, breaks up plaque deposits in an occluded artery. Coronary stenting involves a wire mesh tube inserted to hold an artery open; it can release medication that prevents clotting (Thom et al., 2006).
PCI is often possible because of earlier detection of blockages. The most common problem with PCI is restenosis of the artery. A recent study examined more than 2200 patients, half of whom received intervention of medication and lifestyle changes such as quitting smoking, exercise, and nutrition, and half of whom received lifestyle changes as well as angioplasty. After 5 years it was observed that the number who had heart attacks, was hospitalized, or died because of their heart problems was virtually identical in both groups. Angioplasty did not appear to provide an additional benefit verus lifestyle changes combined with medication (Boden et al., 2007).
Because PCI is performed with the patient under local anesthesia in a cardiac catheterization laboratory, recovery is quicker than with coronary artery bypass graft (CABG) surgery. In CABG surgery, an artery from the chest is used to redirect blood flow around a diseased vessel. Candidates for CABG usually have more than two occluded arteries. CABG surgeries have decreased since 1995 because more PCI procedures are being done. These surgeries improve survival time, relieve symptoms, and markedly improve the quality of life for patients with CHD. However, CABG does not cure atherosclerosis; the new grafts are also susceptible to atherogenesis. Consequently restenosis is common within 10 years of surgery. Risk factor modification, including at a minimum TLCs and probably more aggressive dietary changes, is needed to stop progression.
In the postoperative period CABG patients, like others undergoing major surgery, are in a catabolic state; therefore adequate nutritional intake via oral routes is essential. Patients with complications may be at risk for developing cardiac cachexia, which is often associated with HF. Patients are usually discharged with the TLC, AHA, or DASH dietary pattern.
Hypertension
Hypertension is persistently high arterial blood pressure, the force exerted per unit area on the walls of arteries. To be defined as hypertension, the systolic blood pressure (SBP), the blood pressure during the contraction phase of the cardiac cycle, has to be 120 mm Hg or higher; or the diastolic blood pressure (DBP), the pressure during the relaxation phase of the cardiac cycle, has to be 80 mm Hg or higher; this is reported as more than 120/80 mm Hg. If an individual has a blood pressure of 120 mm Hg and a DBP of 80 mm Hg, this is read as a blood pressure of 120/80.
In the Seventh Report of the Joint National Committee on Prevention, Detection, Evaluation, and Treatment of High Blood Pressure, hypertension is classified in stages, based on the risk of developing CVD (Table 34-3). Individuals diagnosed with prehypertension have a SBP between 120 and 139 mm Hg or a DBP between 80 and 89 mm Hg, and they are at high risk for developing hypertension and CVD. Stage 1 hypertension (140 to 159/90 to 99 mm Hg) is the most prevalent level seen in adults; this is the group most likely to have a MI or stroke. The defining point for hypertension is arbitrary because any level of elevated blood pressure is associated with increased incidence of CVD and renal disease. Therefore normalization of blood pressure is important for all stages of hypertension.
TABLE 34-3
Classification and Management of Blood Pressure for Adults Ages 18 Years or Older
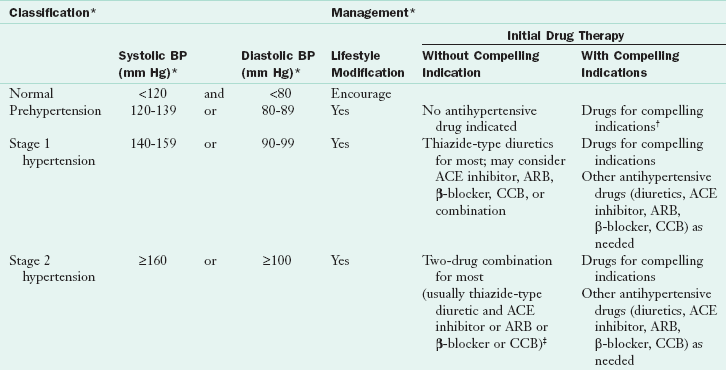
ACE, Angiotensin-converting enzyme; ARB, angiotensin-receptor blocker; BP, blood pressure; CCB, calcium channel blocker.
*Treatment determined by highest BP category.
†Treat patients with chronic kidney disease or diabetes to blood pressure goal of less than 130/80 mm Hg.
‡Initial combined therapy should be used cautiously in those at risk for orthostatic hypotension.
From Chobanian AV et al and the National High Blood Pressure Education Program Coordinating Committee: The Seventh Report of the Joint National Committee on Prevention, Detection, Evaluation, and Treatment of High Blood Pressure, JAMA 89:2560, 2003.
Hypertension is a common public health problem in developed countries. In the United States one in three adults has high blood pressure (AHA, 2010). Untreated hypertension leads to many degenerative diseases, including HF, end-stage renal disease, and peripheral vascular disease. It is often called a “silent killer” because people with hypertension can be asymptomatic for years and then have a fatal stroke or heart attack. Although no cure is available, hypertension is easily detected and usually controllable. Some of the decline in CVD mortality during the last two decades has been attributed to the increased detection and control of hypertension. The emphasis on lifestyle modifications has given diet a prominent role in both the primary prevention and management of hypertension.
Of those persons with high blood pressure, 90% to 95% have essential hypertension (hypertension of unknown cause) or primary hypertension. The cause involves a complex interaction between poor lifestyle choices and gene expression. Lifestyle factors that have been implicated include poor diet (i.e., high sodium, low fruit and vegetable intake), smoking, physical inactivity, stress, and obesity. Vascular inflammation has also been implicated (Savoia and Schiffrin, 2007). Many genes play a role in hypertension; most relate to the renal or neuroendocrine control of blood pressure. Evaluations of 2.5 million genotyped polymorphisms have identified CYP17A1, CYP1A2, FGF5, SH2B3, MTHFR, ZNF652, and PLCD3 genes in hypertensive individuals, primarily of European or Asian ancestry (Newton-Cheh et al., 2009). Hypertension that arises as the result of another disease, usually endocrine, is referred to as secondary hypertension. Depending on the extent of the underlying disease, secondary hypertension can be cured.
Prevalence and Incidence
Approximately 74 million American adults age 20 and older have hypertension or are taking antihypertensive medication (AHA, 2010). Prevalence rates for hypertension have remained somewhat stable during the last 8 years, but are still almost double the Healthy People 2010 goal; more than 30% of the adult U.S. population has high blood pressure (Egan et al., 2010). Non-Hispanic black adults have a higher age-adjusted prevalence of hypertension (43% of men; 44.8% of women) than non-Hispanic whites (34.3% of men; 31.1% of women), Mexican-Americans (25.9% of men; 31.6% of women), or Native Americans (25.3% men and women) (AHA, 2010, AHA, 2007). The prevalence of high blood pressure in blacks is one of the highest rates seen anywhere in the world. Because blacks develop hypertension earlier in life and maintain higher blood pressure levels, their risk of fatal stroke, heart disease, or end-stage kidney disease is higher than in whites (AHA, 2010).
A person of any age can have hypertension. Approximately 16% of boys and 9% of girls have elevated blood pressure (Ostchega et al., 2009). With aging, the prevalence of high blood pressure increases (Figure 34-7). Before the age of 45 more men than women have high blood pressure, and after age 65 the rates of high blood pressure among women in each racial group surpass those of the men in their group (AHA, 2010). Because the prevalence of hypertension rises with increasing age, more than half the older adult population (>65 years of age) in any racial group has hypertension. Although lifestyle interventions targeted to older persons may reduce the prevalence of hypertension, early intervention programs provide the greatest long-term potential for reducing overall blood pressure-related complications (Gidding et al., 2009).
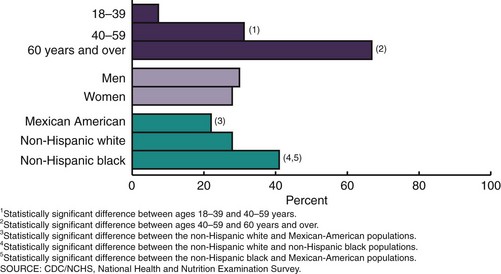
FIGURE 34-7 Age specific and age-adjusted prevalence of hypertension in adults: United States, 2005-2006. (Ostchega Y, Yoon SS, Hughes J, Louis T. Hypertension awareness, treatment, and control—continued disparities in adults: United States, 2005-2006. NCHS data brief no. 3, Hyattsville, MD: National Center for Health Statistics. 2008.)
The relationship between blood pressure and risk of CVD events is continuous, independent of other risk factors. The higher the blood pressure, the greater the chance of target organ damage, including left ventricular hypertrophy (LVH), HF, stroke, chronic kidney disease, and retinopathy (ADA, 2009). As many as 30% of adults with hypertension have treatment-resistant hypertension, which means that their blood pressure remains high despite the use of three or more antihypertensive drugs from different classes (Calhoun et al., 2008). Treatment-resistant hypertension puts an individual at greater risk of target organ damage. Older age and obesity are two of the strongest risk factors associated with the condition. Identification and reversal of lifestyle factors contributing to treatment resistance, along with diagnosis and appropriate treatment of secondary causes and use of effective multidrug regimens are essential treatment strategies.
Adults with diabetes have CVD death rates two to four times higher than adults without diabetes (American Diabetes Association, 2007). Consequently, national guidelines have set the target blood pressure goal for antihypertensive therapy for individuals with diabetes at 130/80 mm Hg, lower than that recommended for the general population. With the increased prevalence of diabetes, this is an important public health problem to address.
Although hypertensive patients are often asymptomatic, hypertension is not a benign disease. Cardiac, cerebrovascular, and renal systems are affected by chronically elevated blood pressure (Table 34-4). High blood pressure was the primary or a contributory cause in 326,000 of the 2.4 million U.S. deaths in 2006 (AHA, 2010). Between 1996 and 2006 the age-adjusted death rate from hypertension increased by 19.5%; overall deaths from hypertension increased by 48%. Death rates from hypertension are approximately 3.2 times higher in blacks than in whites (AHA, 2010). Hypertension is a major contributing factor to atherosclerosis, stroke, renal failure, and MI. Factors associated with a poor prognosis in hypertension are shown in Box 34-7.
TABLE 34-4
Manifestations of Target Organ Disease from Hypertension
| Organ System | Manifestations |
| Cardiac | Clinical, electrocardiographic, or radiologic evidence of coronary artery disease; left ventricular hypertrophy; left ventricular malfunction or cardiac failure |
| Cerebrovascular | Transient ischemic attack or stroke |
| Peripheral | Absence of one or more pulses in extremities (except for dorsalis pedis) with or without intermittent claudication; aneurysm |
| Renal | Serum creatinine >130 µmol/L (1.5 mg/dL), proteinuria (1+ or greater); microalbuminuria |
| Retinopathy | Hemorrhages or exudates, with or without papilledema |
From the Joint National Committee on Prevention, Detection, Evaluation, and Treatment of High Blood Pressure: Fifth report (JNC V), Arch Intern Med 153:149, 1993.
Pathophysiology
Blood pressure is a function of cardiac output multiplied by peripheral resistance (the resistance in the blood vessels to the flow of blood). Thus the diameter of the blood vessel markedly affects blood flow. When the diameter is decreased (as in atherosclerosis) resistance and blood pressure increase. Conversely, when the diameter is increased (as with vasodilator drug therapy), resistance decreases and blood pressure is lowered.
Many systems maintain homeostatic control of blood pressure. The major regulators are the SNS for short-term control and the kidney for long-term control. In response to a fall in blood pressure, the SNS secretes norepinephrine, a vasoconstrictor, which acts on small arteries and arterioles to increase peripheral resistance and raise blood pressure. Conditions that result in overstimulation of the SNS (i.e., certain adrenal disorders or sleep apnea) result in increased blood pressure (Khayat et al., 2009). The kidney regulates blood pressure by controlling the extracellular fluid volume and secreting renin, which activates the renin-angiotensin system (RAS) (Figure 34-8). Abnormal blood pressure is usually multifactorial. In most cases of hypertension, peripheral resistance increases. This resistance forces the left ventricle of the heart to increase its effort in pumping blood through the system. With time, LVH and eventually HF can develop.
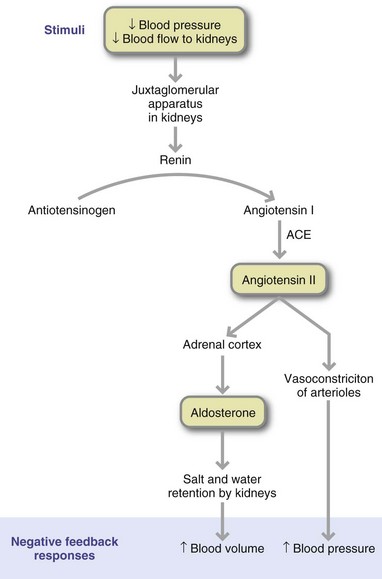
FIGURE 34-8 Renin-angiotensin cascade. ACE, Angiotensin-converting enzyme. (Reprinted with permission from Fox SI: Human physiology, ed 6, New York, 1999, McGraw-Hill.)
Common genetic variants of the RAS gene, including angiotensin-converting enzyme (ACE) and angiotensinogen, have shown relationships with hypertension (Norton et al., 2010). An increased production of these proteins may increase production of angiotensin II, the primary mediator of the RAS, thus increasing blood pressure. Angiotensin II may also trigger low-grade inflammation within the blood vessel wall, a condition that predisposes to hypertension (Savoia and Schiffrin, 2007).
Hypertension often occurs with other risk factors for CVD including visceral (intraabdominal) obesity, insulin resistance, high triglycerides, and low HDL cholesterol levels. The coexistence of three or more of these risk factors leads to metabolic syndrome. It is unclear whether one or more of these risk factors precedes the others or whether they occur simultaneously. Accumulation of visceral fat synthesizes increased amounts of angiotensinogen, which activates the RAS and increases blood pressure (Mathieu et al., 2009). Also, angiotensin II, the primary mediator of the RAS, promotes the development of large dysfunctional adipocytes, which produce increased amounts of leptin and reduced quantities of adiponectin. Higher levels of leptin and lower amounts of circulating adiponectin activate the SNS, a key component of the hypertensive response (Depres, 2006).
Primary Prevention
Positive changes in hypertension awareness, treatment, and control have occurred during the last several years. Based on analysis of NHANES data from 2007-2008, 81% of people with hypertension are aware that they have it (Egan et al., 2010), up from 72% in 1999-2004. Current hypertension treatment and control rates have also increased; this 50% control rate meets the Healthy People 2010 objective, and reflects increased awareness, treatment and control of hypertension. In 2008 women, younger adults (aged 18-39 years), and Hispanic individuals had lower rates of blood pressure control compared with men, younger individuals, and non-Hispanic whites. Improving hypertension treatment through targeted intervention programs should have a positive effect on CVD outcomes. Blood pressure treatment guidelines highlight the importance of evaluating patients for the presence of multiple CVD risk factors and individualizing lifestyle modification and drug therapies accordingly.
Primary prevention can improve quality of life and the associated costs. One strategy is to reduce blood pressure in those with prehypertension (above 120/80) but below the cutoff points for stage 1 hypertension. A downward shift of 3 mm Hg in SBP would decrease the mortality from stroke by 8% and from CHD by 5% (Appel, 2006). Persons at highest risk should be strongly encouraged to adopt healthier lifestyles.
Changing lifestyle factors have documented efficacy in the primary prevention and control of hypertension. These factors were systematically reviewed and categorized by the American Dietetic Association (ADA) in 2009 (Table 34-5). A strong recommendation (i.e., high benefit/risk ratio with supporting evidence) is made for reducing intake of dietary sodium and increasing intake of fruits and vegetables. The ADA Practice Guidelines also recommend weight reduction if overweight; limiting alcohol intake; adopting a dietary pattern that emphasizes fruits, vegetables, and low-fat dairy products; and increasing physical activity. These recommendations are consensus recommendations based on expert opinion. A fair recommendation is made for increasing dietary potassium, magnesium, and calcium to recommended levels based on the dietary reference intakes (DRI). Evidence is not clear for modifications in dietary fats to lower blood pressure.
TABLE 34-5
Evidence Analysis Library Recommendations on Blood Pressure and Hypertensive Adults
| Food or Nutrient | Recommendation | Rating |
| Fruits and vegetables | Fruits and vegetables should be recommended at a level of five to ten servings per day for significant BP reduction. | Strong |
| Sodium | Sodium intake should be limited to no more than 2300 mg/day; if adherent to this recommendation and BP target not achieved, a further reduction in dietary sodium to 1600 mg/day should be encouraged in combination with a DASH dietary pattern. Approximate SBP reduction range 2-8 mm Hg. | Strong |
| DASH diet | Individuals should adopt the DASH dietary pattern, which is rich in fruits, vegetables, low-fat dairy, and nuts; low in sodium, total fat, and saturated fat; and adequate in calories for weight management. Approximate SBP reduction range 8-14 mm Hg. | Consensus |
| Physical activity | Individuals should be encouraged to engage in aerobic physical activity for at least 30 minutes per day on most days of the week, as it reduces SBP. Approximate SBP reduction range 4-9 mm Hg. | Consensus |
| Weight management | Optimal body weight should be achieved and maintained (BMI 18.5-24.9) to reduce BP. Approximate SBP reduction range 5-20 mm Hg/10 kg. | Consensus |
| Alcohol | For individuals who can safely consume alcohol, consumption should be limited to no more than two drinks (24 oz beer, 10 oz wine, or 3 oz of 80-proof liquor) per day in most men and to no more than one drink per day in women. Approximate SBP reduction range 2-4 mm Hg. | Consensus |
| Calcium | The effect of increasing calcium intake with lowered blood pressure is unclear; although some research indicates minimal benefit. | Fair |
| Magnesium | The effect of increasing magnesium intake with lowered blood pressure is unknown; although some research indicates minimal benefit. | Fair |
| Omega-3 fatty acids | Studies investigating increased consumption of ω-3 fatty acids have not demonstrated a beneficial effect on BP. | Fair |
| Potassium | Studies support a modest relationship between increasing intake of potassium and a lower sodium-potassium ratio with lowered blood pressure. | Fair |
BMI, Body mass index; BP, blood pressure; DASH, Dietary Approaches to Stop Hypertension; SBP, systolic blood pressure.
Recommendations listed are for those rated by the American Dietetic Association as strong, fair, and consensus; for those with weak ratings consult the American Dietetic Association Evidence Analysis Library for Hypertension (2009) http://www.adaevidencelibrary.com/topic.cfm?cat=3259.
Fats
Although dietary lipids do not seem to affect blood pressure, they strongly affect CVD risk; thus the TLC diet is recommended. Although fatty acids may not directly affect blood pressure, an olive oil–enriched diet may reduce the need for antihypertensive medication. Both the amount and type of fat have been studied with respect to blood pressure. In several large prospective observational studies and clinical trials, intake of total fat and specific fatty acids had little effect on blood pressure (Cicero et al., 2009). Supplementation with large doses of fish oil (average 3.7 g/day) can give a modest reduction in SBP and DBP, especially in older hypertensive persons.
Fewer vegans have hypertension than omnivores, even though their salt intake is not significantly different. The vegan diet tends to be higher in PUFAs, among other nutrients, and lower in total fat, SFAs, and cholesterol. PUFAs are precursors of prostaglandins, whose actions affect renal sodium excretion and relax vascular musculature. Thus factors other than dietary fat, such as increased potassium levels, appear to lower blood pressure in vegans.
Protein
Although soy protein may contribute to the lowering of blood pressure, the effect of increased soy food intake on blood pressure remains controversial (ADA, 2009).
Dietary Patterns Emphasizing Fruits and Vegetables
Several dietary patterns have been shown to lower blood pressure. Vegetarian dietary patterns have been associated with lower SBP in observational studies and clinical trials. Average SBP reductions of 5 to 6 mm Hg have been reported. Specifically, the Dietary Approaches to Stop Hypertension (DASH) Diet Study shows that this low-fat dietary pattern (including lean meats and nuts and emphasizing fruits, vegetables, and nonfat dairy products) decreased SBP. The DASH diet is found to be more effective than just adding fruits and vegetables to a low-fat dietary pattern (Appel et al., 2006). Although the DASH diet is safe and currently advocated for preventing and treating prehypertension and hypertension, the diet is high in potassium, phosphorus, and protein, depending on how it is planned. For this reason the DASH diet is not advisable for individuals with end-stage renal disease (Appel et al., 2006).
The OmniHeart Trial examined the effects of three versions of the DASH diet on blood pressure and serum lipids. The diets studied included the original DASH diet, a high-protein version of the DASH diet (25% of energy from protein, approximately half from plant sources), and a DASH diet high in unsaturated fat (31% of calories from unsaturated fat, mostly monounsaturated). Although each diet lowered SBP, substituting some of the carbohydrate (approximately 10% of total calories) in the DASH diet with either protein or monounsaturated fat achieved the best reduction in blood pressure and blood cholesterol (Appel et al., 2006; Miller et al., 2006). This could be achieved by substituting nuts for some of the fruit, bread, or cereal servings.
Because many hypertensive patients are overweight, hypocaloric versions of the DASH diet have also been tested for efficacy in promoting weight loss and blood pressure reduction. A hypocaloric DASH diet versus a low-calorie, low-fat diet produces a greater reduction in SBP and DBP. More recently, the ENCORE study showed that the addition of exercise and weight loss to the DASH diet resulted in greater blood pressure reductions, greater improvements in vascular function, and reduced left ventricular mass compared with the DASH diet alone (Blumenthal et al., 2010).
Weight Reduction
There is a strong association between BMI and hypertension among men and women in all race or ethnic groups and in most age groups. The risk of developing elevated blood pressure is two to six times higher in overweight than in normal-weight persons (National Institutes of Health [NIH], 2004). Risk estimates from population studies suggest that 30% or more of cases of hypertension can be directly attributed to obesity (AHA, 2010). Weight gain during adult life is responsible for much of the rise in blood pressure seen with aging.
Some of the physiologic changes proposed to explain the relationship between excess body fat and blood pressure are overactivation of the SNS and RAS and vascular inflammation (Mathieu et al., 2009). Visceral fat in particular promotes vascular inflammation by inducing cytokine release, proinflammatory transcription factors, and adhesion molecules (Savoia and Schiffrin, 2007). Low-grade inflammation occurs in the vasculature of individuals with elevated blood pressure; whether it precedes the onset of hypertension is unclear. Weight loss, exercise, and a Mediterranean-style diet are quite beneficial.
Virtually all clinical trials on weight reduction and blood pressure support the efficacy of weight loss on lowering blood pressure. Reductions in blood pressure can occur without attainment of desirable body weight in most participants. Larger blood pressure reductions are achieved in participants who lost more weight and were also taking antihypertensive medications. This latter finding suggests a possible synergistic effect between weight loss and drug therapy. Although weight reduction and maintenance of a healthy body weight is a major effort, interventions to prevent weight gain are needed prior to midlife. In addition, BMI is recommended as a screening tool in adolescence for future health risk.
Sodium
Evidence from a variety of studies supports lowering blood pressure and CVD risk by reducing dietary sodium. For example, in the Trials of Hypertension Prevention more than 2400 individuals with moderately elevated blood pressure were randomly assigned to either cut their sodium by 750 to 1000 milligrams per day or to follow general guidelines for healthy eating for 18 months to 4 years. In 10 to 15 years after the studies ended, individuals who cut their sodium experienced a 25% to 30% lower risk of heart attacks, strokes, or other cardiovascular events compared with the group that did not (Cook et al., 2007). Several randomized trials have confirmed these positive effects of sodium reduction on blood pressure and cardiovascular outcomes for normotensive and hypertensive individuals.
The DASH sodium trials tested the effects of three different levels of sodium intake (1500 mg, 2300 mg, and 3300 mg/day) combined with either a typical U.S. diet or the DASH diet in persons with prehypertension or stage 1 hypertension (Appel, 2006). The lowest blood pressures were achieved by those eating the 1500-mg sodium level in the DASH diet. In both the DASH diet and the typical American diet groups, the lower the sodium, the lower the blood pressure. Such data provide the basis for current dietary guidelines to limit sodium intake to 1500 mg/day for those with higher than optimal blood pressure (U.S. Department of Health and Human Services, 2005) (see Chapter 12). For those with normal blood pressure, the Dietary Guidelines for Americans recommend an intake of less than 2300 mg of sodium, the equivalent of 6 grams of salt, each day. This goal is supported by the ADA Practice Guidelines (ADA, 2009) and other organizations.
There is heterogeneity in individual responsiveness to sodium. Some persons with hypertension show a greater decrease in their blood pressures in response to reduced sodium intake than others. The term salt-sensitive hypertension has been used to identify these individuals. Salt-resistant hypertension refers to individuals with hypertension whose blood pressures do not change significantly with lowered salt intakes. Salt sensitivity varies, with individuals having greater or lesser degrees of blood pressure reduction. In general, individuals who are more sensitive to the effects of salt and sodium tend to be individuals who are black, obese, and middle-aged or older, especially if they have diabetes, chronic kidney disease, or hypertension. Currently, there are no practical methods for identifying the salt-sensitive individual from the salt-resistant individual.
Calcium
Higher dairy versus supplemental calcium is associated with lower risk of hypertension (Wang et al., 2008). Analyses of the effects of calcium on blood pressure report modest reductions in SBP and DBP in hypertensive patients (Dickinson, 2006b). Mechanistically, a low calcium intake increases intracellular calcium concentration. This in turn increases 1,25-vitamin D3 and parathyroid hormone levels, causing calcium influx into vascular smooth muscle cells and greater vascular resistance (Kris-Etherton et al., 2009). Alternatively, peptides derived from milk proteins, especially fermented milk products, may function as ACEs, thereby lowering blood pressure. The DASH trial found that 8-week consumption of a diet high in fruits, vegetables, and fiber; three servings of low-fat dairy products/day; and lower total and saturated fat could lower SBP and DBP by 5.5 and 3 mm Hg greater, respectively, than the control diet. The fruit and vegetable diet without dairy foods results in blood pressure reductions approximately half that of the DASH diet. The ADA Practice Guidelines recommend a diet rich in fruits, vegetables, and low-fat dairy products (versus calcium supplements) for the prevention and management of elevated blood pressure (ADA, 2009). An intake of dietary calcium to meet the DRI is recommended.
Magnesium
Magnesium is a potent inhibitor of vascular smooth-muscle contraction and may play a role in blood pressure regulation as a vasodilator. High dietary magnesium is often correlated with lower blood pressure (Sontia and Touyz, 2007). Less consistent findings have been reported from trials of magnesium supplementation (Dickinson et al., 2006b). The DASH dietary pattern emphasizes foods rich in magnesium, including green leafy vegetables, nuts, and whole-grain breads and cereals. Overall food sources of magnesium rather than supplemental doses of the nutrient are encouraged to prevent or control hypertension (ADA, 2009).
Potassium
Higher potassium intakes are usually associated with lower blood pressures, often dose-responsive. Specifically, supplemental doses of potassium in the range of 1900 to 4700 mg/day will lower blood pressure approximately 2 to 6 mm Hg DBP and 2 to 4 mm Hg SBP (Dickinson et al., 2006a). The effects of potassium are greater in those with higher initial blood pressure, in blacks compared with whites, and in those with higher intakes of sodium. Higher potassium intake is also associated with a lower risk of stroke. More significant effects are found for improved diet, aerobic exercise, alcohol and sodium restriction, and fish oil supplements than for potassium supplements (Dickinson et al., 2006a).
The large number of fruits and vegetables recommended in the DASH diet makes it easy to meet the dietary potassium recommendations—approximately 4.7 g/day (ADA, 2009). In individuals with medical conditions that could impair potassium excretion (e.g., chronic renal failure, diabetes, and congestive HF), a lower potassium intake (< 4.7 g/day) is appropriate to prevent hyperkalemia.
Physical Activity
Less active persons are 30% to 50% more likely to develop hypertension than their active counterparts. Despite the benefits of activity and exercise in reducing disease, many Americans remain inactive. Hispanics (33% men, 40% women), blacks (27% men, 34% women), and whites (18% men, 22% women) all have a high prevalence of sedentary lifestyles (AHA, 2010). Exercise is beneficial to blood pressure. Increasing the amount of low- to moderate-intensity physical activity to 30 to 45 minutes most days of the week is an important adjunct to other strategies.
Alcohol Consumption
Excessive alcohol consumption is responsible for 5% to 7% of the hypertension in the population (Appel et al., 2006). A three drink/day amount (a total of 3 oz of alcohol) is the threshold for raising blood pressure and is associated with a 3-mm Hg rise in SBP. For preventing high blood pressure, alcohol intake should be no more than two drinks per day (24 oz of beer, 10 oz of wine, or 3 oz of 80-proof whiskey) in men, and no more than one drink a day is recommended for lighter-weight men and for women.
Medical Management
The goal of hypertension management is to reduce morbidity and mortality from stroke, hypertension-associated heart disease, and renal disease. The three objectives for evaluating patients with hypertension are to (1) identify the possible causes, (2) assess the presence or absence of target organ disease and clinical CVD, and (3) identify other CVD risk factors that will help guide treatment. The presence of risk factors and target organ damage determines treatment priority.
Lifestyle modifications are definitive therapy for some and adjunctive therapy for all persons with hypertension. Several months of compliant lifestyle modifications should be tried before drug therapy is initiated. An algorithm for treatment of hypertension is shown in Figure 34-9. Even if lifestyle modifications cannot completely correct the blood pressure, they help increase the efficacy of pharmacologic agents and improve other CVD risk factors. Management of hypertension requires a lifelong commitment.
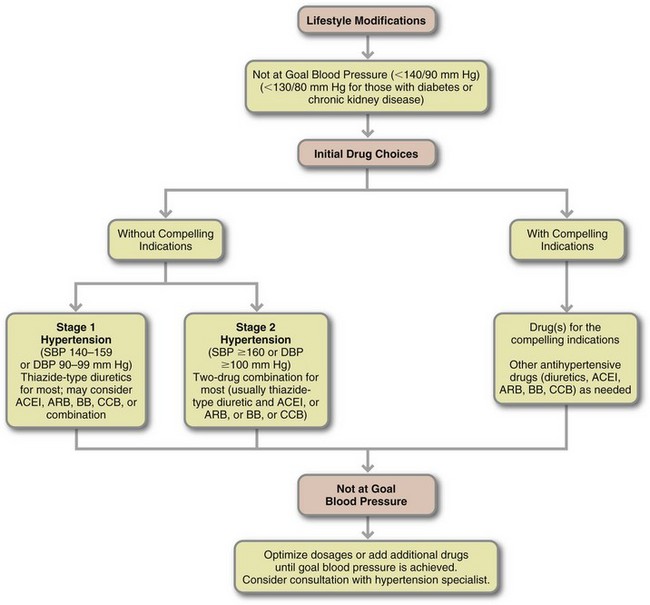
FIGURE 34-9 Algorithm for treatment of hypertension. ACEI, angiotensin-converting enzyme inhibitor; ARB, angiotensin-receptor blocker; BB, β-blocker; CCB, calcium channel blocker; DBP, diastolic blood pressure; SBP, systolic blood pressure. (From National Institutes of Health, National Heart, Lung and Blood Institute National High Blood Pressure Education Program: The Seventh Report of the Joint National Committee on Prevention, Detection, Evaluation, and Treatment of High Blood Pressure, NIH Publication No. 04-5230, August 2004).
Pharmacologic therapy is necessary for many individuals, especially if blood pressure remains elevated after 6 to 12 months of lifestyle changes. Most patients with hypertension more severe than stage 1 hypertension require drug treatment; however, lifestyle modifications remain a part of therapy in conjunction with medications. The standard treatment for hypertension includes diuretics and β-blockers, although other drugs (β-ACE inhibitors, α-receptor blockers, and calcium antagonists) are equally effective. All these drugs can affect nutrition status (see Chapter 9).
Diuretics lower blood pressure in some patients by promoting volume depletion and sodium loss. Thiazide diuretics increase urinary potassium excretion, especially in the presence of a high salt intake, thus leading to potassium loss and possible hypokalemia. Except in the case of a potassium-sparing diuretic such as spironolactone or triamterene, additional potassium is usually required.
A number of medications either raise blood pressure or interfere with the effectiveness of antihypertensive drugs. These include oral contraceptives, steroids, nonsteroidal antiinflammatory drugs, nasal decongestants and other cold remedies, appetite suppressants, cyclosporine, tricyclic antidepressants, and monoamine-oxidase inhibitors (see Chapter 9 and Appendix 31).
Medical Nutrition Therapy
The appropriate course of nutrition therapy for managing hypertension should be guided by data from a detailed nutrition assessment. Weight history; leisure-time physical activity; and assessment of dietary sodium, alcohol, saturated fat, and other patterns (e.g., intake of fruits, vegetables, and low-fat dairy products) are essential components of the medical and diet history. Nutrition assessment should include evaluation of the individual in the following specific domains to determine nutrition problems and diagnoses: food and nutrient intake; knowledge, beliefs, and attitudes; behavior; physical activity and function; and appropriate biochemical data. Following are the components of the current recommendations for managing elevated blood pressure. See Table 34-6 for a list of approaches sometimes used.
TABLE 34-6
Complementary and Alternative Approaches to Lowering Blood Pressure
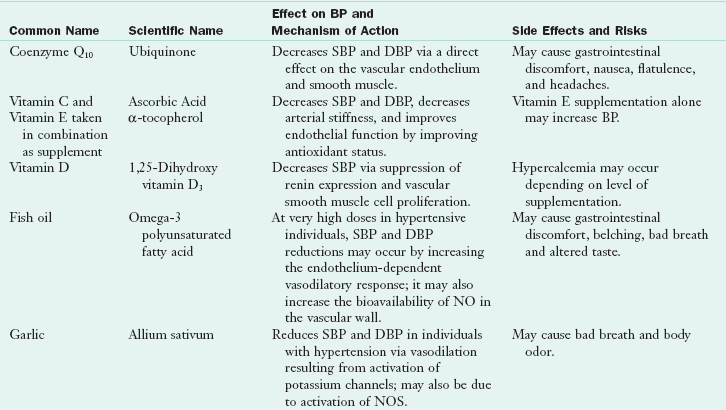
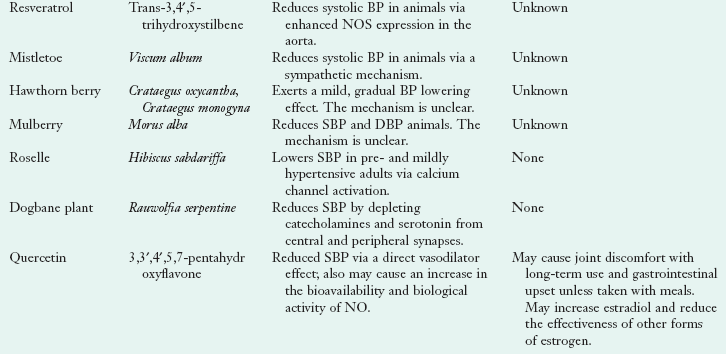
BP, Blood pressure; DBP, diastolic blood pressure; NO, nitric oxide; NOS, nitric oxide synthase; SBP, systolic blood pressure.
Data from Fragakis AS, Thomson C: The health professional’s guide to popular dietary supplements, ed 3, 2007, American Dietetic Association, Chicago, IL. © American Dietetic Association. Reprinted with permission.
Energy Intake
For each kilogram of weight lost, reductions in SBP and DBP of approximately 1 mm Hg are expected. Hypertensive patients who weigh more than 115% of ideal body weight should be placed on an individualized weight-reduction program that focuses on both hypocaloric dietary intake and exercise (see Chapter 22). A modest caloric reduction is associated with a significant lowering of SBP and DBP, and LDL cholesterol levels. Hypocaloric diets that include a low-sodium DASH dietary pattern have produced more significant blood pressure reductions than low-calorie diets emphasizing only low-fat foods. Another benefit of weight loss on blood pressure is the synergistic effect with drug therapy. Weight loss should be an adjunct to drug therapy because it may decrease the dose or number of drugs necessary to control blood pressure.
DASH Diet
The DASH diet is used for both preventing and controlling high blood pressure (see Appendix 33). Successful adoption of this diet requires many behavioral changes: eating twice the average number of daily servings of fruits, vegetables, and dairy products; limiting by one-third the usual intake of beef, pork, and ham; eating half the typical amounts of fats, oils, and salad dressings; and eating one-quarter the number of snacks and sweets. Lactose-intolerant persons may need to incorporate lactase enzyme or use other strategies to replace milk. Assessing patients’ readiness to change and engaging patients in problem solving, decision making, and goal setting are behavioral strategies that may improve adherence (Appel et al., 2006).
The high number of fruits and vegetables consumed on the DASH diet is a marked change from typical patterns of Americans. To achieve the 8 to 10 servings, two to three fruits and vegetables should be consumed at each meal. Importantly, because the DASH diet is high in fiber, gradual increases in fruit, vegetables, and whole-grain foods should be made over time. Slow changes can reduce potential short-term gastrointestinal disturbances associated with a high-fiber diet such as bloating and diarrhea. The DASH pattern is in the current AHA nutrition guidelines (Appel et al., 2006). Servings for different calorie levels are shown in Appendix 33.
Salt Restriction
The Dietary Guidelines for Americans recommend that young adults consume less than 2400 mg of sodium per day. People with hypertension, blacks, and middle-age and elderly people—almost half the population—are advised to consume no more than 1500 mg/day (U.S. Department of Agriculture [USDA], 2005). The DASH-Sodium trial showed that people consuming diets of 1.5 g/day of sodium had greater blood pressure benefits than those with higher intakes. Lower-sodium diets were also shown to maintain low blood pressure over time and enhance the efficacy of certain blood pressure–lowering medications. Although it may be advisable for individuals with elevated blood pressure to restrict sodium to adequate intake (AI) levels, adherence to diets containing less than 2 g/day of sodium is very difficult to achieve.
In addition to advice to select minimally processed foods, dietary counseling should include instruction on reading food labels for sodium content, avoidance of discretionary salt in cooking or meal preparation (1 tsp salt = 2400 mg sodium), and use of alternative flavorings to satisfy individual taste. The DASH eating plan is rich in fruits and vegetables, which are naturally lower in sodium that many other foods.
Because most dietary salt comes from processed foods and eating out, changes in food preparation and processing can help patients reach the sodium goal. Sensory studies show that commercial processing could develop and revise recipes using lower sodium concentrations and reduce added sodium without affecting consumer acceptance. The food industry has begun this effort to reduce sodium in the American diet. See Focus On: Sodium and the Food Industry.
Focus On
Sodium and the Food Industry
Most foods sold in supermarkets and restaurants are high in salt. The dramatic differences in sodium from brand to brand suggest that many companies could easily achieve significant reductions without sacrificing taste. According to the Center for Science in the Public Interest (Liebman, 2010), processed foods and restaurant foods contribute approximately 80% of the sodium in Americans’ diets; 10% comes from salt added during cooking at home or at the table; the remaining 10% is naturally occurring. Americans now consume approximately 4000 mg of sodium per day—about twice the recommended amount. To help address this problem, the National Academy of Science and Institute of Medicine (2010) issued a report calling for urgent government action to reduce salt in packaged and restaurant foods. The report recommends five strategies to reduce sodium levels in America’s food supply. The primary strategy is to set a mandatory national sodium level standard for foods. The interim strategy is voluntary reduction of sodium content in foods by food manufacturers. Supporting strategies are for government agencies, public health and consumer organizations, and the food industry to administer activities to support both the reduction of sodium in the food supply and consumers’ intake of sodium. Federal agencies are recommended to improve the data collection, monitoring, and surveillance of sodium intake measurement, salt taste preference, and sodium content of foods.
Potassium-Calcium-Magnesium
Consuming a diet rich in potassium has been shown to lower blood pressure and blunt the effects of salt on blood pressure in some individuals (Appel et al., 2006). The recommended intake of potassium for adults is 4.7 g/day (National Academies of Science, Institute of Medicine, 2004). Potassium-rich fruits and vegetables include leafy green vegetables, fruits, and root vegetables. Examples of such foods include oranges, beet greens, white beans, spinach, bananas, and sweet potatoes. Although meat, milk, and cereal products contain potassium, the potassium from these sources is not as well-absorbed as that from fruits and vegetables (USDA, 2005).
Increased intakes of calcium and magnesium may have blood pressure benefits, although there is not enough data at present to support a specific recommendation for increasing levels of intake (ADA, 2009). Rather, recommendations suggest meeting the AI intake for calcium and the recommended dietary allowance for magnesium from food sources rather than supplements. The DASH diet plan encourages foods that would be good sources of both nutrients, including low-fat dairy products, dark green leafy vegetables, beans, and nuts.
Lipids
Current recommendations for lipid composition of the diet are recommended to help control weight and decrease the risk of CVD. Omega-3 fatty acids are not highlighted, because their consumption does not appear to lower blood pressure (ADA, 2009). However, the research continues.
Alcohol
The diet history should contain information about alcohol consumption. Alcohol intake should be limited to no more than two drinks daily in men, which is equivalent to 2 oz of 100-proof whiskey, 10 oz of wine, or 24 oz of beer. Women or lighter-weight men should consume half this amount.
Exercise
Moderate physical activity, defined as 30 to 45 minutes of brisk walking on most days of the week, is recommended as an adjunct therapy in hypertension. Overweight or obese hypertensive patients should strive for 300 to 500 kcal expended in exercise per day or 1000 to 2000 kcal/week to promote weight loss or weight control. Because exercise is strongly associated with success in weight-reduction and weight-maintenance programs, any increase in activity level should be encouraged. Daily moderate-intensity physical activity lasting 60 to 90 minutes is recommended for individuals trying to maintain a new lower weight after having lost weight (USDA, 2005).
Treatment of Hypertension in Children and Adolescents
The prevalence of primary hypertension among children in the United States is increasing in concert with rising obesity rates and increased intakes of high-calorie, high-salt foods (Mitsnefes, 2006). Hypertension tracks into adulthood and has been linked with carotid intimal-medial thickness, LVH, and fibrotic plaque formation. Secondary hypertension is more common in preadolescent children, mostly from renal disease; primary hypertension caused by obesity or a family history of hypertension is more common in adolescents (Luma and Spiotta, 2006). In addition, it has been noted that intrauterine growth retardation leads to hypertension in childhood (Shankaran, 2006).
High blood pressure in youth is based on a normative distribution of blood pressure in healthy children. Hypertension is defined as an SBP or DBP of greater than the 95th percentile for age, sex, and height. The designation for prehypertension in children is SBP or DBP of greater than the 90th percentile. Therapeutic lifestyle changes are recommended as an initial treatment strategy for children and adolescents with prehypertension or hypertension. These lifestyle modifications include regular physical activity, avoiding excess weight gain, limiting sodium, and consuming a DASH-type diet.
Weight reduction is considered the primary therapy for obesity-related hypertension in children and adolescents. Unfortunately, sustained weight loss is difficult to achieve in this age group. The Framingham Children’s Study showed that children with higher intakes of fruits, vegetables (a combination of four or more servings per day), and dairy products (two or more servings per day) had lower SBP compared with those with lower intakes of these foods. Couch and colleagues (2008) showed that adolescents with prehypertension and hypertension could achieve a significant reduction in SBP in response to a behaviorally oriented nutrition intervention emphasizing the DASH diet. Because adherence to dietary interventions may be particularly challenging among children and teenagers, innovative nutrition intervention approaches that address the unique needs and circumstances of this age-group are important considerations in intervention design (see Chapters 18 and 19).
Treatment of Blood Pressure in Older Adults
More than half of the older population has hypertension; this is not a normal consequence of aging. The lifestyle modifications discussed previously are the first step in treatment of older adults, as with younger populations. The Trial of Nonpharmacologic Interventions in the Elderly study found that losing weight (8 to 10 lb) and reducing sodium intake (to 1.8 g/day) can lessen or eliminate the need for drugs in obese, hypertensive older adults. Although losing weight and decreasing sodium in older adults are very effective in lowering blood pressure, knowing how to facilitate these changes and promote adherence remains an obstacle for health professionals.
Blood pressure should be controlled regardless of age, initial blood pressure level, or duration of hypertension (NIH, 2004). Severe sodium restrictions are not adopted because these could lead to volume depletion in older patients with renal damage. Drug treatment in the older adult is supported by very strong data.
Heart Failure
Normally the heart pumps adequate blood to perfuse tissues and meet metabolic needs (Figure 34-10). In heart failure (HF), formerly called congestive heart failure, the heart cannot provide adequate blood flow to the rest of the body, causing symptoms of fatigue, shortness of breath (dyspnea), and fluid retention. Diseases of the heart (valves, muscle, blood vessels) and vasculature can lead to HF (see Pathophysiology and Care Management Algorithm: Heart Failure). HF can be right-sided, left-sided, or can affect both sides of the heart. It is further categorized as systolic failure when the heart cannot pump, or eject, blood efficiently out of the heart or diastolic failure, meaning the heart cannot fill with blood as it should.
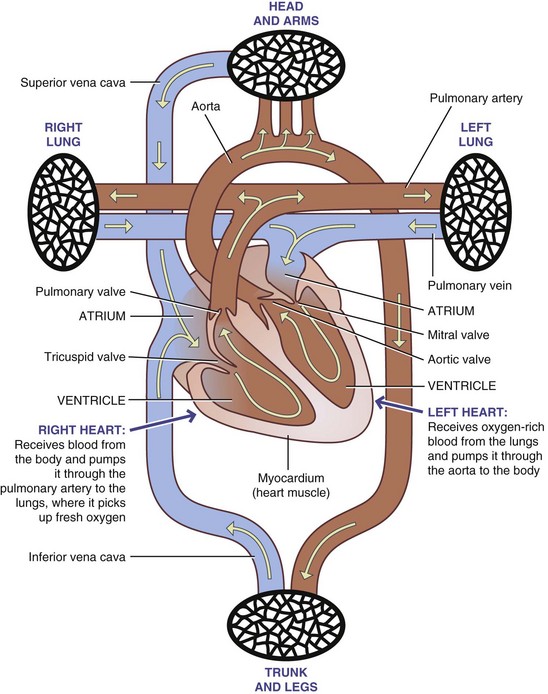
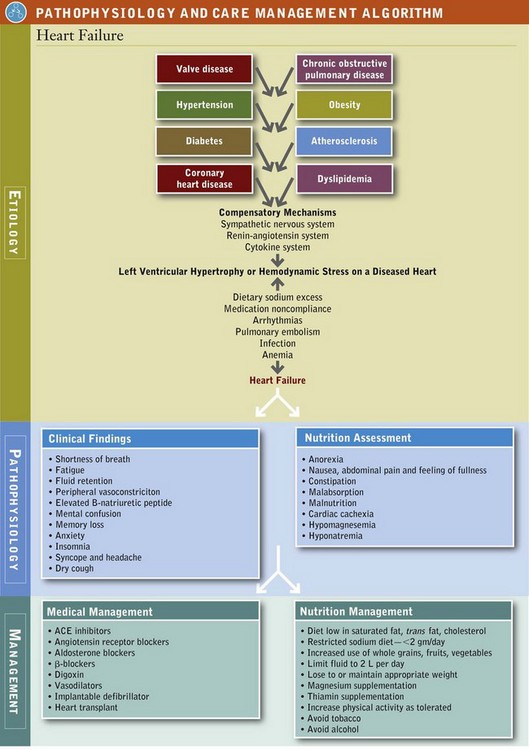
HF is a major public health problem that affects more than 5 million Americans. The prevalence of HF increases with age. HF affects almost 10 per 1,000 population after age 65 (AHA, 2010). Black women have the highest rates of HF, followed by black men, Mexican-American men, white men, white women, and Mexican-American women (Thom et al., 2006). The incidence of new cases of HF has risen during the last 20 years because of an aging population, the increased number of people being saved from a MI, and the increase in obesity. In 2006 the overall death rate for HF was 89.2 per 100,000 population (AHA, 2010). The death rate per 100,000 for white men was 103.7, black men 105.9, white women 80.3, and black women 84.4. Unlike other CVDs, the number of people being discharged with an HF diagnosis rose from 877,000 in 1996 to 1,106,000 in 2006 (AHA, 2010).
Pathophysiology
The progression of HF is similar to that of atherosclerosis because there is an asymptomatic phase when damage is silently occurring (stages A and B) (Figure 34-11). HF is initiated by damage or stress to the heart muscle either of acute MI or insidious (hemodynamic pressure or volume overloading) onset. See Table 34-7 for classifications of HF.
TABLE 34-7
Classifications of Heart Failure
| Class I | No undue symptoms associated with ordinary activity and no limitation of physical activity |
| Class II | Slight limitation of physical activity; patient comfortable at rest |
| Class III | Marked limitation of physical activity; patient comfortable at rest |
| Class IV | Inability to carry out physical activity without discomfort; symptoms of cardiac insufficiency or chest pain at rest |
Modified from Hunt SA et al: ACC, AHA, 2005, Guideline update for the diagnosis and management of chronic heart failure in the adult: a report of the American College of Cardiology/American Heart Association Task Force, J Am Coll Cardiol 46:e1, 2005.
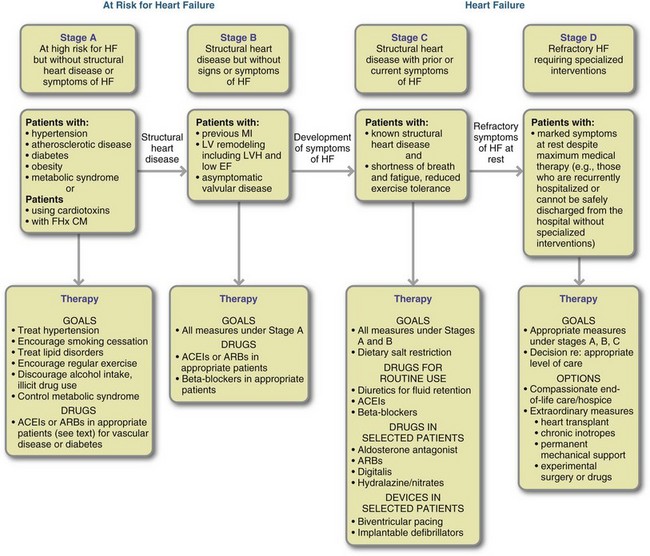
FIGURE 34-11 Stages of heart failure and recommended therapy by stage. ACEI, Angiotensin-converting enzyme inhibitor; ARB, angiotensin receptor blocker; CM, cardiomyopathy; EF, ejection fraction; FHx, family history; HF, heart failure; IV, intravenous; MI, myocardial infarction; LV, left ventricular; LVH, left ventricular hypertrophy. (Source: Hunt SA et al: ACC/AHA 2005 guideline update for the diagnosis and management of chronic heart failure in the adult: a report of the American College of Cardiology/American Heart Association Task Force, J Am Coll Cardiol 46: el, 2005.)
The progressive insult alters the function and shape of the left ventricle such that it hypertrophies in an effort to sustain blood flow, a process known as cardiac remodeling. Symptoms do not usually arise until months or years after cardiac remodeling begins. Many compensatory mechanisms from the SNS, RAS, and cytokine system are activated to restore homeostatic function. Proinflammatory cytokines, such as TNF-αα, IL-1, and IL-6 are increased in blood and the myocardium and have been found to regulate cardiac remodeling.
Another substance, B-natriuretic peptide (BNP), is secreted by the ventricles in response to pressure and is predictive of the severity of HF and mortality at any level of BMI (Horwich et al., 2006). Patients are asymptomatic during these first two stages. BNP is often highly elevated in patients with HF (greater than 100 pg/mL is abnormal, and some patients have levels over 3000 pg/mL). Nesiritide (recombinant human BNP) provides symptomatic and hemodynamic improvement in acute decompensated HF and is now standard procedure (Arora et al., 2006).
Eventually overuse of compensatory systems leads to further ventricle damage, remodeling, and worsening of symptoms (stage C). HF patients have elevated levels of norepinephrine, angiotensin II, aldosterone, endothelin, and vasopressin; all of these are neurohormonal factors that increase the hemodynamic stress on the ventricle by causing sodium retention and peripheral vasoconstriction. These neurohormones and the proinflammatory cytokines contribute to disease progression; hence current studies focus on inhibition of these undesirable pathways and promotion of desirable ones.
For the final stages of HF, there is a subjective scale used to classify symptoms based on the degree of limitation in daily activities (Table 34-8). The severity of symptoms in this classification system is weakly related to the severity of left ventricular dysfunction; therefore treatment encompasses both improving functional capacity and lessening progression of the underlying disease.
TABLE 34-8
Skeletal Muscle Changes in Heart Failure
| Functio laesa | Weakness |
| Fatigability | |
| Structural | Loss of muscle mass |
| Atrophy, fibrosis, no ≠ apoptosis | |
| Fiber type switch type I–type llb | |
| Loss of mitochondria | |
| Endothelial damage | |
| Blood flow | Capillary density ↓? |
| Vasodilation | |
| Peak leg blood flow ↓ | |
| Metabolism | Proteolysis |
| Oxidative metabolism ↓ Acidosis glycolysis ≠ | |
| Inflammation | Cytokine and oxidative markers |
| Neuroendocrine | GH, IGF-1, epinephrine, norepinephrine, cortisol |
| Inactivity | TNF-α ≠≠ |
| Genetic factors | Myostatin, IGF |
GH, Growth hormone; IGF, insulin-like growth factor; TNF-α, tumor necrosis factor-α.
From Strassburg S et al: Muscle wasting in cardiac cachexia, Int J Biochem Cell Biol 37:1938, 2005.
In HF the heart can compensate for poor cardiac output by (1) increasing the force of contraction, (2) increasing in size, (3) pumping more often, and (4) stimulating the kidneys to conserve sodium and water. For a time this compensation maintains near-normal circulation, but eventually the heart can no longer maintain a normal output (decompensation). Advanced symptoms can develop in weeks or months, and sudden death can occur at any time.
Three symptoms—fatigue, shortness of breath, and fluid retention—are the hallmarks of HF. Shortness of breath on exertion, or effort intolerance, is the earliest symptom. This shortness of breath gets worse and occurs at rest (orthopnea) or at night (paroxysmal nocturnal dyspnea). Fluid retention can manifest as pulmonary congestion or peripheral edema. Evidence of hypoperfusion includes cool forearms and legs, sleepiness, declining serum sodium level caused by fluid overload and worsening renal function.
Decreased cranial blood supply can lead to mental confusion, memory loss, anxiety, insomnia, syncope (loss of oxygen to the brain causing brief loss of consciousness), and headache. The latter symptoms are more common in older patients and often are the only symptoms; this can lead to a delay in diagnosis. Often the first symptom in older adults is a dry cough with generalized weakness and anorexia.
Cardiac cachexia is the end result of HF in 10% to 15% of patients. It is defined as involuntary weight loss of at least 6% of nonedematous body weight during a 6-month period (Springer et al., 2006). Unlike normal starvation, which is characterized by adipose tissue loss, this cachexia is characterized by a significant loss of lean body mass. This decrease in lean body mass further exacerbates HF because of the loss of cardiac muscle and the development of a heart that is soft and flabby. In addition, there are structural, circulatory, metabolic, inflammatory, and neuroendocrine changes in the skeletal muscle of patients with HF (Delano and Moldawer, 2006). Differences between younger and older patients are listed in Table 34-9.
TABLE 34-9
Heart Failure in Middle Age versus Older Adulthood
| Middle Age | Older Adulthood | |
| Prevalence | <1% | ≈10% |
| Sex | Men > Women | Women > Men |
| Cause | CAD | Hypertension |
| Clinical features | Typical | Atypical |
| LVEF | Reduced | Normal |
| Comorbidities | Few | Multiple |
| RCTs | Many | Few |
| Therapy | Evidence-based | Empiric |
| Physician treating HF | Cardiologist | Primary care |
CAD, Coronary artery disease; HF, heart failure; LVEF, left ventricular ejection fraction; RCT, randomized clinical trial.
From Rich MW: Office management of heart failure in the elderly, AM J Med 118:342, 2005.
Cardiac cachexia is a serious complication of HF with a poor prognosis and high mortality rate. Symptoms that reflect inadequate blood supply to the abdominal organs include anorexia, nausea, a feeling of fullness, constipation, abdominal pain, malabsorption, hepatomegaly, and liver tenderness. All of these contribute to the high prevalence of malnutrition observed in hospitalized patients with HF. Lack of blood flow to the gut leads to loss of bowel integrity; bacteria and other endotoxins may enter the bloodstream and cause cytokine activation. Proinflammatory cytokines such as TNF-α and adiponectin are highest in patients with cardiac cachexia. An increased level of TNF-α is associated with a lower BMI, smaller skinfold measurements, and decreased plasma total protein levels, indicative of a catabolic state.
Adiponectin levels are high in HF and are a marker for wasting and a predictor of mortality. As with TNF-α, adiponectin levels are also inversely correlated with BMI. Treatments for muscle wasting are being explored (Springer et al., 2006).
Risk Factors
The Framingham Study (see Focus On: Framingham Heart Study) showed the risk factors for HF were hypertension, diabetes, CHD, and left ventricular hypertrophy (LVH) (enlargement of the left ventricle of the heart). Antecedent hypertension is present in 75% of HF cases (AHA, 2010). Individuals who have diabetes mellitus and ischemic heart disease more frequently develop HF compared with patients without diabetes (Rosano et al., 2006). Diabetes is an especially strong risk factor for HF in women. The prevalence of both hypertension and diabetes increases with age, making the elderly particularly vulnerable to HF. Another large cohort study of older adults (70 to 79 years) showed that waist circumference and percentage of body fat were the strongest predictors of who would develop HF (Nicklas et al., 2006). Numerous changes in cardiovascular structure and function also place the elderly at high risk for developing HF (Box 34-8).
Prevention
Because long-term survival rates for persons with HF are low, prevention is critical. HF is categorized into four stages ranging from persons with risk factors (stage A—primary prevention) to persons with advanced HF (stage D—severe disease). For stages A and B the aggressive treatment of underlying risk factors and diseases such as dyslipidemia, hypertension, and diabetes is critical to prevent structural damage to the myocardium and the appearance of HF symptoms. Such prevention has been very effective. Even patients who experience an MI can reduce the risk of HF with antihypertensive therapy.
For stages C and D, secondary prevention strategies to prevent further cardiac dysfunction are warranted. These strategies include the use of ACE inhibitors (first line of therapy), angiotensin receptor blockers, aldosterone blockers, β-blockers, and digoxin. Early detection, correction of asymptomatic left ventricular dysfunction, and aggressive management of risk factors are needed to lower the incidence and mortality of HF.
New research is studying the effects of cardiotonic steroids, including marinobufagenin, a group of hormones found in plasma and urine of patients with HF, MI, and chronic renal failure (Tian et al., 2010). If there are preventive measures, studies will identify them.
Medical Management
Therapy recommendations correspond to the stage of HF. For patients at high risk of developing HF (stage A), treatment of the underlying conditions (hypertension, dyslipidemia, thyroid disorders, arrhythmias), avoidance of high-risk behaviors (tobacco, excessive alcohol, illicit drug use), and lifestyle changes (weight reduction, exercise, reduction of sodium intake, heart-healthy diet) are recommended. All these recommendations are carried through the other stages. In addition, an implantable defibrillator, which shocks the heart when it stops, can be placed in patients at risk of sudden death. Pharmacologic treatment of HF is the hallmark of therapy with progressive stages. The last stage also includes surgically implanted ventricular-assist devices, heart transplantation, and continual intravenous therapy.
The short-term goals for the treatment of HF are to relieve symptoms, improve the quality of life, and reduce depression if it is present. The long-term goal of treatment is to prolong life by lessening, stopping, or reversing left ventricular dysfunction. Medical management is tailored to clinical and hemodynamic profiles with evidence of hypoperfusion and congestion. In some cases surgical procedures are needed to alleviate the HF caused by valvular disease; medical management is limited in these instances.
Initial management of HF includes a restricted sodium diet (less than 2000 mg daily) and regular activity, as symptoms permit. Bed rest is no longer recommended except for those with acute failure. The heart becomes deconditioned with less exercise, whereas with regular exercise capacity can be increased. Standard fluid restrictions are to limit total fluid intake to 2 L (2000 mL) daily. When patients are severely decompensated, a more restrictive fluid intake (1000 to 1500 mL daily) may be warranted for adequate diuresis. A sodium-restricted diet should be maintained despite low-sodium blood levels because in this case the sodium has shifted from the blood to the tissues. Serum sodium appears low in a patient who is fluid overloaded because of dilution; diuresis improves the levels by decreasing the amount of water in the vascular space.
An ACE inhibitor is the first line of pharmacologic treatment for HF. As the stages progress, a β-blocker or angiotensin receptor blocker may be added. In Stages C and D selected patients may also take a diuretic, aldosterone antagonists, digitalis, and vasodilators (e.g., hydralazine). Basically these medications reduce excess fluid, dilate blood vessels, and increase the strength of the heart’s contraction. Several of these medications have neurohormonal benefits along with their primary mechanism of action. For example, ACE inhibitors (e.g., captopril, enalapril) not only inhibit the RAS (see Chapter 36) but also improve symptoms, quality of life, exercise tolerance, and survival. Similarly, spironolactone has both diuretic and aldosterone-blocking functions that result in reduced morbidity and mortality in patients. Most of these medications can affect nutrition status (see Chapter 9 and Appendix 31).
Medical Nutrition Therapy
The RD provides MNT, which includes assessment, establishing a nutrition diagnosis, and interventions (education, counseling). As part of a multidisciplinary team (physician, pharmacist, psychologist, nurse, and social worker), the RD positively affects patient outcomes. Reduced readmission to the hospital, fewer days in the hospital, improved compliance with restricted sodium and fluid intakes, and improved quality of life scores are the goals in HF patients.
Nutrition screening for HF in older adults can help prevent disease progression and improve disease management, overall health, and quality-of-life outcomes. The first step in screening is determination of body weight. Altered fluid balance complicates assessment of body weight in the patient with HF. Weights should be taken before eating and after voiding at the same time each day. A dry weight (weight without edema) should be determined on the scale at home. Patients should record daily weights and advise their care providers if weight gain exceeds more than 1 lb a day for patients with severe HF, more than 2 lb a day for patients with moderate HF, and more than 3 to 5 pounds with mild HF. Restricting sodium and fluids along with diuretic therapy may restore fluid balance and prevent full-blown HF.
Dietary assessments in HF patients reveal that more than half have malnutrition, usually related to the cardiac cachexia mentioned earlier. Negative energy balance and negative nitrogen balances can be noted. In overweight patients caloric reduction must be carefully monitored to avoid excessive and rapid body protein catabolism. Nutrition education to promote behavior change is a critical component of MNT. The benefits of MNT should be communicated to patients.
The total diet must be addressed in patients with HF because underlying risk factors are often present; dietary changes to modify these risk factors are an important component of MNT. For dyslipidemia or atherosclerosis, a heart-healthy diet low in SFAs, trans-fatty acids, and cholesterol and high in fiber, whole grains, fruits, and vegetables is recommended. For persons with hypertension, the DASH diet is recommended. Both of these dietary patterns emphasize lower-sodium foods and higher intake of potassium. Total energy expenditure is higher in HF patients because of the catabolic state, adequate protein and energy should be provided.
Salt Restriction
Edema in patients with decompensated HF results from impaired cardiac function. Inadequate blood flow to the kidneys leads to aldosterone and vasopressin (antidiuretic hormone) secretion. Both these hormones act to conserve fluid, thus trying to restore blood flow. Aldosterone promotes sodium resorption, and vasopressin promotes water conservation in the distal tubules of the nephron. Sodium and fluid thus accumulate in the tissues. Even asymptomatic patients with mild HF and no edema can retain sodium and water if consuming a high-salt diet.
The degree of restriction depends on the individual. For the healthy elderly population (older than 71 years), the AI is 1200 mg (50 mmol)/day. Recommendations for HF patients vary between 1200 and 2400 mg/day. For patients taking large doses of lasix (80 mg/day), a sodium intake of less than 2 g/day is recommended to optimize the effects of the diuretic. Severe restrictions (500 mg/day) are unpalatable and nutritionally inadequate. See Focus On: Sodium and Salt Measurement Equivalents.
Focus On
Sodium and Salt Measurement Equivalents
Sodium chloride is approximately 40% (39.3%) sodium and 60% chloride. To convert a specified weight of sodium chloride to its sodium equivalent, multiply the weight by 0.393. Sodium is also measured in milliequivalents (mEq). To convert milligrams of sodium to mEq, divide by the atomic weight of 23. To convert sodium to sodium chloride (salt), multiply by 2.54. Millimoles (mmol) and milliequivalents (mEq) of sodium are the same. For example:
Adherence to sodium restrictions can be problematic for many individuals, and individualized instruction is recommended. Ethnic differences in sodium consumption must be considered. Some cultures have traditional diets that are very high in sodium such as Kosher and Asian diets. In some cases regional cooking, like in some areas in the southern United States, depends heavily on salt.
Positive outcomes (i.e., decreased urinary sodium excretion, less fatigue, less frequent edema) have been observed in HF patients receiving MNT. The type of sodium restriction prescribed should be the least restrictive diet that will still achieve the desired results. The first step is to minimize or eliminate the use of table salt and high-sodium foods (Box 34-9) (see Appendix 37 for further explanation of the sodium-restricted diet).
Poor adherence to low-sodium diets occurs in part as a result of lack of knowledge about sodium and lower-sodium food choices by the patient, and perception that the diet interferes with the social aspects of eating. Lack of cooking skills or adequate cooking facilities is another obstacle because it leads patients to eat premade foods that tend to be high in salt. Memory loss, severe fatigue, and economic issues are all challenges to following a low-sodium diet. In addition, food labels, although informative, may be hard for many patients or their caregivers to comprehend (Box 34-10).
Alcohol
In excess, alcohol contributes to fluid intake and raises blood pressure. Many cardiologists recommend avoiding alcohol. Chronic alcohol ingestion may lead to cardiomyopathy and HF (Li and Ren, 2006). Although heavy drinking should be discouraged, moderate drinking may lower the risk of HF through beneficial effects of alcohol on coronary artery disease. Quantity, drinking patterns, and genetic factors influence the relationship between alcohol consumption and HF (Djousse and Gaziano, 2008). If alcohol is consumed, intake should not exceed one drink per day for women and two drinks per day for men. A drink is equivalent to 1 oz of alcohol (1 oz of distilled liquor), 5 oz of wine, or 12 oz of beer.
Caffeine
Until now caffeine has been considered detrimental to patients with HF because it contributes to irregular heartbeats. However, a study in the Netherlands suggests that moderate intake of either tea or coffee reduces CHD risk; tea actually reduces CHD deaths (deKonig Gans, 2010). Researchers in the United States followed 130,054 men and women and found that those who reported drinking four or more cups of coffee each day had an 18% lower risk of hospitalization for heart rhythm disturbances. Those who reported drinking one to three cups each day had a 7% reduction in risk (Klatsky, 2010). The antioxidant effects of coffee and tea may be beneficial.
Calcium
Patients with HF are at increased risk of developing osteoporosis because of low activity levels, impaired renal function, and prescription drugs that alter calcium metabolism (Zittermann et al., 2006). Cachectic HF patients have lower bone mineral density and lower calcium levels than HF patients without cachexia (Anker, 2006). Caution must be used with calcium supplements because they may aggravate cardiac arrhythmias. Before transplant, most HF patients only have subtle changes in bone.
Coenzyme Q10
Levels of coenzyme Q10 (CoQ10) are often lower in HF patients; it is postulated that repletion can prevent oxidative stress and further myocardial damage (Sanders, 2006). However, in two randomized control trials in patients with class III and IV symptoms, CoQ10 had limited benefit (Levy and Kohlhaas, 2006). Routine supplementation is not recommended by the AHA at this time. However, HF is known to be associated with key deficiencies of micronutrients that are required for cardiac function and further studies are needed (Soukoulis, 2009). It should be noted that patients on statins (HMG-CoA reductase inhibitors) may have a different reason to consider supplementation. HMG-CoA reductase inhibitors are a class of cholesterol lowering drugs that are known to interfere with synthesis of CoQ10 (see Chapter 9).
D-Ribose
D-ribose is a component of ATP for cellular metabolism and energy production. Myocardial ischemia lowers cellular energy levels, integrity, and function. The failing heart is energy-starved. D-ribose is being tested to correct this deficient cellular energy as a naturally occurring carbohydrate (Shecterle et al., 2010).
Energy
The energy needs of patients with HF depend on their current dry weight, activity restrictions, and the severity of the HF. Overweight patients with limited activity must achieve and maintain an appropriate weight that will not stress the myocardium. For the obese patient, hypocaloric diets (1000 to 1200 kcal daily) reduce the stress on the heart and facilitate weight reduction. However, the nutrition status of the obese patient must be assessed to ensure that the patient is not malnourished. In patients with severe HF, energy needs are increased by 30% to 50% more than basal level as a result of the increased energy expenditure of the heart and lungs; 31 to 35 kcal/kg of body weight is often used as the starting point for determining caloric requirements. Patients with cardiac cachexia may require further increases in energy to 1.6 to 1.8 times the resting energy expenditure for nutritional repletion.
Fats
Fish consumption and fish oils rich in ω-3 fatty acids can lower elevated triglyceride levels, prevent atrial fibrillation, and perhaps even reduce mortality rates in HF patients (Roth and Harris, 2010). Intake of at least 1 g daily of ω-3 fatty acids from either oily fish or fish-oil supplements can be safely recommended. Interestingly, recent evidence suggests that high saturated fat feeding in mild to moderate HF preserves contractile function and prevents the switch from fatty acid to glucose metabolism, thus serving a cardioprotective role (Chess et al., 2009; Christopher et al., 2010).
Feeding Strategies
Patients with HF often tolerate small, frequent feedings better than larger, infrequent meals because the latter are more tiring to consume, can contribute to abdominal distention, and markedly increase oxygen consumption. All these factors tax the already stressed heart. Caloric supplements can help to increase energy intake; however, this intervention may not reverse this form of malnutrition (Anker et al., 2006).
Folate, Vitamin B6, and Vitamin B12
High dietary intakes of folate and vitamin B6 have been associated with reduced risk of mortality from HF and stroke in some populations (Cui et al., 2010). Elevated tHcy levels should be lowered when possible.
Magnesium
Magnesium deficiency is common in patients with HF as a result of poor dietary intake and the use of diuretics, including furosemide. As with potassium, the diuretics used to treat HF increase magnesium excretion. Magnesium deficiency aggravates changes in electrolyte concentration by causing a positive sodium and negative potassium balance. Because deficient magnesium status is associated with poorer prognosis, blood magnesium levels should be measured in HF patients and treated accordingly. Magnesium supplementation (800 mg/day) produces small improvements in arterial compliance (Fuentes et al., 2006). Poor dietary intake of magnesium has been associated with elevated CRP, a product of inflammation. Hypermagnesemia may be found in some cases of renal failure, HF, and high doses of furosemide.
Thiamin
Patients with HF are at risk for thiamin deficiency because of poor food intake; use of loop diuretics, which increases excretion; and advanced age. Thiamin deficiency is diagnosed using erythrocyte thiamin pyrophosphate levels in 33% of HF patients (Hanninen et al., 2006). Loop diuretics can deplete body thiamin and cause metabolic acidosis. Thiamin status should be assessed in HF patients on loop diuretics, and appropriate supplementation recommended if necessary. Thiamin supplementation (e.g., 200 mg/day) can improve left ventricular ejection fraction (fraction of blood pumped out of the ventricles with each heart beat) and symptoms.
Vitamin D
Patients with a polymorphism of the vitamin D receptor gene have higher rates of bone loss than HF patients without this genotype. Vitamin D may improve inflammation in HF patients (Vieth and Kimball, 2006). In a double-blind, randomized, placebo-controlled trial, supplementation with vitamin D (50 mcg or 2000 international units of vitamin D3 per day) for 9 months increased the antiinflammatory cytokine IL-10 and decreased the proinflammatory factors in HF patients (Schleithoff et al., 2006). As a steroid hormone, vitamin D regulates gene expression and inversely regulates renin secretion (Meems et al., 2010). However, it remains unclear if vitamin D supplementation is truly needed in HF patients.
Cardiac Transplantation
Cardiomyopathies represent a heterogeneous group of diseases that often lead to progressive HF; types include dilated cardiomyopathy, hypertrophic cardiomyopathy, restrictive cardiomyopathy, and arrhythmogenic right ventricular cardiomyopathy (Wexler et al., 2009). Cardiac transplantation is the only cure for refractory, end-stage HF. Because the number of donor hearts is limited, careful selection of recipients with consideration of the likelihood for adherence to lifelong therapeutic regimen and their quality of life is imperative (D’Amico, 2005). Nutrition support before and after transplantation is crucial to decrease morbidity and mortality. Thus the nutrition care of the heart transplant patient can be divided into three phases: pretransplant, immediate posttransplant, and long-term posttransplant.
Pretransplant Medical Nutrition Therapy
A comprehensive nutrition assessment of the pretransplant patient should include a history, physical and anthropometric assessment, and biochemical testing. Recommended lifestyle changes prior to transplantation include restricting alcohol consumption, losing weight, exercising, quitting smoking, and eating a low-sodium diet (Wexler et al., 2010). Extremes in body weight (<80% or >140% of ideal body weight) increase the patient’s risk for infection, diabetes, morbidity, and higher mortality. Pretransplant comorbidities such as hyperlipidemia and hypertension also reduce survival rates. If oral intake is inadequate, an enteral feeding should be tailored to the nutritional and comorbid conditions of the patient.
Immediate Posttransplant Nutrition Support
The nutritional goals in the acute posttransplant patient are to (1) provide adequate protein and calories to treat catabolism and promote healing, (2) monitor and correct electrolyte abnormalities, and (3) achieve optimal blood glucose control (Hasse, 2001). In the immediate posttransplant period nutrient needs are increased, as is the case after any major surgery. Protein needs are increased because of steroid-induced catabolism, surgical stress, anabolism, and wound healing.
Patients progress from clear liquids to a soft diet given in small, frequent feedings. Enteral feeding may be appropriate in the short term, especially if complications arise. Nutrient intake is often maintained by using liquid supplements and foods of high caloric density, especially in patients with poor appetite. Weight gain to an ideal weight is the nutritional goal for patients who were cachectic before transplant. The increase in cardiac function helps to halt the presurgical cachectic state. Hyperglycemia can be exacerbated by the stress of the surgery and the immunosuppressive drug regimen. Dietary adjustments can be made to aid in glucose control (see Table 34-10).
TABLE 34-10
Short-Term Posttransplant Nutrient Recommendations
| Nutrient | Recommendations | Comment |
| Protein | 1.5-2.0 g/kg | Protein catabolism is increased due to because of surgery and corticosteroids. |
| Protein is required for wound healing; infection prevention; and losses from drains, wounds, etc. | ||
| Calories | 130%-150% of REE | Upper range for underweight patients; lower range for overweight patients. |
| Carbohydrate | 50%-70% of nonprotein calories | Medications may cause hypoglycemia; treat with sliding-scale insulin. |
| Lipid | 30%-50% of nonprotein calories | Higher range is recommended only when hyperglycemia is severe and not under control with insulin alone. |
| Fluid | 1 mL/calorie | Monitor output from urine, drains, etc. |
| Sodium | 2-4 g/day | Restrict if edema is present. |
| Phosphorus, magnesium, bicarbonate | Individualize | Monitor biochemical parameters. |
REE, Resting energy expenditure.
From Hasse JM: Nutrition assessment and support of organ transplant recipients, JPEN 25(3):120, 2001.
Long-Term Posttransplant Nutrition Support
Comorbid conditions that often occur after transplantation include hypertension, excessive weight gain, hyperlipidemia, osteoporosis, and infection. Hypertension is managed by diet, exercise, and medications. Minimizing excessive weight gain is important because patients who become obese after transplantation are at higher risk for rejection and lower rates of survival.
Increases in total LDL cholesterol and triglycerides are a consequence of immunosuppressive drug therapy and increase the risk of HF after transplantation Along with a heart-healthy diet, patients also need a lipid-lowering drug regimen to normalize blood lipids. Statins are recommended in the early and long-term postoperative periods. Because of their LDL-lowering effect, stanols or sterols may be helpful to reduce statin dosages (Goldberg et al., 2006).
Before transplantation, patients are likely to have osteopenia because of their lack of activity and cardiac cachexia. After transplantation, patients are susceptible to steroid-induced osteoporosis. Patients require optimal calcium and vitamin D intake to slow bone loss; weight-bearing exercise and antiresorptive drug therapy are often necessary. Infection must be avoided because of the necessity of lifelong use of immunosuppressive drugs. Food safety should be discussed.
 Clinical Scenario
Tom is a 55-year-old single man with hypertension (blood pressure 145/92), high low-density lipoprotein cholesterol (241) and low high-density lipoprotein cholesterol (38). He reports that he often eats in his car so he frequents fast-food restaurants. He works long hours and, other than gardening on the weekends, he does not exercise. He is 5′10″ and 220 lbs. His breakfast is usually a cheese-egg biscuit, white toast with butter, bacon, and coffee without milk or cream. Lunch is a fried luncheon meat sandwich with mayonnaise, potato chips, and a piece of fruit pie with ice cream. Dinner is often fried chicken, mashed potatoes with gravy, creamed vegetables, and some type of whipped cream dessert.
Using the following list, what are Tom’s nutritional diagnoses? Which should be the top priority?
References
American Diabetes Association. National Diabetes Factsheet. Alexandria, VA: American Diabetes Association; 2007.
American Dietetic Association. Hypertension, ADA Evidence Analysis Library. Chicago, IL: ADA; 2009.
American Heart Association. Heart Disease and Stroke Statistics: 2010 Update At-A-Glance. Dallas, Texas: American Heart Association; 2010.
American Heart Association Statistics Committee and Stroke Statistics Committee. AHA Statistics Update. Heart Disease and Stroke Statistics—2007 Update. Circulation. 2007;115:e69–171.
Anderson, JW, et al. Health benefits of fiber. Nutrition Reviews. 2009;67:188.
Anker, SD, et al. ESPEN guidelines on enteral nutrition: cardiology and pulmonology evidence-based recommendations. Clin Nutr. 2006;25:311.
Appel, LJ, et al. Dietary approaches to prevent and treat hypertension: a scientific statement from The American Heart Association. Hypertension. 2006;47:296.
Arora, RR, et al. Short- and long-term mortality with nesiritide. Am Heart J. 2006;152:1084.
Badimon, L, et al. Cell biology and lipoproteins in atherosclerosis. Curr Mol Med. 2006;6:439.
Bartolucci, AA, Howard, G. Meta-analysis of data from the six primary prevention trials of cardiovascular events using aspirin. Am J Cardiol. 2006;98:746.
Barter, P, Rye, K. Homocysteine and cardiovascular disease. Circulation Res. 2006;99:565.
Basu, A, et al. Dietary factors that promote or retard inflammation. Arterioscler Thromb Vasc Biol. 2006;26:995.
Behavioral Risk Factor Surveillance System. Prevalence of heart disease—United States, 2005, CDC. MMWR. 2007;56(6):113.
Berg, AH, Scherer, PE. Adipose tissue, inflammation and cardiovascular disease. Circ Res. 2006;96:939.
Bloomer, RJ, et al. Effect of a 21 day Daniel Fast on metabolic and cardiovascular disease risk factors in men and women. Lipids Health Dis. 2010;9:94.
Blumenthal, JA, et al. Effects of the DASH diet alone and in combination with exercise and weight loss on blood pressure and cardiovascular biomarkers in men and women with high blood pressure: the ENCORE study. Arch Int Med. 2010:126.
Boden, WE, et al. Optimal medical therapy with or without PCI for stable coronary disease. N Engl J Med. 2007;356:1503.
Brindle, P, et al. Accuracy and impact of risk assessment in the primary prevention of cardiovascular disease: a systematic review. Heart. 2006;92:1752.
Brook, RD. Obesity, weight loss, and vascular function. Endocrine. 2006;29:21.
Calhoun, DA, et al. Resistant hypertension: diagnosis, evaluation, and treatment: a scientific statement from the American Heart Association Professional Education Committee of the Council for High Blood Pressure Research. Circulation. 2008;117:e510.
Carter, SJ, et al. Relationship between Mediterranean diet score and atherothrombotic risk: findings from the Third National Health and Nutrition Examination Survey (NHANES-III), 1988-1994. Atherosclerosis. 2010;4:630.
Chess, DJ, et al. A high-fat diet increases adiposity but maintains mitochondrial oxidative enzymes without affecting development of heart failure with pressure overload. Am J Physiol Heart Circ Physiol. 2009;297:1585.
Chiuve, SE, et al. Healthy lifestyle factors in the primary prevention of coronary heart disease among men: benefits among users and nonusers of lipid-lowering and antihypertensive medications. Circulation. 2006;114:160.
Christopher, BA, et al. Myocardial insulin resistance induced by high fat feeding in heart failure is associated with preserved contractile function. Am J Physiol Heart Circ Physiol. 2010;299:H1917.
Chobanian, AV, et al. The Seventh Report of the Joint National Committee on the Prevention, Evaluation and Treatment of High Blood Pressure: the JNC 7 report. JAMA. 2003;289:2560.
Cicero, AF, et al. ω-3 polyunsaturated fatty acids: their potential role in blood pressure prevention and management. Curr Vasc Pharmacol. 2009;3:330.
Civeira, F, et al. Guidelines for the diagnosis and management of heterozygous familial hypercholesterolemia. Atherosclerosis. 2004;173:55.
Cook, NR, et al. Long term effects of dietary sodium reduction on cardiovascular disease outcomes: observational follow-up of the trials of hypertension prevention (TOHP). BMJ. 2007;334:885.
Couch, SC, et al. The efficacy of a clinic-based behavioral nutrition intervention emphasizing a DASH-type diet for adolescents with elevated blood pressure. J Pediatr. 2008;152:494.
Cui, R, et al. Dietary folate and vitamin B6 and B12 intake in relation to mortality from cardiovascular diseases: Japan collaborative cohort study. Stroke. 2010;41:1285.
D’Amico, CL. Cardiac transplantation: patient selection in the current era. J Cardiovasc Nurs. 2005;20:S4.
DeKonig Gans, JM, et al. Tea and coffee consumption and cardiovascular morbidity and mortality. Arterioscler Thromb Vasc Biol. 2010;10:1161.
Delano, MJ, Moldawer, L. The origins of cachexia in acute and chronic inflammatory diseases. Nutr Clin Pract. 2006;21:68.
Depres, JP, Lemieux, I. Abdominal obesity and metabolic syndrome. Nature. 2006;444:881.
Djousse, L, Gaziano, JM. Alcohol consumption and heart failure: a systematic review. Curr Atheroscler Rep. 2008;10:117.
Dickinson, HO, et al. Lifestyle interventions to reduce raised blood pressure: a systematic review of randomized, controlled trials. J Hypertens. 2006;24:215.
Dickinson HO, et al: Magnesium supplementation for the management of essential hypertension in adults, Cochrane Database Syst Rev 3:CD004640, 2006b.
Egan, BM, et al. US trends in prevalence, awareness, treatment, and control of hypertension, 1988-2008. JAMA. 2010;303:2043.
Erkkila, AT, Lichtenstein, AH. Fiber and cardiovascular disease risk: how strong is the evidence? J Cardiovasc Nurs. 2006;21:3.
Esposito, K, Giugliano, D. Diet and inflammation: a link to metabolic and cardiovascular diseases. Eur Heart J. 2006;27:15.
Fuentes, J, et al. Acute and chronic oral magnesium supplementation: effects on endothelial function, exercise function, exercise capacity, and quality of life in patients with symptomatic heart failure. Congest Heart Fail. 2006;12:9.
Gebauer, SK, et al. ω-3 fatty acid dietary recommendations and food sources to achieve essentiality and cardiovascular benefits. Am J Clin Nutr. 2006;83:1526s.
Gidding, SS, et al. Implementing the American Heart Association pediatric and adult nutrition guidelines: a scientific statement from the American Heart Association Nutrition Committee of the Council on Nutrition, Physical Activity and Metabolism, Council on Cardiovascular Disease in the Young, Council on Arteriosclerosis, Thrombosis and Vascular Biology, Council on Cardiovascular Nursing, Council on Epidemiology and Prevention, and Council for High Blood Pressure Research. Circulation. 2009;119:1161.
Goldberg, AC, et al. Effect of plant stanol tablets on low-density lipoprotein lowering in patients on statin drugs. Am J Cardiol. 2006;97:376.
Gotoh, K, et al. Apolipoprotein A-IV interacts synergistically with melanocortins to reduce food intake. Am J Physiol Regul Integr Comp Physiol. 2006;290:R202.
Hanninen, SA, et al. The prevalence of thiamin deficiency in hospitalized patients with congestive heart failure. J Am Coll Cardiol. 2006;47:354.
Hasse, J. Nutrition assessment and support of organ transplant recipients. JPEN J Parenter Enteral Nutr. 2001;25:120.
Heinecke, JW. Lipoprotein oxidation in cardiovascular disease: chief culprit or innocent bystanders? J Exp Med. 2006;203:813.
Horwich, TB, et al. B-type natriuretic peptide levels in obese patients with advanced heart failure. J Am Coll Cardiol. 2006;47:85.
Kay, CD, et al. Effects of antioxidant rich foods on vascular reactivity: review of the clinical evidence. Curr Atheroscler Rep. 2006;8:510.
Kalogeropoulos, N, et al. Unsaturated fatty acids are inversely associated and ω-6/ω-3 ratios are positively related to inflammation and coagulation markers in plasma of apparently healthy adults. Clin Chim Acta. 2010;411:584.
Kelly, JH, Sabate, J. Nuts and coronary heart disease: an epidemiological perspective. Br J Nutr. 2006;96:S61.
Khayat, R, et al. Obstructive sleep apnea: the new cardiovascular disease. Part 1: obstructive sleep apnea and the pathogenesis of vascular disease. Heart Failure Reviews. 2009;14:143.
Klatsky AL: Coffee drinking and caffeine associated with reduced risk of hospitalization for heart rhythm disturbances. Presented at AHA 50th Annual Conference on Cardiovascular Disease, Epidemiology and Prevention, 5 March 2010, San Francisco, Calif.
Kris-Etherton, PM, et al. Milk products, dietary patterns and blood pressure management. J Am Coll Nutr. 2009;28:103S.
Levy, HB, Kohlhaas, HK. Considerations for supplementing with coenzyme Q during statin therapy. Ann Pharmacother. 2006;40:290.
Li, Q, Ren, J. Cardiac overexpression of metallothionein attenuates chronic alcohol intake-induced cardiomyocyte contractile dysfunction. Cardiovasc Toxicol. 2006;6:173.
Lichtenstein, AH, et al. Diet and lifestyle recommendations revision 2006: a scientific statement from the American Heart Association Nutrition Committee. Circulation. 2006;114:82.
Liebman, B, Salt: shaving salt, saving lives. Nutrition Action Newsletter April 2010. Accessed 2 July 2010 from. http://www.cspinet.org/nah/articles/salt.html
Lombardi, MP, et al. Molecular genetic testing for familial hypercholesterolemia in the Netherlands: a stepwise screening strategy enhances the mutation detection rate. Genet Test. 2006;10:77.
Luma, GB, Spiotta, RT. Hypertension in children and adolescents. Am Fam Physician. 2006;73:1558.
Marcovina, S, Packard, CJ. Measurement and meaning of apolipoprotein A-I and apolipoprotein B plasma levels. J Intern Med. 2006;259:437.
Masoura, C, et al. Arterial endothelial function and wall thickness in familial hypercholesterolemia and familial combined hyperlipidemia and the effect of statins. A systemic review and meta-analysis. Atherosclerosis. 2011;214:129.
Mathieu, P, et al. The link among inflammation, hypertension and cardiovascular disease. Hypertension. 2009;53:577.
McCollum, M, et al. Prevalence of multiple cardiac risk factors in U.S. adults with diabetes. Curr Med Res Opin. 2006;22:1031.
McGuire, K, et al. Ability of physical activity to predict cardiovascular disease beyond commonly evaluated cardiometabolic risk factors. Am J Cardiol. 2009;104:1522.
Meems, LM, et al. Vitamin D biology in heart failure: molecular mechanisms and systematic review. Curr Drug Targets. 2011;12:29.
Mehta, P, Griendling, K. Angiotensin II signaling: physiological and pathological effects in the cardiovascular system. Am J Physiol Cell Physiol. 2007;292:C82.
Miller, ER, III., et al. The effects of macronutrients on blood pressure and lipids: an overview of the DASH and Omni Heart Trials. Curr Atheroscler Rep. 2006;8:460.
Mitsnefes, MM. Hypertension in children and adolescents. Pediatr Clin North Am. 2006;53:493.
Naghavi, M, et al. From vulnerable plaque to vulnerable patient. Part III: Executive summary of the Screening for Heart Attack Prevention and Education (SHAPE) Task Force Report. Am J Cardiol. 2006;98:2.
National Cholesterol Education. Program (NCEP): Expert Panel on Detection, Evaluation, and Treatment of High Blood Cholesterol in Adults (Adult Treatment Panel III) final report. Circulation. 2002;106:3143.
National Academy of Science, Institute of Medicine. Strategies to reduce sodium intake in the United States. Accessed 2 July from http://www.iom.edu/sodiumstrategies/, 2010.
National Academy of Science, Institute of Medicine. Dietary reference intakes: water, potassium, sodium chloride and sulfate, ed 1. Washington, DC: National Academies Press; 2004.
National Institutes of Health; National Heart, Lung and Blood Institute; National High Blood Pressure Education Program: The 7th Report of the Joint National Committee on Prevention, Detection, and Treatment of High Blood Pressure, NIH Publication 04-5230, August 2004.
Newton-Cheh, C, et al. Genome-wide association study identifies eight loci associated with blood pressure. Nat Genet. 2009;41:666.
Nicklas, B, et al. Abdominal obesity is an independent risk factor for chronic heart failure in older people. J Am Geriatr Soc. 2006;54:413.
Norton, GR, et al. Gene variants of the renin-angiotensin system and hypertension: from a trough of disillusionment to a welcome phase of enlightenment? Clin Sci (Lond). 2010;118:487.
Olufadi, R, Byrne, CD. Effects of VLDL and remnant particles on platelets. Pathophysiol Haemost Thromb. 2006;35:281.
O’Malley, PG. Atherosclerosis imaging of asymptomatic individuals. Arch Intern Med. 2006;166:1065.
Opie, LH, et al. Controversies in stable coronary artery disease. Lancet. 2006;367:69.
Ostchega, Y, et al. Trends in elevated blood pressure among children and adolescents: data from the National Health and Nutrition Examination Survey, 1988-2006. Am J Hyperten. 2009;22:59.
Ottestad, IO, et al. Triglyceride-rich HDL3 from patients with familial hypercholesterolemia are less able to inhibit cytokine release or to promote cholesterol efflux. J Nutr. 2006;136:877.
Pearson, T, et al. Markers of inflammation and cardiovascular disease: application to clinical and public health practice: a statement for healthcare professionals from the Centers for Disease Control and Prevention and the American Heart Association. Circulation. 2003;107:499.
Poirier, P, et al. Obesity and cardiovascular disease: pathophysiology, evaluation, and effect of weight loss. Circulation. 2006;113:898.
Psota, TL, et al. Dietary ω-3 fatty acid intake and cardiovascular risk. Am J Cardiol. 2006;98:3.
Raggi, P. Noninvasive imaging of atherosclerosis among asymptomatic individuals. Arch Intern Med. 2006;166:1068.
Roth, EM, Harris, WS. Fish oil for primary and secondary prevention of coronary heart disease. Curr Atheroscler Rep. 2010;12:66.
Rosano, GM, et al. Metabolic therapy for patients with diabetes mellitus and coronary artery disease. Am J Cardiol. 2006;98:14.
Savoia, C, Schiffrin, E. Vascular inflammation in hypertension and diabetes: molecular mechanisms and therapeutic interventions. Clin Sci (London). 2007;112:375.
Sanders, S, et al. The impact of coenzyme Q10 on systolic function in patients with chronic heart failure. J Card Fail. 2006;12:464.
Shecterle, LM, et al. The patented uses of D-ribose in cardiovascular diseases. Recent Pat Cardiovasc Drug Discov. 2010;5:138.
Schleithoff, SS, et al. Vitamin D supplementation improves cytokine profiles in patients with congestive heart failure: a double-blind, randomized, placebo-controlled trial. Am J Clin Nutr. 2006;83:754.
Scirica, BM, et al. Is C-reactive protein an innocent bystander or proatherogenic culprit. Circulation. 2006;113:2128.
Shankaran, S, et al. Fetal origin of childhood disease: intrauterine growth restriction in term infants and risk for hypertension at 6 years of age. Arch Pediatr Adolesc Med. 2006;160:977.
Sontia, B, Touyz, RM. A role of magnesium in hypertension. Arch Bioch Biophys. 2007;458:33.
Soukoulis, V, et al. Micronutrient deficiencies an unmet need in heart failure. J Am Coll Cardiol. 2009;54:1660.
Springer, J, et al. Prognosis and therapy approaches of cardiac cachexia. Curr Opin Cardiol. 2006;3:229.
Tedgui, A, Mallat, Z. Cytokines in atherosclerosis: pathogenic and regulatory pathways. Physiol Rev. 2006;86:515.
Thom, T, et al. Heart disease and stroke statistics—2006 update from the American Heart Association Statistics Committee. Circulation. 2006;113:e85.
Thompson, DR, et al. Childhood overweight and cardiovascular disease risk factors: the National Heart, Lung and Blood Institute Growth and Health Study. J Pediatr. 2007;150:18.
Tian, J, et al. Renal ischemia regulates marinobufagenin release in humans. Hypertension. 2010;56:914.
Towfighi, A, et al. Pronounced association of elevated serum homocysteine with stroke in subgroups of individuals: a nationwide study. J Neurol Sci. 2010;298:153.
US Department of Agriculture, United States Department of Health and Human Services. Dietary Guidelines for Americans. Accessed 3 March 2010 from www.healthierus.gov/dietaryguidelines, 2005.
Vieth, R, Kimball, S. Vitamin D in congestive heart failure. Am J Clin Nutr. 2006;83:731.
Walldius, G, Jungner, I. The apoB/apoA-I ratio: a strong, new risk factor for cardiovascular diseases and a target for lipid-lowering therapy—a review of the evidence. J Intern Med. 2006;259:493.
Wang, L, et al. Blood pressure response to calcium supplementation: a meta-analysis of randomized controlled trials. J Hum Hypertension. 2008;20:571.
Wexler, RK, et al. Cardiomyopathy: an overview. Am Fam Physician. 2009;79:778.
Williams, IL, et al. Endothelial function and weight loss in obese humans. Obes Surg. 2005;15:1055.
Zittermann, A, et al. Markers of bone metabolism in congestive heart failure. Clin Chim Acta. 2006;366:27.