Medical Nutrition Therapy for Diabetes Mellitus and Hypoglycemia of Nondiabetic Origin
Diabetes mellitus is a group of diseases characterized by high blood glucose concentrations resulting from defects in insulin secretion, insulin action, or both. Insulin is a hormone produced by the β-cells of the pancreas that is necessary for the use or storage of body fuels (carbohydrate, protein, and fat). Persons with diabetes do not produce adequate insulin; with insulin deficiency, hyperglycemia (elevated blood glucose) occurs.
Diabetes mellitus contributes to a considerable increase in morbidity and mortality rates, which can be reduced by early diagnosis and treatment. Direct medical expenditures such as inpatient care, outpatient services, and nursing home care total are astronomical and indirect costs such as disability, work loss, and premature mortality are equally high. Average medical expenditures among people with diabetes is double that of people who do not have diabetes. Thus providing medical nutrition therapy (MNT) for prevention and treatment of diabetes has tremendous potential to reduce these costs. Fortunately, people with diabetes can take steps to control the disease and lower the risk of complications and premature death.
Incidence and Prevalence
In 2007 total prevalence of diabetes in the United States for all ages was 23.6 million people, or 7.8% of the population. Of these, 17.9 million are diagnosed and 5.7 million undiagnosed. In 2007 1.6 million new cases of diabetes were diagnosed in people age 20 years or older (Centers for Disease Control and Prevention [CDC], 2007).
Much of the increase is because type 2 diabetes mellitus (T2DM) is no longer a disease that affects mainly older adults. Between 1990 and 1998, the prevalence of diabetes increased by 76% among people in their 30s. Among youth, the prevalence of T2DM also increased dramatically in recent decades.
The prevalence of T2DM is highest in ethnic groups in the United States. Diabetes has been diagnosed, in people aged 20 years or older, in 14.2% of American Indians and Alaska Natives, 11.8% of non-Hispanic blacks, 10.4% of Hispanics, and 7.5% of Asian Americans. Among Hispanics, rates were 12.6% for Puerto Ricans, 11.9% for Mexican Americans, and 8.2% for Cubans (CDC, 2007). In addition, another 57 million people (25% of adults 20 years or older and 35% of adults 60 years or older) have prediabetes, which includes impaired glucose tolerance (IGT) (2-hour postchallenge glucose of 140-199 mg/dL) and impaired fasting glucose (IFG) (fasting plasma glucose [FPG] 100-25 mg/dL) (CDC, 2007). Persons with prediabetes are at high risk for conversion to T2DM and cardiovascular disease (CVD) if lifestyle prevention strategies are not implemented.
Categories of Glucose Intolerance
Assigning a type of diabetes to an individual often depends on the circumstances present at the time of diagnosis, and many individuals do not easily fit into a single category. Thus it is less important to label the particular type of diabetes than it is to understand the pathogenesis of the hyperglycemia and to treat it effectively (American Diabetes Association [ADbA], 2011a). What is clear is the need to intervene early with lifestyle interventions, beginning with prediabetes and continuing through the disease process. Categories of glucose intolerance are listed in Table 31-1.
TABLE 31-1
Types of Diabetes and Prediabetes
| Classification | Distinguishing Characteristics |
| Type 1 diabetes | Characterized by β-cell destruction, usually leading to absolute insulin deficiency; immune-mediated diabetes (resulting from cellular-mediated autoimmune destruction) and idiopathic diabetes (no known causes) are two forms. Affected persons are usually children and young adults, although it can occur at any age, and depend on exogenous insulin to prevent ketoacidosis and death. Immune-mediated type 1 diabetes accounts for 5% to 10% of all diagnosed cases of diabetes. |
| Type 2 diabetes | Results from a progressive insulin secretory defect (insulin deficiency) on the background of insulin resistance. Affected persons are often older than 30 years at diagnosis, although it is now occurring frequently in young adults and children. Initially, individuals do not depend on exogenous insulin for survival but often require it as the disease progresses for adequate glycemic control. Type 2 diabetes accounts for ∼90% to 95% of those with diabetes. |
| Prediabetes | Fasting or glucose tolerance test results above normal, but not diagnostic of diabetes. These persons should be monitored closely because they have an increased risk of developing diabetes. |
| GDM | Diabetes diagnosed in some women during pregnancy. Approximately 7% of all pregnancies (ranging from 1% to 14%, depending on the population) are complicated by GDM. |
| Other specific types | Diabetes that results from specific genetic syndromes, surgery, drugs, malnutrition, infections, or other illnesses. |
GDM, Gestational diabetes mellitus.
Data from American Diabetes Association: Diagnosis and classification of diabetes mellitus (Position Statement), Diabetes Care 34:S63, 2011.
Prediabetes
Individuals with a stage of impaired glucose homeostasis that includes IFG and IGT are often referred to as having prediabetes, indicating their relatively high risk for the development of diabetes and CVD. People at risk have IFG, IGT, both, or a hemoglobin A1C (A1C) of 5.7% to 6.4% and should be counseled about strategies, such as weight loss and physical activity, to lower their risks.
Type 1 Diabetes
At diagnosis, people with type 1 diabetes mellitus (T1DM) are often lean and experience excessive thirst, frequent urination, and significant weight loss. The primary defect is pancreatic β-cell destruction, usually leading to absolute insulin deficiency and resulting in hyperglycemia, polyuria (excessive urination), polydipsia (excessive thirst), weight loss, dehydration, electrolyte disturbance, and ketoacidosis. The rate of β-cell destruction is quite variable, proceeding rapidly in infants and children and slowly in others (mainly adults). The capacity of a healthy pancreas to secrete insulin is far in excess of what is needed normally. Therefore the clinical onset of diabetes may be preceded by an extensive asymptomatic period of months to years, during which β-cells are undergoing gradual destruction (see Pathophysiology and Care Management Algorithm: Type 1 Diabetes Mellitus).
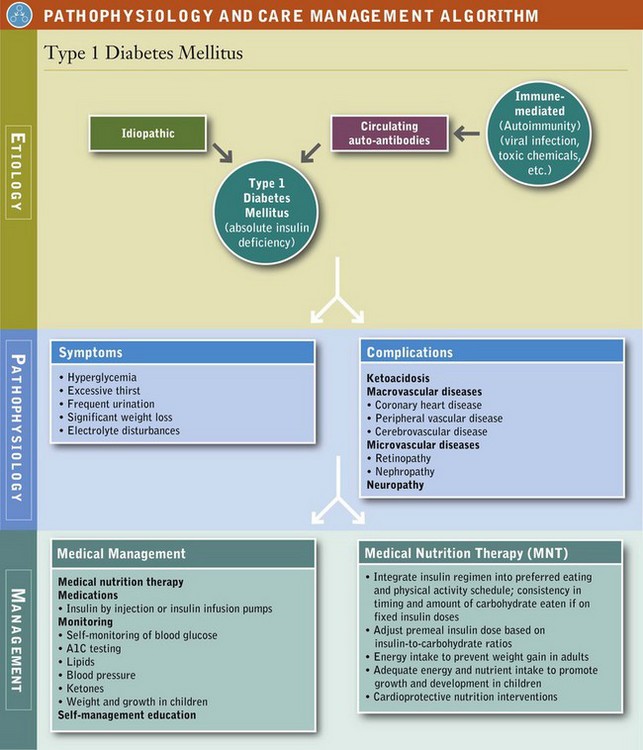
T1DM accounts for 5% to 10% of all diagnosed cases of diabetes. Persons with T1DM depend on exogenous insulin to prevent ketoacidosis and death. Although it may occur at any age, even in the eighth and ninth decades of life, most cases are diagnosed in people younger than 30 years of age, with a peak incidence at around ages 10 to 12 years in girls and ages 12 to 14 years in boys (ADbA, 2011a). T1DM has been increasing 3% to 4% per year in children and youth, and even more in young children younger than age 5.
T1DM has two forms: immune-mediated and idiopathic. Immune-mediated diabetes mellitus results from an autoimmune destruction of the β-cells of the pancreas, the only cells in the body that make the hormone insulin. Idiopathic T1DM refers to forms of the disease that have no known cause, found mostly in persons of African or Asian origin (ADbA, 2011a).
Risk factors for T1DM may be genetic, autoimmune, or environmental. The genetic predisposition to T1DM is the result of the combination of human leukocyte antigen (HLA)–DQ coded genes for disease susceptibility offset by genes that are related to disease resistance (ADbA, 2011a). However, the genetic factors that confer susceptibility or protection remain unclear. A 50% discordance rate of T1DM exists between identical twins, suggesting that specific genes are necessary but not sufficient for its development. A trigger, likely environmental, is necessary for the expression of the genetic propensity. At this time there are no known means to prevent T1DM.
Pathophysiology
Regardless of the trigger, early T1DM is first identified by the appearance of active autoimmunity directed against pancreatic β-cells and their products. At diagnosis, 85% to 90% of patients with T1DM have one or more circulating autoantibodies to islet cells, endogenous insulin, or other antigens that are constituents of islet cells. Antibodies identified as contributing to the destruction of β-cells are (1) islet cell autoantibodies; (2) insulin autoantibodies, which may occur in persons who have never received insulin therapy; (3) antibodies against islet tyrosine phosphatase (known as IA-2 and IA-2β); and (4) autoantibodies to glutamic acid decarboxylase (GAD), a protein on the surface of β-cells. GAD autoantibodies appear to provoke an attack by the T cells (killer T lymphocytes), which may destroy the β-cells in diabetes.
The clinical onset of diabetes may be abrupt, but the pathophysiologic insult is a slow, progressive process. Hyperglycemia and symptoms develop only after greater than 90% of the secretory capacity of the β-cell mass has been destroyed.
Frequently, after diagnosis and the correction of hyperglycemia, metabolic acidosis, and ketoacidosis, endogenous insulin secretion recovers. During this honeymoon phase exogenous insulin requirements decrease dramatically for up to 1 year or longer, and good metabolic control may be easily achieved. However, the need for increasing exogenous insulin replacement is inevitable and should always be anticipated. Intensive insulin therapy along with attention to MNT and self-monitoring of glucose from early diagnosis has been shown to prolong insulin secretion. Within 5 to 10 years after clinical onset, β-cell loss is complete, and circulating islet cell antibodies can no longer be detected.
Amylin, a glucoregulatory hormone is also produced in the pancreatic β-cell and co-secreted with insulin. Amylin complements the effects of insulin by regulating postprandial glucose levels and suppressing glucagon secretion. T1DM is an amylin-deficient state. Individuals with T1DM are also prone to other autoimmune disorders such as Grave’s disease, Hashimoto’s thyroiditis, Addison’s disease, vitiligo, celiac disease, autoimmune hepatitis, myasthenia gravis, and pernicious anemia.
Latent autoimmune diabetes in adults (LADA) may account for as many as 10% of cases of insulin-requiring diabetes in older individuals and represents a slowly progressive form of autoimmune diabetes that is frequently confused with T2DM. Adults with LADA have HLA genetic susceptibility as well as autoantibodies. They may retain sufficient β-cell function so as to not require insulin for approximately six years, but eventually require intensive insulin interventions (Rosario, 2005).
Type 2 Diabetes
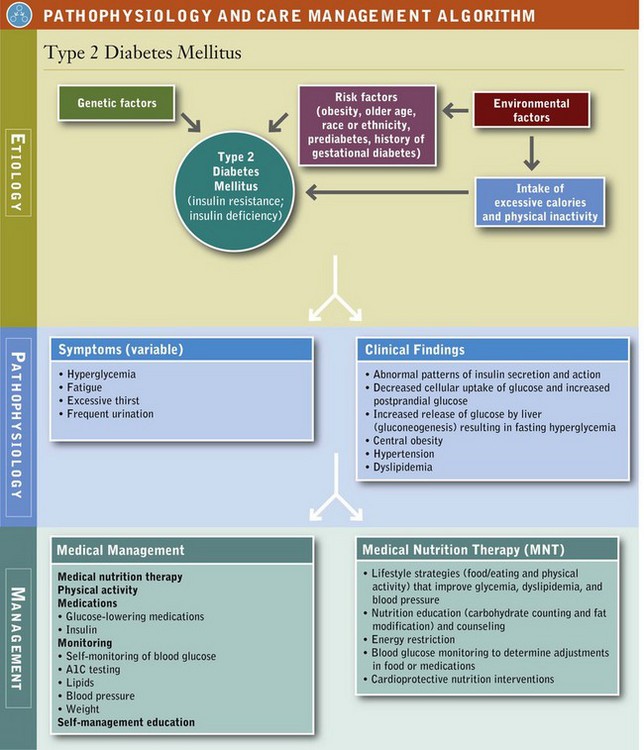
Type 2 diabetes mellitus (T2DM) accounts for 90% to 95% of all diagnosed cases of diabetes and is a progressive disease that, in many cases, is present long before it is diagnosed. Hyperglycemia develops gradually and is often not severe enough in the early stages for the person to notice any of the classic symptoms of diabetes. Although undiagnosed, these individuals are at increased risk of developing macrovascular and microvascular complications.
Risk factors for T2DM include genetic and environmental factors, including a family history of diabetes; older age; obesity, particularly intraabdominal obesity; physical inactivity; a prior history of gestational diabetes; prediabetes; and race or ethnicity. Adiposity and a longer duration of obesity are powerful risks factors for T2DM, and even small weight losses are associated with a change in glucose levels toward normal in persons with prediabetes. Nevertheless, T2DM is found in persons who are not obese, and many obese persons never develop T2DM. Therefore obesity combined with a genetic predisposition may be necessary for T2DM to occur (see Pathophysiology and Care Management Algorithm: Type 2 Diabetes Mellitus).
Pathophysiology
T2DM is characterized by a combination of insulin resistance and β-cell failure. Endogenous insulin levels may be normal, depressed, or elevated; but they are inadequate to overcome concomitant insulin resistance (decreased tissue sensitivity or responsiveness to insulin). As a result, hyperglycemia ensues.
Insulin resistance is first demonstrated in target tissues, mainly muscle, liver, and adipose cells. Initially there is a compensatory increase in insulin secretion (hyperinsulinemia), which maintains glucose concentrations in the normal or prediabetic range. In many persons the pancreas is unable to continue to produce adequate insulin, hyperglycemia occurs, and the diagnosis of diabetes is made. Therefore insulin levels are always deficient relative to elevated glucose levels before hyperglycemia develops.
Hyperglycemia is first exhibited as an elevation of postprandial (after a meal) blood glucose caused by insulin resistance at the cellular level and is followed by an elevation in fasting glucose concentrations. As insulin secretion decreases, hepatic glucose production increases, causing the increase in preprandial (fasting) blood glucose levels. The insulin response is also inadequate in suppressing alpha-cell glucagon secretion, resulting in glucagon hypersecretion and increased hepatic glucose production. Compounding the problem is glucotoxicity, the deleterious effect of hyperglycemia on both insulin sensitivity and insulin secretion; hence the importance of achieving near-euglycemia in persons with T2DM.
Insulin resistance is also demonstrated at the adipocyte level, leading to lipolysis and an elevation in circulating free fatty acids. In particular, excess intraabdominal obesity, characterized by an excess accumulation of visceral fat around and inside abdominal organs, results in an increased flux of free fatty acids to the liver, leading to an increase in insulin resistance. Increased fatty acids also cause a further decrease in insulin sensitivity at the cellular level, impair pancreatic insulin secretion, and augment hepatic glucose production (lipotoxicity). These defects contribute to the development and progression of T2DM and are also primary targets for pharmacologic therapy.
Persons with T2DM may or may not experience the classic symptoms of uncontrolled diabetes, and they are not prone to develop ketoacidosis. The progressive loss of β-cell secretory function means that persons with T2DM will require more medications over time to maintain the same level of glycemic control; eventually exogenous insulin will be required. Insulin is also required sooner for control during periods of stress-induced hyperglycemia, such as during illness or surgery.
Gestational Diabetes Mellitus
Gestational diabetes mellitus (GDM) occurs in approximately 7% of all pregnancies (ranging from 1% to 14% depending on the population studied), resulting in more than 200,000 cases annually (ADbA, 2011a). After delivery, approximately 90% of all women with GDM become normoglycemic but are at increased risk of developing GDM earlier in subsequent pregnancies. Immediately after pregnancy, 5% to 10% of women with GDM are diagnosed with T2DM. Women who have had GDM have a 40% to 60% chance of developing diabetes in the next 5 to 10 years (CDC, 2007). Lifestyle modifications aimed at reducing or preventing weight gain and increasing physical activity after pregnancy may reduce the risk of subsequent diabetes.
Previously GDM was defined as any degree of glucose intolerance with onset or first recognition during pregnancy. However, the number of pregnant women with undiagnosed diabetes has increased and therefore it has now been recommended that high-risk women found to have diabetes at their initial prenatal visit receive a diagnosis of overt, not gestational, diabetes (ADbA, 2011b). The majority of cases of GDM will be diagnosed during the second or third trimester of pregnancy because of the increase in insulin-antagonist hormone levels and normal insulin resistance that occurs at this time.
An oral glucose challenge was previously used as an indication of the need for diagnostic testing for GDM. However, new guidelines have been proposed. Women at high risk should be tested during the first trimester. Women with an A1C of greater than 6.5%, a fasting glucose of more than 126 mg/dL (7 mmol/L), or a 1-hour glucose or more than 200 mg/dL (11.1 mmol/L) likely had diabetes before becoming pregnant and should be treated for GDM. Screening should be done during the 24th to 28th week of pregnancy using a 75-g oral glucose tolerance test (OGTT). A fasting glucose of more than 92 mg/dL (5.1 mmol/L), a 1-hour glucose of more than 180 mg/dL (10 mmol/L), or a 2-hour glucose of 153 mg/dL (8.4 mmol/L) or more is diagnostic of GDM.
During pregnancy, treatment to normalize maternal blood glucose levels reduces the risk of adverse maternal, fetal, and neonatal outcomes. Extra glucose from the mother crosses the fetal placenta and the fetus’s pancreas responds by releasing extra insulin to cope with the excess glucose. The excess glucose is converted to fat, which results in macrosomia. The fetus may become too large for a normal birth, resulting in the need for cesarean delivery. Neonatal hypoglycemia at birth is another common problem. The above-normal levels of maternal glucose have caused the fetus to produce extra insulin. However, after birth the extra glucose is no longer available to the fetus; until his or her pancreas can adjust, the neonate may require extra glucose through intravenous feedings for a day or two to keep blood glucose levels normal.
GDM does not cause congenital anomalies. Such malformations occur in women with diabetes prior to pregnancy who have uncontrolled blood glucose levels during the first six to eight weeks of pregnancy when fetal organs are being formed. Because GDM doesn’t appear until later in pregnancy, the fetal organs were formed before hyperglycemia became a problem.
When optimal blood glucose levels are not being maintained with MNT or the rate of fetal growth is excessive, pharmacologic therapy is needed (American Dietetic Association [ADA], 2009a). Research supports the use of insulin, insulin analogs, metformin, and glyburide during pregnancy. Women with GDM should be screened for diabetes 6 to 12 weeks postpartum and should be followed with subsequent screening for the development of diabetes or prediabetes (ADbA, 2011b).
Other Types of Diabetes
This category includes diabetes associated with specific genetic syndromes (such as maturity-onset diabetes of youth), diseases of the exocrine pancreas (such as cystic fibrosis), drug- or chemical-induced (such as in the treatment of acquired immune deficiency syndrome or after organ transplantation), surgery, infections, and other illnesses. Such types of diabetes may account for 1% to 5% of all diagnosed cases of diabetes (ADbA, 2011a).
Screening and Diagnostic Criteria
Testing or screening for diabetes should be considered in all adults who are overweight (body mass index [BMI] of 25 kg/m2 or more) and who have one or more additional risk factors for T2DM in the following list. In those without these risk factors, testing should begin at age 45 years. If tests are normal, testing should be done at 3-year intervals; A1C, FPG, or 2-hour OGTT can be used to test for either prediabetes or diabetes (ADbA, 2011b). Additional risk factors for diabetes are:
• First-degree relative with diabetes
• Members of a high-risk population (African American, Latino, Native American, Asian-American, and Pacific Islander)
• Women who have delivered a baby weighing more than 9 lb or have been diagnosed with GDM
• Hypertensive (blood pressure 140/90 mm Hg or more or taking medication for hypertension)
• High-density lipoprotein (HDL) cholesterol level of less than 35 mg/dL (0.9 mmol/L) or a triglyceride level of more than 250 mg/dL (2.82 mmol/L)
• Women with polycystic ovary syndrome (PCOS)
• A1C of 5.7% or more, IGT, or IFG on previous testing
Consistent with screening recommendations for adults, children and youth at increased risk for T2DM should be tested. The age of initiation of screening is age 10 years or at onset of puberty, and the frequency is every 3 years (ADbA, 2011b). Youth who are overweight (BMI greater than the 85th percentile for age and sex, weight for height greater than the 85th percentile, or weight of more than 120% of ideal for height) and have any two of the following risk factors should be screened: family history of T2DM, members of high-risk ethnic populations, signs of insulin resistance (acanthosis nigricans, hypertension, dyslipidemia, PCOS, small for gestational age birthweight, or maternal history of diabetes or GDM during the child’s gestation.)
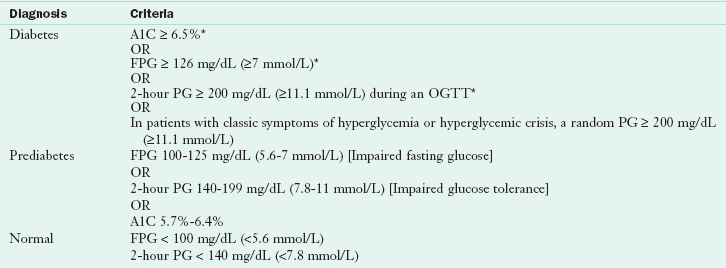
Diagnostic criteria for diabetes and prediabetes are summarized in Table 31-2. Four diagnostic methods may be used to diagnose diabetes and each, in the absence of unequivocal hyperglycemia, must be confirmed on a subsequent day by repeat testing. It is preferable that the same test be repeated for confirmation (ADbA, 2011b).
TABLE 31-2
Diagnosis of Diabetes Mellitus and Impaired Glucose Homeostasis (Prediabetes)
A1C, Hemoglobin A1C; FPG, fasting plasma glucose; OGTT, oral glucose tolerance test; PG, plasma glucose (measured 2 hours after an OGTT with administration of 75 g of glucose).
*In the absence of unequivocal hyperglycemia, criteria should be confirmed by repeat testing.
Data from American Diabetes Association: Diagnosis and classification of diabetes mellitus (Position Statement), Diabetes Care 34:S63, 2011.
The use of A1C for diagnosing diabetes was not previously recommended. However, the A1C assay is now highly standardized and is a reliable measure of chronic glucose levels. The A1C test reflects longer-term glucose concentrations and is assessed from the results of glycosylated hemoglobin (simplified as A1C) tests. When hemoglobin and other proteins are exposed to glucose, the glucose becomes attached to the protein in a slow, nonenzymatic, and concentration-dependent fashion. Measurements of A1C therefore reflect a weighted average of plasma glucose concentration over the preceding weeks. In nondiabetic persons A1C values are 4% to 6%; these values correspond to mean blood glucose levels of approximately 70 to 126 mg/dL (3.9 to 7 mmol/L). A1C values vary less than FPG and testing is more convenient as patients are not required to be fasting or to undergo an OGTT. For conditions with abnormal red cell turnover, such as pregnancy or anemias from hemolysis and iron deficiency, the diagnosis of diabetes must use glucose criteria exclusively (ADbA, 2011b).
Management of Prediabetes
In no other disease does lifestyle—healthy and appropriate food choices and physical activity—play a more important role in both prevention and treatment than in diabetes. Studies comparing lifestyle modifications to medication have provided support for the benefit of weight loss (reduced energy intake) and physical activity as the first choice to prevent or delay diabetes. Clinical trials comparing lifestyle interventions to a control group have reported risk reduction for T2DM from lifestyle interventions ranging from 29% to 67% (ADbA, 2011b). Two frequently cited studies are the Finnish Diabetes Prevention Study and the Diabetes Prevention Program in which lifestyle interventions focused on a weight loss of 5% to 10%, physical activity of at least 150 min/week of moderate activity, and ongoing counseling and support. Both reported a 58% reduction in the incidence of T2DM in the intervention group compared with the control group and persistent reduction in the rate of conversion to T2DM within 3 to 14 years postintervention follow-up (Diabetes Prevention Program, 2009; Li, 2008; Lindström, 2006).
Medical Management
Use of the pharmacologic agents metformin, α-glucosidase inhibitors, orlistat, and thiazolidinediones (TZDs) has been shown to decrease incidence of diabetes by various degrees (ADbA, 2011b). At this time, metformin is the only drug that should be considered for use in diabetes prevention. It is the most effective in those with a BMI of at least 35 kg/m2 and who are younger than age 30. For other drugs, issues of cost, side effects, and lack of persistence of effect are of concern.
Medical management must include lifestyle changes. Physical activity is important to prevent weight gain and maintain weight loss. For cardiovascular fitness and to reduce risk of T2DM, recommendations include moderate-intensity aerobic physical activity for a minimum of 30 minutes 5 days per week (150 min/week) (i.e., walking 3 to 4 miles/hour) or vigorous-intensity aerobic physical activity for a minimum of 20 minutes 3 days per week (90 min/week). Muscle-strengthening activities involving all major muscle groups 2 or more days per week are also recommended (U.S. Department of Health and Human Services, 2008). Physical activity independent of weight loss improves insulin sensitivity.
Bariatric Surgery and Prediabetes
For morbidly obese individuals, bariatric surgery can reduce the incidence of diabetes. Because improvement in glucose occurs rapidly and before significant weight loss, decreased risk may be related to diversion of nutrients away from the gastrointestinal tract (Guidone et al., 2006) or by changes from bariatric surgery on the signaling mechanism of the gut to pancreatic islet cells, muscles, fat, liver, and other organs (Wilson and Pories, 2010).
Medical Nutrition Therapy for Prediabetes
Goals of MNT for prediabetes emphasize the importance of food choices that facilitate moderate weight loss (Box 31-1). Because of the effects of obesity on insulin resistance, weight loss is an important goal (see Chapter 22). In addition, studies have reported a relationship between higher levels of total dietary fat and greater insulin resistance.
Whole grains and dietary fiber are associated with reduced risk of diabetes. Increased intake of whole grain–containing foods improves insulin sensitivity independent of body weight, and increased intake of dietary fiber has been associated with improved insulin sensitivity and improved ability to secrete insulin adequately to overcome insulin resistance (Mayer-Davis et al., 2006). Moderate consumption of alcohol (1 to 3 drinks per day [15 to 45 g alcohol]) is linked with decreased risk of T2DM, coronary heart disease (CHD), and stroke. But the data do not support recommending alcohol consumption to persons at risk for diabetes who do not already drink alcoholic beverages (ADbA, 2008).
Management of Diabetes
Two classic clinical trials have demonstrated beyond a doubt the clear link between glycemic control and the development of complications in persons with T1DM and T2DM, as well as the importance of nutrition therapy in achieving control. The Diabetes Control and Complications Trial (DCCT) studied approximately 1400 persons with T1DM treated with either intensive (multiple injections of insulin or use of insulin infusion pumps guided by blood glucose monitoring results) or conventional (one or two insulin injections per day) regimens. Patients who achieve control similar to the intensively treated patients can expect a 50% to 75% reduction in the risk of progression to retinopathy, nephropathy, neuropathy, and fewer long-term cardiovascular complications (Diabetes Control and Complications Trial, 2005). Another study, the United Kingdom Prospective Diabetes Study (UKPDS) demonstrated conclusively that glucose and blood pressure control decreased the risk of long-term complications in T2DM. A reduction in energy intake was at least as important, if not more important, than the actual weight lost.
Medical Management
There is a progressive nature in T2DM. The “diet” doesn’t fail; the pancreas fails to secrete enough insulin to maintain adequate glucose control. As the disease progresses, MNT alone is not enough to keep A1C level at 7% or less. Therapy needs to be intensified over time. Medication, and often insulin, need to be combined with nutrition therapy.
The management of all types of diabetes includes MNT, physical activity, monitoring, medications, and self-management education. An important goal of treatment is to provide the patient with the necessary tools to achieve the best possible control of glycemia, lipidemia, and blood pressure to prevent, delay, or arrest the microvascular and macrovascular complications while minimizing hypoglycemia and excess weight gain (ADbA, 2011b). Optimal control of diabetes also requires the restoration of normal carbohydrate, protein, and fat metabolism.
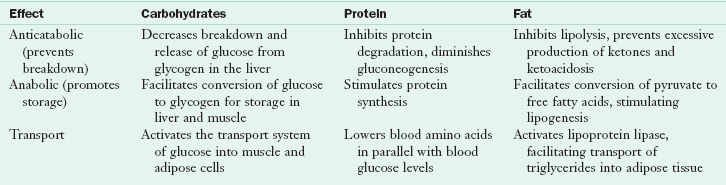
Insulin is both anticatabolic and anabolic and facilitates cellular transport (Table 31-3). In general, the counterregulatory (stress) hormones (glucagon, growth hormone, cortisol, epinephrine, and norepinephrine) have the opposite effect of insulin.
The American Diabetes Association’s (ADbA) glycemic treatment goals for persons with diabetes are listed in Table 31-4. Achieving goals requires open communication and appropriate self-management education. Patients can assess day-to-day glycemic control by self-monitoring of blood glucose (SMBG) and measurement of urine or blood ketones. Longer-term glycemic control is assessed by A1C testing. Lipid levels and blood pressure must also be monitored (Table 31-5). Lipids should be measured annually, and blood pressure should be monitored at every diabetes management visit (ADbA, 2011b).
TABLE 31-4
Recommendations for Glycemic Control for Adults with Diabetes
| Glycemic Control | Criteria |
| A1C | <7.0%* |
| Preprandial capillary plasma glucose | 70-130 mg/dL (3.9-7.2 mmol/L) |
| Peak postprandial capillary plasma glucose† | <180 mg/dL (<10 mmol/L) |
*Referenced to a nondiabetic range of 4%-6% using a DCCT-based assay.
†Postprandial glucose measurements should be made 1-2 hours after the beginning of the meal, generally peak levels in patients with diabetes.
Modified from American Diabetes Association: Standards of medical care in diabetes—2011 (Position Statement), Diabetes Care 34:S31, 2011.
TABLE 31-5
Recommendations for Lipid and Blood Pressure for Adults with Diabetes
| Lipids/Blood Pressure | Criteria |
| LDL cholesterol | <100 mg/dL (<2.6 mmol/L)* |
| HDL cholesterol | |
| Men | >40 mg/dL (>1.1 mmol/L) |
| Women | >50 mg/dL (>1.4 mmol/L) |
| Triglycerides | <150 mg/dL (<1.7 mmol/L) |
| Blood Pressure | <130/80 mm Hg |
CVD, Cardiovascular disease; HDL, high-density lipoprotein; LDL, low-density lipoprotein.
*In individuals with overt CVD, a lower LDL cholesterol goal of <70 mg/dL (1.8 mmol/L), using a high dose of a statin, is an option.
Modified from American Diabetes Association: Standards of medical care in diabetes—2011 (Position Statement), Diabetes Care 34:S31, 2011.
Medical Nutrition Therapy for Diabetes
MNT is integral to total diabetes care and management. Effective integration of MNT into the overall management of diabetes requires a coordinated team effort, including a registered dietitian (RD) who is knowledgeable and skilled in implementing current nutrition therapy recommendations for diabetes. MNT requires an individualized approach and effective nutrition self-management education and counseling. Monitoring glucose, A1C and lipid levels, blood pressure, weight, and quality-of-life issues is essential in evaluating the success of nutrition-related recommendations. If desired outcomes from MNT are not met, changes in overall diabetes care and management should be recommended (ADbA, 2008).
The American Dietetic Association (ADA) published evidence-based nutrition practice guidelines (EBNPG) for T1DM and T2DM in adults in their Evidence Analysis Library (ADA, 2008) and in print (Franz et al., 2010a). The ADbA nutrition recommendations are summarized in their annual standards of care (ADb, 2010b) and in a position statement (ADbA, 2008). Although numerous studies have attempted to identify the optimal percentages of macronutrients for the meal plan of persons with diabetes, it is unlikely that one such combination of macronutrients exists. The best mix appears to vary, depending on individual circumstances (ADbA, 2008). If guidance is needed, the RD should encourage consumption of macronutrients based on the dietary reference intakes (DRIs) for healthy eating (ADA, 2008), which recommend that adults should consume 45% to 65% of total energy from carbohydrate, 20% to 35% from fat, and 10% to 35% from protein.
Goals and Desired Outcomes
The goals for MNT for diabetes emphasize the role of lifestyle in improving glucose control, lipid and lipoprotein profiles, and blood pressure. To date, Medicare reimburses qualified dietitian providers for providing evidence-based MNT for diabetes management to eligible participants. Improving health through food choices and physical activity is the basis of all nutrition recommendations for the treatment of diabetes (see Box 31-1). Interventions include reduced energy and fat intake, carbohydrate counting, simplified meal plans, healthy food choices, individualized meal-planning strategies, exchange lists, low-fat vegan diet, insulin-to-carbohydrate ratios, physical activity, and behavioral strategies.
Besides being skilled and knowledgeable in assessing and implementing MNT, RDs must also be aware of expected outcomes from MNT, when to assess outcomes, and what feedback, including recommendations, should be given to referral sources. Furthermore, the effect of MNT on A1C will be known by 6 weeks to 3 months, at which time the RD must assess whether the goals of therapy have been met by changes in lifestyle or whether changes or additional medications are needed (ADA, 2008).
Research supports MNT as an effective therapy in reaching diabetes treatment goals. Clinical trials and outcomes studies have reported decreases in A1C levels at 3 to 6 months ranging from 0.25% to 2.9% (average 1% to 2%) with higher reductions seen in T2DM of shorter duration (Franz et al., 2008). These outcomes are similar to those from oral glucose-lowering medications. MNT is reported to reduce low-density lipoprotein (LDL) cholesterol by 9% to 12% compared with baseline values or to a Western-type diet (Van Horn et al., 2008). After initiation of MNT, improvements are apparent in 3 to 6 months. MNT provided by RDs for hypertension report an average reduction in blood pressure of approximately 5 mm Hg for both systolic and diastolic blood pressure (ADA, 2009b).
Carbohydrate Intake
Sugars, starch, and fiber are the preferred carbohydrate terms. Blood glucose levels after eating are primarily determined by the rate of appearance of glucose from carbohydrate digestion and absorption into the bloodstream and the ability of insulin to clear glucose from the circulation. Low-carbohydrate diets might seem to be a logical approach to lowering postprandial glucose. However, foods that contain carbohydrates (whole grains, fruits, vegetables, and low-fat milk) are excellent sources of vitamins, minerals, dietary fiber, and energy. Therefore these foods are important components of a healthy diet for all Americans, including those with diabetes (ADbA, 2008).
The long-held belief that sucrose must be restricted based on the assumption that sugars are more rapidly digested and absorbed than starches is not justified. The total amount of carbohydrate eaten at a meal, regardless if the source is starch or sucrose, is the primary determinant of postprandial glucose levels. The glycemic effect of carbohydrate foods cannot be predicted based on their structure (i.e., starch versus sugar) owing to the efficiency of the human digestive tract in reducing starch polymers to glucose. Starches are rapidly metabolized into 100% glucose during digestion, in contrast to sucrose, which is metabolized into only approximately 50% glucose and approximately 50% fructose. Fructose has a very low glycemic response, which has been attributed to its slow rate of absorption and its storage in the liver as glycogen (see Chapters 3 and 9, and Appendix 43).
Although numerous factors influence glycemic response to foods, monitoring total grams of carbohydrates, whether by use of carbohydrate counting, exchanges, or experienced-based estimation remains a key strategy in achieving glycemic control (ADA, 2008; ADbA, 2011b). Numerous studies have reported that when individuals are allowed to choose from a variety of starches and sugars, the glycemic response is nearly identical if the total amount of carbohydrate is similar.
Day-to-day consistency in the amount of carbohydrate eaten at meals and snacks is reported to improve glycemic control, especially in persons on either MNT alone, glucose-lowering medications, or fixed insulin regimens. In persons with T1DM or T2DM who adjust their mealtime insulin doses or who are on insulin pump therapy, insulin doses should be adjusted to match carbohydrate intake, known as the insulin-to-carbohydrate ratios (ADA, 2008). Several methods are used to estimate the nutrient content of foods.
In carbohydrate counting food portions contributing 15 g of carbohydrates (regardless of the source) are considered as one carbohydrate serving. Testing premeal and postmeal glucose levels is important for making adjustments in either food intake or medication to achieve glucose goals.
Exchange lists group foods into lists—carbohydrates, which includes starches, fruits, milk, sweets, desserts, and other carbohydrates, and nonstarchy vegetables; meat and meat substitutes; fats; and free foods. Each food list is a group of measured foods of approximately the same nutritional value. Combination foods such as casseroles, pizza, and soups, which fit into more than one food group, and fast foods are also listed. In addition, symbols are used to identify foods that are high in fiber, contain extra fat, or are high in sodium.
Glycemic Index and Glycemic Load
The glycemic index (GI) of food was developed to compare the physiologic effects of carbohydrates on glucose. The GI index measures the relative area under the postprandial glucose curve of 50 g of digestible carbohydrates compared with 50 g of a standard food, either glucose or white bread. When bread is the reference food, the GI index for the food is multiplied by 0.7 to obtain the value that is comparable to glucose being used as the reference food (glycemic index of glucose = 100, white bread = 70). The index does not measure how rapidly blood glucose levels increase. The peak glucose response for individual foods (Brand-Miller et al., 2009) and meals, either high or low glycemic index, occurs at approximately the same time.
The estimated glycemic load (GL) of foods, meals, and dietary patterns is calculated by multiplying the GI by the amount of carbohydrates in each food and then totaling the values for all foods in a meal or dietary pattern. In studies comparing low- and high-GI diets, total carbohydrate is first kept consistent. However, for some individuals use of the GI and GL may provide an additional modest benefit (ADbA, 2010b).
A major problem with the GI is the variability of response to a specific carbohydrate food. For example, Australian potatoes are reported to have a high GI, whereas potatoes in the United States and Canada have moderate GIs (Fernandes et al., 2005). The mean glycemic response and standard deviation of 50 g of carbohydrate from white bread tested in 23 subjects was 78 ± 73 with an individual coefficient of variation (CV) of 94%. Although the average GI of bread from three tests was 71%, the range of GI values was broad, ranging from 44 to 132 and the CV 34% (Vega-López et al., 2007).
Studies, primarily of short duration, report mixed effects on A1C levels (ADA, 2008). These studies are complicated by differing definitions of “high GI” or “low GI” diets or quartiles; GIs in the low GI diets range from 38% to 77% and in the high GI diets from 63% to 98%. More recently, two trials, each one year in duration, reported no significant differences in A1C levels from low GI versus high GI diets (Wolever et al., 2008) or ADbA diets (Ma et al., 2008). Furthermore, most people likely already consume a moderate GI diet. It is unknown whether further lowering of the dietary GI can be achieved in the long term.
Fiber
Evidence is lacking to recommend a higher fiber intake for people with diabetes than for the population as a whole. Thus recommendations for fiber intake for people with diabetes are similar to the recommendations for the general public. Although diets containing 44 to 50 g of fiber daily improve glycemia, more usual fiber intakes (less than 24 g daily) have not shown beneficial effects. It is unknown if individuals living at home can daily consume the amount of fiber needed to improve glycemia. However, consuming foods containing 25 to 30 g of fiber per day, with special emphasis on soluble fiber sources (7-13 g) is recommended as part of cardioprotective nutrition therapy (ADA, 2008).
Grams of fiber (and sugar alcohols) are included on food labels and are calculated as having approximately half the energy (2 kcal/g) of most other carbohydrates (4 kcal/g). Adjustments in carbohydrate intake values is practical only if the amount per serving is more than 5 g. In that case, counting half of the carbohydrate grams from fiber (and sugar alcohols) would be useful in calculating exchanges and food choices for food labels or recipes and for individuals who are using insulin-to-carbohydrate ratios for managing their diabetes (Wheeler, 2008).
Sweeteners
Even though sucrose restriction cannot be justified on the basis of its glycemic effect, it is still good advice to suggest that persons with diabetes be careful in their consumption of foods containing large amounts of sucrose. Sucrose intakes of 10% to 35% of total energy intake do not have a negative effect on glycemic or lipid responses when substituted for isocaloric amounts of starch (ADA, 2008). If sucrose is included in the food and meal plan, it should be substituted for other carbohydrate sources or, if added, be adequately covered with insulin or other glucose-lowering medications. Care should be taken to avoid excess energy intake (ADbA, 2008).
There appears to be no significant advantage of alternative nutritive sweeteners such as fructose versus sucrose. Fructose provides 4 kcal/g, as do other carbohydrates, and even though it does have a lower glycemic response than sucrose and other starches, large amounts (15% to 20% of daily energy intake) of fructose have an adverse effect on plasma lipids. However, there is no reason to recommend that persons with diabetes avoid fructose, which occurs naturally in fruits and vegetables as well as in foods sweetened with fructose (ADbA, 2008).
Reduced-calorie sweeteners approved by the Food and Drug Administration (FDA) include sugar alcohols (erythritol, sorbitol, mannitol, xylitol, isomalt, lactitol, and hydrogenated starch hydrolysates) and tagatose. They produce a lower glycemic response and contain, on average, 2 calories/g. As for fiber, persons using insulin-to-carbohydrate ratios can subtract one half of sugar alcohol grams from total carbohydrate when the grams are more than 5 (Wheeler et al., 2008). There is no evidence that the amounts of sugar alcohols likely to be consumed will reduce glycemia or energy intake (ADbA, 2008.) Although their use appears to be safe, some people report gastric discomfort after eating foods sweetened with these products, and consuming large quantities may cause diarrhea, especially in children.
Saccharin, aspartame, neotame, acesulfame potassium, and sucralose are nonnutritive sweeteners currently approved by the FDA. All such products must undergo rigorous testing by the manufacturer and scrutiny from the FDA before they are approved and marketed to the public. For all food additives, including nonnutritive sweeteners, the FDA determines an acceptable daily intake (ADI), defined as the amount of a food additive that can be safely consumed on a daily basis during a person’s lifetime without risk. The ADI generally includes a 100-fold safety factor and greatly exceeds average consumption levels. For example, aspartame actual daily intake in persons with diabetes is 2 to 4 mg/kg of body weight daily, well below the ADI of 50 mg/kg daily.
In December 2008 the FDA stated that the stevia-derived sweetener, Rebaudioside A, is generally recognized as safe and it is currently being marketed. All FDA-approved nonnutritive sweeteners, when consumed within the established daily intake levels, can be used by persons with diabetes, including pregnant women (ADbA, 2008). As new so-called “natural” and other sweeteners appear in the market, people with diabetes should be aware that many do contain energy and carbohydrate, as do foods sweetened with them, that need to be accounted for.
Protein Intake
The amount of protein usually consumed by persons with diabetes (15% to 20% of energy intake) has minimal acute effects on glycemic response, lipids, and hormones, and no long-term effect on insulin requirements, and therefore does not need to be changed. Exceptions are in persons who consume excessive protein choices high in saturated fatty acids, have a protein intake less than the recommended daily allowance, or in the presence of diabetic nephropathy (ADA, 2008). Although nonessential amino acids undergo gluconeogenesis, in well-controlled diabetes the glucose produced does not appear in the general circulation. Although protein has no long-term effect on insulin needs, it is just as potent a stimulant of acute insulin release as carbohydrate. Furthermore, protein does not slow the absorption of carbohydrates and adding protein to the treatment of hypoglycemia does not prevent subsequent hypoglycemia.
Short-term studies with small numbers of subjects with diabetes suggest that diets with protein contents greater than 20% of total energy may improve glucose and insulin concentrations, reduce appetite, and improve satiety. However, such diets appear to be difficult to follow and the long-term effects of increased protein intake on regulation of energy intake, satiety, and weight loss have not been adequately studied.
Dietary Fat
Studies in persons with diabetes demonstrating the effects of specific percentages of dietary saturated and trans-fatty acids and specific amounts of cholesterol on CVD risk are limited. However, persons with diabetes are considered to have a risk of CVD similar to those with a past history of CVD. Therefore after focusing on achieving glycemic control, cardioprotective nutrition interventions should be implemented in the initial series of encounters (ADA, 2008). See Chapter 34 for recommendations for the prevention and treatment of CVD.
In metabolic studies in which energy intake is maintained so that subjects do not lose weight, diets high in either carbohydrates or monounsaturated fat lower LDL cholesterol equivalently. The concern has been the potential of a high-carbohydrate diet (more than 55% of energy intake) to increase triglycerides and postprandial glucose compared with a high–monounsaturated fat diet. However, in other studies when energy intake is reduced, the adverse effects of high-carbohydrate diets are not observed. Therefore energy intake appears to be a factor in determining the effects of a high-carbohydrate versus a high–monounsaturated fat diet.
There is evidence from the general population that foods containing ω-3 polyunsaturated fatty acids are beneficial and two to three servings of fish per week are recommended. Although most studies in persons with diabetes who have used ω-3 supplements show beneficial lowering of triglycerides, an accompanying rise in LDL cholesterol also has been noted. If supplements are used, the effects on LDL cholesterol should be monitored.
Alcohol
The same precautions that apply to alcohol consumption for the general population apply to persons with diabetes. Abstention from alcohol should be advised for people with a history of alcohol abuse or dependence; for women during pregnancy; and for people with medical problems such as liver disease, pancreatitis, or advanced neuropathy. If individuals choose to drink alcohol, daily intake should be limited to one drink or less for adult women and two drinks or less for adult men (1 drink = 12 oz beer, 5 oz of wine, or  oz of distilled spirits). Each drink contains approximately 15 g of alcohol. The type of alcoholic beverage consumed does not make a difference (ADbA, 2008).
Moderate amounts of alcohol ingested with food have minimum, if any, acute effect on glucose and insulin levels. Alcoholic beverages should be considered an addition to the regular food and meal plan for all persons with diabetes. No food should be omitted, given the possibility of alcohol-induced hypoglycemia and because alcohol does not require insulin to be metabolized. Excessive amounts of alcohol (three or more drinks per day) on a consistent basis contribute to hyperglycemia, which improves as soon as alcohol use is discontinued.
In persons with diabetes, light to moderate amounts of alcohol (1 to 2 drinks per day; 15 to 30 g of alcohol) are associated with a decreased risk of CHD, perhaps because of the concomitant increase in HDL cholesterol and improved insulin sensitivity associated with alcohol consumption. Ingestion of light to moderate amounts of alcohol does not raise blood pressure, whereas excessive, chronic ingestion of alcohol does raise blood pressure and may be a risk factor for stroke.
Micronutrients
No clear evidence has been established for benefits from vitamin or mineral supplements in persons with diabetes (compared with the general population) who do not have underlying deficiencies (ADbA, 2008). In select groups such as the elderly, pregnant or lactating women, strict vegetarians, or those on calorie-restricted diets, a multivitamin supplement may be needed.
Because diabetes may be a state of increased oxidative stress, there has been interest in prescribing antioxidant vitamins in people with diabetes. Clinical trial data not only indicate the lack of benefit from antioxidants on glycemic control and progression of complications but also provide evidence of the potential harm of vitamin E, carotene, and other antioxidant supplements. Routine supplementation with antioxidants such as vitamins E and C and carotene is not advised because of lack of evidence of effectiveness and concern related to long-term safety (ADbA, 2008).
Dietary Supplements
Alpha-lipoic acid (ALA), which functions as an antioxidant, may have potential benefits for persons with diabetes and peripheral neuropathy. Short-term trials of intravenous and oral ALA reported improvements in symptoms of neuropathy. A long-term, multicenter trial is currently assessing the role of ALA given orally to determine whether ALA slows the progression of neuropathy versus only improving the neuropathy symptoms.
Several small studies have suggested a role for chromium supplementation in the management of glucose intolerance, gestational diabetes, body weight, and corticosteroid-induced diabetes. A systematic review of 41 studies regarding the effect of chromium supplementation on glucose metabolism and lipid levels reported no significant effect of chromium on lipid or glucose metabolism in people without diabetes and inconsistent effects in subjects with diabetes. However, the evidence is limited by the overall poor quality and heterogeneity of available studies (Balk et al., 2007). In addition, there is no benefit of chromium picolinate supplementation in reducing body weight. Benefit from chromium supplementation has not been clearly demonstrated and therefore is not recommended (ADbA, 2008).
Physical Activity and Exercise
Physical activity involves bodily movement produced by the contraction of skeletal muscles that requires energy expenditure in excess of resting energy expenditure. Exercise is a subset of physical activity: planned, structured, and repetitive bodily movement performed to improve or maintain one or more components of physical fitness. Aerobic exercise consists of rhythmic, repeated, and continuous movements of the same large muscle groups for at least 10 minutes at a time. Examples include walking, bicycling, jogging, swimming, and many sports. Resistance exercise consists of activities that use muscular strength to move a weight or work against a resistive load. Examples include weight lifting and exercises using resistance-providing machines.
Physical activity should be an integral part of the treatment plan for persons with diabetes. Exercise helps all persons with diabetes improve insulin sensitivity, reduce cardiovascular risk factors, control weight, and improve well being. Given appropriate guidelines, the majority of people with diabetes can exercise safely. The activity plan varies depending on interest, age, general health, and level of physical fitness.
Despite the increase in glucose uptake by muscles during exercise, glucose levels change little in individuals without diabetes. Muscular work causes insulin levels to decline while counterregulatory hormones (primarily glucagon) rise. As a result, the increased glucose use by the exercising muscles is matched with increased glucose production by the liver. This balance between insulin and counterregulatory hormones is the major determinant of hepatic glucose production, underscoring the need for insulin adjustments in addition to adequate carbohydrate intake during exercise for people with diabetes.
In persons with T1DM, the glycemic response to exercise varies, depending on overall diabetes control, plasma glucose and insulin levels at the start of exercise; timing, intensity, and duration of the exercise; previous food intake; and previous conditioning. An important variable is the level of plasma insulin during and after exercise. Hypoglycemia can occur because of insulin-enhanced muscle glucose uptake by the exercising muscle.
In persons with T2DM, blood glucose control can improve with physical activity, largely because of decreased insulin resistance and increased insulin sensitivity, which results in increased peripheral use of glucose not only during but also after the activity. This exercise-induced enhanced insulin sensitivity occur independent of any effect on body weight. Structured exercise interventions of at least 8 weeks’ duration are reported to lower A1C. Exercise also decreases the effects of counterregulatory hormones; this in turn reduces the hepatic glucose output, contributing to improved glucose control.
Potential Problems with Exercise
Hypoglycemia is a potential problem associated with exercise in persons taking insulin or insulin secretagogues. Hypoglycemia can occur during, immediately after, or many hours after exercise. Hypoglycemia has been reported to be more common after exercise, especially exercise of long duration, strenuous activity or play, or sporadic exercise, than during exercise. This is because of increased insulin sensitivity after exercise and the need to replete liver and muscle glycogen, which can take up to 24 to 30 hours (see Chapter 23). However, hypoglycemia can also occur during or immediately after exercise. Blood glucose levels before exercise reflect only the value at that time, and it is unknown if this is a stable blood glucose level or a blood glucose level that is dropping. If blood glucose levels are dropping before exercise, adding exercise can contribute to hypoglycemia during exercise. Furthermore, hypoglycemia on the day before exercise may increase the risk of hypoglycemia on the day of exercise as well.
Hyperglycemia can also result from exercise of high intensity, likely as a result of the effects of counterregulatory hormones. When a person exercises at what for him or her is a high level of exercise intensity, there is a greater-than-normal increase in counterregulatory hormones. As a result, hepatic glucose release exceeds the rise in glucose use. The elevated glucose levels may also extend into the postexercise state. Hyperglycemia and worsening ketosis can also result in persons with T1DM who are deprived of insulin for 12 to 48 hours and are ketotic. Vigorous activity should probably be avoided in the presence of ketosis (ADbA, 2011b). However, high-intensity exercise is more likely to be the cause of hyperglycemia than insulin deficiency.
Exercise Guidelines
The variability of glucose responses to exercise contributes to the difficulty in giving precise guidelines for exercising safely. Frequent blood glucose monitoring before, during, and after exercise helps individuals identify their response to physical activities. To meet their individual needs, patients must modify general guidelines to reduce insulin doses before (or after) or ingest carbohydrates after (or before) exercise.
Carbohydrate for Insulin or Insulin Secretagogue Users: During moderate-intensity exercise, glucose uptake is increased by 8 to 13 g/hour; this is the basis for the recommendation to add 15 g carbohydrate for every 30 to 60 minutes of activity (depending on the intensity) over and above normal routines. Moderate exercise for less than 30 minutes usually does not require any additional carbohydrate or insulin adjustment. Added carbohydrates should be ingested if preexercise glucose levels are less than 100 mg/dL (5.6 mmol/L). Supplementary carbohydrate is generally not needed in individuals who are not treated with insulin or insulin secretagogues (ADbA, 2011b).
In all persons, blood glucose levels decline gradually during exercise, and ingesting a carbohydrate feeding during prolonged exercise can improve performance by maintaining the availability and oxidation of blood glucose. For the exerciser with diabetes whose blood glucose levels may drop sooner and lower than the exerciser without diabetes, ingesting carbohydrate after 40 to 60 minutes of exercise is important and may also assist in preventing hypoglycemia. Drinks containing 6% or less of carbohydrates empty from the stomach as quickly as water and have the advantage of providing both needed fluids and carbohydrates (see Chapter 23). Consuming carbohydrates immediately after exercise optimizes repletion of muscle and liver glycogen stores. For the exerciser with diabetes, this takes on added importance because of increased risk for late-onset hypoglycemia.
Insulin Guidelines: It is often necessary to adjust the insulin dosage to prevent hypoglycemia. This occurs most often with moderate to strenuous activity lasting more than 45 to 60 minutes. For most persons a modest decrease (of approximately 1 to 2 units) in the rapid- or short-acting insulin during the period of exercise is a good starting point. For prolonged vigorous exercise, a larger decrease in the total daily insulin dosage may be necessary. After exercise, insulin dosing may also need to be decreased.
Precautions for Persons with Type 2 Diabetes: Persons with T2DM may have a lower VO2max and therefore need a more gradual training program. Rest periods may be needed, but this does not impair the training effect from physical activity. Autonomic neuropathy or medications, such as for blood pressure, may not allow for increased heart rate, and individuals must learn to use perceived exertion as a means of determining exercise intensity. Blood pressure may also increase more in persons with diabetes than in those who do not have diabetes, and exercise should not be undertaken if systolic blood pressure is greater than 180 to 200 mm Hg (ADbA, 2010b).
Exercise Recommendations
People with diabetes should be advised to perform at least 150 min/week of moderate-intensity aerobic physical activity (50% to 70% of maximum heart rate) or at least 90 min/week of vigorous aerobic exercise (more than 70% of maximum heart rate.) The physical activity should be distributed over at least 3 days/week and with no more than 2 consecutive days without physical activity. In the absence of contraindications, people with T2DM should be encouraged to perform resistance exercise three times a week, targeting all major muscle groups, progressing to three sets of 8 to 10 repetitions at a weight that cannot be lifted more than eight to ten times. There is an additive benefit of combined aerobic and resistance training in adults with T2DM (ADbA, 2011b).
It is recommended that providers assess patients for conditions that might contraindicate certain types of exercise or predispose to injury. High-risk patients should be encouraged to start with short periods of low-intensity exercise and increase the intensity and duration slowly (ADbA, 2011b).
Medications
A consensus statement on the approach to management of hyperglycemia in T2DM has been published by the ADbA and the European Association for the Study of Diabetes (Nathan et al., 2009). Interventions at the time of diagnosis include lifestyle (MNT and physical activity) and metformin. If A1C is 7% or more, the next well-validated therapies are to add either a sulfonylurea or basal insulin. The alternative path is to add the less well-validated therapies of pioglitazone or an incretin glucagon-like peptide 1 (GLP-1) agonist. The overall objective is to achieve and maintain glycemic control and to change interventions, including the use of insulin, when therapeutic goals are not being met (ADbA, 2011b).
All persons with T1DM and many persons with T2DM who no longer produce adequate endogenous insulin need replacement of insulin. In persons with T2DM, insulin may be needed to restore glycemia to near normal. Circumstances that require the use of insulin in T2DM include the failure to achieve adequate control with administration of oral medications; periods of acute injury, infection, extreme heat exposure, surgery, or pregnancy.
Glucose-Lowering Medications for Type 2 Diabetes
Understanding that T2DM is a progressive disease is important for the understanding of treatment choices. Assisting individuals with diabetes to understand the disease process also helps them to understand and accept changes in medications that occur over time. Diabetes is first diagnosed when there is insufficient insulin available to maintain euglycemia and as insulin deficiency progresses medications and eventually insulin will be required to achieve glycemic goals. This is not a “diet failure” or a “medication failure” but rather a failure of the insulin secreting capacity of the β-cells.
Glucose-lowering medications target different aspects of the pathogenesis of T2DM—insulin resistance at the cellular level, incretin system defects, endogenous insulin deficiency, elevated levels of glucagon, and excessive hepatic glucose release. Because the mechanisms of action differ, the medications can be used alone or in combination. Table 31-6 lists the generic and brand names of glucose-lowering medications for persons with T2DM, their principal sites of action, and expected decreases in A1C when used as monotherapy.
TABLE 31-6
Glucose-Lowering Medications for Type 2 Diabetes
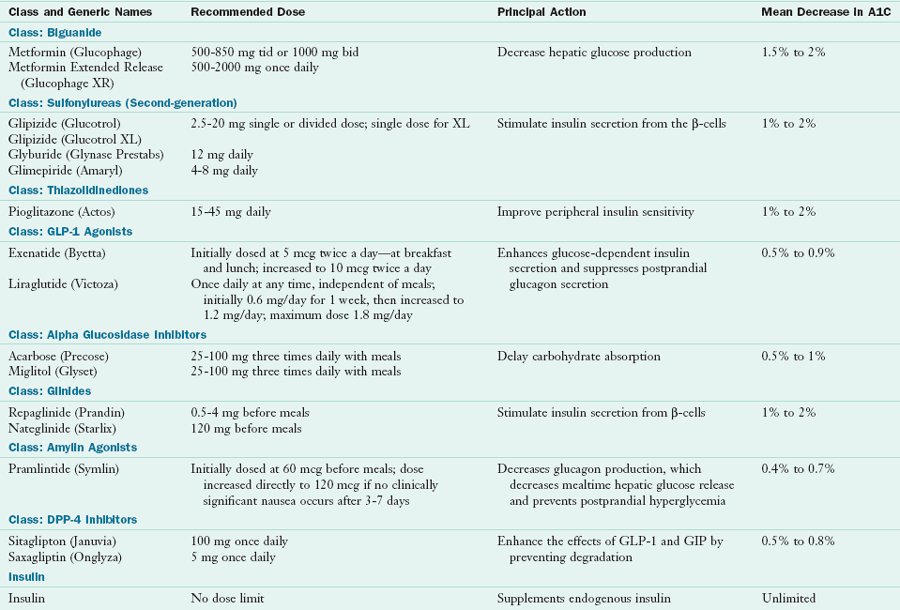
A1C, Hemoglobin A1C; bid, twice daily; DPP, dipeptidyl peptidase; GIP, glucose-dependent insulinotropic peptide; GLP, glucagon-like peptide; tid, three times daily.
Adapted from Nathan DM et al: Medical management of hyperglycemia in type 2 diabetes: a consensus algorithm for initiation and adjustment of therapy, Diabetes Care 32:193-203, 2009.
Biguanides: Metformin suppresses hepatic glucose production, is not associated with hypoglycemia, may cause small weight losses when therapy begins, and is relatively inexpensive. The most common side effects are gastrointestinal, which often disappear with time. To minimize these effects, the medication should be taken with food consumption and the smallest dose (500 mg) given twice a day for a week and gradually increased to maximum doses. A rare side effect is severe lactic acidosis, which can be fatal. Acidosis usually occurs in patients who use alcohol excessively, have renal dysfunction, or have liver impairments (Nathan et al., 2009).
Sulfonylureas: The sulfonylureas promote insulin secretion by the beta cells of the pancreas. First- and second-generation sulfonylurea drugs differ from one another in their potency, pharmacokinetics, and metabolism. Disadvantages of their use include weight gain and the potential to cause hypoglycemia. They have the advantage of being inexpensive.
Thiazolidinediones: TZDs or glitazones decrease insulin resistance in peripheral tissues and thus enhance the ability of muscle and fat cells to take up glucose. TZDs also have a favorable effect on lipids and do not independently cause hypoglycemia. Adverse effects include weight gain and edema.
Glucagon-like Peptide-1 Agonist: Exenatide (Byetta) and liraglutide (Victoza) are incretin mimetic or incretin-like agents that have many of the same glucose-lowering effects as the body’s naturally occurring incretin, GLP-1. Incretins are hormones made by the gastrointestinal tract and released during nutrient absorption, which increase glucose-dependent insulin secretion, slow gastric emptying, decrease glucagon production, and decrease appetite. GLP-1 agonists are associated with reduction in A1C and modest weight loss. Typically exenatide is injected twice a day, at breakfast and at the evening meal and liraglutide is injected once a day, at any time, independent of meals. They often cause gastrointestinal disturbances, which tend to abate over time (Nathan et al., 2009.) A once-weekly injection of a GLP-1 agonist is currently being tested.
Alpha Glucosidase Inhibitors: Acarbose (Precose) and miglitol (Glyset) are alpha-glucosidase inhibitors that work in the small intestine to inhibit enzymes that digest carbohydrates, thereby delaying carbohydrate absorption and lowering postprandial glycemia. They do not cause hypoglycemia or weight gain when used alone, but they can frequently cause flatulence, diarrhea, cramping, or abdominal pain. Symptoms may be alleviated by initiating therapy at a low dose and gradually increasing the dose to therapeutic levels.
Glinides: The meglitinides differ from the sulfonylureas in that they have short metabolic half-lives, which result in brief episodic stimulation of insulin secretion. They are given before meals, decreasing postprandial glucose excursions and less risk of hypoglycemia. Nateglinide only works in the presence of glucose and is a somewhat less potent secretagogue. Risk of weight gain is similar to sulfonylureas (Nathan et al., 2009).
Dipeptidyl Peptidase 4 Inhibitors: GLP-1 and glucose-dependent insulinotropic peptide, the main intestinal stimulants of insulin are rapidly degraded by dipeptidyl peptidase 4 (DPP-4) inhibitors. DPP-4 inhibitors prolong their half-lives. They are relatively well tolerated, are weight-neutral, and do not cause hypoglycemia when used as monotherapy (Nathan et al., 2009).
Amylin Agonists (Pramlintide): Pramlintide is a synthetic analog of the β-cell hormone amylin. It is injected before meals slowing gastric emptying and inhibiting glucagon production resulting in a decrease in postprandial glucose excursions. It is approved for use as adjunctive therapy with regular insulin or rapid-acting insulin (Nathan et al., 2009).
Insulin: For persons with T2DM the transition to insulin often begins with a long-acting or premixed insulin given at bedtime or before the evening meal to control fasting glucose levels. However, eventually many patients with T2DM require a more physiologic insulin regimen at bedtime or an evening meal to achieve control (see following section). If large doses of insulin are required, oral medications such as insulin sensitizers are often combined with the insulin regimen.
Insulin
Insulin has three characteristics: onset, peak, and duration (Table 31-7). U-100 is the concentration of insulin available in the United States. This means it has 100 units of insulin per milliliter of fluid (100 units/mL). U-100 syringes deliver U-100 insulin; however, insulin pens are now being used more frequently as an alternative to the traditional syringe-needle units.
TABLE 31-7
Action Times of Human Insulin Preparations
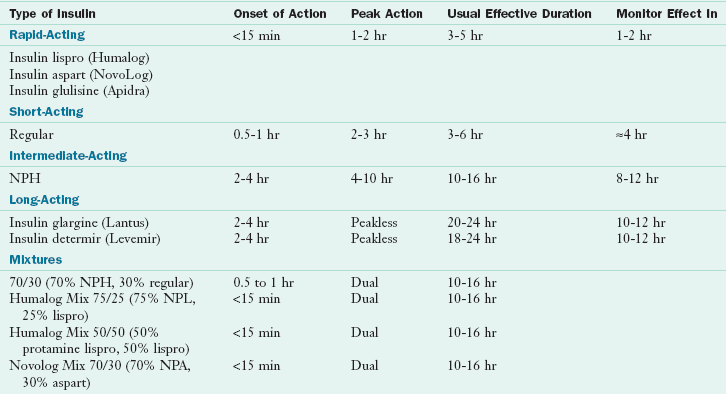
NPA, Neutral protamine aspart; NPH, neutral protamine Hagedorn; NPL, neutral protamine lispro.
Adapted from Reactive and Fasting Hypoglycemia 4th Edition © 2007 International Diabetes Center at Park Nicollet, Minneapolis, MN. All rights reserved. Used with permission. 1-888-637-2675.
Rapid-acting Insulins: Rapid-acting insulins include insulin lispro (Humalog), insulin aspart (Novolog), and insulin glulisine (Apidra) and are used as bolus (mealtime) insulins. They are insulin analogs that differ from human insulin in amino acid sequence but bind to insulin receptors and thus function in a manner similar to human insulin. All have an onset of action within 15 minutes, a peak in activity at 60 to 90 minutes, and a duration of 3 to 5 hours. They result in fewer hypoglycemic episodes compared with regular insulin.
Regular Insulin: Regular insulin is a short-acting insulin with an onset of action 15 to 60 minutes after injection and a duration of action ranging from 5 to 8 hours. For best results the slow onset of regular insulin requires it to be taken 30 to 60 minutes before meals.
Intermediate-acting Insulin: Neutral protamine Hagedorn (NPH) is the only available intermediate-acting insulin; Lente insulin has been discontinued. Its appearance is cloudy, and its onset of action is about 2 hours after injection, with a peak effect from 6 to 10 hours.
Long-acting Insulins: Insulin glargine (Lantus) and insulin determir (Levemir) are long-acting insulins; Ultralente has been discontinued. Insulin glargine is an insulin analog that, because of its slow dissolution at the injection site, results in a relatively constant and peakless delivery over 24 hours. Because of its acidic pH, it cannot be mixed with any other insulin in the same syringe before injection and is usually given at bedtime. However, glargine can be given before any meal, but, whichever time is chosen, it must be given consistently at that time. Insulin determir is absorbed from the subcutaneous tissue relatively quickly but then binds to albumin in the bloodstream, resulting in a prolonged action time of approximately 17 hours. Therefore it may need to be given twice a day. Basal insulin analogs decrease the chances of hypoglycemia, especially nocturnal hypoglycemia (Rosenstock et al., 2005).
Premixed Insulins: Premixed insulins include 70% NPH/30% regular, 75% lispro protamine (NPL [addition of neutral protamine to lispro to create an intermediate-acting insulin])/25% lispro, 50% lispro protamine and 50% lispro, and 70% protamine (addition of neutral protamine to aspart to create an immediate-acting insulin)/30% aspart. Persons using premixed insulins must eat at specific times and be consistent in carbohydrate intake to prevent hypoglycemia.
Insulin Regimens: All persons with T1DM and those with T2DM who no longer produce adequate endogenous insulin need replacement of insulin that mimics normal insulin action. After individuals without diabetes eat, their plasma glucose and insulin concentrations increase rapidly, peak in 30 to 60 minutes, and return to basal concentrations within 2 to 3 hours. To mimic this, rapid-acting (or short-acting) insulin is given before meals, and this is referred to as bolus or mealtime insulin (Figure 31-1).
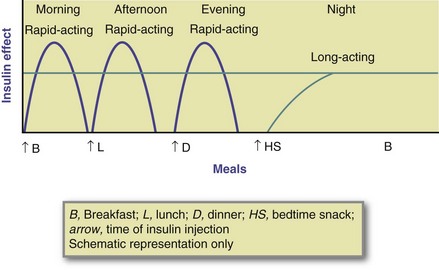
FIGURE 31-1 Time actions of flexible insulin regimens. (Modified from Kaufman FR: Medical management of type 1 diabetes, ed 5, Alexandria, Va, 2008, American Diabetes Association.)
Mealtime insulin doses are adjusted based on the amount of carbohydrate in the meal. An insulin-to-carbohydrate ratio can be established for an individual that will guide decisions on the amount of mealtime insulin to inject. Basal or background insulin dose is that amount of insulin required in the postabsorptive state to restrain endogenous glucose output primarily from the liver. Basal insulin also limits lipolysis and excess flux of free fatty acids to the liver. Long-acting insulins are used for basal insulin. The type and timing of insulin regimens should be individualized, based on eating and exercise habits and blood glucose concentrations.
These physiologic insulin regimens allow increased flexibility in the type and timing of meals. For normal-weight persons with T1DM, the required insulin dosage is approximately 0.5 to 1 unit/kg of body weight per day. Approximately 50% of the total daily insulin dose is used to provide for basal or background insulin needs. The remainder (rapid-acting insulin) is divided among the meals either proportionately to the carbohydrate content or by giving approximately 1 to 1.5 units of insulin per 10 to 15 g of carbohydrates consumed. The larger amount is usually needed to cover breakfast carbohydrates as a result of the presence in the morning of higher levels of counterregulatory hormones. Persons with T2DM may require insulin doses in the range of 0.5 to 1.2 units/kg of body weight daily. Large doses, even more than 1.5 units/kg of body weight daily, may be required at least initially to overcome prevailing insulin resistance.
Insulin pump therapy provides basal rapid-acting or short-acting insulin pumped continuously by a mechanical device in micro amounts through a subcutaneous catheter that is monitored 24 hours a day. Both lispro and aspart work well in insulin pumps, resulting in improved glycemia and less hypoglycemia than with regular insulin. Boluses of the insulin are given before meals. Pump therapy requires a committed and motivated person who is willing to do a minimum of four blood glucose tests per day, keep blood glucose and food records, and learn the technical features of pump use.
Self-Management Education
Diabetes management is a team effort. Persons with diabetes must be at the center of the team because they have the responsibility for day-to-day management. RDs, nurses, physicians, and other health care providers contribute their expertise to developing therapeutic regimens that help the person with diabetes achieve the best metabolic control possible. The goal is to provide patients with the knowledge, skills, and motivation to incorporate self-management into their daily lifestyles. Dietitians can demonstrate their specialized diabetes knowledge by obtaining certification beyond the RD credential. Two diabetes care certifications available to RDs are the certified diabetes educator, a specialty certification, and board certified-advanced diabetes management, an advanced practice certification.
Monitoring
The health care team, including the individual with diabetes, should work together to implement blood glucose monitoring and establish individual target blood glucose goals (see Table 31-4).
Self-monitoring of Blood Glucose
SMBG is used on a day-to-day basis to manage diabetes effectively and safely; however, measurement of A1C levels provides the best available index of overall diabetes control. Patients can perform SMBG up to eight times per day—before breakfast, lunch, and dinner; at bedtime; 1 to 2 hours after meals; and during the night or whenever needed to determine causes of hypoglycemia or hyperglycemia. For patients using multiple insulin injections or insulin pump therapy, SMBG is recommended three or more times daily, generally prior to each meal. For persons using less frequent insulin injections, noninsulin therapies, or MNT alone, SMBG may be useful as a guide to the success of the therapy (ADbA, 2011b). For these persons, SMBG is often performed one to four times a day, often before breakfast and before and 2 hours after the largest meal but only 3 or 4 days per week.
The ADA EBNPG for diabetes reviewed the evidence on glucose monitoring and recommended that for persons with T1DM or T2DM on insulin therapy, at least three to four glucose tests per day are needed to determine the accuracy of the insulin doses and to guide adjustments in insulin doses, food intake, and physical activity. Once established, some insulin regimens require less frequent SMBG. For persons on MNT alone or MNT in combination with glucose-lowering medications, frequency and timing depend on diabetes management goals and therapies.
Self management education and training is necessary to use SMBG devices and data correctly (ADA, 2008). Individuals need to be taught how to adjust their management program based on the results of SMBG. The first step in using such records is to learn how to identify patterns in blood glucose levels taken at the same time each day that are outside the target range—generally high readings for three or more days in a row or low readings two days in a row. The next step is to determine if a lifestyle factor (meal times, carbohydrate intake, quantity and time of physical activity) or medication dose adjustment is needed.
If changes in medication doses such as insulin are needed, adjustments are made in the insulin (or mediations) acting at the time of the problem glucose readings. After pattern management is mastered, algorithms for insulin dose changes to compensate for an elevated or low glucose value can be used. A commonly used formula determines the insulin sensitivity, or correction factor (CF), which defines how many milligrams per deciliter a unit of rapid-acting (or short-acting) insulin will lower blood glucose levels over a 2- to 4-hour period (Kaufman, 2008). The CF is determined by using the “1700 rule,” in which 1700 is divided by the total daily dose (TDD) of insulin the individual typically takes. For example, if the TDD is 50 units of insulin, the CF = 1700/50 = 35. In this case, 1 unit of insulin should lower the individual’s blood glucose level by 35 mg/dL (2 mmol/L).
In using blood glucose monitoring records, it should be remembered that factors other than food affect blood glucose concentrations. An increase in blood glucose can be the result of insufficient insulin or insulin secretagogue; too much food; or increases in glucagon and other counterregulatory hormones as a result of stress, illness, or infection. Factors that contribute to hypoglycemia include too much insulin or insulin secretagogue, not enough food, unusual amounts of exercise, and skipped or delayed meals. Urine glucose testing, used in the past, has so many limitations that it should not be used.
It is now possible to do continuous glucose monitoring (CGM), which measures glucose in interstitial fluid and provides readings every 5 to 10 minutes. Other features include alarms for glucose highs and lows and the ability to download data and track trends over time. The ADbA recommends that CGM in conjunction with intensive insulin regimens can be a useful tool to lower A1C in selected adults (age 25 years and older) with T1DM. Evidence is less strong for A1C lowering in children, teens, and younger adults (ADbA, 2011b). After reviewing the evidence, the ADA EBNPG for diabetes concluded that persons experiencing unexplained elevations in A1C or unexplained hypoglycemia may benefit from use of CGM or more frequent SMBG (ADA, 2008).
A1C Monitoring
A1C tests should be done at least twice a year in persons who are meeting treatment goals and have stable glycemic control. They should be done quarterly in persons whose therapy has changed or who are not meeting glycemic goals. In persons without diabetes A1C values are 4% to 6%. These values correspond to mean plasma glucose levels of approximately 70-126 mg/dL (3.9-7 mmol/L). Correlation between A1C levels and average glucose levels have recently been verified (ADbA, 2011b). An A1C of 6% reflects an average glucose level of 126 mg/dL. In general, each 1% change in A1C reflects a change of approximately 28-29 mg/dL.
Ketone, Lipid, and Blood Pressure Monitoring
Urine or blood testing can be used to detect ketones. Testing for ketonuria or ketonemia should be performed regularly during periods of illness and when blood glucose levels consistently exceed 240 mg/dL (13.3 mmol/L). The presence of persistent, moderate, or large amounts of ketones, along with elevated blood glucose levels, requires insulin adjustments. Persons with T2DM rarely have ketosis; however, ketone testing should be done when the person is seriously ill.
For most adults, lipids should be measured at least annually; however, in adults with low-risk lipid values, assessments may be repeated every 2 years. Blood pressure should be measured at every routine diabetes visit (ADbA, 2011b).
Implementing the Nutrition Care Process
The nutrition care process articulates the consistent and specific steps used to deliver MNT (ADA, 2011). For some individuals with diabetes MNT will be implemented in individual sessions and for others in group sessions. Providing nutrition interventions in groups is becoming increasingly more important; however, group interventions must also allow for individualization of MNT and evaluation of outcomes. The following sections review implementation of individual MNT.
The ADA EBNPG recommend that MNT be provided by a RD in an initial series of three to four encounters each lasting 45 to 90 minutes. This series, beginning at diagnosis of diabetes or at first referral to an RD for MNT for diabetes, should be completed within 3 to 6 months and the RD should determine if additional encounters are needed after the initial series based on the nutrition assessment of learning needs and progress toward desired outcomes. At least one follow-up encounter is recommended annually to reinforce lifestyle changes and to evaluate and monitor outcomes that affect the need for changes in MNT or medication. The RD should again determine if additional MNT encounters are needed. Although glycemic control is the primary focus for diabetes management, cardioprotective nutrition interventions for the prevention and treatment of CVD should also be implemented in the initial series of encounters (ADA, 2008).
Nutrition Assessment
The nutrition assessment involves obtaining information before and during the encounter needed to identify nutrition-related problems. Assessment data can be obtained from the referral source or the patient’s medical records and from the patient. Patient data can be collected from forms the patient completes before the first encounter or directly from the patient. By collecting as much date as possible before the first session, completion of the assessment and implementation of interventions can begin more efficiently. Nutrition assessment is an ongoing process that involves not only initial data collection, but also reassessment and analysis of patient data and needs. Box 31-2 provides a summary of assessment categories.
The ADA EBNPG for diabetes highlights three specific assessment recommendations. First, the RD should assess food intake (focusing on carbohydrate), medication, metabolic control (glycemia, lipids, and blood pressure), anthropometric measurements, and physical activity as the basis for the implementation of the nutrition prescription, goals, and interventions. Second, the RD should assess glycemic control and focus MNT to achieve and maintain blood glucose levels in the target range. However, the need for cardioprotective nutrition interventions should also be assessed. Third, the RD should assess the relative importance of weight management for persons with diabetes who are overweight of obese. They note that although modest weight loss has been shown to improve insulin resistance in overweight and obese insulin-resistant individuals, research on sustained weight loss interventions lasting 1 year or longer reports inconsistent effects on A1C (ADA, 2008).
Nutrition Diagnosis
The nutrition diagnosis identifies and describes a specific nutrition problem that can be resolved or improved through treatment or intervention by an RD (see Chapter 11). Patients may have more than one nutrition diagnoses, in which case the RD must to prioritize them in the nutrition intervention step. The nutrition diagnostic language includes three domains: (1) intake problems related to the quantity of intake versus requirements; (2) clinical findings and problems related to medical (or physical) condition; and (3) behavioral-environmental findings and problems related to knowledge, attitudes and beliefs, physical environment, and access to food. A nutrition diagnosis is formatted according to problem, etiology, and signs and symptoms (PES). Examples of diabetes-related nutrition diagnoses are listed in Box 31-3.
Nutrition Intervention
Nutrition interventions include two distinct steps: planning the nutrition goals and implementing the actual interventions. Planning involves prioritizing the nutrition diagnoses, conferring with the persons with diabetes and others, reviewing current nutrition practice guidelines for diabetes, setting goals, determining the nutrition prescription, and choosing specific intervention strategies.
Implementation is the action phase. In the food and nutrient delivery phase, an individualized food and meal plan is developed. and specific nutrient recommendations as needed are included. Nutrition education involves the transfer of knowledge to the specific deficits identified in the nutrition diagnosis statements. Nutrition counseling involves behavior and attitude change through the use of strategies that promote behavior changes and motivation and intention to change. However, nutrition care must also be coordinated with other health care providers who can assist in the implementation of the nutrition prescription and nutrition therapy. If home care is needed, follow-up should take place.
Nutrition Therapy Interventions for Specific Populations
Type 1 Diabetes and Patients Requiring Insulin Therapy: The first priority is to integrate an insulin regimen into the usual eating habits and physical activity schedule. With the many insulin options now available (rapid- and long-acting insulins), an insulin regimen can be planned that will conform to an individual’s preferred meal routines and food choices (ADbA, 2008). It is no longer necessary to create unnatural or artificial divisions of meals and snacks.
Physiologic insulin regimens that mimic natural insulin secretion involve multiple injections (three or more insulin injections per day) or use of an insulin infusion pump. These types of insulin regimens allow increased flexibility in choosing when and what to eat. Mealtime insulin doses are adjusted to match carbohydrate intake (insulin-to-carbohydrate ratios.) This can be accomplished by comprehensive nutrition education and counseling on interpretation of blood glucose patterns, nutrition-related medication management, and collaboration with the health care team (ADA, 2008). For persons who receive fixed insulin regimens such as with the use of premixed insulins or those who do not adjust their mealtime insulin doses, day-to-day consistency in the timing and amount of carbohydrates eaten is recommended.
Attention must also be paid to total energy intake as well as carbohydrate intake. Weight gain may adversely affect glycemia, lipids, blood pressure, and general health; thus prevention of weight gain in adults is desirable.
Type 2 Diabetes with MNT Alone or with Glucose-Lowering Medications: The first priority is to adopt lifestyle interventions that improve the metabolic abnormalities of glycemia, dyslipidemia, and hypertension. Lifestyle interventions independent of weight loss that can improve glycemia include reduced energy intake and increased energy expenditure through physical activity. Because many persons also have dyslipidemia and hypertension, limitation of saturated and trans-fatty acids, cholesterol, and sodium is recommended. These interventions should be implemented as soon as the diagnosis of diabetes is made.
MNT interventions for established T2DM differ from interventions for prevention. Because of the progressive nature of T2DM, MNT interventions progress from prevention of obesity, to the prevention or delay of T2DM, to strategies for improved metabolic control. Modest weight loss is beneficial in persons with insulin resistance, but, as the disease progresses to insulin deficiency, medications usually need to be combined with MNT. Emphasis should be on blood glucose control, improved food choices, increased physical activity, and moderate energy restriction rather than weight loss alone because it is unclear whether weight loss alone will improve glycemic control (ADA, 2008).
The first step in food and meal planning is teaching which foods are carbohydrates (fruits, grains, starchy vegetables, milk, sweets), average portion sizes, and how many servings to select at meals (and snacks, if desired). Limiting fats, especially saturated and trans-fats, encouraging physical activity, and using blood glucose monitoring to adjust food and eating patterns and medications are also important components of successful MNT for T2DM. Frequent follow-up with an RD can provide the problem-solving techniques, encouragement, and support that lifestyle changes require.
Physical activity improves insulin sensitivity, acutely lowers blood glucose in persons with diabetes, and may also improve cardiovascular status. By itself it has only a modest effect on weight; however, it is essential for long-term weight maintenance. Cardiorespiratory fitness in persons with diabetes appears to be more important than thinness in relation to all-cause and cardiovascular mortality. Therefore it is important to counsel patients to increase physical activity and fitness levels.
Weight-loss drugs may be beneficial in the treatment of overweight persons with T2DM and can help achieve a 5% to 10% weight loss when combined with lifestyle modifications. It is generally recommended that they be used only in people with a BMI greater than 27.
Bariatric surgery can be an effective weight-loss treatment for severely obese patients with T2DM and can result in marked improvements in glycemia. Bariatric surgery should be considered for adults with BMI of more than 35 kg/m2 and T2DM, especially if the diabetes and associated comorbidities are difficult to control with lifestyle and pharmacologic therapy (ADbA, 2011b; see Chapter 22).
Type 1 Diabetes in Youth: Involvement of a multidisciplinary team, including a physician, RD, nurse, and behavioral specialist, all trained in pediatric diabetes, is the best means of achieving optimal diabetes management in youth. However, the most important team members are the child or adolescent and his or her family.
A major nutrition goal for children and adolescents with T1DM is maintenance of normal growth and development. Possible causes of poor weight gain and linear growth include poor glycemic control, inadequate insulin, and overrestriction of calories. The last may be a consequence of the common erroneous belief that restricting food, rather than adjusting insulin, is the way to control blood glucose. Other reasons unrelated to diabetes management include thyroid abnormalities and malabsorption syndromes. Excessive weight gain can be caused by excessive caloric intake, overtreatment of hypoglycemia, or overinsulinization. Other causes include low physical activity levels and hypothyroidism, accompanied by poor linear growth (Silverstein et al., 2005).
The nutrition prescription is based on the nutrition assessment. Newly diagnosed children often present with weight loss and hunger; as a result, the initial meal plan must be based on adequate calories to restore and maintain appropriate body weight. In about 4 to 6 weeks the initial caloric level may need to be modified to meet more usual caloric requirements. Nutrient requirements for children and adolescents with diabetes appear to be similar to those of children and adolescents without diabetes. The DRIs can be used to determine energy requirements (Institute of Medicine, 2002). However, it may be preferable to use a food and nutrition history of typical daily intake, providing that growth and development are normal, to determine an individual child’s or adolescent’s energy needs.
Consultation with an RD to develop and discuss the medical nutrition plan is encouraged (Silverstein et al., 2005). Because energy requirements change with age, physical activity, and growth rate, an evaluation of height, weight, BMI, and the nutrition plan must be updated at least every year. Good metabolic control is essential for normal growth and development (for growth charts see Appendixes 9 through 16). However, withholding food or having the child eat consistently without an appetite for food in an effort to control blood glucose should be discouraged. Calories should be adequate for growth and restricted if the child becomes overweight.
Individualized food and meal plans, insulin regimens using basal (background) and bolus (mealtime) insulins, and insulin algorithms or insulin pumps can provide flexibility for children with T1DM and their families. This approach accommodates irregular meal times and schedules and varying appetites and activity levels (ADbA, 2008). Blood glucose records are essential to assist in making appropriate changes in insulin regimens. Daily eating patterns in young children generally include three meals and two or three snacks, depending on the length of time between meals and the child’s physical activity level. Children often prefer smaller meals and snacks. Snacks can prevent hypoglycemia between meals and provide adequate calories. Older children and teens may prefer only three meals. Blood glucose monitoring data are then used to integrate an insulin regimen into the meal, snack, and exercise schedules.
After the appropriate nutrition prescription has been determined, the meal planning approach can be selected. A number of meal planning approaches can be used. Carbohydrate counting for food planning provides youth and their families with guidelines that facilitate glycemic control while still allowing the choice of many common foods that children and adolescents enjoy. However, whatever approach to food planning is used, the youth and family must find it understandable and applicable to their lifestyle.
Type 2 Diabetes in Youth: Childhood obesity has been accompanied by an increase in the prevalence of T2DM among children and adolescents. IGT has been shown to be highly prevalent in obese youth, irrespective of ethnic group, and is associated with insulin resistance. Once T2DM develops, β-cell failure is also a factor. Thus T2DM in youth appears to follow a progressive pattern similar to T2DM in adults.
Successful lifestyle treatment of T2DM in children and adolescents involves cessation of excessive weight gain, promotion of normal growth and development, and the achievement of blood glucose and A1C goals. Nutrition guidelines should also address comorbidities such as hypertension and dyslipidemia. Offer behavior modification strategies to decrease intake of high-caloric, high-fat, and high-carbohydrate foods (extra-large desserts) and drinks (regular soda and other high-sugar beverages) while encouraging healthy eating habits and regular physical activity for the entire family (ADbA, 2008). In addition, metformin is used when lifestyle strategies alone have not achieved target glucose goals. Youth with T2DM may also require insulin therapy to achieve adequate glycemic control.
Preexisting Diabetes and Pregnancy: Normalization of blood glucose levels during pregnancy is very important for women who have preexisting diabetes or who develop GDM. Table 31-8 lists glucose goals for pregnancy. The MNT goals are to assist in achieving and maintaining optimal blood glucose control and to provide adequate maternal and fetal nutrition throughout pregnancy, energy intake for appropriate maternal weight gain, and necessary vitamins and minerals (ADbA, 2008). Nutrition recommendations during pregnancy and lactation appear to be similar for women with and without diabetes; therefore the DRIs can be used to determine energy and nutrient requirements during pregnancy and for lactation (Institute of Medicine, 2002).
TABLE 31-8
Plasma Glucose Goals during Pregnancy
| Preexisting Diabetes (Type 1 or Type 2) | Gestational Diabetes |
| Premeal, bedtime, and overnight glucose 60-99 mg/dL (3.3-5.4 mmol/L) | Preprandial ≤ 95 mg/dL (5.3 mmol/L) |
| Peak postprandial glucose 100-129 mg/dL (5.4-7.1 mmol/L) | 1 h postmeal ≤ 140 mg/dL (7.8 mmol/L) |
| A1C < 6.0% | 2 h postmeal ≤ 120 mg/dL (6.7 mmol/L) |
Modified from American Diabetes Association: Standards of medical care—2011 (Position Statement), Diabetes Care 34:S21, 2011b.
Preconception counseling and the ability to achieve near-normal blood glucose levels before pregnancy have been shown to be effective in reducing the incidence of anomalies in infants born to women with preexisting diabetes to nearly that of the general population. As a result of hormonal changes during the first trimester, blood glucose levels are often erratic. Although caloric needs do not differ from those preceding pregnancy, the meal plan may need to be adjusted to accommodate the metabolic changes. Women should be educated about the increased risk of hypoglycemia during pregnancy and cautioned against overtreatment.
The need for insulin increases during the second and third trimesters of pregnancy. At 38 to 40 weeks’ postconception, insulin needs and levels peak at two to three times prepregnancy levels. Pregnancy-associated hormones that are antagonistic to the action of insulin lead to elevated blood glucose levels. For women with preexisting diabetes, this increased insulin need must be met with increased exogenous insulin.
Meal plan adjustments are necessary to provide the additional calories required to support fetal growth, and weight should be monitored. During pregnancy the distribution of energy and carbohydrate intake should be based on the woman’s food and eating habits and blood glucose responses. Insulin regimens can be matched to food intake, but maintaining consistency of times and amounts of food eaten are essential to avoid hypoglycemia caused by the continuous fetal draw of glucose from the mother. Smaller meals and more frequent snacks are often needed. A late-evening snack is often necessary to decrease the likelihood of overnight hypoglycemia and fasting ketosis. Records of food intake and blood glucose values are essential for determining whether glycemic goals are being met and for preventing and correcting ketosis.
Regular follow-up visits during pregnancy are needed to monitor caloric and nutrient intake, blood glucose control, and whether there is starvation ketosis. Urine or blood ketones during pregnancy may signal starvation ketosis that can be caused by inadequate energy or carbohydrate intake, omission of meals or snacks, or prolonged intervals between meals (e.g., more than 10 hours between the bedtime snack and breakfast). Ketonemia during pregnancy has been associated with reduced IQ scores in children, and women should be instructed to test for ketones periodically before breakfast.
Gestational Diabetes Mellitus: MNT for GDM primarily involves a carbohydrate-controlled meal plan that promotes optimal nutrition for maternal and fetal health with adequate energy for appropriate gestational weight gain, achievement and maintenance of normoglycemia, and absence of ketosis. Specific nutrition and food recommendations are determined and modified based on individual assessment and blood glucose records. Monitoring blood glucose, fasting ketones, appetite, and weight gain can aid in developing an appropriate, individualized meal plan and in adjusting the meal plan throughout pregnancy.
Nutrition practice guidelines for gestational diabetes have been developed and field-tested (ADA, 2009a). All women with GDM should receive MNT at diagnosis of GDM. Monitoring records guide nutrition therapy and are used to determine if additional therapy is needed. Insulin, metformin, or glyburide therapy is added if glucose goals exceed target range (see Table 31-8) on two or more occasions in a 1- to 2-week period without some obvious explanation. Lack of weight gain and ketone testing can be useful in determining whether women are undereating to keep glucose levels within target range in an effort to avoid insulin therapy.
Carbohydrates should be distributed throughout the day into three small to moderate size meals and two to four snacks. All women require a minimum of 175 g of carbohydrates daily (Institute of Medicine, 2002). An evening snack is usually needed to prevent accelerated ketosis overnight. Carbohydrates are not as well tolerated at breakfast as they are at other meals because of increased levels of cortisol and growth hormones. To compensate, the initial food plan may have approximately 30 g of carbohydrate at breakfast. To satisfy hunger, protein foods can be added because they do not affect blood glucose levels.
Although caloric restriction must be viewed with caution, a modest energy restriction to slow weight gain is recommended for overweight or obese women with GDM. A slight calorie restriction results in a slowing of maternal weight gain in obese women with GDM without causing maternal or fetal compromise or ketonuria (ADA, 2009a). Energy intake of less than approximately 1700 to 1800 kcal/day is not advised. Weight gain during pregnancy for women with GDM should be similar to that of women without diabetes.
Exercise assists in overcoming peripheral resistance to insulin and in controlling fasting and postprandial hyperglycemia and may be used as an adjunct to nutrition therapy to improve maternal glycemia. The ideal form of exercise is unknown, but a brisk walk after meals is often recommended.
Women with GDM (and women with preexisting diabetes) should be encouraged to breastfeed because breastfeeding is associated with a reduced incidence of future T2DM (Stuebe, 2005). For women with GDM who are overweight or obese or with above-recommended weight gain during pregnancy, weight loss is advised after delivery. Weight loss reduces the risks of recurrent GDM or future development of T2DM (ADA, 2009a).
Older Adults: The prevalence of diabetes and prediabetes increases dramatically as people age. Many factors predispose older adults to diabetes: age-related decreases in insulin production and increases in insulin resistance, adiposity, decreased physical activity, multiple prescription medications, genetics, and coexisting illnesses. A major factor appears to be insulin resistance. Controversy persists as to whether the insulin resistance is itself a primary change or whether it is attributable to reduced physical activity, decreased lean body mass (sarcopenia), and increased adipose tissue, which are common in older adults. Furthermore, medications used to treat coexisting diseases may complicate diabetes therapy in older persons.
Despite the increase in glucose intolerance with age, aging per se should not be a reason for suboptimal control of blood glucose. Even if it is incorrectly assumed that preventing long-term diabetic complications is not relevant to the care of older adults, persistent hyperglycemia has deleterious effects on the body’s defense mechanisms against infection. It also increases the pain threshold by exacerbating neuropathic pain, and it has a detrimental effect on the outcome of cerebrovascular accidents.
Nutrition recommendations for older adults with diabetes must be extrapolated from what is known from the general population and should address nutrition-related cardiovascular risk factors common in older adults and encourage consumption of a variety of foods. Because of the loss of lean body mass and exercise patterns, the energy requirements of older adults are 20% to 30% lower than those of younger adults (ADbA, 2008). Physical activity can significantly reduce the decline in aerobic capacity that occurs with age, improve risk factors for atherosclerosis, slow the decline in age-related lean body mass, decrease central adiposity, and improve insulin sensitivity; thus it should be encouraged.
Malnutrition, not obesity, is the more prevalent nutrition-related problem in older adults. It often remains subclinical or unrecognized because the result of malnutrition—excessive loss of lean body mass—resembles the signs and symptoms of the aging process. Both malnutrition and diabetes adversely affect wound healing and defense against infection, and malnutrition is associated with depression and cognitive deficits. The most reliable indicator of poor nutrition status in older adults is a change in body weight; involuntary weight gain or loss of more than 10 pounds or 10% of body weight in less than 6 months indicates a need to evaluate the reason for the change in weight.
It is essential that older adults, especially those in long-term care settings, receive a diet that meets their nutritional needs, enables them to attain or maintain a reasonable body weight, helps control blood glucose, and is palatable. Dietary restriction is not warranted for older residents in long-term health facilities. Residents should be served the regular, unrestricted menu with consistency in the amount and timing of carbohydrates (ADbA, 2008). A multivitamin and mineral supplement to meet the DRIs may be necessary.
Hyperglycemia and dehydration can lead to a serious complication of diabetes in older adults: hyperglycemic hyperosmolar state (HHS). Patients with HHS have a very high blood glucose level (ranging from 400 to 2800 mg/dL, [22.2-155.6 mmol/L] with an average of 1000 mg/dL [55.6 mmol/L]) without ketones. Patients are markedly dehydrated, and mental alterations range from mild confusion to hallucinations or coma. Patients who have HHS have sufficient insulin to prevent lipolysis and ketosis. Treatment consists of hydration and small doses of insulin to control hyperglycemia.
The Nutrition Prescription
To develop, educate, and counsel patients regarding the nutrition prescription, it is essential to learn about the patient’s lifestyle and eating habits. Food and eating histories can be done several ways, with the objective being to determine a schedule and pattern of eating that will be the least disruptive to the lifestyle of the individual with diabetes and, at the same time, will facilitate improved metabolic control. With this objective in mind, asking the individual either to record or report what, how much, and when he or she typically eats during a 24-hour period may be the most useful. Another approach is to ask the patient to keep and bring a 3-day or 1-week food intake record. The request to complete a food record can be made when an appointment with the RD is scheduled. It is also important to learn about the patient’s daily routine and schedule. The following information is needed: (1) time of waking; (2) usual meal and eating times; (3) work schedule or school hours; (4) type, amount, and timing of exercise; and (5) usual sleep habits.
Using the assessment data and food and nutrition history information, a preliminary food and meal plan can then be designed, and, if the patient desires, sample menus provided. Developing a food and meal plan does not begin with a set calorie or macronutrient prescription; instead, it is determined by modifying the patient’s usual food intake as necessary. The worksheet in Figure 31-2 can be used to record the usual foods eaten and to modify the usual diet as necessary. The macronutrient and caloric values for the food lists are listed on the form and in Table 31-9; see Appendix 34 for portion sizes of the foods on the food lists. These tools are useful in evaluating nutrition assessments.
TABLE 31-9
Macronutrient and Caloric Values for Food Lists*
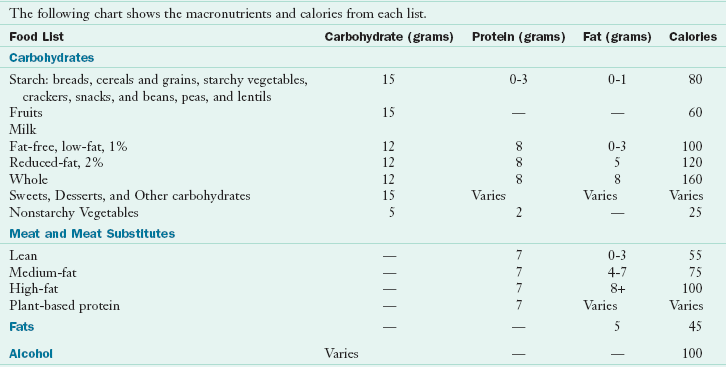
*See Appendix 34.
From American Diabetes Association and American Dietetic Association: Choose Your Foods: Exchange Lists for Diabetes, Alexandria, Va, Chicago, Il, 2008, American Diabetes Association, American Dietetic Association.
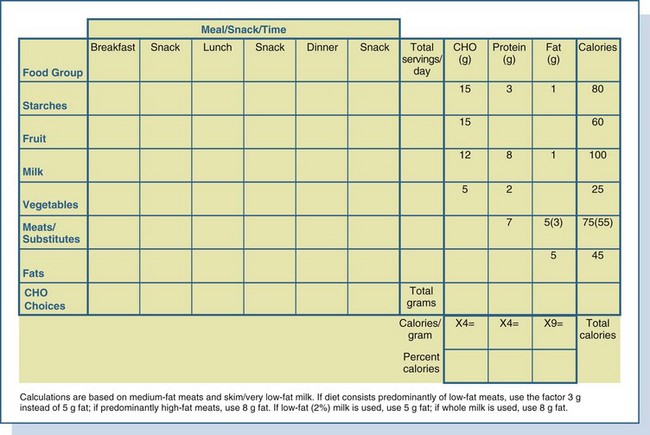
Using the form in Figure 31-2, the RD begins by totaling the number of servings from each food list and multiplying this number by the grams of carbohydrate, protein, and fat contributed by each. Next the grams of carbohydrate, protein, and fat are totaled from each column; the grams of carbohydrates and protein are then multiplied by 4 (4 kcal/g of carbohydrates and protein), and the grams of fat are multiplied by 9 (9 kcal/g of fat). Total calories and percentage of calories from each macronutrient can then be determined. Numbers derived from these calculations are then rounded off. Figure 31-3 provides an example of a preliminary food and meal plan. In this example the nutrition prescription is the following: 1900 to 2000 calories, 230 g of carbohydrates (50%), 90 g of protein (20%), 65 g of fat (30%). The number of carbohydrate choices for each meal and snack is the total of the starch, fruit, and milk servings. Vegetables, unless starchy or eaten in very large amounts (three or more servings per meal), are generally considered “free foods.” The carbohydrate choices are circled under each meal and snack column.
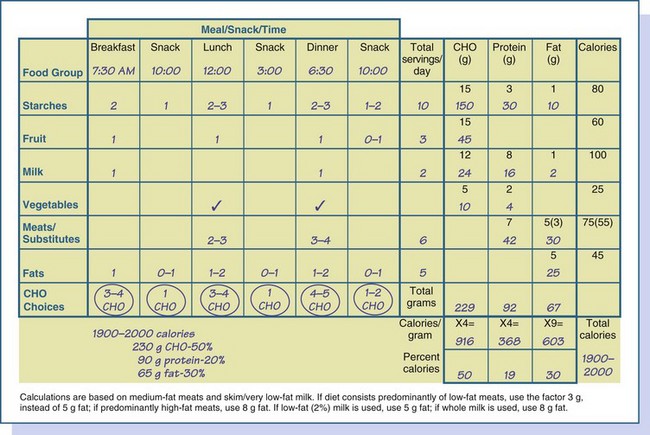
FIGURE 31-3 An example of a completed worksheet from the assessment, the nutrition prescription, and a sample 1900- to 2000-calorie meal plan. CHO, Carbohydrate.
The next step is to evaluate the preliminary meal plan. First and foremost, does the patient think it is feasible to implement the meal plan into his or her lifestyle? Second, is it appropriate for diabetes management? Third, does it encourage healthful eating?
To discuss feasibility, the food and meal plan is reviewed with the patient in terms of general food intake. Timing of meals and snacks and approximate portion sizes and types of foods are discussed. Calorie levels are only approximate and adjustments in calories can be made during follow-up visits. A meal-planning approach can be selected later that will assist the patient in making his or her own food choices. At this point it needs to be determined whether this meal plan is reasonable.
To determine the appropriateness of the meal plan for diabetes management, distribution of the meals or snacks must be assessed along with the types of medications prescribed and treatment goals. For patients with T2DM receiving MNT alone or MNT with glucose-lowering medications, often the meal plan begins with three or four carbohydrate servings per meal for adult women and four or five for adult men and, if desired, one or two for a snack. Results of blood glucose monitoring before the meal and 2 hours after the meal, plus feedback from the patient, are used to assess if these recommendations are feasible and realistic and to determine if target glucose goals are being achieved.
For patients who require insulin, the timing of eating is important because insulin must be synchronized with food consumption (see “Medications” earlier in the chapter). If the eating pattern is determined first, an insulin regimen can be selected that will fit with it. To prevent overnight hypoglycemia, some patients may require a bedtime snack. The best way to ensure that the meal plan encourages healthful eating is to encourage patients to eat a variety of foods from all the food groups. The Dietary Guidelines for Americans, with its suggested number of servings from each food group, can be used to compare the patient’s meal plan with the nutrition recommendations for all Americans (see Chapter 12).
Nutrition Education and Counseling
Implementation of MNT begins with the RD selecting from a variety of interventions (reduced energy and fat intake, carbohydrate counting, simplified meal plans, healthy food choices, individualized meal planning strategies, exchange lists, insulin-to-carbohydrate ratios, and physical activity and behavioral strategies) (ADA, 2008). All of these interventions have been shown to lead to improved metabolic outcomes. Furthermore, nutrition education and counseling must be sensitive to the personal needs, willingness to change, and ability to make changes of the individual with diabetes. No single meal-planning approach has been shown to be more effective than any other, and the meal-planning approach selected should allow individuals with diabetes to select appropriate foods for meals and snacks.
A popular approach to meal planning is carbohydrate counting. It can be used as a basic meal-planning approach or for more intensive management. Carbohydrate-counting educational tools are based on the concept that after eating it is the carbohydrate in foods that is the major predictor of postprandial blood glucose levels. One carbohydrate serving contributes 15 g of carbohydrates. Basic carbohydrate counting emphasizes the following topics: basic facts about carbohydrates, primary food sources of carbohydrate, average portion sizes and the importance of consistency and accurate portions, amount of carbohydrates that should be eaten, and label reading. Advanced carbohydrate counting emphasizes the importance of record keeping, calculating insulin-to-carbohydrate ratios, and pattern management.
An important goal of nutrition counseling is to facilitate changes in existing food and nutrition-related behaviors and the adoption of new ones. The combined use of behavior change theories may potentially have a greater effect than any individual theory or technique used alone (Franz et al., 2010b). The following “five As” can guide the education and counseling sessions: ask, assess, advise, agree, and arrange. The “ask” step emphasizes the importance of questions as the RD aims to develop a relationship with the client. Motivational interviewing techniques are used initially and throughout all of the encounters. In the “assess” step, the RD evaluates the client’s readiness to change. Different intervention strategies may be needed for individuals at different stages of the change process (see Chapter 15). The “advise” step uses a client-centered framework that adapts nutrition interventions to meet the client’s needs, wants, priorities, preferences, and expectations. In the “agree” step the RD facilitates the client’s process of setting his or her own short-term goals related to nutrition, physical activity, or glucose monitoring (if appropriate) and helps outline the client’s potential methods for accomplishing lifestyle changes. In the “arrange” step, plans for follow-up are identified to evaluate responses to nutrition interventions. The patient is also given information on how to call or e-mail with questions and concerns. In making plans for the next encounter, the patient is asked to keep a 3-day or weekly food record with blood glucose–monitoring data.
Nutrition Monitoring and Evaluation
Food intake, medication, metabolic control (glycemia, lipids, and blood pressure), anthropometric measurements, and physical activity should be monitored and evaluated (ADA, 2008). Medical and clinical outcomes should be monitored after the second or third visit to determine whether the patient is making progress toward established goals. If no progress is evident, the individual and RD need to reassess and perhaps revise nutrition interventions. Blood glucose monitoring results can be used to determine whether adjustments in foods and meals will be sufficient to achieve blood glucose goals or if medication additions or adjustments need to be combined with MNT. Nutrition care must be coordinated with an interdisciplinary team.
Documentation in the patient’s medical record serves as a communication tool for members of the health care team. The medical record also serves as a legal document of what was done and not done and supports reimbursement of nutrition services billed to insurance carriers. There are many different formats available for medical record documentation. The appropriate format depends on where the RD practices and whether electronic health records are used. Regardless of the specific format, the RD can document using the ADIME content (Writing Group of the Nutrition Care Process, 2008).
Follow-Up Encounters
Successful nutrition therapy involves a process of assessment, problem solving, adjustment, and readjustment. Food records can be compared with the meal plan, which will help to determine whether the initial meal plan needs changing, and can be integrated with the blood glucose–monitoring records to determine changes that can lead to improved glycemic control.
Nutrition follow-up visits should provide encouragement and ensure realistic expectations for the patient. A change in eating habits is not easy for most people, and they become discouraged without appropriate recognition of their efforts. Patients should be encouraged to speak freely about problems they are having with food and eating patterns. Furthermore, there may be major life changes that require changes in the meal plan. Job and schedule changes, travel, illness, and other factors all have affect the meal plan.
Acute Complications
Hypoglycemia and diabetic ketoacidosis (DKA) are the two most common acute complications related to diabetes.
Hypoglycemia
A low blood glucose, or hypoglycemia (or insulin reaction), is a common side effect of insulin therapy, although patients taking insulin secretagogues can also be affected. Autonomic symptoms arise from the action of the autonomic nervous system and are often the first signs of mild hypoglycemia. Adrenergic symptoms include shakiness, sweating, palpitations, anxiety, and hunger. Neuroglycopenic symptoms, related to an insufficient supply of glucose to the brain, can also occur at similar glucose levels as autonomic symptoms but with different manifestations. The earliest signs of neuroglycopenia include a slowing down in performance and difficulty concentrating and reading. As blood glucose levels drop further, the following symptoms occur: frank mental confusion and disorientation, slurred or rambling speech, irrational or unusual behaviors, extreme fatigue and lethargy, seizures, and unconsciousness. Symptoms differ for different people but tend to be consistent from episode to episode for any one person. Several common causes of hypoglycemia are listed in Box 31-4.
In general, a blood glucose of 70 mg/dL (3.9 mmol/L) or lower should be treated immediately. Treatment of hypoglycemia requires ingestion of glucose or carbohydrate-containing food. Although any carbohydrate will raise glucose levels, glucose is the preferred treatment. Commercially available glucose tablets have the advantage of being premeasured to help prevent overtreatment. Ingestion of 15 to 20 g of glucose is an effective but temporary treatment. Initial response to treatment should be seen in approximately 10 to 20 minutes; however, blood glucose should be evaluated again in approximately 60 minutes because additional carbohydrate may be necessary (Box 31-5).
The form of carbohydrates (i.e., liquid or solid) used to treat does not make a difference. If patients are unable to swallow, administration of subcutaneous or intramuscular glucagon may be needed. Parents, roommates, and spouses should be taught how to mix, draw up, and administer glucagon so that they are properly prepared for emergency situations. Kits that include a syringe prefilled with diluting fluid are available.
SMBG is essential for prevention and treatment of hypoglycemia. Changes in insulin injections, eating, exercise schedules, and travel routines warrant increased frequency of monitoring. Some patients experience hypoglycemia unawareness, which means that they do not experience the usual symptoms of hypoglycemia. Patients need to be reminded of the need to treat hypoglycemia, even in the absence of symptoms. Short-term relaxation of glycemic targets generally assists in the correction of hypoglycemia unawareness (ADbA, 2011b).
Hyperglycemia and Diabetic Ketoacidosis
Hyperglycemia can lead to diabetic ketoacidosis (DKA), a life-threatening but reversible complication characterized by severe disturbances in carbohydrate, protein, and fat metabolism. DKA is always the result of inadequate insulin for glucose use. As a result, the body depends on fat for energy, and ketones are formed. Acidosis results from increased production and decreased use of acetoacetic acid and 3-β-hydroxybutyric acid from fatty acids. These ketones spill into the urine; hence the reliance on testing for ketones.
DKA is characterized by elevated blood glucose levels (greater than 250 mg/dL but generally less than 600 mg/dL) and the presence of ketones in the blood and urine. Symptoms include polyuria, polydipsia, hyperventilation, dehydration, the fruity odor of ketones, and fatigue. SMBG, testing for ketones, and medical intervention can all help prevent DKA. If left untreated, DKA can lead to coma and death. Treatment includes supplemental insulin, fluid and electrolyte replacement, and medical monitoring. Acute illnesses such as flu, colds, vomiting, and diarrhea, if not managed appropriately, can lead to the development of DKA. Patients need to know the steps to take during acute illness to prevent DKA (Box 31-6). During acute illness, oral ingestion of approximately 150 to 200 g of carbohydrates per day (45 to 50 g every 3 to 4 hours) should be sufficient, along with medication adjustments, to keep glucose in the goal range and to prevent starvation ketosis (ADbA, 2008).
Fasting hyperglycemia is a common finding in persons with diabetes. The amount of insulin required to normalize blood glucose levels during the night is less in the predawn period (from 1:00 to 3:00 AM) than at dawn (4:00 to 8:00 AM). The increased need for insulin at dawn causes a rise in fasting blood glucose levels referred to as the dawn phenomenon. It results if insulin levels decline between predawn and dawn or if overnight hepatic glucose output becomes excessive as is common in T2DM. To identify the dawn phenomenon, blood glucose levels are monitored at bedtime and at 2:00 to 3:00 AM. With the dawn phenomenon, predawn blood glucose levels will be in the low range of normal but not in the hypoglycemic range. For patients with T2DM, metformin is often used because it decreases hepatic glucose output. For persons with T1DM, administering insulin that does not peak at 1:00 to 3:00 AM such as a long-acting insulin should be considered.
Hypoglycemia followed by “rebound” hyperglycemia is called the Somogyi effect. This phenomenon originates during hypoglycemia with the secretion of counterregulatory hormones (glucagon, epinephrine, growth hormone, and cortisol) and is usually caused by excessive exogenous insulin doses. Hepatic glucose production is stimulated, thus raising blood glucose levels. If rebound hyperglycemia goes unrecognized and insulin doses are increased, a cycle of overinsulinization may result. Decreasing evening insulin doses or, as for the dawn phenomenon, taking a long-acting insulin should be considered.
Long-Term Complications
Long-term complications of diabetes include macrovascular diseases, microvascular diseases, and neuropathy. Macrovascular diseases involve diseases of large blood vessels; microvascular diseases associated with diabetes involve the small blood vessels and include nephropathy and retinopathy. In contrast, diabetic neuropathy is a condition characterized by damage to the nerves. MNT is important in managing several long-term complications of diabetes. Nutrition therapy is also a major component in reducing risk factors for chronic complications, especially those related to macrovascular disease.
Macrovascular Diseases
Insulin resistance, which may precede the development of T2DM and macrovascular disease by many years, induces numerous metabolic changes known as the metabolic syndrome (see Chapters 9 and 32). It is characterized by intraabdominal obesity or the android distribution of adipose tissue (waist circumference greater than 102 cm [40 in] in men and greater than 88 cm [35 in] in women) and is associated with dyslipidemia, hypertension, glucose intolerance, and increased prevalence of macrovascular complications. Other risk factors include genetics, smoking, sedentary lifestyle, high-fat diet, renal failure, and microalbuminuria.
Macrovascular diseases, including CHD, peripheral vascular disease, and cerebrovascular disease are more common, tend to occur at an earlier age, and are more extensive and severe in people with diabetes. Persons with diabetes have the same CVD risk equivalent as persons with preexisting CVD and no diabetes (Buse et al., 2007). Furthermore, in women with diabetes the increased risk of mortality from heart disease is greater than in men, in contrast to the nondiabetic population, in which heart disease mortality is greater in men than in women.
Dyslipidemia
Patients with diabetes have an increased prevalence of lipid abnormalities that contribute to higher rates of CVD. In T2DM the prevalence of an elevated cholesterol level is approximately 28% to 34%. Approximately 5% to 14% of patients with T2DM have high triglyceride levels; also, lower HDL cholesterol levels are common. Persons with T2DM typically have smaller, denser LDL particles, which increase atherogenicity even if the total LDL cholesterol level is not significantly elevated. Lifestyle intervention, including MNT, increased physical activity, weight loss, and smoking cessation should always be implemented. MNT should focus on the reduction of saturated and trans-fatty acids and cholesterol (see Chapter 33).
Hypertension
Hypertension is a common comorbidity of diabetes, with approximately 73% of adults with diabetes having blood pressure of 130/80 mm Hg or higher or using prescription medications for hypertension (CDC, 2007). Treatment of hypertension in persons with diabetes should be vigorous to reduce the risk of macrovascular and microvascular disease. Blood pressure should be measured at every routine visit with a goal for blood pressure control of less than 130/80 mm Hg. Patients with systolic blood pressure of 130 to 139 mm Hg or a diastolic blood pressure of 80 to 89 mm Hg should be given MNT for hypertension (see Chapter 33).
Microvascular Diseases
In the United States and Europe diabetic nephropathy has become the most common single cause of end-stage renal disease (ESRD), accounting for approximately 40% of new cases. Approximately 20% to 40% of patients with diabetes develop evidence of nephropathy, but in T2DM a considerably smaller number progress to ESRD. However, because of the much greater prevalence of T2DM, such patients constitute more than half of the patients with diabetes currently starting on dialysis.
The earliest clinical evidence of nephropathy is the appearance of low but abnormal urine albumin levels (30 to 299 mg/24 hr), referred to as microalbuminuria or incipient nephropathy. Microalbuminuria is also a marker of increased CVD risk. Without specific interventions, progression to overt nephropathy or clinical albuminuria (300 mg/24 hr or more) occurs over a period of years. An annual screening for microalbuminuria should be performed in patients who have had T1DM for more than 5 years, and in all patients with T2DM at diagnosis and during pregnancy (ADbA, 2010b). The preferred screening method is by measurement of albumin-to-creatinine ratio in a random spot collection. Two of three tests within a 3 to 6 month period should be abnormal before a patient is designated as having microalbuminuria. Serum creatinine should be measured at least annually in all adults with diabetes regardless of the degree of urine albumin excretion. The serum creatinine is used to estimate glomerular filtration rate (GFR) and stage the level of chronic kidney disease, if present. Studies have found decreased GFR in the absence of increased urine albumin excretion in a substantial percentage of adults with diabetes.
Although diabetic nephropathy cannot be cured, the clinical course of the disease can be modified. To reduce the risk or slow the progression of nephropathy, glucose and blood pressure control should be optimized. In the treatment of both microalbuminuria and macroalbuminuria, either angiotensin-converting enzyme inhibitors or angiotensin receptor blockers should be used, except during pregnancy. If one class is not tolerated, the other should be substituted, and their combination will decrease albuminuria more than use of either agent alone (ADbA, 2011b).
Research on low-protein diets delaying the progression of renal disease has been controversial. In eight trials with duration greater than 6 months, the low-protein diets (prescribed 0.6 g/kg/day; actual intake 0.9 g/kg/day) compared with usual protein diets (1.3 g/kg/day) were not significantly associated with a change in GFR or creatinine clearance rate, but did result in a decline in urinary protein excretion (Pan et al., 2008).
The ADA EBNPG recommends a protein intake of less than 1 g/kg/day for persons with diabetic nephropathy. Studies implementing lower-protein diets in the management of diabetic nephropathy are inconclusive. For persons with late-stage diabetic nephropathy, hypoalbuminemia (an indicator of malnutrition) and energy intake must be monitored and changes in protein and energy intake made to correct deficits. A protein intake of approximately 0.7 g/kg/day has been associated with hypoalbuminemia, whereas a protein intake of approximately 0.9 g/kg/day has not (ADA, 2008). With microalbuminuria there may be additional benefits in lowering phosphorus to 500 to 1000 mg/day along with the low-protein diet. Although several studies have explored the potential of plant versus animal protein, the data are inconclusive (see Chapter 36).
Retinopathy
Diabetic retinopathy is estimated to be the most frequent cause of new cases of blindness among adults 20 to 74 years of age. Glaucoma, cataracts, and other disorders of the eye also occur earlier and more frequently with diabetes (ADbA, 2011b). Laser photocoagulation surgery can reduce the risk of further vision loss but usually does not restore lost vision—thus a screening program to detect diabetic retinopathy is important. Adults and adolescents with T1DM should have an initial dilated and comprehensive eye examination by an ophthalmologist or optometrist within 5 years after the onset of diabetes and patients with T2DM should be examined shortly after the diagnosis of diabetes. Subsequent examinations for both groups should be done annually. Less frequent examinations may be considered (every 2 to 3 years) if the eye examination is normal (ADbA, 2011b).
There are three stages of diabetic retinopathy. The early stage of nonproliferative diabetic retinopathy (NPDR) is characterized by microaneurysms, a pouchlike dilation of a terminal capillary, lesions that include cotton-wool spots (also referred to as soft exudates), and the formation of new blood vessels as a result of the great metabolic need of the retina for oxygen and other nutrients supplied by the bloodstream. As the disease progresses to the middle stages of moderate, severe, and very severe NPDR, gradual loss of the retinal microvasculature occurs, resulting in retinal ischemia. Extensive intraretinal hemorrhages and microaneurysms are common reflections of increasing retinal nonperfusion.
The most advanced stage, termed proliferative diabetic retinopathy, is the final and most vision-threatening stage of diabetic retinopathy. It is characterized by the onset of ischemia-induced new vessel proliferation at the optic disk or elsewhere in the retina. The new vessels are fragile and prone to bleeding, resulting in vitreous hemorrhage. With time the neovascularization tends to undergo fibrosis and contraction, resulting in retinal traction, retinal tears, vitreous hemorrhage, and retinal detachment. Diabetic macular edema, which involves thickening of the central (macular) portion of the retina, and glaucoma, in which fibrous scar tissue increases intraocular pressure, are other clinical findings in retinopathy.
Neuropathy
Chronic high levels of blood glucose are also associated with nerve damage and 60% to 70% of people with diabetes have mild to severe forms of nervous system damage (CDC, 2007). Intensive treatment of hyperglycemia reduces the risk and slows progression of diabetic neuropathy, but does not reverse neuronal loss. Peripheral neuropathy usually affects the nerves that control sensation in the feet and hands. Autonomic neuropathy affects nerve function controlling various organ systems. Cardiovascular effects include postural hypotension and decreased responsiveness to cardiac nerve impulses, leading to painless or silent ischemic heart disease. Sexual function may be affected, with impotence the most common manifestation.
Damage to nerves innervating the gastrointestinal tract can cause a variety of problems. Neuropathy can be manifested in the esophagus as nausea and esophagitis, in the stomach as unpredictable emptying, in the small bowel as loss of nutrients, and in the large bowel as diarrhea or constipation.
Gastroparesis is characterized by delayed gastric emptying in the absence of mechanical obstruction of the stomach (Camilleri, 2007). Symptoms are reported by 5% to 12% of persons with diabetes. It results in delayed or irregular contractions of the stomach, leading to various gastrointestinal symptoms such as feelings of fullness, bloating, nausea, vomiting, diarrhea, or constipation. Gastroparesis should be suspected in individuals with erratic glucose control.
The first step in management of patients with neuropathy should be to aim for stable and optimal glycemic control. MNT involves minimizing abdominal stress. Small, frequent meals may be better tolerated than three full meals a day; and these meals should be low in fiber and fat. If solid foods are not well tolerated, liquid meals may need to be recommended. For patients using insulin, as much as possible, the timing of insulin administration should be adjusted to match the usually delayed nutrient absorption. Insulin injections may even be required after eating. Frequent blood glucose monitoring is important to determine appropriate insulin therapy.
Prokinetic agents most commonly used to treat gastroparesis include metoclopramide and erythromycin. Antiemetic agents may be helpful for the relief of symptoms. In very severe cases, generally with unintentional weight loss, a feeding tube is placed in the small intestine to avoid the stomach. Gastric electric stimulation with electrodes surgically implanted in the stomach may be used when medications fail to control nausea and vomiting.
Hypoglycemia of Nondiabetic Origin
Hypoglycemia of nondiabetic origin has been defined as a clinical syndrome with diverse causes in which low levels of plasma glucose eventually lead to neuroglycopenia. Hypoglycemia means low (hypo) blood glucose (glycemia). Normally the body is remarkably adept at maintaining fairly steady blood glucose levels—usually between 60 and 100 mg/dL (3.3 to 5.6 mmol/L), despite the intermittent ingestion of food. Maintaining normal levels of glucose is important because body cells, especially the brain and central nervous system, must have a steady and consistent supply of glucose to function properly. Under physiologic conditions the brain depends almost exclusively on glucose for its energy needs. Even with hunger, either because it has been many hours since food was eaten or because the last meal was small, blood glucose levels remain fairly consistent.
Pathophysiology
In a small number of people, blood glucose levels drop too low. Symptoms are often felt when blood glucose is below 65 mg/dL (3.6 mmol/L). If the brain and nervous system are deprived of the glucose they need to function, symptoms such as sweating, shaking, weakness, hunger, headaches, and irritability can develop. Symptoms of hypoglycemia have been recognized at plasma glucose levels of approximately 60 mg/dL, and impaired brain function has occurred at levels of approximately 50 mg/dL.
Hypoglycemia can be difficult to diagnose because these typical symptoms can be caused by many different health problems. For example, adrenaline (epinephrine) released as a result of anxiety and stress can trigger the symptoms similar to those of hypoglycemia. The only way to determine whether hypoglycemia is causing these symptoms is to measure blood glucose levels while an individual is experiencing the symptoms. Hypoglycemia can best be defined by the presence of three features known as the Whipple triad: (1) a low plasma or blood glucose level, (2) symptoms of hypoglycemia at the same time, and (3) amelioration of the symptoms by correction of the hypoglycemia.
A fairly steady blood glucose level is maintained by the interaction of several mechanisms. After eating, food is broken down into glucose and enters the bloodstream. As blood glucose levels rise, the pancreas responds by releasing the hormone insulin, which allows glucose to leave the bloodstream and enter various body cells, where it fuels the body’s activities. Glucose is also taken up by the liver and stored as glycogen for later use.
When glucose concentrations from the last meal decline, the body goes from a “fed” to a “fasting” state. Insulin levels decrease, which keeps the blood glucose levels from falling too low. Stored glucose is released from the liver back into the bloodstream with the help of glucagon from the pancreas. Normally the body’s ability to balance glucose, insulin, and glucagon (and other counterregulatory hormones) keeps glucose levels within the normal range. Glucagon provides the primary defense against hypoglycemia; without it, full recovery does not occur. Epinephrine is not necessary for counterregulation when glucagon is present. However, in the absence of glucagon, epinephrine has an important role.
Types of Hypoglycemia
Two types of hypoglycemia can occur in people who do not have diabetes. If blood glucose levels fall below normal limits within 2 to 5 hours after eating, this is postprandial (reactive) hypoglycemia. It can be caused by an exaggerated or late insulin response caused by either insulin resistance or elevated GLP-1; alimentary hyperinsulinism; renal glycosuria; defects in glucagon response; high insulin sensitivity; rare syndromes such as hereditary fructose intolerance, galactosemia, leucine sensitivity; or a rare β-cell pancreatic tumor (insulinoma), causing blood glucose levels to drop too low. Alimentary hyperinsulinism is common after gastric surgery, associated with rapid delivery of food to the small intestine, rapid absorption of glucose, and exaggerated insulin response. These patients respond best to multiple, frequent feedings.
The ingestion of alcohol after a prolonged fast or the ingestion of large amounts of alcohol and carbohydrates on an empty stomach (“gin-and-tonic” syndrome) may also cause hypoglycemia within 3 to 4 hours in some healthy persons.
Idiopathic reactive hypoglycemia is characterized by normal insulin secretion but increased insulin sensitivity and, to some extent, reduced response of glucagon to acute hypoglycemia symptoms. The increase in insulin sensitivity associated with a deficiency of glucagon secretion leads to hypoglycemia late postprandially. Idiopathic reactive hypoglycemia has been inappropriately overdiagnosed by both physicians and patients, to the point that some physicians doubt its existence. Although rare, it does exist but can be documented only in persons with hypoglycemia that occurs spontaneously and who meet the criteria of Whipple triad.
Fasting hypoglycemia, or postabsorptive hypoglycemia, is often related to an underlying disease. This food-deprived hypoglycemia may occur in response to having gone without food for 8 hours or longer and can be caused by conditions that upset the body’s ability to balance blood glucose. These include eating disorders and other serious underlying medical conditions, including hormone deficiency states (e.g., hypopituitarism, adrenal insufficiency, catecholamine or glucagon deficiency), acquired liver disease, renal disease, certain drugs (e.g., alcohol, propranolol, salicylate), insulinoma (of which most are benign, but 6% to 10% can be malignant), and other nonpancreatic tumors. Taking high doses of aspirin may also lead to fasting hypoglycemia. Factitious hypoglycemia, or self-administration of insulin or sulfonylurea in persons who do not have diabetes, is a cause as well. Symptoms related to fasting hypoglycemia tend to be particularly severe and can include a loss of mental acuity, seizures, and unconsciousness. If the underlying problem can be resolved, hypoglycemia is no longer a problem.
Diagnostic Criteria
One of the criteria used to confirm the presence of hypoglycemia is a blood glucose level of less than 50 mg/dL (2.8 mmol/L.) Previously the OGTT test was the standard test for this condition; however, this test is no longer used. Recording fingerstick blood glucose measurements during spontaneous, symptomatic episodes at home is used to establish the diagnosis. An alternative method is to perform a glucose test in a medical office setting, in which case the patient is given a typical meal that has been documented in the past to lead to symptomatic episodes; the Whipple triad can be confirmed if symptoms occur. If blood glucose levels are low during the symptomatic period and if the symptoms disappear on eating, hypoglycemia is probably a responsible diagnosis. It is essential to make a correct diagnosis in patients with fasting hypoglycemia because the implications are serious.
Management of Hypoglycemia
The management of hypoglycemic disorders involves two distinct components: (1) relief of neuroglycopenic symptoms by restoring blood glucose concentrations to the normal range, and (2) correction of the underlying cause. The immediate treatment is to eat foods or beverages containing carbohydrates. As the glucose from the breakdown of carbohydrates is absorbed into the bloodstream, it increases the level of glucose in the blood and relieves the symptoms. If an underlying problem is causing hypoglycemia, appropriate treatment of this disease or disorder is essential.
Almost no research has been done to determine what type of food-related treatment is best for the prevention of hypoglycemia. Traditional advice has been to avoid foods containing sugars and to eat protein- and fat-containing foods. Recent research on the GI and sugars has raised questions about the appropriateness of restricting only sugars because these foods have been reported to have a lower GI than many of the starches that were encouraged in the past. Restriction of sugars may contribute to a decreased intake in total carbohydrates, which may be more important than the source of the carbohydrates.
The goal of treatment is to adopt eating habits that will keep blood glucose levels as stable as possible (International Diabetes Center, 2007). To stay symptom free, it is important for individuals to eat five to six small meals or snacks per day. Doing this provides manageable amounts of glucose to the body. Recommended guidelines are listed in Box 31-7.
Patients with hypoglycemia may also benefit from learning carbohydrate counting and, to prevent hypoglycemia, eating three to four carbohydrate servings (15 g of carbohydrate per serving) at meals and one to two for snacks (see Appendix 34). Foods containing protein that are also low in saturated fat can be eaten at meals or with snacks. These foods are expected to have minimum effect on blood glucose levels and can add extra food for satiety and calories. However, because both protein and carbohydrate stimulate insulin release, a moderate intake may be advisable.
 Clinical Scenario
Debra Smith, a 45-year-old women with known diagnosis of T2DM for 3 years, has been referred for nutrition counseling. She has not had a medical check-up for 2 years, although she reports continuing to take metformin. She is on no lipid or blood pressure medications. She returns at this time with a primary complaint of chronic fatigue. She states she hasn’t returned for any follow-up visits because the only advice she gets is to lose weight, which she has tried to do numerous times without success. Food and nutrition history includes a usual intake of about 2,300 calories and frequent skipping of meals, especially breakfast. She eats few fruits and vegetables and because she has been told to avoid carbohydrate foods, she eats 5-6 oz of meat per meal, contributing to a high saturated fat intake. She drinks a glass of wine only on special occasions. She is willing to try to make some changes in her eating habits. She also reports being physically inactive but is willing to start a walking program.
Nutrition Diagnostic Statements
Food- and nutrition-related knowledge deficit related to no education or counseling for appropriate medical nutrition therapy as evidenced by food history of inappropriate food choices despite belief that she is making appropriate choices.
Inconsistent carbohydrate intake related to lack of knowledge of appropriate food choices as evidenced by food history with either limited or excessive carbohydrate food choices at meals.
Nutrition prescription: Carbohydrate counting beginning with 3 to 4 carbohydrate servings per meal
Nutrition education: Update patient’s knowledge of appropriate nutrition therapy for diabetes beginning with glycemic outcomes; at follow-up visits address cardioprotective nutrition interventions; encourage physical activity starting with short walks
Nutrition counseling: Collaborate with patient to identify behavior change goals
American Association of Diabetes Educators
http://www.diabeteseducator.org/
ADA Evidence Analysis Library:
http://www.adaevidencelibrary.com
ADA Diabetes Type 1 and Type 2 for Adults Evidence-Based Nutrition Practice Guidelines:
http://www.adaevidencelibrary.com/topic.cfm?cat=3251
ADA Gestational Diabetes Mellitus Evidence-Based Nutrition Practice Guidelines:
http://www.adaevidencelibrary.com/topic.cfm?format_tables=0&cat=3731
Diabetes Care and Education Practice Group
DCE Patient Education Handouts:
http://www.dce.org/pub_publications/education.asp
International Diabetes Center, Minneapolis, Minnesota
Resources for Healthcare Professionals:
National Diabetes Education Program
National Institute of Diabetes and Digestive Kidney Diseases
References
American Diabetes Association (ADbA). Diagnosis and classification of diabetes mellitus (Position Statement). Diabetes Care. 2011;34(Suppl 1):S63.
American Diabetes Association (ADbA). Standards of medical care in diabetes—2011 (Position Statement). Diabetes Care. 2011;34(Suppl 1):S11.
American Diabetes Association (ADbA). Nutrition recommendations and interventions for diabetes (Position Statement). Diabetes Care. 2008;31(Suppl 1):S61.
American Dietetic Association (ADA). Diabetes type 1 and type 2 for adults evidence-based nutrition practice guidelines. Accessed 2 June 2010 from http://www.adaevidencelibrary.com/topic.cfm?=3251&auth=1, 2008.
American Dietetic Association (ADA). Gestational diabetes mellitus (GDM) evidence-based nutrition practice guidelines. Accessed 2 June 2010 from http://www.adaevidencelibrary.com/topic.cfm?format_tables=0&cat=3731, 2009.
American Dietetic Association (ADA). Effectiveness of MNT for hypertension. Accessed 2 June 2010 from http://www.adaevidencelibrary.com/conclusion.cfm?conclusion_statement_id=251204, 2009.
American Dietetic Association (ADA). International dietetics & nutrition terminology (IDNT) reference manual. standardized language for the nutrition care process, ed 3. Chicago: American Dietetic Association; 2011.
Balk, EM, et al. Effect of chromium supplementation on glucose metabolism and lipids: a systematic review of randomized controlled trials. Diabetes Care. 2007;30:2154.
Brand-Miller, JC, et al. Glycemic index, postprandial glycemia, and the shape of the curve in healthy subjects: analysis of a database of more than 1000 food. Am J Clin Nutr. 2009;89:97.
Buse, JB, et al. Primary prevention of cardiovascular diseases in people with diabetes mellitus: a scientific statement from the American Heart Association and the American Diabetes Association. Diabetes Care. 2007;30:162.
Camilleri, M. Diabetic gastroparesis. N Engl J Med. 2007;356:820.
Centers for Disease Control and Prevention (CDC). National diabetes fact sheet: general information and national estimates on diabetes in the United States, 2007. Atlanta, Ga: U.S. Department of Health and Human Services, Centers for Disease Control and Prevention; 2007.
Diabetes Control and Complications Trial/Epidemiology of Diabetes Interventions and Complications (DCCT/EDIC) Study Research Group. Intensive diabetes treatment and cardiovascular disease in patients with type 1 diabetes. N Engl J Med. 2005;353:2643.
Diabetes Prevention Program Research Group. 10-year follow-up of diabetes incidence and weight loss in the Diabetes Prevention Program Outcome Study. Lancet. 2009;374:1677.
Fernandes, G, et al. Glycemic index of potatoes commonly consumed in North America. J Am Diet Assoc. 2005;105:557.
Franz, MJ, et al. Evidence-based nutrition practice guidelines for diabetes and scope and standards of practice. J Am Diet Assoc. 2008;108:S52.
Franz, MJ, et al. The American Dietetic Association evidence-based nutrition practice guidelines for type 1 and type 2 diabetes in adults: evidence and recommendations. J Am Diet Assoc. 110, December, 2010.
Franz, MJ, et al. American Dietetic Association pocket guide to lipid disorders, hypertension, diabetes, and weight management. Chicago, Il: American Dietetic Association; 2010.
Guidone, C, et al. Mechanisms of recovery from type 2 diabetes after malabsorptive bariatric surgery. Diabetes. 2006;55:2025.
Institute of Medicine. Dietary reference intakes: energy, carbohydrate, fiber, fat, fatty acids, cholesterol, protein, and amino acids. Washington, DC: National Academies Press; 2002.
International Diabetes Center. Reactive and fasting hypoglycemia. Minneapolis: International Diabetes Center; 2007.
Kaufman, FR. Medical management of type 1 diabetes, ed 5. Alexandria, VA: American Diabetes Association; 2008.
Li, GP, et al. The long-term effect of lifestyle interventions to prevent diabetes in the China Da Qing Diabetes Prevention Study: a 20-year follow-up study. Lancet. 2008;371:1783.
Lindström, J, et al. Sustained reduction in the incidence of type 2 by lifestyle intervention: follow-up of the Finnish Diabetes Prevention Study. Lancet. 2006;368:1673.
Ma, Y, et al. A randomized clinical trial comparing low-glycemic index versus ADA dietary education among individuals with type 2 diabetes. Nutrition. 2008;24:45.
Mayer-Davis, EJ, et al. Towards understanding of glycemic index and glycemic load in habitual diet: associations with glycemia in the Insulin Resistance Study. Br J Nutr. 2006;95:397.
Nathan, DM, et al. Medical management of hyperglycemia in type 2 diabetes: a consensus algorithm for the initiation and adjustment of therapy. Diabetes Care. 2009;32:193.
Pan, Y, et al. Low-protein diet for diabetic nephropathy: a meta-analysis of randomized controlled trials. Am J Clin Nutr. 2008;88:660.
Rosario, PWS, et al. Comparison of clinical and laboratory characteristics between adult-onset type 1 diabetes and latent autoimmune diabetes in adults. Diabetes Care. 2005;28:1803.
Rosenstock, J, et al. Reduced hypoglycemia risk with insulin glargine: a meta-analysis comparing insulin glargine with human NPH insulin in type 2 diabetes. Diabetes Care. 2005;28:950.
Silverstein, J, et al. Care of children and adolescents with type 1 diabetes: a statement of the American Diabetes Association. Diabetes Care. 2005;28:186.
Stuebe, AM, et al. Duration of lactation and incidence of type 2 diabetes. JAMA. 2005;294:2601.
U.S. Department of Health and Human Services. 2008 physical activity guidelines for Americans. Accessed from http://www.health.gov/paguidelines/, 2008.
Van Horn, L, et al. The evidence for dietary prevention and treatment of cardiovascular disease. J Am Diet Assoc. 2008;108:287.
Vega-López, S, et al. Interindividual variability and intra-individual reproducibility of glycemic index values for commercial white bread. J Am Diet Assoc. 2007;30:1412.
Wheeler, ML, et al. Choose your foods: exchange lists for diabetes, sixth edition, 2008: description and guidelines for use. J Am Diet Assoc. 2008;108:883.
Wilson, JB, Pories, WS. Durable remission of diabetes after bariatric surgery: what is the underlying pathway. Insulin. 2010;5:46.
Wolever, TMS, et al. The Canadian Trial of Carbohydrates in Diabetes, a 1-y controlled trial of low-glycemic index dietary carbohydrate in type 2 diabetes: no effect on glycated hemoglobin but reduction in C-reactive protein. Am J Clin Nutr. 2008;87:114.
Writing Group of the Nutrition Care Process/Standardized Language Committee. nutrition care process part ii: using the international dietetics and nutrition terminology to document the nutrition care process. J Am Diet Assoc. 2008;108:1287.