Nutrition in Childhood
The period that begins after infancy and lasts until puberty is often referred to as the latent or quiescent period of growth—a contrast to the dramatic changes that occur during infancy and adolescence. Although physical growth may be less remarkable and proceed at a steadier pace than it did during the first year, these preschool and elementary school years are a time of significant growth in the social, cognitive, and emotional areas.
Growth and Development
The rate of growth slows considerably after the first year of life. In contrast to the usual tripling of birth weight that occurs in the first 12 months, another year passes before the birth weight quadruples. Likewise, birth length increases by 50% in the first year but does not double until approximately the age of 4 years. Increments of change are small compared with those of infancy and adolescence; weight typically increases an average of 2 to 3 kg ( to
to  lb) per year until the child is 9 or 10 years old. Then the rate increases, signaling the approach of puberty. Height increase increments average 6 to 8 cm (
 to
to  inches) per year from 2 years of age until puberty.
Growth is generally steady and slow during the preschool and school age years, but it can be erratic in individual children, with periods of no growth followed by growth spurts. These patterns usually parallel similar changes in appetite and food intake. For parents, periods of slow growth and poor appetite can cause anxiety, leading to mealtime struggles.
Body proportions of young children change significantly after the first year. Head growth is minimal, trunk growth slows substantially, and limbs lengthen considerably, all of which create more mature body proportions. Walking and increased physical activity of the now erect child lead to the legs straightening and increased muscle strength in the abdomen and back.
The body composition of preschool and school age children remains relatively constant. Fat gradually decreases during the early childhood years, reaching a minimum between 4 and 6 years of age. Children then experience the adiposity rebound, or increase in body fatness in preparation for the pubertal growth spurt. Earlier adiposity rebound has been associated with increased adult body mass index (BMI) (Williams, 2009). A BMI at an “end” of the charts (e.g., less than 3rd or greater than 97th percentiles) requires careful evaluation to describe the degree of underweight or obesity (Flegal, 2009). Sex differences in body composition become increasingly apparent—boys have more lean body mass per centimeter of height than girls. Girls have a higher percentage of weight as fat than boys, even in the preschool years, but these differences in lean body mass and fat do not become significant until adolescence.
Assessing Growth
A complete nutritional assessment includes the collection of anthropometric data. This includes length or stature, weight, and weight-for-length or BMI, all of which are plotted on the Centers for Disease Control and Prevention (CDC) growth charts (see Appendixes 9 through 16). Other measurements that are less commonly used but that provide estimates of body composition include upper-arm circumference and triceps or subscapular skin folds. Care should be taken to use standardized equipment and techniques for obtaining and plotting growth measurements. Charts designed for birth to 36 months of age are based on length measurements and nude weights, whereas charts used for 2- to 20-year-olds are based on stature (standing height) and weight with light clothing and without shoes (see Chapter 6).
The proportion of weight to length or height is a critical element of growth assessment. This parameter is determined by plotting the weight-for-length on the WHO birth- to 24-month growth charts or calculating BMI and plotting it on the 2- to 20-year-old CDC growth charts. Growth measurements obtained at regular intervals provide information about an individual’s growth pattern. One-time measurements do not allow for interpretation of growth status. Growth channels are not well established until after 2 years of age. Children generally maintain their heights and weights in the same growth channels during the preschool and childhood years, although rates of growth can vary within a selected period.
Regular monitoring of growth enables problematic trends to be identified early and intervention initiated so that long-term growth is not compromised. Weight that increases rapidly and crosses growth channels suggests the development of obesity. Lack of weight gain or loss of weight over a period of months may be a result of undernutrition, an acute illness, an undiagnosed chronic disease, or significant emotional or family problems. However, many children are evaluated by health care professionals only when they are ill, so growth evaluation and development may not be a focus of care. Figure 18-1 demonstrates the changes that can occur in growth parameters.

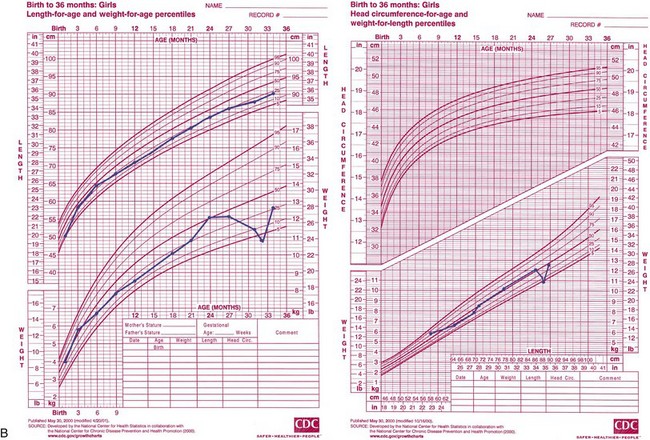
FIGURE 18-1 A, Growth chart and BMI chart for an 8-year-old boy who gained excessive weight after having leg surgery and being immobilized in a body cast for 2 months. The surgery and immobilization were followed by a long period of stress caused by family problems. At the age of 11 years, he became involved in a weight management program.
B, Growth charts for a 2-year-old girl who experienced significant weight loss during a prolonged period of diarrhea and feeding problems. After being diagnosed with celiac disease, she began following a gluten-free diet and entered a period of catch-up growth. (Source of growth charts only: The National Center for Health Statistics in collaboration with the National Center for Chronic Disease Prevention and Health Promotion, 2000.)
Catch-Up Growth
A child who is recovering from an illness or undernutrition and whose growth has slowed or ceased experiences a greater than expected rate of recovery. This recovery is referred to as catch-up growth, a period during which the body strives to return to the child’s normal growth channel. The degree of growth suppression is influenced by the timing, severity, and duration of the precipitating cause, such as a severe illness or prolonged nutritional deprivation.
Initial studies supported the thesis that malnourished infants who did not experience immediate catch-up growth would have permanent growth retardation. However, studies of malnourished children from developing countries who subsequently received adequate nourishment, as well as reports of children who were malnourished because of chronic disease such as celiac disease or cystic fibrosis, have shown that these children caught up to their normal growth channels after the first year or two of life.
The nutritional requirements for catch-up growth depend on whether the child has overall stunted growth (both height and weight are proportionally low) and is chronically malnourished, or is primarily wasted, meaning that the weight deficit exceeds the height deficit. A chronically malnourished child may not be expected to gain more than 2-3 g/kg/day, whereas as a child who is primarily wasted may gain as much as 20 g/kg/day.
Nutrient requirements, especially for energy and protein, depend on the rate and stage of catch-up growth. For instance, more protein and energy are needed during the initial period of very rapid weight gain and for those in whom lean tissue is the major component of the weight gain. In addition to energy, other nutrients are important, including vitamin A, iron, and zinc.
Current growth parameters are used to evaluate the child’s weight in relation to age and stature, and to estimate a “desirable” or goal weight. Formulas are then used to estimate the minimum and maximum energy needed for catch-up growth. After a child who is wasted catches up in weight, dietary management must change to slow the weight gain velocity and avoid excessive gain. The catch-up in linear growth peaks approximately 1 to 3 months after treatment starts, whereas weight gain begins immediately.
Nutrient Requirements
Because children are growing and developing bones, teeth, muscles, and blood, they need more nutritious food in proportion to their size than do adults. They may be at risk for malnutrition when they have a poor appetite for a long period, eat a limited number of foods, or dilute their diets significantly with nutrient-poor foods.
The dietary reference intakes (DRIs) are based on current knowledge of nutrient intakes needed for optimal health (Institute of Medicine [IOM], 2006). See inside front cover. Most data for preschool and school age children are values interpolated from data on infants and adults. The DRIs are meant to improve the long-term health of the population by reducing the risk of chronic disease and preventing nutritional deficiencies. Thus, when intakes are less than the recommended level, it cannot be assumed that a particular child is inadequately nourished.
Energy
The energy needs of healthy children are determined by basal metabolism, rate of growth, and energy expenditure of activity. Dietary energy must be sufficient to ensure growth and spare protein from being used for energy, but not allow excess weight gain. Suggested intake proportions of energy are 45% to 65% as carbohydrate, 30% to 40% as fat, and 5% to 20% as protein for 1- to 3-year-olds, with carbohydrates the same for 4- to 18-year-olds, 25% to 35% as fat, and 10% to 30% as protein (IOM, 2006).
The DRIs for estimated energy requirement (EER) are average energy requirements based on life-stage groupings for healthy individuals of normal weight. Toddlers 13 through 35 months are grouped together; for older children the EERs are divided by sex and age (3-8 years and 9-18 years.) The EER includes the total energy expenditure plus energy needed for growth (see Chapter 2). The DRIs are applied to child nutrition programs and other guidelines (IOM, 2006). See Box 18-1 for examples of determining EER for two children. On an individual basis, it can be useful to estimate energy requirements using kilocalories per kilogram of weight or per centimeter of height.
BOX 18-1 Determining Estimated Energy Requirements


 -year-old girl is 112 cm tall, weighs 20.8 kg, and has moderate activity (PA coefficient of 1.31)


Protein
The need for protein decreases from approximately 1.1 g/kg in early childhood to 0.95 g/kg in late childhood (Table 18-1). Protein intake can range from 5% to 30% of total energy depending on age. Protein deficiency is uncommon in American children, partly because of the cultural emphasis on protein foods. National surveys show that less than 3% of children fail to meet the recommended dietary allowance (Moshfegh et al., 2005). Children who are most at risk for inadequate protein intake are those on strict vegan diets; those with multiple food allergies; or who have limited food selections because of fad diets, behavioral problems, or inadequate access to food.
TABLE 18-1
Protein Dietary Reference Intakes (DRIs) for Children through Age 13 Years
| Protein | ||
| Age | Grams/Day* | Grams/Kilogram/Day |
| 1-3 yr | 13 g/day | 1.10 g/kg/day |
| 4-8 yr | 19 g/day | 0.95 g/kg/day |
| 9-13 yr | 34 g/day | 0.95 g/kg/day |
*Recommended dietary allowance for reference individual (g/day).
Adapted from Feucht S: Dietary reference intakes (DRI) review: case studies illustrating energy and protein for children and adolescents with special needs, Nutr Focus Newsletter 20:1, 2005.
Minerals and Vitamins
Minerals and vitamins are necessary for normal growth and development. Insufficient intake can cause impaired growth and result in deficiency diseases. See Chapter 3. The DRIs are listed inside the front cover.
Iron
Children between 1 and 3 years of age are at high risk for iron-deficiency anemia. The rapid growth period of infancy is marked by an increase in hemoglobin and total iron mass. National Health and Nutrition Examination Survey (NHANES) data indicate that children with prolonged bottle feeding and those of Mexican-American descent are at highest risk for iron deficiency. The reason for the association between iron deficiency and ethnicity is not clear (Brotanek et al., 2005). Recommended intakes must factor in the absorption rate and quantity of iron in foods, especially those of plant origin.
Calcium
Calcium is needed for adequate mineralization and maintenance of growing bone in children. The RDA for calcium for children 1 to 3 years old is 700 mg/day, for children 4 to 8 years it is 1000 mg/day, and for those 9 to 18 years it is 1300 mg per day (Ross et al., 2011). Actual need depends on individual absorption rates and dietary factors such as quantities of protein, vitamin D, and phosphorus. Because milk and other dairy products are primary sources of calcium, children who consume limited amounts of these foods are at risk for poor bone mineralization (Figure 18-2). Other calcium-fortified foods such as soy and rice milks and fruit juices are also good sources (see Table 3-25).

Zinc
Zinc is essential for growth; a deficiency results in growth failure, poor appetite, decreased taste acuity, and poor wound healing. Because the best sources of zinc are meat and seafood, some children may regularly have low intakes. Marginal zinc deficiency has been reported in preschool and school age children. Diagnosis may be difficult because laboratory parameters, including plasma, serum erythrocyte, hair, and urine, are of limited value in determining zinc deficiency. There is a positive influence of zinc supplementation on growth and serum zinc concentrations. Improving zinc nutrition status by food and supplementation programs has shown efficacy (see Chapter 3).
Vitamin D
Vitamin D is needed for calcium absorption and deposition of calcium in the bones, as well as prevention of cancer, autoimmune disorders, cardiovascular disease, and infectious disease. Because this nutrient is also formed from sunlight exposure on the skin, the amount required from dietary sources depends on factors such as geographic location and time spent outside.
The new DRI for vitamin D for infants is 400 IU (10 mcg) per day and for children is 600 IU (15 mcg) per day (Ross et al., 2011). Vitamin D–fortified milk is the primary source of this nutrient, and breakfast cereals and nondairy milks are often fortified with vitamin D. Dairy products such as cheese and yogurt, however, are not always made from fortified milk. It is becoming more common to measure serum 25(OH) vitamin D 25-hydroxy in children; however, there is some controversy regarding what constitutes optimal levels.
Vitamin-Mineral Supplements
Almost 40% of preschool children are given a multivitamin-mineral supplement, but this percentage usually decreases with older children (Picciano et al., 2007). Families with more education, health insurance coverage, and higher incomes generally have higher rates of supplement use, although these may not be the families who are at greatest risk for having inadequate diets. Supplements do not necessarily fulfill specific nutrient needs. For instance, although many children consume less than the recommended amount of calcium, children’s vitamin-mineral supplements typically do not contain significant amounts of calcium. Careful evaluation of each pediatric supplement is suggested because many types are available but incomplete.
Evidence shows that fluoride can help prevent dental caries. If a community’s water supply is not fluoridated, fluoride supplements are recommended from 6 months until 16 years of age. However, individual family practices should be assessed, including the child’s primary source of fluids (e.g., drinking water, juices, or other beverages) and fluoride sources from child care, school, toothpaste and mouthwash.
The AAP does not support giving healthy children routine supplements of any vitamins or minerals other than fluoride. However, children at risk for inadequate nutrition who may benefit from supplementation include those (1) with anorexia, inadequate appetite, or who consume fad diets; (2) with chronic disease (e.g., cystic fibrosis, inflammatory bowel disease, hepatic disease); (3) from deprived families or those who are abused or neglected; (4) using a dietary program to manage obesity; (5) who do not consume adequate amounts of dairy products; and (6) with failure to thrive (FTT) (American Academy of Pediatrics [AAP], 2009).
Children who routinely take a multiple vitamin or a vitamin-mineral supplement usually do not experience negative effects if the supplement contains nutrients in amounts that do not exceed the DRIs, especially the tolerable upper intake level. However, children should not take megadoses, particularly of the fat-soluble vitamins because large amounts can result in toxicity (see Chapter 3). Because many vitamin-mineral supplements look and taste like candy, parents should keep them out of reach of children to avoid excessive intake of nutrients such as iron.
Complementary nutrition therapies or herbal product use is becoming more common for children, especially those with special needs such as children with Down syndrome, autism spectrum disorder (ASD), or cystic fibrosis (Harris, 2005). Practitioners should inquire as to the use of these products and therapies in nutrition assessments, be knowledgeable about their efficacy and safety, and help families determine whether they are beneficial and how to use them (see Chapter 13).
Providing an Adequate Diet
The development of feeding skills, food habits, and nutrition knowledge parallels the cognitive development that takes place in a series of stages, each laying the groundwork for the next. Table 18-2 outlines the development of feeding skills in terms of Piaget’s theory of child psychology and development.
TABLE 18-2
Feeding, Nutrition, and Piaget’s Theory of Cognitive Development
| Developmental Period | Cognitive Characteristics | Relationships to Feeding and Nutrition |
| Sensorimotor (birth-2 yr) | Neonate progresses from automatic reflexes to a child with intentional interaction with the environment and the beginning use of symbols. | Progression involves advancing from sucking and rooting reflexes to the acquisition of self-feeding skills. Food is used primarily to satisfy hunger, as a medium to explore the environment, and as an opportunity to practice fine motor skills. |
| Preoperational (2-7 yr) | Thought processes become internalized; they are unsystematic and intuitive. Use of symbols increases. |
Eating becomes less the center of attention and is secondary to social, language, and cognitive growth. Food is described by color, shape, and quantity, but the child has only a limited ability to classify food into “groups.” |
| Reasoning is based on appearances and happenstance. The child’s approach to classification is functional and unsystematic. The child’s world is viewed egocentrically. |
Foods tend to be categorized into “like” and “don’t like.” Foods can be identified as “good for you,” but reasons why they are healthy are unknown or mistaken. |
|
| Concrete operational (7-11 yr) | The child can focus on several aspects of a situation simultaneously. | The child begins to realize that nutritious food has a positive effect on growth and health but has a limited understanding of how or why. |
| Cause-and-effect reasoning becomes more rational and systematic. | ||
| The ability to classify, reclassify, and generalize emerges. | ||
| A decrease in egocentrism permits the child to take another’s view. | Mealtimes take on a social significance. The expanding environment increases the opportunities for influences on food selection; for example, peer influence increases. |
|
| Formal operational (11 yr and beyond) | Hypothetical and abstract thought expand. | The concept of nutrients from food functioning at physiologic and biochemical levels can be understood. |
| The child’s understanding of scientific and theoretical processes deepens. | Conflicts in making food choices may be realized (i.e., knowledge of the nutritious value of foods may conflict with preferences and nonnutritive influences). |
Intake Patterns
Children are most likely to consume inadequate amounts of calcium, vitamin D, vitamin E, magnesium, and vitamin A (Moshfegh, 2009; Moshfegh et al., 2005). However, clinical signs of malnutrition in American children are rare.
Children’s food patterns have changed over the years. Although they drink less milk, more of it is low-fat or nonfat milk. The total fat as a percent of energy intake has decreased, but remains above recommendations. More energy comes from snacks, and portion sizes have increased. In addition, more food is consumed in environments other than the home (American Dietetic Association [ADA], 2008). Foods with low nutrient density (soft drinks, baked and dairy desserts, sweeteners, and salty snacks) often displace nutrient-dense foods (ADA, 2008). National food intake studies of children and adolescents indicate that most of their diets do not meet the national recommendations for food groups (ADA, 2008). Most children ages 2 to 3 years have high-quality diets; as they grow older, diet quality declines.
Like physical growth patterns, food intake patterns are not smooth and consistent. Although subjective, appetites usually follow the rate of growth and nutrient needs. By a child’s first birthday, milk consumption begins to decline. In the next year vegetable intake decreases; intakes of cereals, grain products, and sweets increase. Young children often prefer softer protein sources instead of meats that are harder to chew.
Changes in food consumption are reflected in nutrient intakes. The early preschool years show a decrease in calcium, phosphorus, riboflavin, iron, and vitamin A compared to infancy. Intakes of most other key nutrients remain relatively stable. During the early school years, a pattern of consistent and steadily increased intakes of most nutrients is seen until adolescence. In healthy children a wide variability of nutrient intake is seen at any age.
Factors Influencing Food Intake
Numerous influences, some obvious and others subtle, determine the food intake and habits of children. Habits, likes, and dislikes are established in the early years and carried through to adulthood. The major influences on food intake in the developing years include family environment, societal trends, the media, peer pressure, and illness or disease.
Family Environment
For toddlers and preschool children the family is the primary influence in the development of food habits. In young children’s immediate environment, parents and older siblings are significant models. Food attitudes of parents can be strong predictors of food likes and dislikes and diet complexity in children of primary school age. Similarities between children’s and their parents’ food preferences are likely to reflect genetic and environmental influences (Savage, 2007).
Contrary to common belief, young children do not have the innate ability to choose a balanced, nutritious diet; they can choose one only when presented with nutritious foods. A positive feeding relationship includes a division of responsibility between parents and children. The parents and other adults are to provide safe, nutritious, developmentally appropriate food as regular meals and snacks. The children decide how much, if any, they eat (Satter, 2000).
Eating together at family meals is becoming less common, partly because of family schedules, more time eating in front of the television, and the decreasing amount of time devoted to planning and preparing family meals. School age children and adolescents who eat more dinners with their families consume more fruits and vegetables, less soda, and fewer fried foods than those who rarely eat dinner with their families (Larson, 2007).
The atmosphere around food and mealtime also influences attitudes toward food and eating. Unrealistic expectations for a child’s mealtime manners, arguments, and other emotional stress can have a negative effect. Meals that are rushed create a hectic atmosphere and reinforce the tendency to eat too fast. A positive environment is one in which sufficient time is set aside to eat, occasional spills are tolerated, and conversation that includes all family members is encouraged (Figure 18-3).
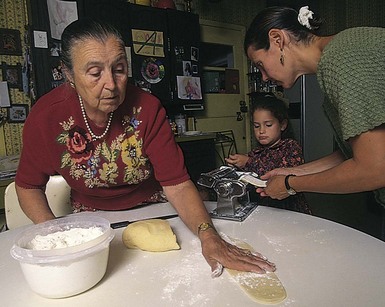
FIGURE 18-3 Three generations of Italian Americans make a pasta dinner. The custom of eating authentically prepared foods gives meals a place of prominence in this home—meals that will not be replaced with fast foods eaten on the run. (From Leahy J, Kisilay P: Foundations of nursing practice: a nursing process approach, Philadelphia, 1998, Saunders.)
Societal Trends
Because almost three fourths of women with school age children are employed outside the home, children may eat one or more meals at a child care center or school. In these settings all children should have access to nutritious meals served in a safe and sanitary environment that promotes healthy growth and development (ADA, 2005, 2006). Because of time constraints, family meals may include more convenience or fast foods. However, having a mother who is employed outside the home does not seem to affect children’s dietary intakes negatively. Food service in group settings such as child care centers, Head Start programs, preschool programs, and in elementary schools is regulated by federal or state guidelines. Many facilities and some in-home child care centers may participate in the U.S. Department of Agriculture (USDA) Child and Adult Care Food Program. However, the quality of meals and snacks can vary greatly; parents should investigate food service when considering child care options. In addition to providing children with optimal nutrients, a program should offer food that is appealing, safely prepared, and appropriate, incorporating cultural and developmental patterns (ADA, 2005).
Approximately one in five American children lives in a family with an income below the poverty line; these children constitute 35% of all the poor in the United States (DeNavas-Walt et al., 2009). The increasing numbers of single-parent households predominantly headed by women have lower incomes and less money for all expenses, including food, than households headed by men. This phenomenon makes these families increasingly vulnerable to multiple stressors such as marginal health and nutritional status partly because of lack of jobs, child care, adequate housing, and health insurance.
In 2008, 16% of households with children in the United States experienced food insecurity. Federal food and nutrition assistance programs (including National School Lunch, Food Stamp Program, and Special Supplemental Nutrition Program for Women, Infants and Children (WIC)) provided benefits to four out of five food-insecure households’ children (ADA, 2010; Nord, 2009). See Chapter 10. The food stamp allotment for families, based on the USDA Thrifty Food Plan, does not provide adequate funds to purchase food based on the government’s nutrition guidelines, especially when labor is considered (Davis and You, 2010). Food insecurity also increases the risk for children younger than age 3 years to be iron-deficient with anemia (Skalicky et al., 2005). Studies suggest that intermittent hunger in American children is associated with increased developmental risk (Rose-Jacobs et al., 2008) (see Focus On: Childhood Hunger and Its Effect on Behavior and Emotions).
 Focus On
Childhood Hunger and Its Effect on Behavior and Emotions
It is well accepted that malnourished children are less responsive, less inquisitive, and participate in less exploratory behavior than well-nourished infants. Specific nutrient deficiencies such as iron deficiency anemia can also result in a decreased ability to pay attention and poorer problem-solving skills. Less clear is the effect of periodic hunger or food insecurity on a child’s behavior and functioning. With recent federal welfare reform legislation and economic downturns, an increasing number of children from low-income families are at risk for limited food resources (American Dietetic Association, 2010).
In the 1990s the Community Childhood Hunger Identification Project conducted surveys using standardized questions and large, rigorously selected samples to categorize families as “hungry,” “at risk for hunger,” or “not hungry” (Kleinman et al., 1998). It was estimated that each year 8% of children younger than 12 years of age in the United States experience prolonged periods in which they have insufficient food. Data from 2008 indicated that 16.2 million children (22.5% of all children) live in food-insecure households (Food Research and Action Center, 2009). The number of children in food-insecure households continues to increase. A longitudinal study following approximately 21,000 children from kindergarten through third grade found that persistent food insecurity was predictive of impaired academic outcomes, poorer social skills, and a tendency to increased body mass index (Jyoti et al., 2005).
Although these studies have limitations because of other factors that may affect a child’s functioning (e.g., stress, family dysfunction, or substance abuse), a correlation exists between children’s lack of sufficient food and their behavioral and academic functioning. As future studies provide more evidence of this relationship, it will be clear that social policies need to ensure the provision of children’s basic needs for optimal growth and development.
Media Messages
Food is marketed to children using a variety of techniques, including television advertising, in-school marketing, sponsorship, product placement, Internet marketing, and sales promotion. Television advertising and in-school marketing are regulated to some degree. By the time the average American child graduates from high school, he or she has watched 15,000 hours of television and spent 11,000 hours in the classroom. In a random sample of television advertising to children, 20% of commercials were for food. Of these, 70% were for items high in sugar or fat, and more than 25% were for fast-food restaurants (Bell, 2009).
Screen time can also be detrimental to growth and development because it encourages inactivity and passive use of leisure time. Indeed, television viewing and its multiple media cues to eat have been suggested as a factor contributing to excessive weight gain in school-age children and adolescents (Laurson, 2008). In addition, the types of food eaten during television viewing can contribute to increased dental caries resulting from the continued exposure of the teeth to dense carbohydrate- and sugar-laden foods (Palmer, 2005).
Preschool children are generally unable to distinguish commercial messages from regular programs. In fact, they often pay more attention to the commercials. As children get older, they gain knowledge about the purpose of commercial advertising and become more critical of its validity, but are still susceptible to the commercial message. Media literacy education programs teach children and adolescents about the intent of advertising and media messages and how to evaluate and interpret their obvious and subtle influences.
Fortunately, some media messages are beneficial. For example, public health messages about eating fish versus the risks of acquiring mercury are important. See Focus On: Childhood Methylmercury Exposure and Toxicity: Media Messaging.
Focus On
Childhood Methylmercury Exposure and Toxicity: Media Messaging
Mercury toxicity can cause neurologic problems, which can lead to cognitive and motor deficits. Toxicity related to prenatal exposure is well documented, and there is evidence that postnatal exposure is dangerous as well (Myers et al., 2009; Oken and Bellinger, 2008). Exposure to mercury can occur through environmental contact and eating contaminated foods. Methylmercury, the most toxic form of mercury accumulates in fish.
Public health agencies have looked at balancing the benefits of minimizing exposure to this neurotoxin with the risk of limiting intake of docosahexaenoic acid (DHA) and eicosapentaenoic acid (EPA) as well as a source of high biologic value protein. DHA and EPA are essential ω-3 fatty acids and have received much attention because of their importance in cognitive and vision development and their cardiovascular benefits (Mahaffey et al., 2008). In addition, fish advisories are available in certain states. The U.S. Environmental Protection Agency’s (EPA) reference dose for methylmercury is based on body weight: 0.1 mcg/kg/day. For a 20-kg child, this is approximately 14 mcg/week (US EPA, 2010). The methylmercury content of 3 ounces of albacore tuna is approximately 29.7 mcg, canned light tuna approximately 10 mcg, and fresh or frozen salmon approximately 1.2 mcg. The Food and Drug Administration (FDA) and EPA have made recommendations for fish intake by young children:
Do not eat shark, swordfish, king mackerel, or tilefish because they contain high levels of mercury.
Eat up to 12 oz (two average meals) a week of a variety of fish and shellfish that are lower in mercury.
Five of the most commonly eaten fish that are low in mercury are shrimp, canned light tuna, salmon, pollock, and catfish.
Another commonly eaten fish, albacore (“white”) tuna has more mercury than canned light tuna. So, when choosing two meals of fish and shellfish, eat up to 6 ounces (one average meal) of albacore tuna per week, but only 3 ounces for a child.
Check local advisories about the safety of fish caught by family and friends in local lakes, rivers, and coastal areas. If no advice is available, eat up to 6 ounces (3 oz for a child) per week of fish caught from local waters, but don’t consume any other fish during that week.
Follow these same recommendations when feeding fish and shellfish to young children, but serve smaller portions.
Peer Influence
As children grow, their world expands and their social contacts become more important. Peer influence increases with age and affects food attitudes and choices. This may result in a sudden refusal of a food or a request for a currently popular food. Decisions about whether to participate in school meals may be made more on the basis of friends’ choices than on the menu. Such behaviors are developmentally typical. Positive behaviors such as a willingness to try new foods can be reinforced. Parents need to set limits on undesirable influences but also need to be realistic; struggles over food are self-defeating.
Illness or Disease
Children who are ill usually have a decreased appetite and limited food intake. Acute viral or bacterial illnesses are often short-lived but may require an increase in fluids, protein, or other nutrients. Chronic conditions such as asthma, cystic fibrosis, or chronic renal disease may make it difficult to obtain sufficient nutrients for optimal growth. Children with these types of conditions are more likely to have behavior problems relating to food. Children requiring special diets (e.g., those who have diabetes or phenylketonuria) not only have to adjust to the limits of foods allowed, but also have to address issues of independence and peer acceptance as they grow older. Some rebellion against the prescribed diet is typical, especially as children approach puberty.
Feeding Preschool Children
From 1 to 6 years of age children experience vast developmental progress and acquisition of skills. One-year-old children primarily use fingers to eat and may need assistance with a cup. By 2 years of age, they can hold a cup in one hand and use a spoon well (see Figure 17-2, but may prefer to use their hands at times. Six-year-old children have refined skills and are beginning to use a knife for cutting and spreading.
As the growth rate slows after the first year of life, appetite decreases, which often concerns parents. Children have less interest in food and an increased interest in the world around them. They can develop food jags which can be periods when foods that were previously liked are refused, or there are repeated requests to eat the same food meal after meal. This behavior may be attributable to boredom with the usual foods or may be a means of asserting newly discovered independence. Parents may have concerns with their child’s seemingly irrational food behavior. Struggles over control of the eating situation are fruitless; no child can be forced to eat. This period is developmental and temporary.
A positive feeding relationship includes a division of responsibility between parents and children. Young children can choose a balanced nutritious diet if presented with nutritious foods. The parents and other adults provide safe, nutritious, developmentally appropriate food as regular meals and snacks; and the children decide how much, if any, they eat (Satter, 2000). Parents maintain control over what foods are offered and have the opportunity to set limits on inappropriate behaviors. Neither rigid control nor a laissez-faire approach is likely to succeed. Parents and other care providers should continue to offer a variety of foods, including the child’s favorites, and not make substitutions a routine.
With smaller stomach capacities and variable appetites, preschool children should be offered small servings of food four to six times a day. Snacks are as important as meals in contributing to the total daily nutrient intake. Carefully chosen snacks are those dense in nutrients and least likely to promote dental caries. A general rule of thumb is to offer 1 tablespoon of each food for every year of age and to serve more food according to the child’s appetite. Table 18-3 is a guide for food and portion size.
TABLE 18-3
Suggested Portion Sizes for Children*
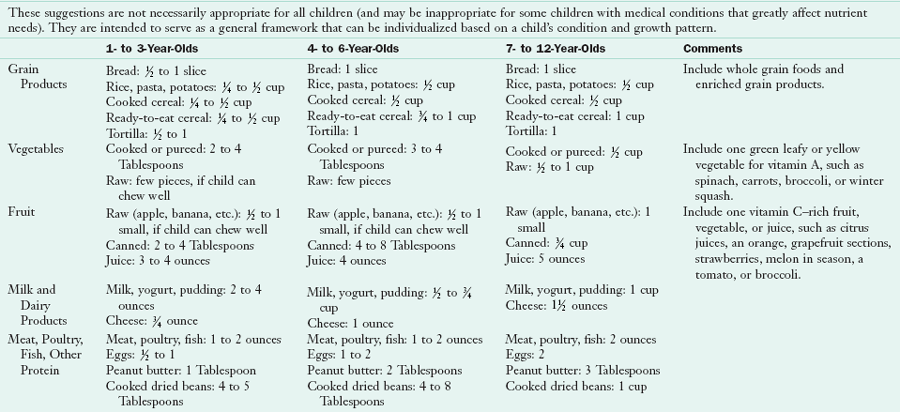
*This is a guide to a basic diet. Fats, oils, sauces, desserts, and snack foods provide additional kilocalories to meet the needs of a growing child. Foods can be selected from this pattern for meals and snacks.
Modified from Lowenberg ME: Development of food patterns in young children. In Trahms CM, Pipes P: Nutrition in infancy and childhood, ed 6, St Louis, 1997, WCB/McGraw-Hill and Harris AB, et al: Nutrition strategies for children with special needs, 1999, USC University Affiliated Program, Los Angeles.
Senses other than taste play an important part in food acceptance by young children. They tend to avoid food with extreme temperatures, and some foods are rejected because of odor rather than taste. A sense of order in the food presentation is often required; many children will not accept foods that touch each other on the plate, and mixed dishes or casseroles with unidentifiable foods are not popular. Broken crackers may go uneaten or a sandwich may be refused because it is “cut the wrong way.”
The physical setting for meals is important. Children’s feet should be supported, and chair height should allow a comfortable reach to the table at chest height. Sturdy, child-size tables and chairs are ideal, or a high chair or booster seat should be used. Dishes and cups should be unbreakable and heavy enough to resist tipping. For very young children, a shallow bowl is often better than a plate for scooping. Thick, short-handled spoons and forks allow for an easier grasp.
Young children do not eat well if they are tired; this should be considered when meal and play times are scheduled. A quiet activity or rest immediately before eating is conducive to a relaxed, enjoyable meal. However, children also need active, large-motor activities and time in the fresh air to stimulate a good appetite.
Fruit juices and juice drinks are a common beverage for young children; they frequently replace water and milk in children’s diets. In addition to altering the diet’s nutrient content, excessive intake of fruit juice can result in carbohydrate malabsorption and chronic, nonspecific diarrhea (AAP, 2001). This suggests that juices, especially apple and pear, should be avoided when using liquids to treat acute diarrhea. For children with chronic diarrhea, a trial of restricting fruit juices may be warranted before more costly diagnostic tests are done.
When children aged 2 to 11 years consume 100% juice, their intakes have significantly higher intakes of energy, carbohydrates, vitamins C and B6, potassium, riboflavin, magnesium, iron, and folate, and significantly lower intakes of total fat, saturated fatty acids, discretionary fat, and added sugar; this 100% juice intake does not correlate with overweight later (Nicklas et al., 2008). However, excess juice intake (12 to 30 oz/day) by young children may decrease a child’s appetite, resulting in decreased food intake and poor growth. Here, a reduction in juice intake results in improved growth (AAP, 2001). Fruit juice intake should be limited to 4-6 oz/day for children 1 through 6 years of age and 8-12 oz/day (in two servings) for older children and adolescents (AAP, 2009).
Large volumes of sweetened beverages, combined with other dietary and activity factors, may contribute to overweight in a child. High intake of fructose, especially from sucrose and high-fructose corn syrup in processed foods and beverages, may lead to increased plasma triglycerides and insulin resistance (Vos et al., 2008). In several studies, low calcium intake and obesity have been correlated with high intake of sugar-sweetened beverages in preschool children (Dubois et al., 2007; Keller et al., 2009; Lim et al., 2009). High milk and low sweetened-beverage intake is associated with improved nutrient intake, including calcium, potassium, magnesium, and vitamin A (O’Neil et al., 2009). Children should be offered milk, water, and healthy snacks throughout the day instead of sugar-sweetened choices.
Excess sodium is another concern. An increase in sodium or salt intake results in an increase in systolic blood pressure and diastolic blood pressure (ADA, 2010). A reduction in the use of processed foods may be warranted for children with elevated blood pressure. The Dietary Approaches to Stop Hypertension diet is useful for all age groups because it increases potassium, magnesium, and calcium in relation to sodium intake. See Chapter 34.
Meal time in group settings is an ideal opportunity for nutrition education programs focused on various learning activities around food (Figure 18-4). Experiencing new foods, participating in simple food preparation, and planting a garden are activities that develop and enhance positive food habits and attitudes.

Feeding School-Age Children
Growth from ages 6 to 12 years is slow but steady, paralleled by a constant increase in food intake. Children are in school a greater part of the day; and they begin to participate in clubs, organized sports, and recreational programs. The influence of peers and significant adults such as teachers, coaches, or sports idols increases. Except for severe issues, most behavioral problems connected with food have been resolved by this age, and children enjoy eating to alleviate hunger and obtain social satisfaction.
School-age children may participate in the school lunch program or bring a lunch from home. The National School Lunch Program, established in 1946, is administered by the USDA. Children from low-income families are eligible for free or reduced-price meals. In addition, the School Breakfast Program, begun in 1966, is offered in approximately 85% of the public schools that participate in the lunch program. The USDA also offers the Afterschool Snacks and Summer Food Service for organized programs, the Fresh Fruit and Vegetable Program in selected schools, and the Special Milk program for children not participating in school lunch (see Chapter 10).
More than 70% of schools met USDA standards for current target nutrients but less than one third of schools met standards for fat in lunch; levels of sodium remain high, whereas fiber is low relative to the DRI (Crepinsek, 2009). Of schools studied, 42% did not offer any fresh fruit or raw vegetables in the reimbursable school lunch on a daily basis (Gordon et al., 2007). New criteria for a broader number of specific nutrient targets and recommendations for menu planning using a food-based approach consistent with the DRI have been published (IOM, 2010). Efforts have been made to decrease food waste by altering menus to accommodate student preferences, allowing students to decline one or two menu items and offering salad bars. Efforts to increase participation in school lunch require consistent messages that support healthful eating.
School wellness policies were required by the school year 2006-2007 in institutions participating in school lunch and school breakfast programs. A survey indicated that many parents, although supportive of snack food restrictions and desirous of more physical education, were unaware of the required school wellness policies (Action for Healthy Kids, 2005). A survey of school food services directors revealed that 97% of school districts have policies that address nutrition standards for National School Lunch Program meals; in those districts, more than 92% have implemented activities including nutrition education, physical activity, and nutrition guidelines (School Nutrition Association, 2007). The school, including the administration, teachers, students, and food service personnel together with families and the community, are encouraged to work together to support nutrition integrity in the educational setting (ADA, 2006).
Consumption of school meals is also affected by the daily school schedule and the amount of time allotted for children to eat. When recess is scheduled before lunch rather than after, intake is better. A Montana “Recess Before Lunch” pilot study documented improvement in the mealtime atmosphere and students’ behavior. Discipline problems on the playground, in the lunchroom, and in the classroom decreased (Montana Office of Public Instruction, 2010).
Children who require a special diet because of certain medical conditions such as diabetes, hyperlipidemia, or documented food allergy are eligible for modified school meals. Children with developmental disabilities are eligible to attend public school from ages 3 to 21 years, and some of them need modified school meals (e.g., meals that are texture modified, or with increased or decreased energy density). To receive modified meals, families must submit written documentation by a medical professional of the diagnosis, meal modification, and rationale. For children receiving special education services, the documentation for meals and feeding can be incorporated as objectives in a child’s individual education plan (IEP) (see Chapter 45).
Studies of lunches packed at home indicate that they usually provide fewer nutrients but less fat than school lunch meals. Favorite foods tend to be packed, so children have less variety. Food choices are limited to those that travel well and require no heating or refrigeration. A typical well-balanced lunch brought from home could include a sandwich with whole-grain bread and a protein-rich filling; fresh vegetables, fruit, or both; low-fat milk; and possibly a cookie, a graham cracker, or another simple dessert. Food safety measures (e.g., keeping perishable foods well chilled) must be observed when packing lunches for school.
Today many school age children are responsible for preparing their own breakfasts. It is not uncommon for children to skip this meal altogether, even children in the primary grades. Children who skip breakfast tend to consume less calories and nutrients than those who eat breakfast (Wilson, 2006). Reviews of the effects of breakfast on cognition and school performance suggest that children who go to school without breakfast are more likely to experience performance deficits than those who eat breakfast (Rampersaud et al., 2005). See Focus On: Breakfast: Does It Affect Learning?
Focus On
Breakfast: Does It Affect Learning?
The educational benefits of school meal programs and especially the role of breakfast in better school performance have been debated and discussed for decades. Studies of healthy 9- to 11-year-old children have shown that those who skipped breakfast and were then given a variety of tests made more errors, had slower stimulus discrimination, and had slower memory recall (Pollitt et al., 1998). Similar studies in other countries with children who were at nutritional risk (i.e., had wasted and stunted growth) and skipped breakfast demonstrated even poorer performance on the learning tasks (Rampersaud et al., 2005). Recent school-based breakfast experiments in 9- to 11-year-old and 6- to 8-year-old children found similar positive results with breakfast consumption (i.e., enhanced short-term memory, better spatial memory, and improved processing of complex visual stimuli) (Mahoney et al., 2005), but other reports are less supportive (Rampersaud et al., 2005). These studies suggest that brain functioning is sensitive to short-term variations in nutrient availability. A short fast may impose greater stress on young children than on adults, resulting in metabolic alterations as various homeostatic mechanisms work to maintain circulating glucose concentrations.
School breakfast programs result in better academic performance, achievement test scores, and attendance (Rampersaud et al., 2005). In addition, breakfast contributes significantly to the child’s overall nutrient intake. These studies underscore the potential benefits—not only for low-income and at-risk children but also for all school children—of a breakfast at home or school meal programs that include breakfast. Based on a study of the most recent data available from 2002-2003, nearly 50% of children eligible participate in a school breakfast program, which is up from almost 29% participation in the 1992-93 school year (Dahl and Scholz, 2011).
Snacks are commonly eaten by school age children, primarily after school and in the evening. As children grow older and have money to spend, they tend to consume more snacks from vending machines, fast-food restaurants, and neighborhood grocery stores. Families should continue to offer wholesome snacks at home and support nutrition education efforts in the school. In most cases, good eating habits established in the first few years help children through this period of decision making and responsibility. Developing and supporting programs and policies that ensure access to better-quality food, larger quantities of food, and better living conditions for low-income children help to reduce health disparities where present (Yoo et al., 2009).
Nutrition Education
As children grow, they acquire knowledge and assimilate concepts. The early years are ideal for providing nutrition information and promoting positive attitudes about all foods. This education can be informal and take place in the home with parents as models and a diet with a wide variety of foods. Food can be used in daily experiences for the toddler and preschooler and to promote the development of language, cognition, and self-help behaviors (i.e., labeling; describing size, shape, and color; sorting; assisting in preparation; and tasting).
More formal nutrition education is provided in preschools, Head Start programs, and public schools. Some programs such as Head Start have federal guidance and standards that incorporate healthy eating and nutrition education for the families involved. Nutrition education in schools is less standard and frequently has minimum or no requirements for inclusion in the curriculum or the training of teachers. Recent recommendations include policies in schools promoting coordination between nutrition education; access to and promotion of child nutrition programs; and cooperation with families, the community, and health services (ADA, 2006).
Teachers attempting to teach children nutrition concepts and information should take into account the children’s developmental level. The play approach, based on Piaget’s theory of learning, is one method for teaching nutrition and fitness to school-age children (Rickard et al., 1995). Activities and information that focus on real-world relationships with food are most likely to have positive results. Meals, snacks, and food preparation activities provide children opportunities to practice and reinforce their nutrition knowledge and demonstrate their cognitive understanding. Involving parents in nutrition education projects can produce positive outcomes that are also beneficial in the home. Many written and electronic resources on nutrition education for children exist, such as at the National Center for Education in Maternal and Child Health.
Nutritional Concerns
The increasing prevalence of overweight children is a significant and alarming public health problem. The most recent NHANES reported an obesity (BMI higher than the 95th percentile) prevalence of 16.9% in children ages 2 to 19 years, and high BMI (BMI higher than the 85th percentile) prevalence of 31.7% (Ogden et al., 2010). For children 2 to 5 years of age, the prevalence is 10.4% for obese and 21.1% for high BMI (Ogden et al., 2010). This prevalence has remained relatively constant (except for an increase among the heaviest 6-19 year old boys) between 1999-2000 and 2007-2008.
Terminology for BMI categories related to overweight and obesity continues to change. The most recent Expert Committee report suggests the following terms to describe risk based on BMI: obesity as BMI at or above the 95th percentile and overweight as BMI between the 85th and 94th percentiles (Barlow et al., 2007). Determining whether growing children are obese is difficult. Some excess weight may be gained at either end of the childhood spectrum; the 1-year-old toddler and the prepubescent child may weigh more for developmental and physiologic reasons, but this extra weight is often not permanent. BMI, a useful clinical tool for screening for overweight, has limitations in determining obesity because of variability related to sex, race, body composition, and maturation stage.
The CDC growth charts allow tracking of BMI from age 2 into adulthood; thus children can be monitored periodically, and intervention provided when the rate of BMI change is excessive. The BMI charts show the adiposity rebound, which normally occurs in children between 4 and 6 years of age. Children whose adiposity rebound occurs before  years of age are more likely to weigh more as adults than those whose adiposity rebound occurs after 7 years of age. The timing of the adiposity rebound and excess fatness in adolescence are two critical factors in the development of obesity in childhood, with the latter being the most predictive of adult obesity and related morbidity (Williams, 2009).
Although genetic predisposition is an important factor in obesity development, the increases in the prevalence of overweight children cannot be explained by genetics alone. Factors contributing to excess energy intake for the pediatric population include ready access to eating and food establishments, eating tied to sedentary leisure activities, children making more food and eating decisions, larger portion sizes, and decreased physical activity. In addition, American children snack three times a day, with chips, candy, and other low-nutrient foods providing more than 27% of their daily energy intake; this contributes 168 kcals/day (Piernas and Popkin, 2010).
Inactivity plays a major role in obesity development, whether it results from screen time, limited opportunities for physical activity, or safety concerns that prevent children from enjoying free play outdoors. Although increased television viewing and computer and handheld game use has been associated with childhood overweight, a review suggests that the greater risk of overweight is related to television viewing plus a low activity level (Ritchie et al., 2005). The need to use automobiles for short trips limits children’s opportunities to walk to local destinations, a phenomenon particularly relevant to children in the suburbs.
Obesity in childhood is not a benign condition, despite the popular belief that overweight children will outgrow their condition. The longer a child has been overweight, the more likely the child is to be overweight or obese during adolescence and adulthood. Consequences of overweight in childhood include psychosocial difficulties such as discrimination from others, a negative self-image, depression, and decreased socialization. Many overweight children have one or more cardiovascular risk factors such as hyperlipidemia, hypertension, or hyperinsulinemia (Daniels, 2009). An even more dramatic health consequence of overweight is the rapid increase in the incidence of type 2 diabetes in children and adolescents, which has a serious effect on adult health, development of other chronic diseases, and health care costs (see Chapter 31).
The AAP has developed guidelines for overweight screening and assessment for children from age 2 through adolescence (Barlow et al., 2007). In addition to growth parameters, other important information includes dietary intake and patterns, previous growth patterns, family history, physical activity, and family interactions. The U.S. Preventive Services Task Force (USPSTF) recommends obesity screening for 6- to 18-year olds and referral to treatment programs, if appropriate (USPSTF, 2010).
A 2010 paper described a lower prevalence of obesity among children who were exposed to the following routines: regularly eating the evening meal as a family, obtaining adequate night-time sleep, and having limited screen-viewing time (Anderson, 2010). Interventions for obesity in children have had limited effect on the childhood obesity problem, especially for black, Hispanic, and Native American populations. Success is most likely to result from programs that include comprehensive behavioral components such as family involvement, dietary modifications, nutrition information, physical activity, and behavioral strategies (Barlow et al., 2007). Incorporating behavioral intervention in obesity treatment improves outcomes and is most effective with a team approach. Depending on the child, goals for weight change may include a decrease in the rate of weight gain, maintenance of weight, or, in severe cases, gradual weight loss (see Chapter 22). An individualized approach should be tailored to each child, with minimum use of highly restrictive diets or medication, except if there are other significant diseases and no other options. (Barlow et al., 2007).
Intervention strategies require family involvement and support. Incorporating motivational interviewing and stages of change theory into the comprehensive program will likely be more successful (Kirk et al., 2005) (see Chapter 15). Changes to address overweight should include the child’s input, with choices and plans that modify the family’s food and activity environment, not just the child’s. Adequate energy and nutrients are needed to ensure maintenance of height velocity and nutrient stores. The hazards of treating overweight children too aggressively include alternate periods of undereating and overeating, feelings of failure in meeting external expectations, ignoring internal cues for appetite and satiation, feelings of deprivation and isolation, an increased risk for eating disorders, and a poor or an increasingly poor self-image.
Some children with special health care needs, such as those with Down syndrome, Prader-Willi syndrome, short stature, and limited mobility, are at increased risk for being overweight. Their size, level of activity, and developmental status need to be considered when estimating energy intake and providing dietary guidance to their families (see Chapter 45).
Prevention of childhood obesity is an important public health priority in the United States. The Institute of Medicine (IOM) has published recommendations that target families, health care professionals, industry, schools, and communities (IOM, 2005; Kirk et al., 2005). The recommendations include schools (improved nutritional quality of food sold and served, increased physical activity, wellness education), industry (improved nutrition information for consumers clear media messages), health care professionals (tracking BMI, providing counseling for children and families), and communities and government (better access to healthy foods, improved physical activity opportunities). Schools are a natural environment for obesity prevention, which can include nutrition and health curricula, opportunities for physical education and activity, and appropriate school meals. Recent efforts have resulted in school nutrition policies that limit the kinds of products sold in vending machines and food and beverages sold for fundraising. More research is also needed to develop effective prevention strategies that incorporate cultural competency for high-risk populations.
Families are essential for modeling food choices, healthy eating, and leisure activities for their children. Parents influence children’s environment by choosing nutrient-rich foods, having family meals (including breakfast), offering regular snacks, and spending time together in physical activity, all of which can be critical in overweight prevention. Reducing sedentary behaviors can increase energy expenditure and reduce prompts to eat; the AAP recommends limiting television and video time to no more than 2 hours per day (AAP, 2003; Epstein et al., 2008). Parents exerting too much control over their child’s food intake or promoting a restrictive diet may cause children to be less able to self-regulate and more likely to overeat when the opportunity is available (Ritchie et al., 2005). Health professionals should support positive parenting within the child’s developmental level (Satter, 2005).
Underweight and Failure to Thrive
Weight loss, lack of weight gain, or failure to thrive (FTT) can be caused by an acute or chronic illness, a restricted diet, a poor appetite (resulting from constipation, medication, or other issues), feeding problems, neglect, or a simple lack of food. Some experts prefer the terms pediatric undernutrition or growth deficiency. Infants and toddlers are most at risk for poor growth, often as a result of prematurity, medical conditions, developmental delays, inadequate parenting, or all of these. Dietary practices can also contribute to poor growth, including food restrictions in preschool children stemming from parents’ concerns about obesity, atherosclerosis, or other potential health problems.
A careful assessment is critical and must include the social and emotional environment of the child and any physical findings. If neglect is documented to be a contributing factor, health professionals are obligated to report the case to the local child protective services (Block and Krebs, 2005). Because of the complexity of growth failure, an interdisciplinary team is ideal for assessments and interventions.
The provision of adequate energy and nutrients and nutrition education should be one part of an overall interdisciplinary plan to assist children and their families. Attempts should be made to increase children’s appetites and modify the environment to ensure optimal intake. Frequent, small meals and snacks should be offered at regular times, using developmentally appropriate, nutrient-dense foods. This optimizes the smaller stomach capacity of the young child and provides structure and predictability for the eating environment. Families should receive support for positive parent-child interactions, with respect for the division of responsibility in feeding and avoidance of any pressure or coercion on the child’s eating. Severe malnutrition may require carefully planned interventions and close monitoring to prevent refeeding syndrome.
Chronic constipation can result in poor appetite, diminished intake, and FTT. Adding legumes and fruits (especially dried fruits), vegetables, high fiber breakfast cereals, bran muffins, or all of these to the diet can help relieve constipation, improve appetite, and eventually promote weight gain. Because the fiber intake of children is often low, especially in children who are picky eaters, fiber intake should always be addressed in the evaluation.
Iron Deficiency
Iron deficiency is one of the most common nutrient disorders of childhood. The highest prevalence of anemia in children occurs in those younger than 2 years of age. Iron deficiency is less of a problem among older preschool and school-age children.
Infants with iron deficiency, with or without anemia, tend to score lower on standardized tests of mental development and pay less attention to relevant information needed for problem solving. Poorer cognitive performance and delayed psychomotor development have been reported in infants and preschool children with iron deficiency. Deficiency can have long-term consequences, as demonstrated by poorer performance on developmental tests in late childhood and early adolescence (Lozoff, 2006, 2007). Iron intake should be considered during assessments of individual diets and in policy decisions intended to address the nutrition needs of low-income, high-risk children.
In addition to growth and the increased physiologic need for iron, dietary factors also play a role. For example, a 1-year-old child who continues to consume a large quantity of milk and excludes other foods may develop anemia. Many young preschool children do not like meat, so most of their iron is consumed in the nonheme form from fortified cereals, which is absorbed less efficiently (see Chapter 33).
Dental Caries
Nutrition and eating habits are important factors affecting oral health. An optimal nutrient intake is needed to produce strong teeth and healthy gums. The composition of the diet and an individual’s eating habits (e.g., dietary carbohydrate intake, eating frequency) are significant factors in the development of dental caries (see Chapter 26).
Allergies
Food allergies usually present during infancy and childhood and are more likely when a child has a family history of allergies. Allergic symptoms are most often seen as respiratory or gastrointestinal responses or involve the skin, but may include fatigue, lethargy, and behavior changes. Controversy exists over the definition of food allergy, food intolerance, and food sensitivity, and some tests for food allergies are unspecific and equivocal (see Chapter 27).
Attention Deficit Hyperactivity Disorder
Attention deficit hyperactivity disorder is a clinical diagnosis based on specific criteria: excessive motor activity, impulsiveness, a short attention span, a low tolerance for frustration, and an onset before 7 years of age. Various dietary factors have been suggested as a cause of this disorder, including artificial flavors and colors, sugar, altered fatty acid metabolism, and allergies. Over the years, dietary treatments have been promoted such as the Feingold diet, the omission of sugar, allergy elimination diets, and supplements of vitamins and essential fatty acids (see Chapter 45).
Autism Spectrum Disorders (ASDs)
ASDs affect 1 in 110 children and are diagnosed by impairments in three behavioral categories: social interactions, verbal and nonverbal communication, and restricted or repetitive behaviors. These impairments can affect nutrient intake and eating behaviors if a child accepts only specific foods, refuses new or unfamiliar foods, or has increased hypersensitivities (e.g., to texture, temperature, color, and smell) or difficulty making transitions. Children with an ASD often refuse fruits and vegetables and may eat only a few foods from the other food groups. Although most children have normal growth parameters, their restricted diets make them at risk for marginal or inadequate nutrient intake. They are often very resistant to taking a vitamin-mineral supplement, even though they could benefit from one.
Popular nutrition advice for children with ASDs include elimination diets (e.g., gluten-free or casein-free), essential fatty acid supplements, large doses of vitamins, and other alternative therapies. Despite anecdotal reports of benefits, few well-designed controlled studies have been done to test the effectiveness of these interventions, and currently there is no strong evidence of benefits (Milward et al., 2008). Behavioral nutrition interventions may increase the types of food accepted at home and school. If families want to try alternative dietary therapies, nutrition professionals can help them ensure that the child’s diet is adequate and any supplements are safe (see Chapter 45).
Preventing Chronic Disease
The roots of chronic adult diseases such as heart disease, cancer, diabetes, and obesity are often based in childhood—a phenomenon that is particularly relevant to the increasing rate of obesity related diseases such as type 2 diabetes. To help decrease the prevalence of chronic conditions in Americans, government and nonprofit agencies have been promoting healthy eating habits for children. Their recommendations include the Dietary Guidelines for Americans, the USDA MyPlate, the National Cholesterol Education Program (NCEP), and the National Cancer Institute Dietary Guidelines (see Chapter 12).
Dietary Fat and Cardiovascular Health
Compared with their counterparts in many other countries, American children and adolescents have higher blood cholesterol levels and higher intakes of saturated fatty acids and cholesterol. Autopsy studies demonstrate that early coronary atherosclerosis begins in childhood and adolescence and is related to high serum total cholesterol, low-density lipoprotein (LDL) cholesterol, and very-low-density lipoprotein cholesterol levels, and low high-density lipoprotein levels (AAP, 2009).
The AAP recommendations for lipid screening and prevention of cardiovascular disease in children are similar to recommendations published for adults (Daniels, 2008; Lichtenstein, 2006). For children older than 2 years of age, nutrition recommendations are the same as those for adults: (1) no more than 30% of energy from fat (10% or less from saturated fat); and (2) 200-300 mg/day of cholesterol. Cholesterol screening is also recommended for children with risk factors—family history of dyslipidemia or premature cardiovascular disease (Daniels, 2008) (see Chapter 33).
Dietary trends have demonstrated a decrease in total fat, saturated fat, and percentage of energy from fat in children’s diets; but at the same time overweight has increased with increased risk of cardiovascular disease (Gidding et al., 2005). Recommendations include a balanced energy intake; sufficient physical activity to maintain a healthy weight; increased intake of fruits, vegetables, fish, and whole grains; and use of low-fat dairy products (Daniels, 2008). Reports have shown that from age 4 to adolescence, children can consume diets that comply with the NCEP guidelines without compromising energy or nutrient intake (Gidding et al., 2005). A long-term dietary intervention study demonstrated improved lipid levels and improved eating habits in children with elevated LDL cholesterol levels (Van Horn et al., 2005). Health practitioners should assess each child individually regarding total fat intake and excessive consumption of low-fat and nonfat foods especially by preschool children (see Chapter 33).
Calcium and Bone Health
Osteoporosis prevention begins early by maximizing calcium retention and bone density during childhood and adolescence, when bones are growing rapidly and are most sensitive to diet and physical activity (see Chapter 25). To reach the maximum calcium balance during puberty, children may need to consume more than the recommended amount. However, mean dietary intakes of calcium are lower than the AI, with 20% to 30% of pubertal girls having intakes less than 500 mg/day. Although calcium supplementation coupled with an average calcium dietary intake in pubertal children has been shown to increase bone mineral density significantly, it is less certain whether this benefit is long term (Matkovic et al., 2005). One longitudinal study of white children from infancy to 8 years of age found that bone mineral content was positively correlated with intake of protein and several minerals, suggesting that many nutrients are related to bone health in children (Bounds et al., 2005). Because food consumption surveys show that children are drinking more soft drinks and noncitrus juices and less milk, education is needed to encourage young people to consume an appropriate amount of calcium from food sources and possibly supplements.
Fiber
Education about dietary fiber and disease prevention has mainly been focused on adults, and only limited information is available on the dietary fiber intake of children. Dietary fiber is needed for health and normal laxation in children. National survey data indicate that preschool children consume a mean of 9.5 g/day of dietary fiber; school age children consume approximately 11.6 g/day (Moshfegh, 2005). This is lower than the DRI for children, which is based on the same 14 g/1000 kcal as adults because of lack of scientific evidence for the pediatric population (IOM, 2006). Generally, higher fiber intakes are associated with more nutrient-dense diets in young children (Kranz et al., 2005).
Physical Activity
A decreased level of physical activity in children has been noted for several decades. Participation in school physical education programs has declined over time and generally decreases with increasing age (ADA, 2008). Regular physical activity not only helps control excess weight gain, but also improves strength and endurance, enhances self-esteem, and reduces anxiety and stress. Activity, combined with an optimal calcium intake, is associated with increased bone mineral density in children and adolescents. Current physical activity recommendations for those ages 6 through 17 years of age are 60 minutes or more of physical activity every day with the majority at a moderate or vigorous aerobic intensity. Children and adolescents should do vigorous intensity activity on at least 3 days per week and include muscle-strengthening and bone-strengthening activity on at least 3 days per week. Information regarding activities that will meet these recommendations and are appropriate for children is available (U.S. Department of Health and Human Services, 2010). The Kid’s MyActivity Pyramid promotes substituting sedentary activities for more physically active choices (Figure 18-5). The Dietary Guidelines for Americans and MyPlate have also been applied to children and their parents (www.chooseMyPlate.gov/kids).
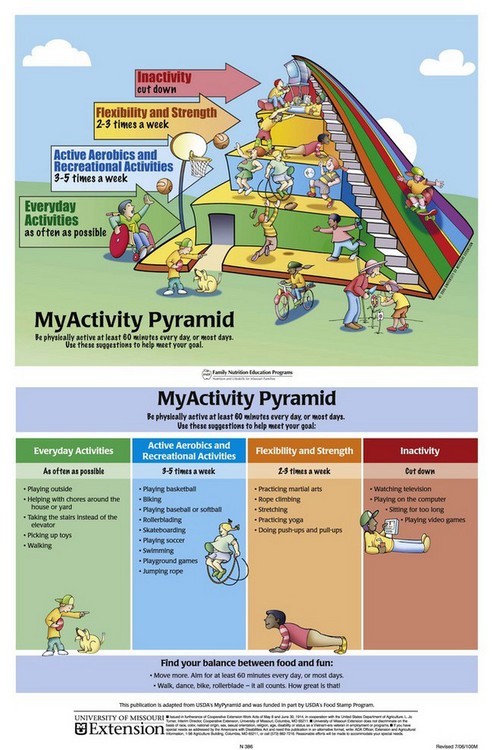
FIGURE 18-5 MyActivity Pyramid. (This publication is adapted from the U.S. Department of Agriculture’s (USDA’s) MyPyramid and was funded in part by the USDA’s Food Stamp Program. Issued in furtherance of Cooperative Extension Work Acts of May 8 and June 30, 1914, in cooperation with the United States Department of Agriculture. L. Jo Turner, Interim Director, Cooperative Extension, University of Missouri, Columbia, MO, July, 2006.)
 Clinical Scenario
Brian is a 7-year, 4-month-old boy who gained 15 lb during the past school year. His height is  inches and his weight is 70 pounds. Brian moved to a new home and began a new school a year ago after his parents’ divorce. After-school care has been provided by an older neighbor, who loves to bake for Brian. Because he has no friends in the neighborhood, his main leisure activities have been watching television and playing video games. His mother reports that they have been relying more on take-out and fast-food meals because of the time constraints of her full-time job, and she has gained weight herself. However, she has recently started an aerobics class with a friend and is interested in developing healthier eating habits.
After joint sessions with Brian and his mother, the following goals were identified by the family: (1) explore after-school care at the local community center, which has sports activities; (2) alter shopping and food preparation to emphasize the MyPlate and low-fat choices; (3) begin weekend swimming or bicycling for the family; and (4) limit television and video games to no more than 2 hours daily.
After 4 months, most of the changes have been made, except for participating in the weekend family activity and watching less television on the weekends. However, Brian is now playing soccer, has lost 4 pounds, and is taller. He is 51 inches tall and weighs 66 lb.
Nutrition Diagnostic Statement
Overweight/obesity as evidenced by BMI-for-age at 95th percentile or more related to physical inactivity and excess energy intake.
1. What recommendations should be made to prevent Brian and his mother from resuming their old habits?
2. Calculate and plot Brian’s BMI over time. Discuss the changes.
3. What other activities can Brian try to help him avoid or reduce the tendency to eat when he is not hungry?
4. What would you suggest to promote a positive feeding relationship between Brian and his mother, considering his age and level of development?
5. How can Brian’s mother alter some of his favorite recipes to lower the fat content? For example, his favorite meal is fried chicken with gravy, mashed potatoes, and ice cream.
6. Are there any nutrient-related concerns because Brian is using diet to help with weight management?
Bright Futures in Practice: Nutrition
www.brightfutures.org/nutrition/
http://counties.cce.cornell.edu/erie/ewph.html
Guidelines for Physical Activity
www.health.gov/paguidelines/guidelines
National Center for Education in Maternal and Child Health
www.mchlibrary.info/KnowledgePaths/kp_childnutr.html
Nutrition and Physical Activity
Pediatric Nutrition Practice Group—American Dietetic Assn.
References
Action for Healthy Kids. Parents’ views on school wellness practices. www.actionforhealthykids.org, September 2005. [Accessed 16 March 2010 from].
American Academy of Pediatrics (AAP), Committee on Nutrition. The use and misuse of fruit juice in pediatrics. Pediatrics. 2001;107:1210. [(Reaffirmed October 2006.)].
American Academy of Pediatrics (AAP), Committee on Nutrition. prevention of pediatric overweight and obesity. Pediatrics. 2003;112:424. [(Reaffirmed February 2007.)].
American Academy of Pediatrics (AAP). Pediatric nutrition handbook, ed 6. Elk Grove Village, IL: AAP; 2009.
American Dietetic Association (ADA). Position of the American Dietetic Association: local support for nutrition integrity in schools. J Am Diet Assoc. 2006;106:122.
American Dietetic Association (ADA). Position of the American Dietetic Association: child and adolescent nutrition assistance programs. J Am Diet Assoc. 2010;110:791.
American Dietetic Association (ADA). Position of the American Dietetic Association: nutrition guidance for healthy children aged 2 to 11 years. J Am Diet Assoc. 2008;108:1038.
American Dietetic Association (ADA). Position of the American Dietetic Association: benchmarks for nutrition programs in child care settings. J Am Diet Assoc. 2005;105:979.
Anderson, SE, Whitaker, RC. Household routines and obesity in US preschool-aged children. Pediatrics. 8 February 2010. [[Epub ahead of print.]].
Barlow, SE, et al. Expert Committee recommendations regarding the prevention, assessment, and treatment of child and adolescent overweight and obesity: summary report. Pediatrics. 2007;120:S164.
Bell, RA, et al. Frequency and types of foods advertised on Saturday morning and weekday afternoon English- and Spanish-language American television programs. J Nutr Educ Behav. 2009;41:406.
Block, RW, Krebs, NF, American Academy of Pediatrics, Committee on Child Abuse and Neglect, Committee on Nutrition. failure to thrive as a manifestation of child neglect. Pediatrics. 2005;116:1234.
Bounds, W, et al. The relationship of dietary and lifestyle factors to bone mineral indexes in children. J Am Diet Assoc. 2005;105:735.
Brotanek, JM, et al. Iron deficiency, prolonged bottle-feeding, and racial/ethnic disparities in young children. Arch Pediatr Adolesc. 2005;159:1038.
Crepinsek, MK, et al. Meals offered and served in US public schools: do they meet nutrient standards? J Am Diet Assoc. 2009;109:S31.
Dahl, MW, Scholz, JK, The National School Lunch Program and School Breakfast Program: evidence on participation and non-compliance. Madison, WI: Congressional Budget Office, U.S. Congress and Dept. of Economics, Institute of Research on Poverty, and NBER, University of Wisconsin; 12 April 2011. Accessed from. http://www.ssc.wisc.edu/~scholz/Research/Lunch.pdf
Davis, GC, You, W. The thrifty food plan is not thrifty when labor cost is considered. J Nutr. 2010;140:854.
Daniels, SR. Complications of obesity in children and adolescents. Int J Obes. 2009;33:S60.
Daniels, SR, Greer, FR, Committee on Nutrition. lipid screening and cardiovascular health in childhood. Pediatrics. 2008;122:198.
DeNavas-Walt, C, et al. U.S. Census Bureau, current population reports, P60-236, income, poverty, and health insurance coverage in the United States: 2008. Washington, DC: U.S. Government Printing Office; 2009.
Dubois, L, et al. Regular sugar-sweetened beverage consumption between meals increases risk of overweight among preschool-aged children. J Am Diet Assoc. 2007;107:924.
Epstein, LH, et al. A randomized trial of the effects of reducing television viewing and computer use on body mass index in young children. Arch Pediatr Adolesc Med. 2008;162:239.
Flegal, KM, et al. Characterizing extreme values of body mass index-for-age by using the 2000 Centers for Disease Control and Prevention growth charts. Am J Clin Nutr. 2009;90:1314.
Food Research and Action Center. Hunger and food insecurity in the United States. http://www.frac.org/html/hunger_in_the_us/hunger_index.html, 2009. [Accessed 16 March 2010 from].
Gidding, SS, et al. Dietary recommendations for children and adolescents: a guide for practitioners: consensus statement from the American Heart Association. Circulation. 2005;112:2061.
Gordon, A, et al. School nutrition dietary assessment study-III: volume II: student participation and dietary intakes. Princeton, N.J.: Mathematical Policy Research, Inc; 2007.
Harris, AB. Evidence of increasing dietary supplement use in children with special health care needs: strategies for improving parent and professional communication. J Am Diet Assoc. 2005;105:34.
Institute of Medicine (IOM), Food and Nutrition Board, Committee on Prevention of Obesity in Children and Youth. Koplan JP, Liverman CT, Kraak VA, eds. Preventing childhood obesity: health in the balance. Washington, DC: National Academies Press, 2005.
Institute of Medicine (IOM), Food and Nutrition Board. Dietary reference intakes: the essential guide to nutrient requirements. Washington, DC: National Academies Press; 2006.
Institute of Medicine (IOM). School meals: building blocks for healthy children. Washington DC: National Academies Press; 2010.
Jyoti, DF, et al. Food insecurity affects school children’s academic performance, weight gain, and social skills. J Nutr. 2005;135:2831.
Keller, KL, et al. Increased sweetened beverage intake is associated with reduced milk and calcium intake in 3- to 7-year-old children at multi-item laboratory lunches. J Am Diet Assoc. 2009;109:497.
Kirk, S, et al. Pediatric obesity epidemic: treatment options. J Am Diet Assoc. 2005;105:S44.
Kleinman, RE, et al. Hunger in children in the United States; potential behavioral and emotional correlates. Pediatrics. 1998;101:e3.
Kranz, S, et al. Dietary fiber intake by American preschoolers is associated with more nutrient-dense diets. J Am Diet Assoc. 2005;105:221.
Larson, NI, et al. Family meals during adolescence are associated with higher diet quality and healthful meal patterns during young adulthood. J Am Diet Assoc. 2007;107:1502.
Laurson, KR, et al. Combined influence of physical activity and screen time recommendations on childhood overweight. Pediatrics. 2008;153:209.
Lichtenstein, AH, et al. Diet and lifestyle recommendations revision 2006: a scientific statement from the American Heart Association Nutrition Committee. Circulation. 2006;114:82.
Lim, S, et al. Obesity and sugar-sweetened beverages in African-American preschool children: a longitudinal study. Obesity. 2009;17:1262.
Lozoff, B, et al. Long-lasting neural and behavioral affects of iron deficiency in infants. Nutrition Revises. 2006;64(5):S34.
Lozoff, B, et al. Preschool-aged children with iron deficiency anemia show altered affect and behavior. J Nutr. 2007;137:683.
Mahaffey, KR, et al. Methylmercury and ω-3 fatty acids: co-occurrence of dietary sources with emphasis on fish and shellfish. Environ Res. 2008;107:20.
Mahoney, CR, et al. Effect of breakfast composition on cognitive processes in elementary school children. Physiol Behav. 2005;85:635.
Matkovic, V, et al. Calcium supplementation and bone mineral density in females from childhood to young adulthood: a randomized controlled trial. Am J Clin Nutr. 2005;81:175.
Milward C, et al: Gluten- and casein-free diets for autistic spectrum disorder, Cochrane Database Syst Rev 2008, issue 2. Art. No.: CD003498. DOI: 10.1002/146518583.CD003498.pub3.
Montana Office of Public Instruction. The Montana Office of Public Instruction School nutrition programs pilot project—a recess before lunch policy in four Montana schools. Accessed 6 May 2010 from http://opi.mt.gov/pdf/schoolfood/rbl/RBLPilot.pdf.
Moshfegh, A, et al. What we eat in America, NHANES 2001-2002: usual nutrient intakes from food compared to dietary reference intakes. Washington, DC: U.S. Department of Agriculture, Agricultural Research Service; 2005.
Moshfegh, A, et al. What we eat in America, NHANES 2005-2006: usual nutrient intakes from food and water compared to 1997 dietary reference intakes for vitamin D, calcium, phosphorus, and magnesium. Washington, DC: U.S. Department of Agriculture, Agricultural Research Service; 2009.
Myers, GH, et al. Postnatal exposure to methyl mercury from fish consumption: a review and new data from the Seychelles Child Development Study. NeuroToxicity. 2009;30:338.
Nicklas, TA, et al. Association between 100% juice consumption and nutrient intake and weight of children aged 2 to 11 years. Arch Pediatr Adolesc Med. 2008;162:557.
Nord, M, Food insecurity in households with children: prevalence, severity, and household characteristics. USDA Econ Res Serv September 2009. Accessed 10 May 2010 from. http://www.ers.usda.gov/Publications/EIB56/
Ogden, CL, et al. Prevalence of high body mass index in US children and adolescents, 2007-2008. JAMA. 2010;303:242.
Oken, E, Bellinger, DC. Fish consumption, methylmercury and child neurodevelopment. Curr Opin Pediatr. 2008;20:178.
O’Neil, CE, et al. Impact of dairy and sweetened beverage consumption on diet and weight of a multiethnic population of head start mothers. J Am Diet Assoc. 2009;109:874.
Palmer, CA. Dental caries and obesity in children: different problems, related causes. Quintessence Int. 2005;36:457.
Picciano, MF, et al. Dietary supplement use among infants, children, and adolescents in the United States, 1999-2002. Arch Pediatr Adolesc Med. 2007;161:978.
Piernas, C, Popkin, BM. Trends in snacking among U.S. children. Health Affairs J. 2010;29:398.
Pollitt, E, et al. Fasting and cognition in well- and undernourished school children: a review of three experimental studies. Am J Clin Nutr. 1998;67(Suppl):779.
Rampersaud, GC, et al. Breakfast habits, nutritional status, body weight, and academic performance in children and adolescents. J Am Diet Assoc. 2005;105:743.
Rickard, KA, et al. The play approach to learning in the context of families and schools: an alternative paradigm for nutrition and fitness education in the 21st century. J Am Diet Assoc. 1995;95:1121.
Ritchie, LD, et al. Family environment and pediatric overweight: What is a parent to do? J Am Diet Assoc. 2005;105:S70.
Rose-Jacobs, R, et al. Household food insecurity: associations with at-risk infant and toddler development. Pediatrics. 2008;121:65.
, Institute of Medicine (IOM)Dietary Reference Intakes for Calcium and Vitamin D. Ross CA, et al. Washington, DC: The National Academies Press; 2011. Accessed at. www.nap.edu
Satter, E. Child of mine—feeding with love and good sense. Palo Alto, Calif: Bull Publishing Co; 2000.
Satter, E. Your child’s weight: helping without harming. Madison, Wisc: Kelcy Press; 2005.
Savage, JS, et al. Parental influence on eating behavior: conception to adolescence. J Law Med Ethics. 2007;35:22–34.
School Nutrition Association: From cupcakes to carrots: local wellness policies one year later. September, 2007, School Nutrition Association, National Harbor, MD.
Skalicky, A, et al, Child food security and iron deficiency anemia in low-income infants and toddlers in the United States. Matern Child Health J 19 November 2005:1–9. [Epub ahead of print.] Accessed 5 May 2010 from. http://www.cdc.gov/pcd/issues/2010/mar/08_0257.htm
U.S. Department of Health and Human Services. 2008 physical activity guidelines for Americans. Accessed 6 May 2010 from http://www.health.gov/paguidelines/guidelines.
U.S. Environmental Protection Agency. What you need to know about mercury in fish and shellfish. Accessed 16 March 2010 from http://www.epa.gov/waterscience/fish/advice/index.html.
U.S. Preventive Services Task Force, Agency for Healthcare Research and Quality. Screening for obesity in children and adolescents. Rockville, Md http://www.uspreventiveservicestaskforce.org/uspstf/uspschobes.htm., 2010. [Accessed 6 May 2010 from].
Van Horn, L, et al. Children’s adaptations to a fat-reduced diet: the intervention study in children (DISC). Pediatrics. 2005;115:1723.
Vos, MB, et al. Dietary fructose consumption among US children and adults: the Third National Health and Nutrition Examination Survey. Medscape J Med. 2008;10:160.
Williams, SM, Goulding, A. Patterns of growth associated with timing of adiposity rebound. Obesity. 2009;17:335.
Wilson, NC, et al. Eating breakfast and its impact on children’s daily diet. Nutrition & Dietetics. 2006;63:15.
Yoo, JP, et al. Material hardship and the physical health of school-aged children in low-income households. Am J Public Health. 2009;99:829.