CHAPTER 34
Gerhard Giebisch and Erich Windhager
Qualitatively, the filtration of blood plasma by the renal glomeruli is the same as the filtration of blood plasma across capillaries in other vascular beds (see Chapter 20). Glomerular ultrafiltration results in the formation of a fluid—the glomerular filtrate—with solute concentrations that are similar to those in plasma water. However, proteins, other high-molecular-weight compounds, and protein-bound solutes are present at reduced concentration. The glomerular filtrate, like filtrates formed across other body capillaries, is free of formed blood elements, such as red and white blood cells.
Quantitatively, the rate of filtration that occurs in the glomeruli greatly exceeds that in all the other capillaries of the circulation combined because of greater Starling forces (see Chapter 20) and higher capillary permeability. Compared with other organs, the kidneys receive an extraordinarily large amount of blood flow—normalized to the mass of the organ—and filter an unusually high fraction of this blood flow. Under normal conditions, the glomerular filtration rate (GFR; see Chapter 33) of the two kidneys is 125 mL/min or 180 L/day. Such a large rate of filtrate formation is required to expose the entire extracellular fluid frequently (>10 times/day) to the scrutiny of the renal tubule epithelium. If it were not for such a high turnover of the extracellular fluid, only small volumes of blood would be “cleared” per unit time (see Chapter 33) of certain solutes and water. Such a low clearance would have two harmful consequences for the renal excretion of solutes that renal tubules cannot adequately secrete.
First, in the presence of a sudden increase in the plasma level of a toxic material—originating either from metabolism or from food or fluid intake—the excretion of the material would be delayed. High blood flow and a high GFR allow the kidneys to eliminate harmful materials rapidly by filtration.
A second consequence of low clearance would be that steady-state plasma levels would be very high for waste materials that depend on filtration for excretion. The following example by Robert Pitts, a major contributor to renal physiology, illustrates the importance of this concept. Consider two individuals on a diet that contains 70 g/day of protein, one person with normal renal function (e.g., GFR of 180 L/day) and the other a renal patient with sharply reduced glomerular filtration (e.g., GFR of 18 L/day). Each individual produces 12 g/day of nitrogen in the form of urea (urea nitrogen) derived from dietary protein and must excrete this into the urine. However, these two individuals achieve urea balance at very different blood urea levels. We make the simplifying assumption that the tubules neither absorb nor secrete urea, so that only filtered urea can be excreted, and all filtered urea is excreted. The physiologically normal individual can excrete 12 g/day of urea nitrogen from 180 L of blood plasma having a blood urea nitrogen value of 12 g/180 L, or 6.7 mg/dL. In the patient whose GFR is reduced to 10% of normal, excreting 12 g/day of urea nitrogen requires that each of the 18 L of filtered blood plasma has a blood urea nitrogen that is 10 times higher, or 67 mg/dL. Thus, excreting the same amount of urea nitrogen—to maintain a steady state—requires a much higher plasma blood urea nitrogen in the renal patient than in the normal individual.
The ideal glomerular marker for measuring GFR would be a substance X that has the same concentration in the glomerular filtrate as in plasma and that also is not reabsorbed, secreted, synthesized, broken down, or accumulated by the tubules (Table 34-1). In Equation 33-4, we saw the following:
Table 34-1 Criteria for Use of a Substance to Measure Glomerular Filtration Rate
1. Substance must be freely filterable in the glomeruli. |
2. Substance must be neither reabsorbed nor secreted by the renal tubules. |
3. Substance must not be synthesized, broken down, or accumulated by the kidney. |
4. Substance must be physiologically inert (not toxic and without effect on renal function). |
PX is the concentration of the solute in plasma, GFR is the sum of volume flow from the plasma into all Bowman’s spaces, UX is the urine concentration of the solute, and  is the urine flow. Rearranging this equation,
Note that Equation 34-2 has the same form as the clearance equation (see Equation 33-3) and is identical to Equation 33-5. Thus, the plasma clearance of a glomerular marker is the GFR. (See Note: Units of Clearance)
Inulin is an exogenous starch-like fructose polymer that is extracted from the Jerusalem artichoke and has a molecular weight of 5000 Da. Inulin is freely filtered at the glomerulus but is neither reabsorbed nor secreted by the renal tubules (Fig. 34-1A). Inulin also fulfills the additional requirements listed in Table 34-1 for an ideal glomerular marker.
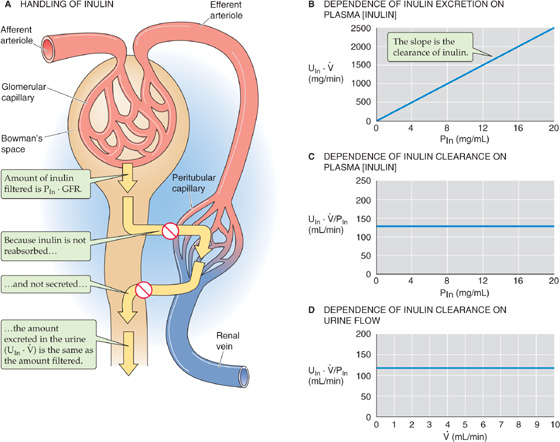
Figure 34-1 Clearance of inulin.
Assuming that GFR does not change, three tests prove that inulin clearance is an accurate marker of GFR. First, as shown in Figure 34-1B, the rate of inulin excretion (UIn · ) is directly proportional to the plasma inulin concentration (PIn), as implied by Equation 34-2. The slope in Figure 34-1B is the inulin clearance. Second, inulin clearance is independent of the plasma inulin concentration (Fig. 34-1C). This conclusion was already implicit in Figure 34-1B, in which the slope (i.e., inulin clearance) does not vary with PIn. Third, inulin clearance is independent of urine flow (Fig. 34-1D). Given a particular PIn, after the renal corpuscles filter the inulin, the total amount of inulin in the urine does not change. Thus, diluting this glomerular marker in a large amount of urine or concentrating it in a small volume, does not affect the total amount of inulin excreted (UIn · ). If the urine flow is high, the urine inulin concentration will be proportionally low, and vice versa. Because (UIn · ) is fixed, (UIn · )/PIn is also fixed.
Two lines of evidence provide direct proof that inulin clearance represents GFR. First, by collecting filtrate from single glomeruli, Richards and coworkers showed in 1941 that the concentration of inulin in Bowman’s space of the mammalian kidney is the same as in plasma. Thus, inulin is freely filtered. Second, by perfusing single tubules with known amounts of labeled inulin, Marsh and Frasier showed that the renal tubules neither secrete nor reabsorb inulin.
Although the inulin clearance is the most reliable method for measuring GFR, it is not practical for clinical use. One must administer inulin intravenously to achieve reasonably constant plasma inulin levels. Another deterrent is that the chemical analysis for determining inulin levels in plasma and urine is sufficiently demanding to render inulin unsuitable for routine use in a clinical laboratory.
The normal value for GFR in a 70-kg man is ~125 mL/min. Population studies show that GFR is proportional to body surface area. Because the surface area of an average 70-kg man is 1.73 m2, the normal GFR in men is often reported as 125 mL/min/1.73 m2 of body surface area. In women, this figure is 110 mL/min/1.73 m2. Age is a second variable. GFR is very low in the newborn, owing to incomplete development of functioning glomerular units. Beginning at ~2 years of age, GFR normalizes for body surface area and gradually falls off with age as a consequence of progressive loss of functioning nephrons.
Because inulin is not a convenient marker for routine clinical testing, nephrologists use other compounds that can be labeled with radioisotopes and that have clearances similar to those of inulin. The most commonly used compounds in human studies are 125I-iothalamate, radioactive vitamin B12 (57Co-or 58Co- cyanocobalamin) and 51Cr-ethylenediaminetetraacetic acid (EDTA). However, these compounds are of limited reliability in GFR measurements because of variable binding to proteins and the loss of labeled iodine from the iothalamate.
The problems of intravenous infusion of a GFR marker can be completely avoided by using an endogenous substance with inulin-like properties. Creatinine is such a substance, and its clearance is a reasonable estimate of GFR in humans, but not all species. Tubules, to variable degree, secrete creatinine, which, by itself, would lead to an ~20% overestimate of GFR in humans. However, because commonly used colorimetric methods overestimate plasma creatinine concentrations, the calculated creatinine clearance turns out to be close to the inulin clearance. Thus, the effects of these two errors (i.e., tubule secretion and overestimated plasma levels) tend to cancel out each other. In clinical practice, determining the creatinine clearance is an easy and reliable means of assessing the GFR, and such determination avoids the need to inject anything into the patient. One merely obtains samples of venous blood and urine, analyzes them for creatinine concentration, and makes a simple calculation.
The source of plasma creatinine is the normal metabolism of creatine phosphate in muscle. In men, this metabolism generates creatinine at the rate of 20 to 25 mg/kg body weight/day (i.e., ~1.5 g/day in a 70-kg man). In women, the value is 15 to 20 mg/kg body weight/day (i.e., ~1.2 g/day in a 70-kg woman), owing to lower muscle mass. In the steady state, the rate of urinary creatinine excretion equals this rate of metabolic production. Therefore, to avoid errors in estimating the GFR from the creatinine clearance, one must take care to exclude non–steady-state pathologic conditions of creatinine release, such as hyperthermia or other conditions of muscle wasting or damage. Ingestion of meat, which has a high creatinine content, also produces non–steady-state conditions. To minimize the effects of such an ingestion, the patient collects urine over an entire 24-hour period, and the plasma sample is obtained by venipuncture in the morning before breakfast.
Frequently, clinicians use the endogenous plasma concentration of creatinine, normally 1 mg/dL, as an instant index of GFR. This use rests on the inverse relationship between the plasma creatinine concentration (PCr) and the creatinine clearance (CCr):
In the steady state, when metabolic production in muscle equals the urinary excretion rate (UCr · ) of creatinine, and both remain fairly constant, this equation predicts that a plot of PCr versus CCr (i.e., PCr versus GFR) is a rectangular hyperbola (Fig. 34-2). For example, in a healthy person whose GFR is 100 mL/min, plasma creatinine is ~1 mg/dL. The product of GFR (100 mL/min) and PCr (1 mg/dL) is thus 1 mg/min, which is the rate of both creatinine production and of creatinine excretion. If GFR suddenly drops to 50 mL/min (Fig. 34-3, top), the kidneys will initially filter and excrete less creatinine (Fig. 34-3, middle), although the production rate is unchanged. As a result, the plasma creatinine level will rise to a new steady state, which is reached at a PCr of 2 mg/dL (Fig. 34-3, bottom). At this point, the product of the reduced GFR (50 mL/min) and the elevated PCr (2 mg/dL) will again equal 1 mg/min, the rate of endogenous production of creatinine. Similarly, if GFR were to fall to one fourth of normal, PCr would rise to 4 mg/dL. This concept is reflected in the right-rectangular hyperbola of Figure 34-2.
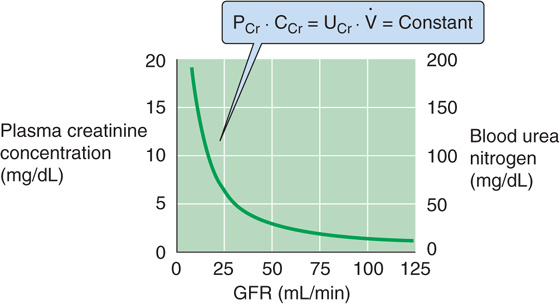
Figure 34-2 Dependence of plasma creatinine and blood urea nitrogen on the GFR. In the steady state, the amount of creatinine appearing in the urine per day (UCr · ) equals the production rate. Because all filtered creatinine (PCr · CCr) appears in the urine, (PCr · CCr) equals (UCr · ), which is constant. Thus, PCr must increase as CCr (i.e., GFR) decreases, and vice versa. If we assume that the kidney handles urea in the same way that it handles inulin, then a plot of blood urea nitrogen versus GFR will have the same shape as that of creatinine concentration versus GFR.
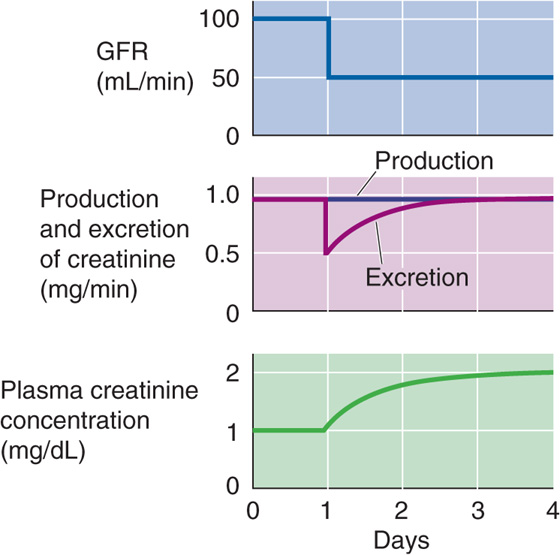
Figure 34-3 Effect of suddenly decreasing the GFR on plasma creatinine concentration.
The glomerular filtration barrier consists of three elements (see Chapter 33): (1) endothelial cells, (2) the glomerular basement membrane, and (3) epithelial podocytes. The latter two layers are covered with negative charges. Table 34-2 summarizes the permselectivity of the glomerular barrier for different solutes, as estimated by the ratio of solute concentration in the ultrafiltrate versus the plasma (UFX/PX). The ratio UFX/PX, also known as the sieving coefficient for the solute X, depends on molecular weight and effective molecular radius. Investigators have used two approaches to estimate UFX/PX. The first, which is valid for all solutes, is the micropuncture technique (see Fig. 33-9A). Sampling fluid from Bowman’s space yields a direct measurement of UFX, from which we can compute UFX/PX. The second approach, which is only valid for solutes that the kidney neither absorbs nor secretes, is to compute the clearance ratio (see Chapter 33), the ratio of the clearances of X (CX) and inulin (CIn). (See Note: Clearance Ratio)
Table 34-2 Permselectivity of the Glomerular Barrier
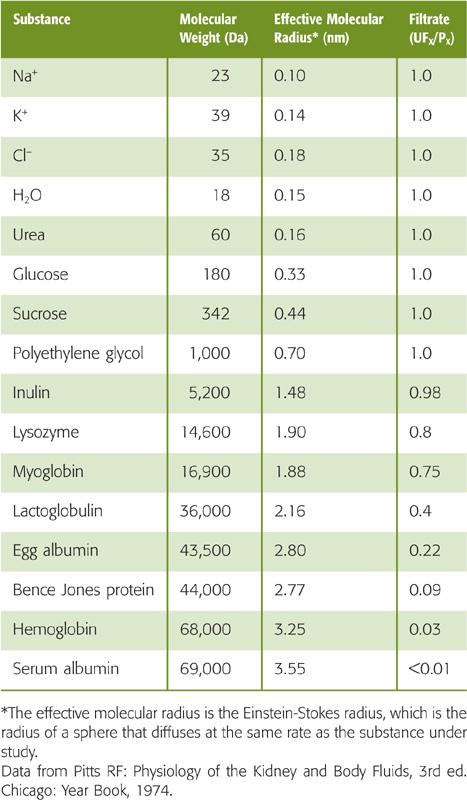
Inspection of Table 34-2 shows that substances of low molecular weight (<5500 Da) and small effective molecular radius (e.g., water, urea, glucose, and inulin) appear in the filtrate in the same concentration as in plasma (UFX/PX = 1). In these instances, no sieving of the contents of the fluid moving through the glomerular “pores” occurs, so that the water moving through the filtration slits by convection carries the solutes with it. As a result, the concentration of the solute in the filtrate is the same as in bulk plasma. The situation is different for substances with a molecular weight that is greater than ~14 kDa, such as lysozyme. Larger and larger macromolecules are increasingly restricted from passage, so that only traces of plasma albumin (69 kDa) are normally present in the glomerular filtrate. (See Note: Filtration of Solutes through Water-Filled Pores)
In addition to molecular weight and radius, electrical charge also makes a major contribution to the permselectivity of the glomerular barrier. Figure 34-4A is a plot of the clearance ratio for uncharged, positively charged, and negatively charged dextran molecules of varying molecular size. Two conclusions can be drawn from these data. First, neutral dextrans with an effective molecular radius smaller than 2 nm pass readily across the glomerular barrier. For dextrans with a larger radius, the clearance ratio decreases with an increase in molecular size, so that passage ceases when the radius exceeds 4.2 nm. Second, anionic dextrans (e.g., dextran sulfates) are restricted from filtration, whereas cationic dextrans (e.g., diethylaminoethyl dextrans) pass more readily into the filtrate. For negatively charged dextrans, the relationship between charge and filterability is characterized by a left shift of the curve relating molecular size to clearance ratio, whereas the opposite is true for positively charged dextrans.
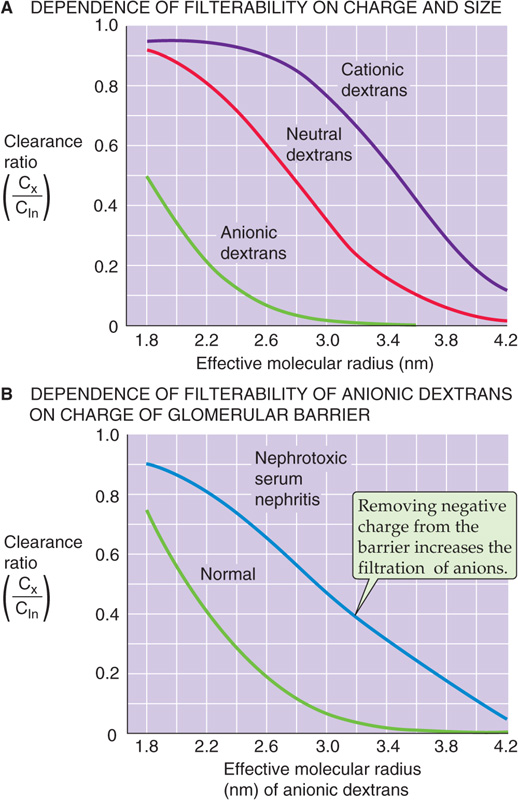
Figure 34-4 Clearance ratios of dextrans. (Data from Brenner BM, Hostetter TH, Humes HD: N Engl J Med 1978; 298:826-833.)
The previously discussed results suggest that the glomerular filtration barrier carries a net negative charge that restricts the movement of anions but enhances the movement of cations. In some experimental models of glomerulonephritis, in which the glomerular barrier loses its negative charge, the permeability of the barrier to negatively charged macromolecules is enhanced. Figure 34-4B compares clearance ratios of dextran sulfate in normal rats and in rats with nephrotoxic serum nephritis. Clearance ratios of dextran sulfate are uniformly greater in the animals with nephritis. Thus, the disease process destroys negative charges in the filtration barrier and accelerates the passage of negatively charged dextrans. Because albumin is also negatively charged at physiological pH, loss of negative charge in the glomerular barrier probably contributes in an important way to the development of albuminuria in the early stages of renal diseases such as glomerulonephritis.
Finally, the shape of macromolecules also affects the permselectivity of the glomerular barrier. Rigid or globular molecules have lower clearance ratios (i.e., sieving coefficients) than molecules of a similar size (e.g., dextrans), which are highly deformable.
As is the case for filtration in other capillary beds (see Chapter 20), glomerular ultrafiltration depends on the product of the ultrafiltration coefficient (Kf) and net Starling forces.
Figure 34-5A provides a schematic overview of the driving forces affecting ultrafiltration. PGC is the hydrostatic pressure in the glomerular capillary, which favors ultrafiltration. PBS is the hydrostatic pressure in Bowman’s space, which opposes ultrafiltration. πGC is the oncotic pressure in the glomerular capillary, which opposes ultrafiltration. Finally, πBS is the oncotic pressure of the filtrate in Bowman’s space, which favors ultrafiltration. Thus, two forces favor filtration (PGC and πBS), and two oppose it (PBS and πGC).
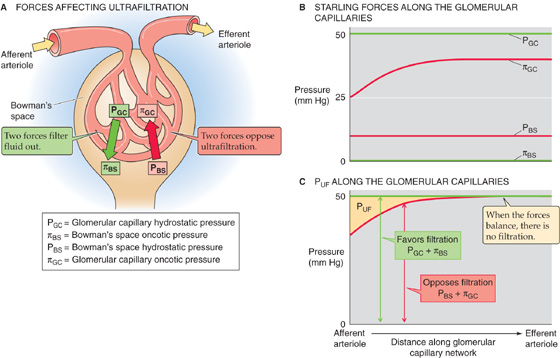
Figure 34-5 A–C, Glomerular ultrafiltration. In B, the oncotic pressure of the glomerular capillary (πGC), which starts off at the value of normal arterial blood, rises as ultrafiltration removes fluid from the capillary. In C, PUF is the net driving force favoring ultrafiltration. (See Note: Starling Forces along the Glomerular Capillary)
The net driving force favoring ultrafiltration (PUF) at any point along the glomerular capillaries is the difference between the hydrostatic pressure difference and the oncotic pressure difference between the capillary and Bowman’s space. Thus, the GFR is proportional to the net hydrostatic force (PGC − PBS) minus the net oncotic force (πGC − πBS). The first term of the hydrostatic pressure difference is the PGC. As discussed later, the unique arrangement in which afferent and efferent arterioles flank the glomerular capillary keeps PGC at ~50 mm Hg (Fig. 34-5B), a value that is twice as high as in most other capillaries. Moreover, direct measurements of pressure in rodents show that PGC decays little between the afferent and efferent ends of glomerular capillaries. The second term of the hydrostatic pressure difference is the PBS. This pressure is ~10 mm Hg and does not vary along the capillary.
As far as the oncotic driving forces are concerned, the first term is the πBS, which is very small (Fig. 34-5B). The πGC starts off at 25 mm Hg at the beginning of the capillary. As a consequence of the continuous production of a protein-free glomerular filtrate, the oncotic pressure of the fluid left behind in the glomerular capillary progressively rises along the capillary.
Figure 34-5C compares the two forces favoring ultrafiltration (PGC + πBS) with the two forces opposing ultrafiltration (PBS + πGC) and shows how they vary along the glomerular capillary. The rapid increase in the oncotic pressure of capillary blood (πGC) is the major reason why the forces favoring and opposing filtration may balance each other at a point some distance before the end of the glomerular capillary. Beyond this point, PUF is zero, and the system is said to be in filtration equilibrium (i.e., no further filtration).
Note that Kf in Equation 34-4 is the product of the hydraulic conductivity of the capillary (Lp) and the effective surface area available for filtration (Sf), as defined earlier (see Chapter 20). We use Kf because it is experimentally difficult to assign values to either Lp or Sf. Whereas PUF is of similar order of magnitude in glomerular and systemic capillaries, the value of Kf of the glomerular filtration barrier exceeds—by more than an order of magnitude—the Kf of all other systemic capillary beds combined. This difference in Kf values underlies the tremendous difference in filtration, ~180 L/day in the kidneys (which receive ~20% of the cardiac output) compared with ~20 L/day (see Chapter 20) in the combined arteriolar ends of capillary beds in the rest of the body (which receive the other ~80%).
Alterations in the glomerular capillary surface area—owing to changes in mesangial cell contractility (see Chapter 33)—can produce substantial changes in the Sf component of Kf. These cells respond to extrarenal hormones such as systemically circulating angiotensin II (ANG II), arginine vasopressin (AVP), and parathyroid hormone. Mesangial cells also produce several vasoactive agents, such as prostaglandins and ANG II.
Renal blood flow (RBF) is ~1 L/min out of the total cardiac output of 5 L/min. Normalized for weight, this blood flow amounts to ~350 mL/min for each 100 g of tissue, which is 7-fold higher than the normalized blood flow to the brain (see Chapter 24). Renal plasma flow (RPF) is

Given a hematocrit (Hct) of 0.40 (see Chapter 5), the “normal” RPF is ~600 mL/min.
At low glomerular plasma flow (Fig. 34-6A), filtration equilibrium occurs halfway down the capillary. At higher plasma flow (i.e., normal for humans), the profile of net ultrafiltration forces (PUF) along the glomerular capillary stretches out considerably to the right (Fig. 34-6B), so that the point of equilibrium would be reached at a site actually beyond the end of the capillary. Failure to reach equilibrium (filtration disequilibrium) occurs because the increased delivery of plasma to the capillary outstrips the ability of the filtration apparatus to remove fluid and simultaneously increase capillary oncotic pressure. As a result, πGC rises more slowly along the length of the capillary.
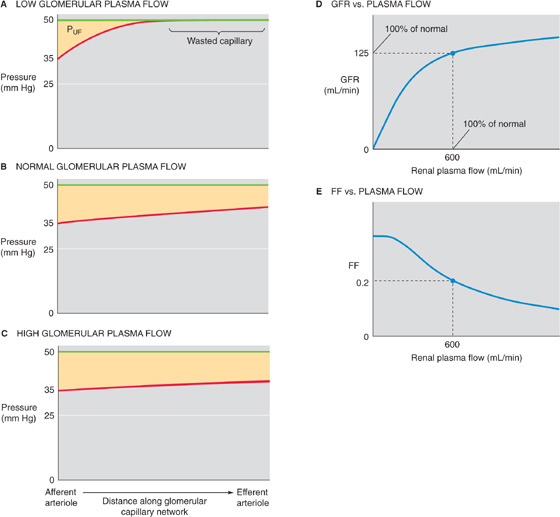
Figure 34-6 Dependence of the GFR on plasma flow. (See Note: Dependence of GRF and RPF on RPF)
The shift of filtration equilibrium toward the efferent arteriole has two important consequences. First, as one progresses along the capillary, PUF (and hence filtration) remains greater. Second, filtration occurs along a greater stretch of the glomerular capillary, thereby increasing the useful surface area for filtration. Thus, the end of the capillary that is “wasted” at low plasma flow rates really is “in reserve” to contribute at higher rates.
A further increase in plasma flow stretches out the πGC profile even more, so that PUF is even higher at each point along the capillary (Fig. 34-6C). Single-nephron GFR (SNGFR) is the sum of individual filtration events along the capillary. Thus, SNGFR is proportional to the yellow area that represents the product of PUF and effective (i.e., nonwasted) length along the capillary. Because the yellow areas progressively increase in Figure 34-6A to C, SNGFR increases with glomerular plasma flow. However, this increase is not linear. Compared with the normal situation, the GFR summed for both kidneys increases only moderately with increasing RPF, but it decreases greatly with decreasing RPF (Fig. 34-6D).
The relationship between GFR and RPF also defines a parameter known as the filtration fraction (FF), which is the volume of filtrate that forms from a given volume of plasma entering the glomeruli:
Because the normal GFR is ~125 mL/min and the normal RPF is ~600 mL/min, the normal FF is ~0.2. Because GFR saturates at high values of RPF, FF is greater at low plasma flows than it is at high plasma flows. The dependence of GFR on plasma flow through the glomerular capillaries is similar to the dependence of alveolar O2 and CO2 transport on pulmonary blood flow (see Chapter 30).
The renal microvasculature has two unique features. First, this vascular bed has two major sites of resistance control, the afferent and the efferent arterioles. Second, it has two capillary beds in series, the glomerular and the peritubular capillaries. As a consequence of this unique architecture, significant pressure drops occur in both arterioles (Fig. 34-7), glomerular capillary pressure is relatively high throughout, and peritubular capillary pressure is relatively low. Selective constriction or relaxation of the afferent and efferent arterioles allows for highly sensitive control of the hydrostatic pressure in the intervening glomerular capillary and thus of glomerular filtration.
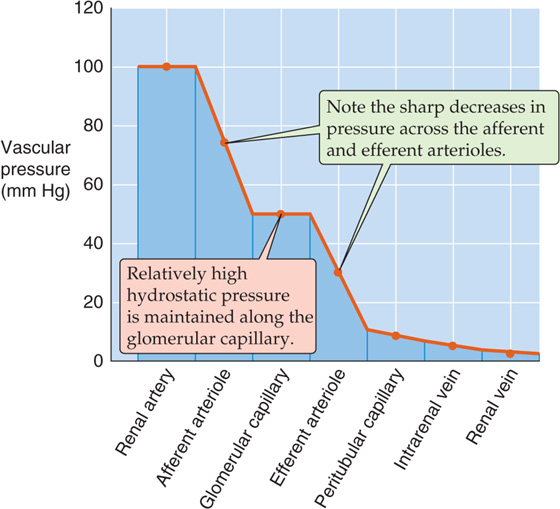
Figure 34-7 Pressure profile along the renal vasculature.
Figure 34-8A illustrates an idealized example in which we reciprocally change afferent and efferent arteriolar resistance while keeping total arteriolar resistance—and thus glomerular plasma flow—constant. Compared with an initial condition in which the afferent and efferent arteriolar resistances are the same (Fig. 34-8A, top panel), constricting the afferent arteriole—while relaxing the efferent arteriole—lowers PGC (Fig. 34-8A, middle panel). Conversely, constricting the efferent arteriole—while relaxing the afferent arteriole—raises PGC (Fig. 34-8A, lower panel). From these idealized PGC responses, one could predict that an increase in afferent arteriolar resistance would decrease the GFR and that an increase in efferent arteriolar resistance should have the opposite effect. However, physiological changes in the afferent and efferent arteriolar resistance usually do not keep overall arteriolar resistance constant. Thus, changes in arteriolar resistance generally lead to changes in glomerular plasma flow, which, as discussed earlier, can influence GFR independent of glomerular capillary pressure.
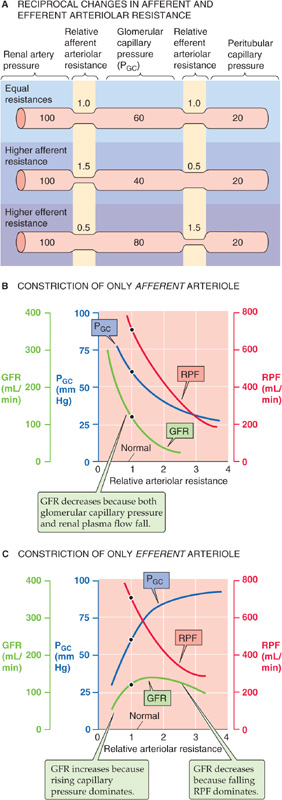
Figure 34-8 Role of afferent and efferent arteriolar resistance on pressure and flows. In A, the sum of afferent and efferent arteriolar resistance is always 2, whereas in B and C, the total resistance changes.
Figure 34-8B and C show somewhat more realistic effects on RPF and GFR as we change the resistance of a single arteriole. With a selective increase of afferent arteriolar resistance (Fig. 34-8B), both capillary pressure and RPF decrease, leading to a monotonic decline in the GFR. In contrast, a selective increase of efferent arteriolar resistance (Fig. 34-8C) causes a steep increase in glomerular capillary pressure as well as a decrease in RPF. As a result, over the lower range of resistances, GFR increases with efferent resistance as an increasing PGC dominates. Conversely, at higher resistances, GFR begins to fall as the effect of a declining RPF dominates. These opposing effects on glomerular capillary pressure and RPF account for the biphasic dependence of GFR on efferent resistance.
The examples in Figure 34-8B and C, in which only afferent or efferent resistance increased, are still somewhat artificial. During sympathetic stimulation, or in response to ANG II, both afferent and efferent resistances increase. Thus, RPF decreases. The generally opposing effects on GFR of increasing both afferent resistance (Fig. 34-8B) and efferent resistance (Fig. 34-8C) explain why the combination of both keeps GFR fairly constant despite a decline in RPF.
In certain realistic examples, changes in either the afferent or the efferent arteriolar resistance dominate. A striking case in which a decrease in afferent arteriolar resistance dominates is the large increase in RPF that occurs with the loss of renal tissue, as after nephrectomy in a kidney donor. GFR in the remnant kidney nearly doubles, owing primarily to a dramatic decrease in the resistance of the afferent arteriole (Fig. 34-8B).
An example of a predominantly efferent arteriolar effect is seen after administration of ANG II inhibitors (e.g., captopril) to patients with hypertension resulting from increased endogenous angiotensin levels. Administering such agents not only decreases blood pressure, but also often leads to a significant fall in GFR. If we imagine that the peak of the GFR curve in Figure 34-8C represents the patient before treatment, then reducing the resistance of the efferent arteriole would indeed cause GFR to decrease.
Peritubular capillaries originate from the efferent arterioles of the superficial and juxtamedullary glomeruli (see Fig. 33-1C). The capillaries from the superficial glomeruli form a dense network in the cortex, and those from the juxtamedullary glomeruli follow the tubules down into the medulla, where the capillaries are known as the vasa recta (see Chapter 33). The peritubular capillaries have two main functions. First, these vessels deliver oxygen and nutrients to the epithelial cells. Second, they are responsible for taking up from the interstitial space the fluid that the renal tubules reabsorb.
The Starling forces that govern filtration in other capillary beds apply here as well (Fig. 34-9A). However, in peritubular capillaries, the pattern is unique. In “standard” systemic capillaries, Starling forces favor filtration at the arteriolar end and absorption at the venular end (see Chapter 20). Glomerular capillaries resemble the early part of these standard capillaries: the Starling forces always favor filtration (Fig. 34-9B, yellow area). The peritubular capillaries are like the late part of standard capillaries: the Starling forces always favor absorption (Fig. 34-9C, brown area).
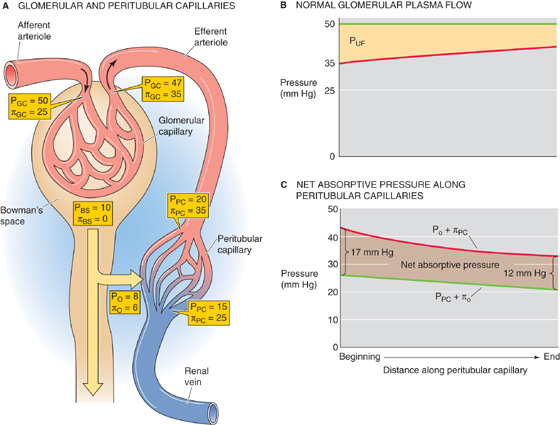
Figure 34-9 Starling forces along the peritubular capillaries. See text for discussion. (See Note: Starling Forces along the Glomerular Capillary)
What makes peritubular capillaries unique is that glomerular capillaries and the efferent arteriole precede them. Glomerular filtration elevates the oncotic pressure of blood entering the peritubular capillary network (πPC) to ~35 mm Hg. In addition, the resistance of the efferent arteriole decreases the intravascular hydrostatic pressure (PPC) to ~20 mm Hg (Fig. 34-9A). Interstitial oncotic pressure (πO) is 4 to 8 mm Hg, and interstitial hydrostatic pressure (PO) is probably 6 to 10 mm Hg. The net effect is a large net absorptive pressure at the beginning of the peritubular capillary. Along the peritubular capillary, πPC falls modestly because of the reabsorption of protein-poor fluid from the interstitium into the capillary, and hydrostatic pressure probably falls modestly as well. Even so, the Starling forces remain solidly in favor of absorption along the entire length of the peritubular capillary, falling from ~17 mm Hg at the arteriolar end to ~12 mm Hg at the venular end (Fig. 34-9C).
The net absorptive force at the beginning of the peritubular capillaries is subject to the vagaries of glomerular fluid dynamics. For instance, expansion of the extracellular fluid volume (Fig. 34-10) inhibits the renin-angiotensin system (see Chapter 40), thus leading to a relatively larger decrease in efferent than in afferent arteriolar resistance and therefore a rise in PPC. The fall in total arteriolar resistance causes a rise in RPF that is larger than the increase in GFR, thereby resulting in a fall in filtration fraction. Thus, more fluid remains inside the glomerular capillary, and the blood entering the peritubular capillaries has an oncotic pressure that is not as high as it otherwise would be (e.g., πPC of <35 mm Hg). The fall in efferent arteriolar resistance also raises the PPC (e.g., PPC of >20 mm Hg). As a consequence of the low πPC and high PPC, the peritubular capillaries take up less interstitial fluid (see Chapter 35). The reverse sequence of events takes place during volume contraction and in chronic heart failure. (See Note: Effects of Hemodynamic Changes on Fluid Reabsorption by the Peritubular Capillaries)
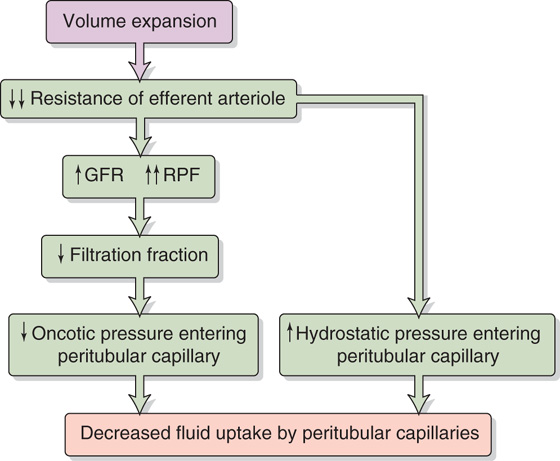
Figure 34-10 Effect of volume expansion on fluid uptake by the peritubular capillaries.
Lymphatic capillaries are mainly found in the cortex. They provide an important route for removing protein from the interstitial fluid. Proteins leak continuously from the peritubular capillaries into the interstitial fluid. Total renal lymph flow is small and amounts to less than 1% of RPF.
Measurements of regional blood flow in the kidney show that ~90% of the blood leaving the glomeruli in efferent arterioles perfuses cortical tissue. The remaining 10% perfuses the renal medulla, with only 1% to 2% reaching the papilla. The relatively low blood flow through the medulla, a consequence of the high resistance of the long vasa recta, is important for minimizing washout of the hypertonic medullary interstitium and thus for producing a concentrated urine (see Chapter 38).
As discussed in Chapter 32, for any solute (X) that the kidney neither metabolizes nor produces, the only route of entry to the kidney is the renal artery, and the only two routes of exit are the renal vein and the ureter (see Chapter 33):
The foregoing equation (a restatement of Equation 33-1) is an application of the Fick principle used for measurements of regional blood flow (see Chapter 17). To estimate arterial RPF (RPFa)—or, more simply, RPF—we could in principle use the clearance of any substance that the kidney measurably excretes into the urine, as long as it is practical to obtain samples of systemic arterial plasma, renal venous plasma, and urine. The problem, of course, is sampling blood from the renal vein.
However, we can avoid the need for sampling the renal vein if we choose a substance that the kidneys clear so efficiently that they leave almost none in the renal vein. p-Aminohippuric acid (PAH) is just such a substance (see Chapter 33). Because PAH is an organic acid that is not normally present in the body, PAH must be administered by continuous intravenous infusion. Some PAH binds to plasma proteins, but a significant amount remains freely dissolved in the plasma and therefore filters into Bowman’s space. However, the kidney filters only ~20% of the renal plasma flow (i.e., FF = ~0.2), and a major portion of the PAH remains in the plasma that flows out of the efferent arterioles. PAH diffuses out of the peritubular capillary network and reaches the basolateral surface of the proximal tubule cells. These cells have a high capacity to secrete PAH from blood into the tubule lumen against large concentration gradients. This PAH secretory system (see Chapter 36) is so efficient that—as long as we do not overwhelm it by infusing too much PAH—almost no PAH (~10%) remains in the renal venous blood. We assume that all the PAH presented to the kidney appears in the urine:
In the example of Figure 34-11, the concentration of filterable PAH in the arterial blood plasma (PPAH) is 10 mg/dL or 0.1 mg/mL. If RPF is 600 mL/min, then the arterial load of PAH to the kidney is 60 mg/min. Of this amount, 10 mg/min appears in the glomerular filtrate. If the tubules secrete the remaining 50 mg/min, then the entire 60 mg/min of PAH presented to the kidney appears in the urine (i.e., the kidneys clear the entire quantity of PAH that is presented to them during a single passage of blood). In practice, the kidneys excrete ~90% of the arterial load of PAH when PPAH does not exceed 12 mg/dL.
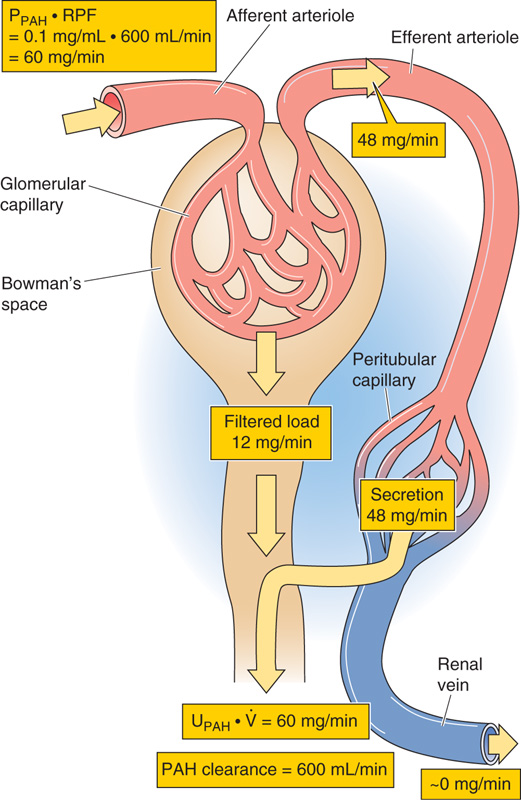
Figure 34-11 Renal handling of PAH. PPAH and UPAH are plasma and urine concentrations of PAH.
As long as we do not infuse too much PAH (i.e., as long as virtually no PAH remains in the renal venous blood), Equation 34-7 reduces to the equation for the clearance of PAH, as introduced in Table 33-2B:
If we apply this equation to the example in Figure 34-11:
To compute RPF, we need to collect a urine sample to obtain (UPAH · ) and a blood sample to obtain PPAH. However, the blood sample need not be arterial. For example, one can obtain venous blood from the arm, inasmuch as skeletal muscle extracts negligible amounts of PAH.
An important feature of the renal circulation is its remarkable ability to maintain RBF and GFR within narrow limits, although mean arterial pressure may vary between ~80 and 170 mm Hg (Fig. 34-12, middle and bottom panels). Stability of blood flow—autoregulation (see Chapter 20)—is also a property of the vascular beds serving two other vital organs, the brain and the heart. Perfusion to all three of these organs must be preserved in emergency situations, such as hypotensive shock. Autoregulation of the renal blood supply is independent of the influence of renal nerves and circulating hormones, and it persists even when one perfuses isolated kidneys with erythrocyte-free solutions. Autoregulation of RBF and, consequently, autoregulation of GFR, which depends on RBF (Fig. 34-6D), stabilize the filtered load of solutes that reach the tubules over a wide range of arterial pressures. Autoregulation of RBF also protects the fragile glomerular capillaries against increases in perfusion pressure that could lead to structural damage.
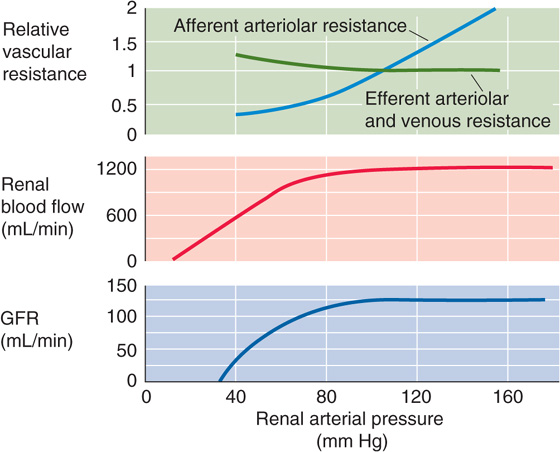
Figure 34-12 Autoregulation of renal blood flow and GFR. (Data from Arendshorst WJ, Finn WF, Gottschalk CW: Am J Physiol 1975; 228:127-133.)
The kidney autoregulates RBF by responding to a rise in renal arterial pressure with a proportional increase in the resistance of the afferent arterioles. Autoregulation comes into play during alterations in arterial pressure that occur, for example, during changes in posture, light to moderate exercise, and sleep. It is the afferent arteriole where the autoregulatory response occurs, and where the resistance to flow rises with increasing perfusion pressure (Fig. 34-12, top panel). In contrast, efferent arteriolar resistance, capillary resistance, and venous resistance all change very little over a wide range of renal arterial pressures.
Two basic mechanisms—equally important—underlie renal autoregulation: a myogenic response of the smooth muscle of the afferent arterioles and a tubuloglomerular feedback (TGF) mechanism.
Myogenic Response The afferent arterioles have the inherent ability to respond to changes in vessel circumference by contracting or relaxing—a myogenic response (see Chapter 20). The mechanism of contraction is the opening of stretch-activated, nonselective cation channels in vascular smooth muscle. The resultant depolarizing leads to an influx of Ca2+ that stimulates contraction (see Table 20-7).
Tubuloglomerular Feedback The juxtaglomerular apparatus (see Chapter 33) mediates the TGF mechanism. The macula densa cells in the thick ascending limb sense an increase in GFR and, in classic feedback fashion, translate this to a contraction of the afferent arteriole, a fall in PGC and RPF, and hence a decrease in GFR. (See Note: Systemic versus Local Roles of the JGA)
Experimental evidence for the existence of a TGF mechanism rests on measurements of SNGFR. One introduces a wax block into the lumen of the proximal tubule to block luminal flow (Fig. 34-13A). Upstream from the wax block, a pipette collects the fluid needed to compute SNGFR (see Equation 33-13). Downstream to this oil block, another pipette perfuses the loop of Henle with known solutions and at selected flows. The key observation is that an inverse relationship exists between the late proximal perfusion rate (i.e., fluid delivery to macula densa) and SNGFR (Fig. 34-13B).
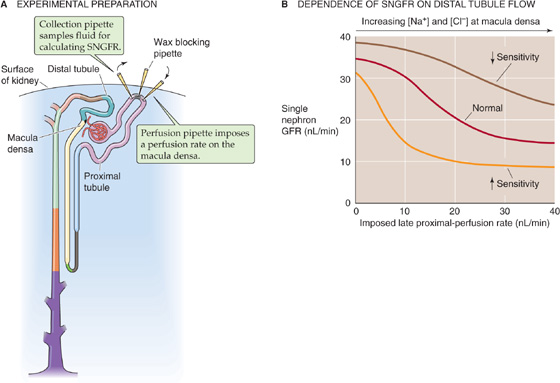
Figure 34-13 Tubuloglomerular feedback. (Data from B modified from Navar LG: Adv Physiol Educ 1998; 20:S221-S235.)
The mechanism of this TGF is thought to be the following. An increase in arterial pressure leads to increases in glomerular capillary pressure, RPF, and GFR. The increase in GFR leads to an increased delivery of Na+, Cl−, and fluid into the proximal tubule and, ultimately, to the macula densa cells of the juxtaglomerular apparatus. The macula densa does not sense flow per se, but the higher luminal [Na+] or [Cl−] resulting from high flow. Because of high Na/K/Cl cotransporter activity at the apical membrane of the macula densa cell, increases in luminal [Na+] and [Cl−] translate to parallel increases in intracellular concentrations of these two ions. Indeed, blocking the Na/K/Cl cotransporter with furosemide (see Chapter 5) not only blocks the uptake of Na+ and Cl− into the macula densa cells, but also interrupts TGF. The rise in [Cl−]i, in conjunction with a Cl− channel at the basolateral membrane, apparently leads to a depolarization, which activates a nonselective cation channel, which, in turn, allows Ca2+ to enter the macula densa cell. The result is an increase in [Ca2+]i that causes the macula densa cell to release paracrine agents (ATP, adenosine, thromboxane, or other substances) that may trigger contraction of nearby vascular smooth muscle cells. A1 adenosine receptors on the smooth muscle cells may be particularly important in this response. The net effect is an increase in afferent arteriolar resistance and a decrease in GFR, thereby counteracting the initial increase in GFR.
Several factors increase or decrease the sensitivity of the TGF mechanism (Fig. 34-13B). Indeed, investigators have suggested that several of these factors may be physiological signals from the macula densa cells or modulators of these signals (Table 34-3).
Table 34-3 Modulation of Tubuloglomerular Feedback
Factors That Increase Sensitivity of TGF Volume Contraction |
Adenosine |
Prostaglandin E2 |
Thromboxane |
Hydroxyeicosatetraenoic acid |
Angiotensin II |
Factors That Decrease Sensitivity of TGF Volume Expansion |
ANP |
NO |
cAMP |
Prostaglandin I2 |
High-protein diet |
The sensitivity of TGF is defined as the change in SNGFR for a given change in the perfusion rate of the loop of Henle. Thus, sensitivity is the absolute value of the slope of the curves in Figure 34-13B. The set point of the feedback system is defined as the loop perfusion rate at which SNGFR falls by 50%.
Both the intrinsic sensitivity of the macula densa mechanism and the initial set point for changes in flow are sensitive to changes in the extracellular fluid volume. Expansion of the extracellular fluid decreases the sensitivity (i.e., steepness) of the overall feedback loop. Conversely, volume contraction increases the sensitivity of TGF, thus helping preserve fluid by reducing GFR.
Of clinical importance may be the observation that a high-protein diet increases the GFR and RPF by indirectly lowering the sensitivity of the TGF mechanism. A high-protein diet somehow enhances NaCl reabsorption proximal to the macula densa, so that luminal [NaCl] at the macula densa falls. As a consequence, the flow in the loop of Henle (and thus GFR) must be higher to raise [NaCl] to a particular level at the macula densa. A high-protein diet may decrease TGF and may thereby increase glomerular capillary pressure. This sequence of events may lead, particularly in the presence of intrinsic renal disease, to permanent glomerular damage.
Changes in effective circulating volume (see Chapter 23) trigger responses in four parallel effector pathways that ultimately modulate either renal hemodynamics or renal Na+ reabsorption. The four effector pathways are (1) the renin-angiotensin-aldosterone axis, (2) the sympathetic nervous system, (3) AVP, and (4) atrial natriuretic peptide (ANP). In Chapter 39, we discuss the integrated control of effective circulating volume. Here, we focus on the direct actions of the four effector pathways on renal hemodynamics.
Renin-Angiotensin-Aldosterone Axis In terms of renal hemodynamic effects, the most important part of this axis is its middle member, the peptide hormone ANG II (see Chapter 40). ANG II has multiple actions on renal hemodynamics (Table 34-4), the overall effect of which is to reduce blood flow and GFR.
Table 34-4 Hemodynamic Actions of Angiotensin II on the Kidney
Site |
Action |
Properties |
Renal artery and afferent arteriole |
Constriction |
Ca2+ influx through voltage-gated channels Inhibited by prostaglandins |
Efferent arteriole |
Constriction |
May depend on Ca2+ mobilization from internal stores Insensitive to Ca2+ channel blockers |
|
|
Prostaglandins may counteract the constriction during volume contraction or low effective circulating volume |
Mesangial cells |
Contraction with reduction in Kf |
Ca2+ influx |
|
|
Ca2+ mobilization from internal stores |
Tubuloglomerular feedback mechanism |
Increased sensitivity |
Increased responsiveness of afferent arteriole to signal from macula densa |
Medullary blood flow |
Reduction |
May be independent of changes in cortical blood flow |
Modified from Arendshorst WJ, Navar LG. In Schrier RW, Gottschalk CW: Diseases of the Kidney, vol 1, 5th ed, pp 65-117. Boston: Little, Brown, 1993.
Sympathetic Nerves Sympathetic tone to the kidney may increase either as part of a general response—as occurs with pain, stress, trauma, hemorrhage, or exercise—or as part of a more selective renal response to a decrease in effective circulating volume (see Chapter 40). In either case, sympathetic nerve terminals release norepinephrine into the interstitial space. At relatively high levels of nerve stimulation, both afferent and efferent arteriolar resistances rise, thus generally decreasing RBF and GFR. The observation that the RBF may fall more than the GFR is consistent with a preferential efferent arteriolar constriction. With maximal nerve stimulation, however, afferent vasoconstriction predominates and leads to drastic reductions in both RBF and GFR.
In addition, sympathetic stimulation triggers granular cells to increase their release of renin, raising levels of ANG II (see Chapter 40), which acts as described earlier. Finally, sympathetic tone signals tubule cells to increase their reabsorption of Na+ (see Chapter 35).
Arginine Vasopressin In response to increases in the osmotic pressure of the extracellular fluid, the posterior pituitary releases AVP, also known as antidiuretic hormone (see Chapter 38). Although the principal effect of this small polypeptide is to increase water absorption in the collecting duct, AVP also increases vascular resistance. Despite physiological fluctuations of circulating AVP levels, total RBF and GFR remain nearly constant. Nevertheless, AVP may decrease blood flow to the renal medulla, thereby minimizing the washout of the hypertonic medulla; this hypertonicity is essential for forming a concentrated urine.
In amphibians, reptiles, and birds, the generalized vascular effects of AVP are more pronounced than they are in mammals. In humans, severe decreases in effective circulating volume (e.g., shock) cause a massive release of AVP through nonosmotic stimuli (see Chapter 25). Only under these conditions does AVP produce systemic vasoconstriction and thus contribute to maintaining systemic blood pressure (see Chapter 23).
Atrial Natriuretic Peptide Atrial myocytes release ANP in response to increased atrial pressure and thus effective circulating volume (see Chapter 40). The major effect of ANP is hemodynamic: it markedly vasodilates afferent and efferent arterioles, thereby increasing cortical and medullary blood flow, and lowers the sensitivity of the TGF mechanism (Table 34-3). The net effect is an increase in RPF and GFR. ANP also affects renal hemodynamics indirectly, by inhibiting secretion of renin (thus lowering ANG II levels) and AVP. At higher levels, ANP decreases systemic arterial pressure and increases capillary permeability. ANP plays a role in the diuretic response to the redistribution of extracellular fluid and plasma volume into the thorax that occurs during space flight and water immersion (see Chapter 61).
Many vasoactive agents—in addition to the ones discussed in the previous section—modulate RBF and GFR when these agents are infused systemically or are applied locally to the renal vasculature. Despite considerable research on such hemodynamic actions, the precise role of individual vasoactive agents in the response to physiological and pathophysiological stimuli remains uncertain. At least three kinds of observations have complicated our understanding: (1) several agents with opposing actions are often released simultaneously; (2) blocking a specific vasoactive messenger may have relatively little effect on renal hemodynamics; and (3) a single vasoactive agent may have different, or even opposing, actions at low and high concentrations. Nevertheless, renal and extrarenal agents may cooperate to provide a full and physiologically adequate response to a wide spectrum of challenges. (See Note: Agents That Modify Renal Hemodynamics)
Epinephrine Released by the chromaffin cells of the adrenal medulla (see Chapter 50), epinephrine exerts dose-dependent effects on the kidney that are similar to those of norepinephrine (see earlier). (See Note: Effects of Epinephrine on Renal Hemodynamics)
Dopamine Dopaminergic nerve fibers terminate in the kidney, and dopamine receptors are present in renal blood vessels. The renal effect of dopamine is to vasodilate, which is opposite to the effects of epinephrine and norepinephrine.
Endothelins The endothelins are peptides with strong vasoconstrictor action (see Chapter 20) but a very short half-life. The hemodynamic actions of endothelins are limited to local effects because little of this hormone escapes into the general circulation. In the kidney, several agents—ANG II, epinephrine, higher doses of AVP, thrombins, and shear stress—trigger release of endothelins from the endothelium of renal cortical vessels and mesangial cells. The endothelins act locally to constrict smooth muscles of renal vessels and thus most likely are a link in the complex network of local messengers between endothelium and smooth muscle. When administered systemically, endothelins constrict the afferent and efferent arterioles and reduce the ultrafiltration coefficient (Kf). The result is a sharp reduction in both RBF and GFR.
Prostaglandins In the kidney, vascular smooth muscle cells, endothelial cells, mesangial cells, and tubule and interstitial cells of the renal medulla are particularly important for synthesizing the locally acting prostaglandins from arachidonic acid, through the cyclooxygenase pathway (see Chapter 3). The effects of prostaglandins are complex and depend on the baseline vasoconstriction exerted by ANG II. Indeed, prostaglandins appear mainly to be protective and are important under conditions in which the integrity of the renal circulation is threatened. In particular, local intrarenal effects of prostaglandins prevent excessive vasoconstriction, especially during increased sympathetic simulation or activation of the renin-angiotensin system. Accelerated prostaglandin synthesis and release are responsible for maintaining fairly constant blood flow and GFR in conditions of high ANG II levels (e.g., during surgery, following blood loss, or in the course of salt depletion).
Leukotrienes Probably in response to inflammation, the renal vascular smooth muscle cells and glomeruli—as well as leukocytes and blood platelets—synthesize several leukotrienes from arachidonic acid, through the lipoxygenase pathway (see Chapter 3). These locally acting vasoactive agents are strong vasoconstrictors; their infusion reduces RBF and GFR.
Nitric Oxide The endothelial cells of the kidney use nitrous oxide synthase (NOS) to generate NO from L-arginine (see Chapter 3). NO has a strong smooth muscle relaxing effect and—under physiological, unstressed conditions—produces significant renal vasodilation. NO probably defends against excess vasoconstrictor effects of agents such as ANG II and epinephrine. Injecting NOS inhibitors into the systemic circulation constricts afferent and efferent arterioles, thus increasing renal vascular resistance and producing a sustained fall of RBF and GFR. Moreover, NOS inhibitors blunt the vasodilatation that is triggered by low rates of fluid delivery to the macula densa part of the TGF mechanism.
Books and Reviews
Komlosi P, Fintha A, Bell PD: Renal cell-to-cell communication via extracellular ATP. Physiology 2005; 20:86-90.
Maddox DA, Brenner BM: Glomerular ultrafiltration. In Brenner BM (ed): The Kidney, 6th ed, pp 319-374. Philadelphia: WB Saunders, 2000.
Navar LG, Inscho WE, Majid DSA, et al: Paracrine regulation of the renal microcirculation. Physiol Rev 1996; 76:425-537.
Pallone TL, Zhang Z, Rhinehart K: Physiology of the renal medullary microcirculation. Am J Physiol 2003; 284:F253-F266.
Schnermann J: The juxtaglomerular apparatus: From anatomical peculiarity to physiological relevance. J Am Soc Nephrol 2003; 14:1681-1694.
Stockand JD, Sansom SC: Glomerular mesangial cells: Electrophysiology and regulation of contraction. Physiol Rev 1998; 78:723-744.
Journal Articles
Arendshorst WJ, Finn WF, Gottschalk CW: Autoregulation of renal blood flow in the rat kidney. Am J Physiol 1975; 228:127-133.
Brenner BM, Troy JL, Daugharty TM, et al: Dynamics of glomerular ultrafiltration in the rat. II. Plasma flow dependence of GFR. Am J Physiol 1972; 223:1184-1190.
Lapointe JY, Laamarti A, Bell PD: Ionic transport in macula densa cells. Kidney Int 1998; 54:S58-S64.
Robertson CR, Deen WM, Troy JL, Brenner BM: Dynamics of glomerular ultrafiltration in the rat. III. Hemodynamics and autoregulation. Am J Physiol 1972; 223:1191-1200.
Tucker BJ, Blantz RC: An analysis of the determinants of nephron filtration rate. Am J Physiol 1977; 232:F477-F483.
Wilcox CS, Welch WJ, Murad F, et al: Nitric oxide synthase in macula densa regulates glomerular capillary pressure. Proc Natl Acad Sci U S A 1992; 89:11993-11997.