
Emile L. Boulpaep
When faced with a patient who appears seriously ill, clinicians focus their immediate attention on the patient’s vital signs: temperature, respiratory rate, pulse, and blood pressure. These parameters are aptly named vital because they reflect the most fundamental aspects of health and even survival; a significant abnormality in any of these components indicates that emergent care is required.
In this chapter, we focus on blood pressure, a critical hemodynamic factor and one that is easily measured. An adequate blood pressure is necessary for proper organ perfusion. Too low, and we say that the patient is in shock. Too high, and we say that the patient is hypertensive; an acute and profound elevation of the blood pressure can be just as dangerous as one that suddenly plummets. Here, we examine both the short -and long-term mechanisms that the body uses to regulate arterial blood pressure.
Because the arterial blood pressure depends to a large degree on the cardiac output, we also examine the regulation of this critical parameter. Finally, because cardiac output also depends on the venous return of blood to the heart, we discuss the matching between input (i.e., venous return) and cardiac output.
Imagine that we must distribute city water to 1000 houses. We could decide in advance that each house uses 500 L/day and then pump this amount to each house at a constant rate. In other words, we would deliver ~20 L/hr, regardless of actual water usage. The cardiovascular equivalent of such a system would be a circulation in which the cardiac output and the delivery of blood to each tissue remain constant.
Alternatively, we could connect all the houses to a single, large water tower that provides a constant pressure head. Because the height of the water level in the tower is fairly stable, all faucets in all houses see the same pressure at all times. This system offers several advantages. First, each house can regulate its water usage by opening faucets according to need. Second, heavy water usage in one house with all faucets open does not affect the pressure head in the other houses with only one faucet open. Third, the pressure head in the water tower guarantees that each house will receive sufficiently high pressure to send water to houses with upper floors. This water tower system is analogous to our own circulatory system, which provides the same flexibility for distribution of blood flow by, first and foremost, controlling the systemic mean arterial blood pressure.
The priority given to arterial pressure control is necessary because of the anatomy of the circulatory system. A network of branched arteries delivers to each organ a mean arterial pressure that approximates the mean aortic pressure. Thus, all organs, whether close to or distant from the heart, receive the same mean arterial pressure. Each organ, in turn, controls local blood flow by increasing or decreasing local arteriolar resistance. In Chapter 20, we described these local control mechanisms in a general way, and in Chapter 24, we will discuss specific vascular beds.
The system that we just introduced works because a change in blood flow in one vascular bed does not affect blood flow in other beds—as long as the heart can maintain the mean arterial pressure. However, the circulatory system must keep mean arterial pressure not only constant but also high enough for glomerular filtration to occur in the kidneys or to overcome high tissue pressures in organs such as the eye.
Since Chapter 17, we have regarded the heart as the generator of a constant driving pressure. The principles of the feedback loops that the body uses to control the circulation are similar to those involved in the regulation of many other physiological systems. The short-term regulation of arterial pressure—on a time scale of seconds to minutes—occurs through neural pathways and targets the heart, vessels, and adrenal medulla. This short-term regulation is the topic of the present discussion. The long-term regulation of arterial pressure—on a time scale of hours or days—occurs through pathways that target the blood vessels, as well as the kidneys, in their control of extracellular fluid volume. This long-term regulation is the topic of the final portion of the chapter.
The neural reflex systems that regulate mean arterial pressure operate as a series of negative feedback loops. All such loops are composed of the following elements:
1. A detector. A sensor or receptor quantitates the controlled variable and transduces it into an electrical signal that is a measure of the controlled variable.
2. Afferent neural pathways. These convey the message away from the detector, to the central nervous system (CNS).
3. A coordinating center. A control center in the CNS compares the signal detected in the periphery to a set-point, generates an error signal, processes the information, and generates a message that encodes the appropriate response.
4. Efferent neural pathways. These convey the message from the coordinating center to the periphery.
5. Effectors. These elements execute the appropriate response and alter the controlled variable, thereby correcting its deviation from the set-point.
A dual system of sensors and neural reflexes controls mean arterial pressure. The primary sensors are baroreceptors, which are actually stretch receptors or mechanoreceptors that detect distention of the vascular walls. The secondary sensors are chemoreceptors that detect changes in blood PO2, PCO2, and pH. The control centers are located within the CNS, mostly in the medulla, but sites within the cerebral cortex and hypothalamus also exert control. The effectors include the pacemaker and muscle cells in the heart, the vascular smooth muscle cells (VSMCs) in arteries and veins, and the adrenal medulla.
We all know from common experience that the CNS influences the circulation. Emotional stress can cause blushing of the skin or an increase in heart rate. Pain—or the stress of your first day in a gross anatomy laboratory—can elicit fainting because of a profound, generalized vasodilation and a decrease in heart rate (i.e., bradycardia).
Early physiologists, such as Claude Bernard, observed that stimulation of peripheral sympathetic nerves causes vasoconstriction and that interruption of the spinal cord in the lower cervical region drastically reduces blood pressure (i.e., produces hypotension). However, the first idea that a reflex might be involved in regulating the cardiovascular system came from experiments in which stimulation of a particular sensory (i.e., afferent) nerve caused a change in heart rate and blood pressure. In 1866, E. de Cyon and Carl Ludwig studied the depressor nerve, a branch of the vagus nerve. After they transected this nerve, they found that stimulation of the central (i.e., cranial) end of the cut nerve slows down the heart and produces hypotension. Hering showed that stimulation of the central end of another cut nerve—the sinus nerve (nerve of Hering), which innervates the carotid sinus—also causes bradycardia and hypotension. These two experiments strongly suggested that the depressor and sinus nerves carry sensory information to the brain and that the brain in some fashion uses this information to control cardiovascular function. (See Note: Élie de Cyon and Carl F. Ludwig)
Corneille Heymans was the first to demonstrate that pressure receptors—called baroreceptors—are located in arteries and are part of a neural feedback mechanism that regulates mean arterial pressure. He found that injection of epinephrine—also known as adrenaline—into a dog raises blood pressure and, later, lowers heart rate. Heymans hypothesized that increased blood pressure stimulates arterial sensors, which send a neural signal to the brain, and that the brain in turn transmits a neural signal to the heart, resulting in bradycardia.
To demonstrate that the posited feedback loop did not depend on the blood-borne traffic of chemicals between the periphery and the CNS, Heymans cross-perfused two dogs, so that only nerves connected the head of the dog to the rest of the animal’s body. The dog’s head received its blood flow from a second animal. (Today, one would use a heart-lung machine to perfuse the head of the first dog.) Heymans found that the vagus nerve carried both the upward and the downward traffic for the reflex arc and that agents carried in the blood played no role. He used a similar approach to demonstrate the role of the peripheral chemoreceptors in the control of respiration (see Chapter 32). For his work on the neural control of respiration, Heymans received the Nobel Prize in Physiology or Medicine for 1938. (See Note: Corneille Heymans)
The entire control process, known as the baroreceptor control of arterial pressure (Fig. 23-1), consists of baroreceptors (i.e., the detectors), afferent neuronal pathways, control centers in the medulla, efferent neuronal pathways, and the heart and blood vessels (i.e., the effectors). The negative feedback loop is designed so that increased mean arterial pressure causes vasodilation and bradycardia, whereas decreased mean arterial pressure causes vasoconstriction and tachycardia (i.e., increased heart rate).
Figure 23-1 Baroreceptor control of arterial pressure. In this example, we assume that an increase in mean arterial pressure (violet box) is the primary insult.
The sensor component consists of a set of mechanoreceptors located at strategic high-pressure sites within the cardiovascular system. As discussed later, the cardiovascular system also has low-pressure sensors that detect changes in venous pressure. The two most important high-pressure loci are the carotid sinus and the aortic arch. Stretching of the vessel walls at either of these sites causes vasodilation and bradycardia. The carotid sinus (Fig. 23-2A) is a very distensible portion of the wall of the internal carotid artery, located just above the branching of the common carotid artery into the external and internal carotid arteries. The arterial wall at the carotid sinus contains thin lamellae of elastic fibers but very little collagen or smooth muscle. The aortic arch (Fig. 23-2B) is also a highly compliant portion of the arterial tree that distends during each left ventricular ejection.
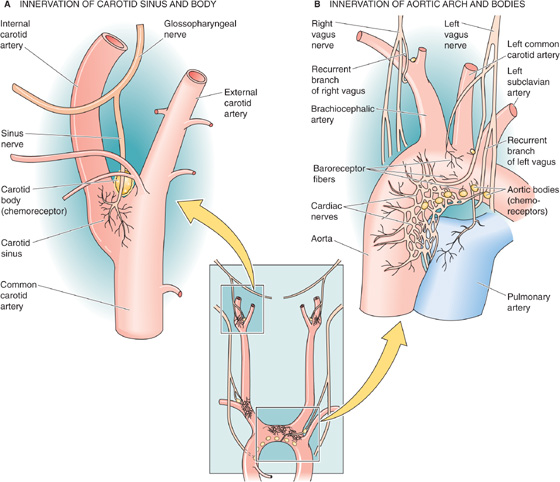
Figure 23-2 Afferent pathways of the high-pressure baroreceptors. In B, the chemoreceptors (i.e., aortic bodies) are located on the underside of the aortic arch as well as at the bifurcation of the right brachiocephalic artery. On the left, aortic bodies, if present, are in a notch between the common carotid and the left subclavian arteries.
The baroreceptors in both the carotid sinus and the aortic arch are the branched and varicose (or coiled) terminals of myelinated and unmyelinated sensory nerve fibers, which are intermeshed within the elastic layers. The terminals express several nonselective cation channels in the TRP family: TRPC1, TRPC3, TRPC4, and TRPC5. TRPC channels may play a role both as primary electromechanical transducers and as modulators of transduction. An increase in the transmural pressure difference enlarges the vessel and thereby deforms the receptors. Baroreceptors are not really pressure sensitive but stretch sensitive. Indeed, TRPC1 is stretch sensitive. Direct stretching of the receptors results in increased firing of the baroreceptor’s sensory nerve. The difference between stretch sensitivity and pressure sensitivity becomes apparent when one prevents the expansion of the vessel by surrounding the arterial wall with a plaster cast. When this is done, increase of the transmural pressure fails to increase the firing rate of the baroreceptor nerve. Removal of the cast restores the response. Other tissues surrounding the receptors act as a sort of mechanical filter, although much less so than the plaster cast.
As shown by the red records in the upper two panels of Figure 23-3A, a step increase in transmural pressure (i.e., stretch) produces an inward current that depolarizes the receptor, generating a receptor potential (see Chapter 15). The pressure increase actually causes a biphasic response in the receptor voltage. Following a large initial depolarization (the dynamic component) is a more modest but steady depolarization (the static component). This receptor potential, unlike a regenerative action potential, is a graded response whose amplitude is proportional to the degree of stretch (compare red and purple records).
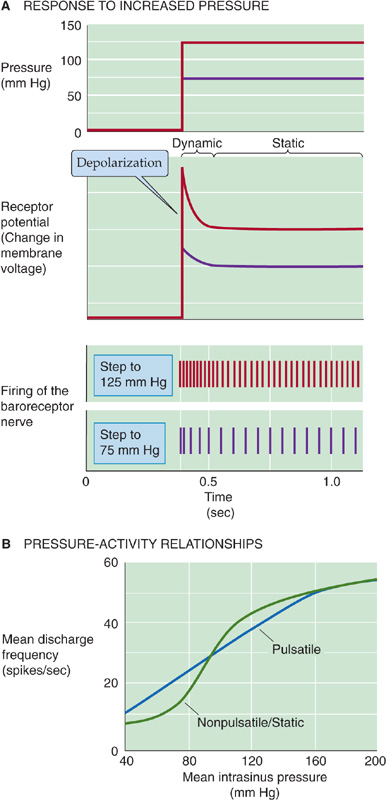
Figure 23-3 Afferent pathways of the high-pressure baroreceptors. In A, the records refer to hypothetical experiments on a baroreceptor in which one suddenly raises blood pressure to 75 mm Hg (purple) or to 125 mm Hg (red). In B, the records refer to results from the carotid sinus nerve. (Data from Chapleau MW, Abboud FM: Contrasting effects of static and pulsatile pressure on carotid baroreceptor activity in dogs. Circ Res 1987; 61:648-658.)
These sensory neurons are bipolar neurons (see Chapter 10) whose cell bodies are located in ganglia near the brainstem. The central ends of these neurons project to the medulla. The cell bodies of the aortic baroreceptor neurons, which are located in the nodose ganglion (a sensory ganglion of the vagus nerve), express several TRPC channels. Although these nonselective cation channels are stretch sensitive and blocked by Gd3+, they probably set only the sensitivity of the baroreceptor response. (See Note: Receptor Potential of Baroreceptors)
If, in the absence of a pressure step, we depolarize the baroreceptor nerve ending, the result is an increase in the frequency of action potentials in the sensory nerve. Therefore, it is not surprising that graded increases in pressure produce graded depolarizations, resulting in graded increases in the spike frequency (Fig. 23-3A, lower two panels). Graded decreases in pressure gradually diminish receptor activity until the firing falls to vanishingly low frequencies at pressures around 40 to 60 mm Hg. Therefore, the baroreceptor encodes the mechanical response as a frequency-modulated signal.
A step increase in pressure generates a large initial depolarization, accompanied by a transient high-frequency discharge. The smaller, steady depolarization is accompanied by a steady but lower spike frequency. Because baroreceptors have both a dynamic and a static response, they are sensitive to both the waveform and the amplitude of a pressure oscillation. Therefore, bursts of action potentials occurring in phase with the cardiac cycle encode information on the pulse pressure (i.e., difference between the peak systolic and lowest diastolic pressures). The static pressure-activity curve in Figure 23-3B—obtained on single units of the sinus nerve—shows that the spike frequency rises sigmoidally with increases in steady blood pressure. The pulsatile pressure-activity curve in Figure 23-3B shows that when the pressure is oscillating, the mean discharge frequency at low mean pressures is higher than when pressure is steady.
Not all arterial receptors have the same properties. As we gradually increase intravascular pressure, different single units in the isolated carotid sinus begin to fire at different static pressures. Thus, the overall baroreceptor response to a pressure increase includes both an increased firing rate of active units and the recruitment of more units, until a saturation level is reached at ~200 mm Hg. The carotid sinus in some individuals is unusually sensitive. When wearing a tight collar, such a person may faint just from turning the head because compression or stretching of the carotid sinus orders the medulla to lower blood pressure.
The responses of the receptors in the carotid sinus and the aortic arch are different. In a given individual, a change in the carotid sinus pressure has a greater effect on the systemic arterial pressure than does a change in the aortic pressure. Compared with the carotid sinus receptor, the aortic arch receptor
has a higher threshold for activating the static response (~110 mm Hg vs. ~50 mm Hg);
has a higher threshold, likewise, for the dynamic response;
continues responding to pressure increases at pressures at which the carotid baroreceptor has already saturated;
is less sensitive to the rate of pressure change; and
responds less effectively to a decrease in pressure than to an increase in pressure (over the same pressure range).
Once a change in the arterial pressure has produced a change in the firing rate of the sensory nerve, the signal travels to the medulla. The afferent pathway for the carotid sinus reflex is the sinus nerve, which then joins the glossopharyngeal trunk (CN IX; Fig. 23-2A). The cell bodies of the carotid baroreceptors are located in the petrosal (or inferior) ganglion of the glossopharyngeal nerve (Fig. 23-4A). The afferent pathways for the aortic arch reflex are sensory fibers in the depressor branch of the vagus nerve (CN X; Fig. 23-2B). After joining the superior laryngeal nerves, the sensory fibers run cranially to their cell bodies in the nodose (or inferior) ganglion of the vagus (Fig. 23-4A).
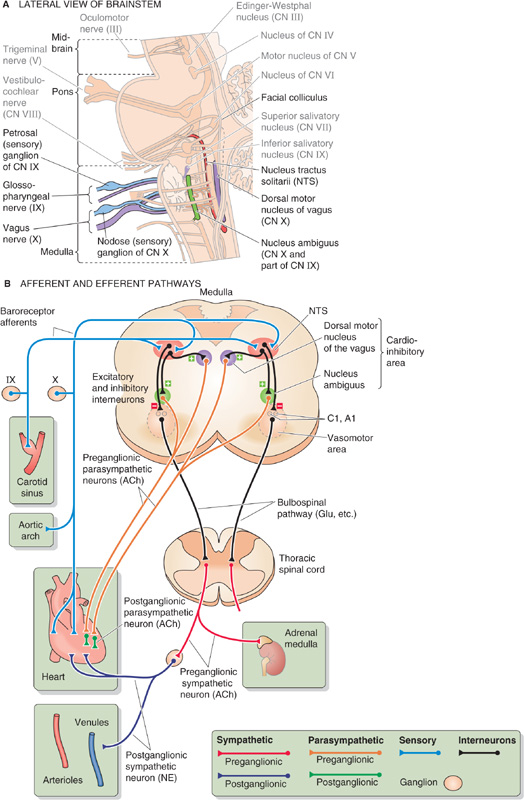
Figure 23-4 Medullary control centers for the cardiovascular system. In A, the relevant nuclei and cranial nerves are colorized and labeled in dark type. B, Hypothetical section through the medulla, showing projections of structures that do not necessarily coexist in a single cross section. ACh, acetylcholine; CN, cranial nerve; “Glu, etc.”, glutamate and other neurotransmitters (i.e., norepinephrine and peptides); NE, norepinephrine; NTS, nucleus tractus solitarii.
The entire complex of medullary nuclei involved in cardiovascular regulation is called the medullary cardiovascular center. Within this center, broad subdivisions can be distinguished, such as a vasomotor area and a cardioinhibitory area. The medullary cardiovascular center receives all important information from the baroreceptors and is the major coordinating center for cardiovascular homeostasis. (See Note: Identifying the Medullary Cardiovascular Control Center)
Most afferent fibers from the two high-pressure baroreceptors project to the nucleus tractus solitarii (NTS, from the Latin tractus solitarii [of the solitary tract]; see Chapter 14), one of which is located on each side of the dorsal medulla (Fig. 23-4A, B). The neurotransmitter released by the baroreceptor afferents onto the NTS neurons is glutamate, which binds to the GluR2 subunits of AMPA receptors (see Chapter 13 and Fig. 15-15). Some neurons in the NTS (and also in the dorsal motor nucleus of the vagus, see later) have P2X purinoceptors that are activated by extracellular ATP.
Inhibitory interneurons project from the NTS onto the vasomotor area in the ventrolateral medulla (Fig. 23-4B). This vasomotor area includes the A1 and C1 areas in the rostral ventrolateral medulla as well as the inferior olivary complex and other nuclei. Stimulation of the neurons in the C1 area produces a vasoconstrictor response. Unless inhibited by output from the NTS interneurons, neurons within the C1 area produce a tonic output that promotes vasoconstriction. Therefore, an increase in pressure stimulates baroreceptor firing, which in turn causes NTS interneurons to inhibit C1 neurons, resulting in vasodilation. This C1 pathway largely accounts for the vascular component of the baroreceptor reflex. The bursting pattern of C1 neurons is locked to the cardiac cycle. (See Note: The Vasomotor Area)
Excitatory interneurons project from the NTS onto a cardioinhibitory area, which includes the nucleus ambiguus and the dorsal motor nucleus of the vagus (see Chapter 14). Neurons in the dorsal motor nucleus of the vagus largely account for the cardiac component of the baroreceptor reflex (i.e., bradycardia). Some inhibitory interneurons probably project from the NTS onto a cardioacceleratory area, also located in the dorsal medulla. Stimulation of neurons in this area causes heart rate and cardiac contractility to increase.
After the medullary cardiovascular center has processed the information from the afferent baroreceptor pathways and integrated it with data coming from other pathways, this center must send signals back to the periphery through efferent (i.e., motor) pathways. The baroreceptor response has two major efferent pathways: the sympathetic and parasympathetic divisions of the autonomic nervous system.
Sympathetic Efferents As discussed earlier, increased baroreceptor activity instructs the NTS to inhibit the C1 (i.e., vasomotor) and cardioacceleratory areas of the medulla. Functionally diverse bulbospinal neurons in both areas send axons down the spinal cord to synapse on and to stimulate preganglionic sympathetic neurons in the intermediolateral column of the spinal cord. Thus, we can think of these bulbospinal neurons as being presympathetic or pre-preganglionic. The synapse can be adrenergic (in the case of the C1 neurons), peptidergic (e.g., neuropeptide Y), or glutamatergic. The glutamatergic synapses are the most important for the vasomotor response; the released glutamate acts on both NMDA and non-NMDA receptors on the preganglionic sympathetic neurons.
The cell bodies of the preganglionic sympathetic neurons are located in the intermediolateral gray matter of the spinal cord, between levels T1 and L3 (see Fig. 14-4). After considerable convergence and divergence, most of the axons from these preganglionic neurons synapse with postganglionic sympathetic neurons located within ganglia of the paravertebral sympathetic chain as well as within prevertebral ganglia (see Fig. 14-2). The neurotransmitter between the preganglionic and postganglionic sympathetic neurons is acetylcholine (ACh), which acts at N2 nicotinic acetylcholine receptors (nAChR). Because of the convergence and divergence, sympathetic output does not distribute according to dermatomes (see Chapter 14). Postganglionic sympathetic fibers control a wide range of functions (see Fig. 14-4). Those that control blood pressure run with the large blood vessels and innervate both muscular arteries and arterioles and veins.
Increased sympathetic activity produces vasoconstriction. Indeed, the baroreceptor reflex produces vasodilation because it inhibits the tonic stimulatory output of the vasomotor C1 neurons. Because the bulbospinal neurons synapse with preganglionic sympathetic neurons between T1 and L3, severing of the spinal cord above T1 causes a severe fall in blood pressure. Sectioning of the cord below L3 produces no fall in blood pressure.
Another important target of postganglionic neurons with a cardiovascular mission is the heart. Output from the middle cervical and stellate ganglia, along with that from several upper thoracic ganglia (see Fig. 14-4), ramifies and after extensive convergence and divergence forms the cardiac nerves. Thus, severing of the spinal cord above T1 would block the input to the preganglionic sympathetic fibers to the heart. In addition, some preganglionic fibers do not synapse in sympathetic ganglia at all but directly innervate the chromaffin cells of the adrenal medulla through the splanchnic nerve. These cells release epinephrine, which acts on the heart and blood vessels (see later).
Parasympathetic Efferents As noted earlier, increased baroreceptor activity instructs the NTS to stimulate neurons in the nucleus ambiguus and the dorsal motor nucleus of the vagus (cardioinhibitory area). The target neurons in these two nuclei are preganglionic parasympathetic fibers of the vagus nerve (CN X) that project to the heart. These efferent vagal fibers follow the common carotid arteries, ultimately synapsing in small ganglia in the walls of the atria. There, they release ACh onto the N2-type nAChRs of the postganglionic parasympathetic neurons. The short postganglionic fibers then innervate the sinoatrial (SA) node, the atria, and the ventricles, where they act primarily to slow conduction through the heart (see later).
The cardiovascular system uses several effector organs to control systemic arterial pressure: the heart, arteries, veins, and adrenal medulla (Fig. 23-5).
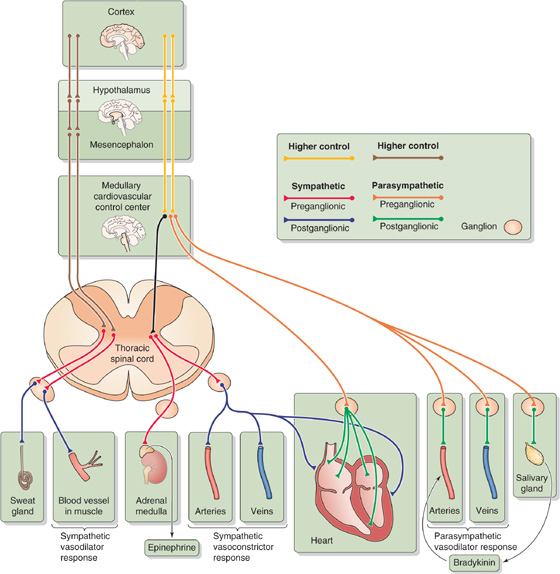
Figure 23-5 Autonomic control of cardiovascular end organs.
Sympathetic Input to the Heart (Cardiac Nerves) The sympathetic division of the autonomic nervous system influences the heart through the cardiac nerves, which form a plexus near the heart (Fig. 23-2). The postganglionic fibers, which release norepinephrine, innervate the SA node, atria, and ventricles. Their effect is to increase both heart rate and contractility (Table 23-1). Because it dominates the innervation of the SA node (which is in the right atrium), sympathetic input from the right cardiac nerve has more effect on the heart rate than does input from the left cardiac nerve. On the other hand, sympathetic input from the left cardiac nerve has more effect on contractility. In general, the cardiac nerves do not exert a strong tonic cardioacceleratory activity on the heart. At rest, their firing rate is less than that of the vagus nerve.
Table 23-1 Effects of Sympathetic and Parasympathetic Pathways on the Cardiovascular System
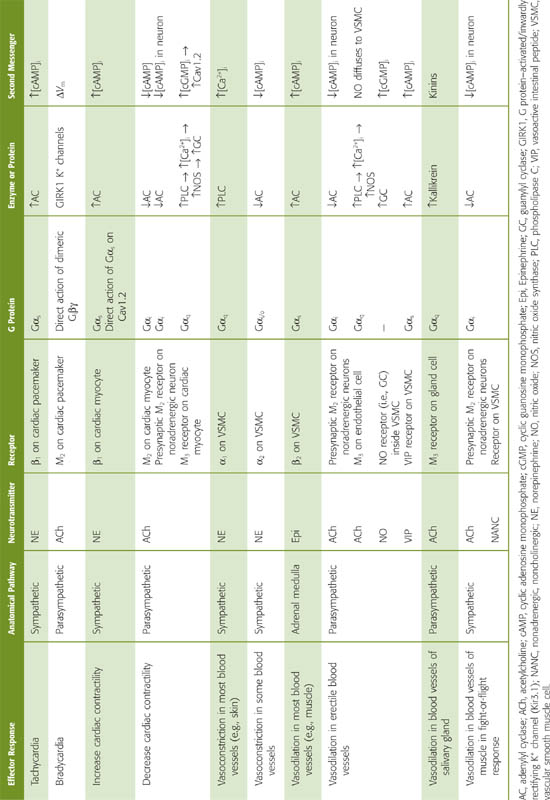
Parasympathetic Input to the Heart (Vagus Nerve) The vagus normally exerts an intense tonic, parasympathetic activity on the heart through ACh released by the postganglionic fibers. Severing of the vagus nerve or administration of atropine (which blocks the action of ACh) increases heart rate. Indeed, experiments on the effects of the vagus on the heart led to the discovery of the first neurohumoral transmitter, ACh (see Chapter 8). Vagal stimulation decreases heart rate by its effect on pacemaker activity (see Chapter 21). Just as the actions of the right and left cardiac nerves are somewhat different, the right vagus is a more effective inhibitor of the SA node than the left. The left vagus is a more effective inhibitor of conduction through the AV node. Vagal stimulation, to some extent, also reduces cardiac contractility.
Sympathetic Input to Blood Vessels (Vasoconstrictor Response) The vasoconstrictor sympathetic fibers are disseminated widely throughout the blood vessels of the body. These fibers are most abundant in the kidney and the skin, relatively sparse in the coronary and cerebral vessels, and absent in the placenta. They release norepinephrine, which binds to adrenoceptors on the membrane of VSMCs. In most vascular beds, vasodilation is the result of a decrease in the tonic discharge of the vasoconstrictor sympathetic nerves.
Parasympathetic Input to Blood Vessels (Vasodilator Response) Parasympathetic vasodilator fibers are far less common than sympathetic vasoconstrictor fibers. The parasympathetic vasodilator fibers supply the salivary and some gastrointestinal glands and are also crucial for vasodilation of erectile tissue in the external genitalia (see Chapters 54 and 55). Postganglionic parasympathetic fibers release ACh, which, as we shall see, indirectly causes vasodilation. In addition, these fibers produce vasodilation by releasing nitric oxide (NO) and vasoactive intestinal polypeptide (see Chapter 13).
Sympathetic Input to Blood Vessels in Skeletal Muscle (Vasodilator Response) In addition to the more widespread sympathetic vasoconstrictor fibers, skeletal muscle in nonprimates has a special system of sympathetic fibers that produce vasodilation (see Chapter 14). These special fibers innervate the large precapillary vessels in skeletal muscle. The origin of the sympathetic vasodilator pathway is very different from that of the vasoconstrictor pathway, which receives its instructions—ultimately—from the vasomotor area of the medulla. Instead, the sympathetic vasodilator fibers receive their instructions—ultimately—from neurons in the cerebral cortex, which synapse on other neurons in the hypothalamus or in the mesencephalon. The fibers from these second neurons (analogous to the bulbospinal neurons discussed earlier) transit through the medulla without interruption and reach the spinal cord. There, these fibers synapse on preganglionic sympathetic neurons in the intermediolateral column, just as other descending neurons do. The vasodilatory preganglionic fibers synapse in the sympathetic ganglia on postganglionic neurons that terminate on VSMCs surrounding skeletal muscle blood vessels. These postganglionic vasodilatory fibers release ACh and perhaps other transmitters. (See Note: Cholinergic Sympathetic Neurons)
Therefore, blood vessels within skeletal muscle receive both sympathetic adrenergic and sympathetic cholinergic innervation. The cholinergic system, acting directly through muscarinic receptors, relaxes VSMCs and causes rapid vasodilation. This vasodilation in skeletal muscle occurs in the fight-or-flight response as well as perhaps during the anticipatory response in exercise (see Chapter 14). In both cases, mobilization of the sympathetic vasodilator system is accompanied by extensive activation of the sympathetic division, including cardiac effects (i.e., increased heart rate and contractility) and generalized vasoconstriction of all vascular beds except those in skeletal muscle. (Little vasoconstriction occurs in cerebral and coronary beds, which have sparse sympathetic vasoconstrictor innervation.)
Adrenal Medulla We have already mentioned that some preganglionic sympathetic fibers in the sympathetic splanchnic nerves also innervate the chromaffin cells in the adrenal medulla. Therefore, the adrenal medulla is the equivalent of a sympathetic ganglion. The synaptic terminals of the preganglionic fibers release ACh, which acts on nAChRs of the chromaffin cells of the adrenal medulla (see Chapter 50). Chromaffin cells are thus modified postganglionic neurons that release their transmitters—epinephrine and, to a far lesser degree, norepinephrine—into the bloodstream rather than onto a specific end organ. Thus, the adrenal medulla participates as a global effector that through its release of epinephrine causes generalized effects on the circulation. As we will see in the next section, the epinephrine released by the adrenal medulla acts on both the heart and the blood vessels and thereby contributes to the control of the systemic arterial pressure.
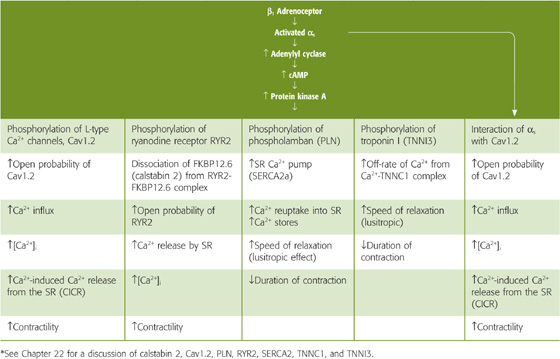
Adrenergic Receptors in the Heart The sympathetic output to the heart affects both heart rate and contractility. Norepinephrine, released by the postganglionic sympathetic neurons, acts on postsynaptic β1-adrenergic receptors of pacemaker cells in the SA node as well as on similar receptors of myocardial cells in the atria and ventricles. The β1 adrenoceptor, through the G protein Gs, acts through the cAMP–protein kinase A pathway (see Chapter 3) to phosphorylate multiple effector molecules in both pacemaker cells and cardiac myocytes (Table 23-1). (See Note: The Action Potential of the SA Node)
In pacemaker cells, β1 agonists stimulate (1) If, the diastolic Na+ current, through HCN channels and (2) ICa, a Ca2+ current, through T- and L-type Ca2+ channels. The net effect of these two changes is an increased rate of diastolic depolarization (i.e., phase 4 of action potential; see Fig. 21-4A) and a negative shift in the threshold for the action potential (see Chapter 21). Because diastole shortens, the heart rate increases.
In myocardial cells, β1 agonists exert several parallel positive inotropic effects through protein kinase A (Table 23-2). In addition, the activated αs subunit of the G protein can directly activate L-type Ca2+ channels. The net effects of these pathways are contractions that are both stronger (see Chapter 21) and briefer (see Chapter 22).
Table 23-2 Effects of Activating the β1-Adrenergic Receptor in Ventricular Muscle*
Cholinergic Receptors in the Heart Parasympathetic output to the heart affects heart rate and, to a much lesser extent, contractility. ACh released by postsynaptic parasympathetic neurons binds to M2 muscarinic (i.e., G protein–coupled) receptors on pacemaker cells of the SA node and on ventricular myocytes (Table 23-1).
In pacemaker cells, ACh acts by three mechanisms. (1) ACh triggers a membrane-delimited signaling pathway mediated not by the G protein α subunits but rather by the βγ heterodimers (see Chapter 3). The newly released βγ subunits directly open inward rectifier K+ channels (GIRK1 or Kir3.1) in pacemaker cells (see Chapters 7 and 21). The resulting elevation of the K+ conductance makes the maximum diastolic potential more negative during phase 4 of the action potential. (2) ACh also decreases If, thereby reducing the rate of diastolic depolarization. (3) ACh decreases ICa, thereby both reducing the rate of diastolic depolarization and making the threshold more positive (see Chapter 21). The net effect is a reduction in heart rate.
In myocardial cells, ACh has a minor negative inotropic effect, which could occur by two mechanisms. (1) Activation of the M2 receptor, through Gαi, inhibits adenylyl cyclase, reducing [cAMP]i, thereby counteracting the effects of adrenergic stimulation. (2) Activation of the M3 receptor, through Gαq, stimulates phospholipase C, raising [Ca2+]i and thus stimulating nitric oxide synthase (NOS; see Chapter 3). The newly formed NO stimulates guanylyl cyclase and increases [cGMP]i, which somehow inhibits L-type Ca2+ channels and decreases Ca2+ influx.
Adrenergic Receptors in Blood Vessels The sympathetic division of the autonomic nervous system can modulate the tone of vascular smooth muscle in arteries, arterioles, and veins through two distinct routes—postganglionic sympathetic neurons and the adrenal medulla. Whether the net effect of sympathetic stimulation in a particular vessel is vasoconstriction (increased VSMC tone) or vasodilation (decreased VSMC tone) depends on four factors: (1) which agonist is released, (2) which adrenoceptors that agonist binds to, (3) whether receptor occupancy tends to cause vasoconstriction or vasodilation, and (4) which receptor subtypes happen to be present on a particular VSMC.
Which agonist is released is the most straightforward of the factors. Postganglionic sympathetic neurons release norepinephrine, and the adrenal medulla releases primarily epinephrine.
Which receptors the agonist binds to is more complex. Norepinephrine and epinephrine do not have exclusive affinity for a single type of adrenoceptor. The original α and β designations followed from the observation that norepinephrine appeared to have its greatest activity on α receptors, and epinephrine, on β receptors. However, although norepinephrine binds with a greater affinity to α receptors than to β receptors, it also can activate β receptors. Similarly, although epinephrine binds with a greater affinity to β receptors than to α receptors, it can also activate α receptors. Of course, synthetic agonists may be more specific and potent than either norepinephrine or epinephrine (e.g., the α agonist phenylephrine and β agonist isoproterenol). A finer pharmacological and molecular dissection reveals that both α and β receptors have subgroups (e.g., β1 and β2), and even the subgroups have subgroups (see Chapter 14). Each of these many adrenoceptor types has a unique pharmacology. Thus, the β1 receptor has about the same affinity for epinephrine and norepinephrine, but the β2 receptor has a higher affinity for epinephrine than for norepinephrine.
Whether receptor occupancy tends to cause vasoconstriction or vasodilation is straightforward (Table 23-1). The vasoconstriction elicited by catecholamines is an α effect, in particular, an α1 effect. Thus, norepinephrine released from nerve terminals acts on the α1 adrenoceptor, which is coupled to the G protein Gq. The resulting activation of phospholipase C (see Chapter 3) and formation of inositol 1, 4, 5-trisphosphate (IP3) lead to a rise in [Ca2+]i and smooth muscle contraction (see Table 20-7). In contrast, vasodilation, elicited by epinephrine released from the adrenal medulla, is a β2 effect. Occupancy of the β2 adrenoceptor triggers the cAMP–protein kinase A pathway, leading to phosphorylation of myosin light chain kinase (MLCK; see Chapter 9), which reduces the sensitivity of MLCK to the Ca2+-calmodulin complex, resulting by default in smooth muscle relaxation (see Table 20-7).
Which receptor subtypes happen to be present on a particular VSMC is a complex issue. Many blood vessels are populated with a mixture of α-receptor or β-receptor subtypes, each stimulated to varying degrees by norepinephrine and epinephrine. Therefore, the response of the cell depends on the relative dominance of the subtype of receptor present on the cell surface. Fortunately, the only two subtypes in blood vessels that matter clinically are α1 and β2.
The ultimate outcome in the target tissue (vasoconstriction versus vasodilation) depends on both the heterogeneous mixture of agonists (norepinephrine versus epinephrine) applied and the heterogeneous mixture of VSMC receptors (α1 and β2) present in tissues. As an example, consider blood vessels in the skin and heart. Because cutaneous blood vessels have only α1 receptors, they can only vasoconstrict, regardless of whether the agonist is norepinephrine or epinephrine. On the other hand, epinephrine causes coronary blood vessels to dilate because they have a greater number of β2 receptors than α1 receptors.
Cholinergic Receptors in or near Blood Vessels The addition of ACh to an isolated VSMC causes contraction (see Table 20-7). Thus, in an artificial situation in which the nerve terminals release only ACh and in which no other tissues are present, ACh would lead to vasoconstriction. In real life, however, ACh dilates blood vessels by binding to muscarinic receptors on neighboring cells and generating other messengers that indirectly cause vasodilation (Table 23-1). For example, in skeletal muscle, ACh may bind to M2 receptors on the presynaptic membranes of postganglionic sympathetic neurons, decreasing [cAMP]i and inhibiting the release of norepinephrine. Thus, inhibition of vasoconstriction produces vasodilation.
In erectile tissue, ACh not only binds to presynaptic M2 receptors as before but also binds to M3 receptors on vascular endothelial cells and, through the phospholipase C pathway, releases IP3 and raises [Ca2+]i (see Fig. 14-11). The Ca2+ stimulates NOS to produce NO (see Chapter 3), which diffuses from the endothelial cell to the VSMC. Inside the VSMC, the NO activates soluble guanylyl cyclase, resulting in the production of cGMP and activation of protein kinase G. The subsequent phosphorylation of MLCK causes relaxation (see Chapter 20).
In salivary glands, postganglionic parasympathetic neurons release ACh, which may stimulate gland cells to secrete kallikrein, an enzyme that cleaves kininogens to vasodilating kinins (e.g., bradykinin). A similar paracrine sequence of events may occur in the sweat glands of nonapical skin, where postganglionic sympathetic fibers release ACh, indirectly leading to local vasodilation (see Chapter 24). (See Note: Vasodilation in Salivary and Sweat Glands)
Nonadrenergic, Noncholinergic Receptors in Blood Vessels Postganglionic parasympathetic nerve terminals may cause vasodilation by co-releasing neurotransmitters other than ACh (Table 23-1), such as NO, neuropeptide Y, vasoactive intestinal peptide, and calcitonin gene–related peptide. NO of neuronal origin acts in the same way as endothelium-derived NO. Neuropeptide Y acts by lowering [cAMP]i; vasoactive intestinal peptide and presumably calcitonin gene–related peptide act by raising [cAMP]i (see Table 20-7).
The medullary cardiovascular center normally exerts its tonic activity on the sympathetic preganglionic neurons, whose cell bodies lie in the thoracolumbar segments of the spinal cord. However, a variety of somatic and visceral afferents also make connections with this efferent pathway in the spinal cord, and such afferents are responsible for several reflexes that occur at the spinal level. The sympathetic preganglionic neurons are normally so dependent on medullary input that they are not very sensitive to local afferents. Rather, these somatic and visceral afferents exert their major effect by ascending to the medulla and synapsing in the NTS. Nevertheless, some spinal (i.e., segmental) cardiovascular reflexes do exist. For example, the skin blanches in response to both pain and inflammation. These spinal reflexes become most powerful after a spinal transverse lesion.
Neurons of the C1 area of the medulla (Fig. 23-4) are responsible for maintaining a normal mean arterial pressure. In general, C1 neurons are tonically active and excite sympathetic preganglionic neurons to produce vasoconstriction (see Chapter 22). The presence of tonically active neurons in the C1 area raises the possibility that these neurons play a role in some forms of hypertension. Interestingly, clonidine, an antihypertensive agent, acts by binding to imidazole receptors on C1 area neurons.
Besides the afferents from the baroreceptors, the medullary cardiovascular center receives afferents from respiratory centers and from higher CNS centers, such as the hypothalamus and cerebral cortex (Fig. 23-5). The hypothalamus integrates many cardiovascular responses. Indeed, one can use a microelectrode to stimulate particular sites in the hypothalamus to reproduce a variety of physiological responses. The dorsomedial hypothalamic nucleus in the hypothalamus acts on the rostral ventrolateral medulla to mediate vasomotor and cardiac responses (e.g., during exercise and acute stress). The cerebral cortex influences the hypothalamic integration areas along both excitatory and inhibitory pathways. Thus, a strong emotion can lead to precipitous hypotension with syncope (i.e., fainting). Conditioned reflexes can also elicit cardiovascular responses. For example, it is possible, by reward conditioning, to train an animal to increase or to decrease its heart rate.
Although baroreceptors are the primary sensors for blood pressure control, a second set of receptors, the peripheral chemoreceptors, also play a role. Whereas input from baroreceptors exerts a negative drive on the medullary vasomotor center, causing vasodilation, the peripheral chemoreceptors exert a positive drive on the vasomotor center, causing vasoconstriction (Fig. 23-6A). As far as the heart is concerned, input from both the baroreceptors and the peripheral chemoreceptors exerts a positive drive on the cardioinhibitory center; that is, they both decrease heart rate (compare Figs. 23-1 and 23-6A).
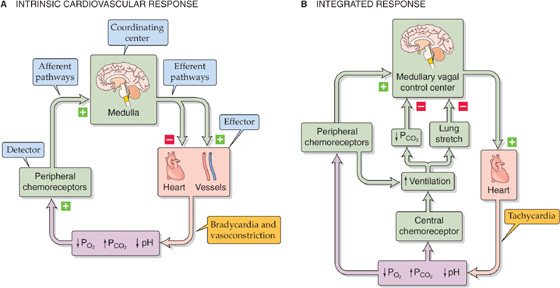
Figure 23-6 Chemoreceptor control of the cardiovascular system. In this example, we assume that a decrease in PO2, an increase in PCO2, or a decrease in pH is the primary insult (violet box). In A, the bradycardia occurs only when ventilation is fixed or prevented (e.g., breath-holding). In B, the effects of breathing overcome the intrinsic cardiovascular response, producing tachycardia.
The medullary respiratory centers—which include the areas that integrate the input from the peripheral chemoreceptors—strongly influence medullary cardiovascular centers. A fall in arterial PO2, a rise in PCO2, or a fall in pH stimulates the peripheral chemoreceptors to increase the firing frequency of the afferent nerves to the medulla. In the absence of conflicting input, which we discuss next, the intrinsic response of the medulla to this peripheral chemoreceptor input is to direct efferent pathways to cause vasoconstriction and bradycardia (Fig. 23-6A). Opposite changes in the PO2, PCO2, and pH have the opposite effects.
The peripheral chemoreceptors—whose primary role is to regulate ventilation (see Chapter 32)—lie close to the baroreceptors. Just as there are two types of high-pressure baroreceptors (i.e., carotid sinus and aortic arch), there are also two types of peripheral chemoreceptors: the carotid bodies and the aortic bodies (compare the location of the baroreceptor and chemoreceptor systems in Fig. 23-2A, B).
Carotid Bodies The carotid body—or glomus caroticum—is located between the external and internal carotid artery. Although the human carotid body is small (i.e., ~1 mm3), it has an extraordinarily high blood flow per unit mass and a minuscule arteriovenous difference for PO2, PCO2, and pH—putting it in an excellent position to monitor the composition of the arterial blood. The chemosensitive cell in the carotid body is the glomus cell, which synapses with nerve fibers that join the glossopharyngeal nerve (CN IX). A fall in arterial PO2, a rise in arterial PCO2, or a fall in the pH increases the spike frequency in the sensory fibers of the afferent sinus nerve. (See Note: Peripheral Chemoreceptors)
Aortic Bodies The aortic bodies are situated immediately under the concavity of the aortic arch and in the angle between the right subclavian and carotid arteries. Aortic bodies may also be present at the angle between the left subclavian and common carotid arteries. The aortic glomus cells synapse with nerve fibers that are afferent pathways in the vagus nerve (CN X).
Afferent Fiber Input to the Medulla The most important signal affecting the glomus cells is a low PO2, which triggers an increase in the firing rate of the sensory fibers. We will discuss ways in which this signal triggers neuronal firing in Chapter 32. Like the afferent fibers from the baroreceptors, the afferent fibers from both the carotid body (CN IX) and the aortic bodies (CN X) project to the NTS in the medulla. Indeed, the responses to input from the peripheral chemoreceptors overlap with those to input from the baroreceptors.
Physiological Role of the Peripheral Chemoreceptors in Cardiovascular Control The fluctuations in PO2 that normally occur in humans are not large enough to affect the blood pressure or heart rate. For the cardiovascular system, the peripheral chemoreceptors play a role only during severe hypoxia (e.g., hemorrhagic hypotension). As already noted, the intrinsic cardiovascular effects of hypoxia on the peripheral chemoreceptors include vasoconstriction and bradycardia (Fig. 23-6A). However, it is not easy to demonstrate this primary reflex bradycardia; indeed, it is observed only during forced apnea. Under real-life conditions, hypoxia causes tachycardia. Why? Hypoxia—through the peripheral chemoreceptors—normally stimulates the medullary respiratory centers, which in turn stimulate ventilation (Fig. 23-6B). As discussed later, the high PCO2 that may accompany hypoxia stimulates the central chemoreceptors, which independently stimulates ventilation. This increased ventilation has two effects. First, it stretches the lungs, which in turn stimulates pulmonary stretch receptors. Afferent impulses from these pulmonary stretch receptors ultimately inhibit the cardioinhibitory center, causing reflex tachycardia. Second, as discussed in Chapter 31, increased alveolar ventilation caused by hypoxia lowers systemic PCO2, raising the pH of the brain extracellular fluid and inhibiting the cardioinhibitory center. Again, the net effect is tachycardia. Thus, the physiological response to hypoxia is tachycardia.
Central Chemoreceptors In addition to peripheral chemoreceptors, central chemoreceptors are present in the medulla (see Chapter 32). However, in contrast to the peripheral chemoreceptors, which primarily sense a low PO2, the central chemoreceptors mainly sense a low brain pH, which generally reflects a high arterial PCO2.
As already noted (Fig. 23-4B), tonic baroreceptor input to the NTS in the medulla stimulates inhibitory interneurons that project onto the vasomotor area. This pathway exerts a considerable restraining influence on sympathetic output, which would otherwise cause vasoconstriction. Thus, cutting of these baroreceptor afferents causes vasoconstriction. The central chemoreceptor also influences the vasomotor area. Indeed, a high arterial PCO2 (i.e., low brain pH), which stimulates the central chemoreceptor, disinhibits the vasomotor area—just as cutting of baroreceptor afferents disinhibits the vasomotor area. The result is also the same: an increase in the sympathetic output and vasoconstriction.
In summary, a low PO2 acting on the peripheral chemoreceptor and a high PCO2 acting on the central chemoreceptor act in concert to enhance vasoconstriction.
Other things being unchanged, an increased cardiac output raises mean arterial pressure. Therefore, it is not surprising that as we have just seen, the heart is an important effector organ in the feedback loops that regulate mean arterial pressure. Cardiac output is the product of the heart rate and stroke volume (see Equation 17-6), and both factors are under the dual control of (1) regulatory mechanisms intrinsic to the heart and (2) neural and hormonal pathways that are extrinsic to the heart.
Intrinsic Control of Heart Rate As the length of diastole increases, the heart rate necessarily decreases. The diastolic interval is determined by the nature of the action potential fired off by the SA node. Such factors as the maximum diastolic potential, the slope of the diastolic depolarization (phase 4), and the threshold potential all influence the period between one SA node action potential and the next (see Fig. 21-6). Intrinsic modifiers of the SA node pacemaker, such as [K+]o and [Ca2+]o, greatly influence the ionic currents responsible for SA node pacemaker activity but are not part of any cardiovascular feedback loops.
Intrinsic Control of Stroke Volume Stroke volume is the difference between end-diastolic volume and end-systolic volume (see Equation 22-2). Various processes intrinsic to the heart affect both of these variables.
The end-diastolic volume (EDV) depends on the following:
1. Filling pressure. Ventricular filling pressure depends to a large degree on atrial filling pressure. When increased venous return causes atrial filling pressure to rise, EDV rises as well.
2. Filling time. The longer the filling time, the greater the EDV. As heart rate rises, diastole shortens to a greater extent than does systole, thereby decreasing EDV.
3. Ventricular compliance (reciprocal of the slope of the diastole curve in Fig. 22-11B). As ventricular compliance increases, a given filling pressure will produce a greater increase in ventricular volume, thus resulting in a greater EDV.
The end-systolic volume (ESV) depends on the following:
1. Preload (i.e., end-diastolic volume). According to Starling’s law of the heart, increase of the EDV increases the stretch on the cardiac muscle and the force of the contraction (see the systole curve in Fig. 22-11B) and thus the stroke volume. Only at a very large EDV does contraction begin to weaken as the muscle fibers are too stretched to generate maximal power (see Fig. 22-11A).
2. Afterload (force against which the ventricle ejects its contents). The afterload of the left ventricle is the mean systemic arterial pressure; the afterload of the right ventricle is the mean pulmonary arterial pressure. Increased afterload impedes the heart’s ability to empty and thereby increases ESV.
3. Heart rate. An increased heart rate leads to greater Ca2+ entry into myocardial cells, thereby increasing contractility and reducing ESV (see Chapter 22).
4. Contractility. Positive inotropic agents act by increasing [Ca2+]i within the myocardial cells (see Chapter 22), thereby enhancing the force of contraction and decreasing ESV.
Note that a particular variable may affect both end-diastolic and end-systolic volumes. For example, an increased heart rate decreases EDV and decreases ESV. Therefore, its effect on stroke volume—the difference between these two volumes—may be difficult to predict.
We have already seen that the sympathetic and parasympathetic pathways are the efferent limbs of the feedback loops that control mean arterial pressure (Fig. 23-5). These efferent limbs also control cardiac output through heart rate and stroke volume. Because we have already described the anatomy, neurotransmitters, and transduction mechanisms involved in these pathways, we focus here on how these pathways specifically affect the heart rate and stroke volume.
Baroreceptor Regulation Baroreceptor responses affect both heart rate and stroke volume, the product of which is cardiac output. However, baroreceptors do not monitor cardiac output per se but rather arterial pressure. Thus, the baroreceptor response does not correct spontaneous alterations in cardiac output unless they happen to change mean arterial pressure. For example, when an increase in the cardiac output matches a commensurate decrease in the peripheral resistance, leaving the mean arterial pressure unchanged, the baroreceptors do not respond. On the other hand, even if cardiac output is unchanged, it will be the target of the baroreceptor response if other factors (e.g., changes in peripheral resistance) alter arterial pressure.
Chemoreceptor Regulation In Figure 23-6B, we saw that the integrated response to hypoxia and respiratory acidosis is tachycardia. This tachycardia response turns out to be a very helpful feedback mechanism for maintaining cardiac output. For example, a reduced cardiac output lowers arterial PO2, raises PCO2, and lowers pH. These changes stimulate the peripheral chemoreceptors, indirectly producing tachycardia and thereby increasing cardiac output. Thus, the chemoreceptor response corrects changes in blood chemistry that are likely to result from reduced cardiac output. Once again, the detector (i.e., the peripheral chemoreceptors) does not sense changes in the cardiac output per se but rather in the metabolic consequences of altered cardiac output. Changes in cardiac output go unnoticed by the chemoreceptors if they do not affect arterial PO2, PCO2, or pH.
It is fortunate that a high PCO2 increases the heart rate (Fig. 23-6B) because a high PCO2 has a direct effect on the heart, decreasing myocardial contractility. High PCO2 leads to intracellular acidosis of the myocardial cells (see Chapter 28). The low pHi shifts the [Ca2+]i–tension curve of cardiac muscle to higher [Ca2+]i values, reflecting a lower sensitivity of TNNC1 to [Ca2+]i. Thus, in the absence of reflex tachycardia, high PCO2 would decrease myocardial force and thereby lower cardiac output.
The baroreceptors located at high-pressure sites (i.e., the carotid sinus and aortic arch) are not the only stretch receptors involved in feedback regulation of the circulation. Low-pressure baroreceptors—bare ends of myelinated nerve fibers—are located at strategic low-pressure sites, including the pulmonary artery, the junction of the atria with their corresponding veins, the atria themselves, and the ventricles (Fig. 23-7A). Distention of these receptors depends largely on venous return to the heart. Therefore, these mechanoreceptors detect the “fullness” of the circulation and are part of a larger system of volume sensors that control the effective circulating volume of blood (see Chapter 40). These low-pressure receptors also help control cardiac output. By regulating both effective circulating volume and cardiac output, these receptors also indirectly regulate mean arterial blood pressure.
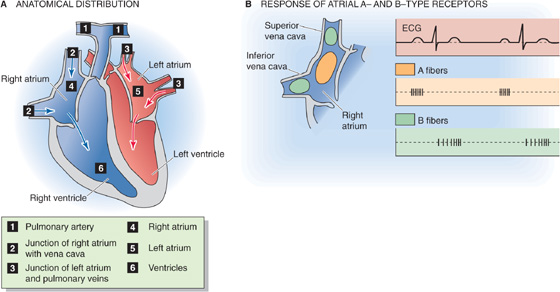
Figure 23-7 Low-pressure receptors. In B, A-type receptors (orange), located mainly in the body of right atrium; B-type receptors (green), located mainly in superior and inferior vena cava. ECG, electrocardiogram.
Atrial Receptors The most extensively studied low-pressure receptors are the atrial receptors. These are located at the ends of afferent axons—either A or B fibers—that join the vagus nerve (CN X). The A fibers fire in synchrony with atrial systole and therefore monitor heart rate (Fig. 23-7B). The B fibers fire in a burst during ventricular systole (Fig. 23-7B) and gradually increase their firing rate as the atria fill, reaching maximum firing frequency at the peak of the v wave of the atrial (i.e., jugular) pulse (Fig. 23-7A). Thus, the B fibers monitor the rising atrial volume. Because the central venous pressure (CVP)—the pressure inside large systemic veins leading to the right side of the heart—is the main determinant of right atrial filling, the B fibers also detect changes in CVP. By inference, the atrial B-type stretch receptors primarily monitor effective circulating volume and venous return.
The afferent pathways for the low-pressure receptors are similar to those for high-pressure baroreceptors and peripheral chemoreceptors traveling along the vagus nerve and projecting to the NTS and other nuclei of the medullary cardiovascular center. To some extent, the efferent pathways and effector organs (i.e., heart and blood vessels) also are similar. However, whereas increased stretch of the high-pressure receptors lowers heart rate, increased stretch of the atrial B-type receptors raises heart rate (the Bainbridge reflex, which we discuss in the next section). Moreover, whereas increased stretch of the high-pressure receptors causes generalized vasodilation, increased stretch of the atrial B-type receptors decreases sympathetic vasoconstrictor output only to the kidney. The net effect of increased atrial stretch (i.e., tachycardia and renal vasodilation) is an increase in renal blood flow and—as seen in Chapter 35—an increase in urine output (i.e., diuresis). Decreased atrial stretch has little effect on heart rate but increases sympathetic output to the kidney. Therefore, as far as their direct cardiovascular effects are concerned, the high-pressure baroreceptors respond to stretch (i.e., increased blood pressure) by attempting to decrease blood pressure. The low-pressure baroreceptors respond to stretch (i.e., increased fullness) by attempting to eliminate fluid.
The afferent fibers of the atrial receptors that project to the NTS also synapse there with neurons that project to magnocellular neurons in the paraventricular nucleus of the hypothalamus (see Fig. 41-8). These hypothalamic neurons synthesize arginine vasopressin (AVP)—also known as antidiuretic hormone (see Chapter 38)—and then transport it down their axons to the posterior pituitary for release into the blood (see Chapter 47). Increased atrial stretch lowers AVP secretion, producing a water diuresis and thus decreasing total body water (see Chapter 40).
In addition to stimulating bare nerve endings, atrial stretch causes a non-neural response by stretching the atrial myocytes themselves. When stretched, atrial myocytes release atrial natriuretic peptide (ANP) or factor (ANF). ANP is a powerful vasodilator. It also causes diuresis (see Chapter 40) and thus enhances the renal excretion of Na+ (i.e., it causes natriuresis). In these ways, it lowers effective circulating volume blood pressure. (See Note: Atrial Natriuretic Peptide)
Thus, enhanced atrial filling with consequent stretching of the atrial mechanoreceptors promotes diuresis by at least three efferent mechanisms, the first two of which are neurally mediated. (1) Tachycardia in combination with a reduced sympathetic vasoconstrictor output to the kidney increases renal blood flow. (2) Atrial baroreceptors cause decreased secretion of AVP. (3) The stretch of the atrial myocytes themselves enhances the release of ANP.
Ventricular Receptors Stretching of the ventricular low-pressure stretch receptors causes bradycardia and vasodilation, responses similar to those associated with stretching of the arterial high-pressure receptors. However, these ventricular receptors do not contribute appreciably to homeostasis of the cardiac output.
The Bainbridge reflex is the name given to the tachycardia caused by an increase in venous return. An increase in blood volume leads to increased firing of low-pressure B fibers (Fig. 23-7B) during atrial filling. The efferent limb of this Bainbridge reflex is limited to instructions carried by both parasympathetic and sympathetic pathways to the SA node, which determines heart rate. Effects on cardiac contractility and stroke volume are insignificant. Because the Bainbridge reflex saturates, the increase in heart rate is greatest at low baseline heart rates.
The Bainbridge reflex acts as a counterbalance to the baroreceptor reflex in the control of heart rate. The orange curve on the right upper quadrant of Figure 23-8 illustrates the Bainbridge reflex: increase of the effective circulating volume (i.e., increase of venous return and stimulation of low-pressure receptors) increases heart rate. On the other hand, we have already noted that decreased atrial stretch has little effect on heart rate by the Bainbridge reflex. The orange curve in the left upper quadrant of Figure 23-8 illustrates the intervention of the high-pressure baroreceptors. That is, a decrease in blood volume does not cause heart rate to fall but rather causes it to rise. Indeed, a significant reduction in blood volume leads to a fall in mean arterial pressure, reduced baroreceptor firing, and—through the cardioinhibitory and cardioacceleratory areas in the medulla (Fig. 23-4B)—stimulation of the SA node. Therefore, on examination of the full orange curve in Figure 23-8, we see that changes in blood volume or venous return have a biphasic effect on heart rate. By different mechanisms, volume loading and volume depletion both cause a graded increase in heart rate. In general, during volume loading, the Bainbridge reflex prevails, whereas during volume depletion, the high-pressure baroreceptor reflex dominates. Heart rate is at its minimum when effective circulating volume is normal.
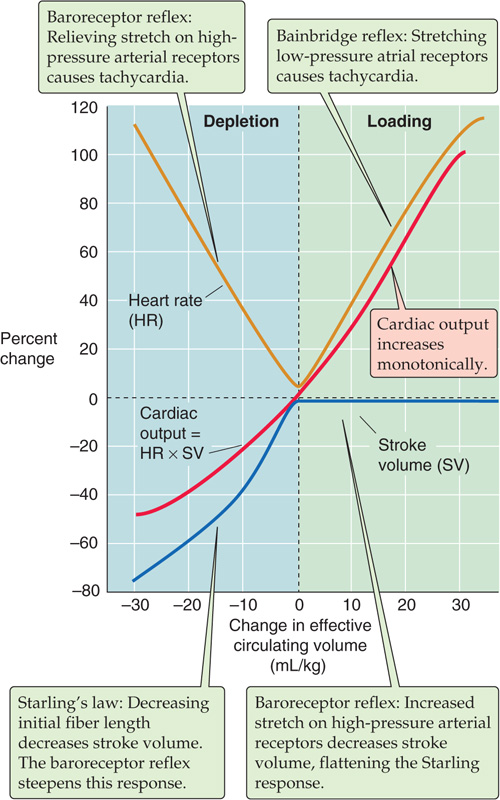
Figure 23-8 Effect of blood volume on cardiac output. The investigators changed effective circulating volume (x-axis) by altering blood volume.
Like heart rate (Fig. 23-8, orange curve), stroke volume also shows a peculiar, biphasic dependence on effective circulating volume (blue curve) that is the result of two competing effects. In the case of stroke volume, the competitors are Starling’s law and the baroreceptor reflex. According to Starling’s law, as venous blood volume increases, enhanced ventricular filling increases EDV, thereby improving cardiac performance and thus stroke volume (see Chapter 22). The Starling relationship reflects the intrinsic properties of the heart muscle. However, in a real person, the baroreceptor reflex has a major influence on the dependence of stroke volume on blood volume. At low blood volumes, the baroreceptor reflex produces high sympathetic output, increasing contractility and steepening the Starling relationship (blue curve in the left lower quadrant of Fig. 23-8). At high blood volumes, the Starling relationship normally tends to be less steep. Moreover, the baroreceptor reflex reduces sympathetic output, thereby decreasing contractility and further flattening the blue curve in the right half of Figure 23-8.
In contrast to the biphasic response of heart rate and stroke volume to changes in effective circulating volume, cardiac output rises monotonically (Fig. 23-8, red curve). The reason for this smooth increase is that cardiac output is the product of heart rate and stroke volume. Starting from very low blood volumes (see the extreme left of Fig. 23-8), increase in the blood volume causes a gradual rise in stroke volume (blue curve), offset by a fall in heart rate (orange curve), resulting in an overall rise of cardiac output (red curve) until blood volume and stroke volume reach normal levels. Further increases in blood volume have no effect on stroke volume (blue curve) but increase heart rate (orange curve), further increasing cardiac output (red curve). Consequently, the dependence of cardiac output on effective circulating volume is the result of the complex interplay among three responses: (1) the Bainbridge reflex, (2) the baroreceptor reflex, and (3) Starling’s law. (See Note: The Monotonic Dependence of Cardiac Output on Effective Circulating Volume)
Venous return is the blood flow returning to the heart. Most often, the term is used to mean the systemic venous return, that is, return of blood to the right side of the heart. Because the input of the right side of the heart must equal its output in the steady state, and because the cardiac outputs of the right and left sides of the heart are almost exactly the same, the input to the right side of the heart must equal the output of the left side of the heart. Thus, the systemic venous return must match the systemic cardiac output.
The right atrial pressure (RAP) determines the extent of ventricular filling and indeed was the first of the three determinants of end-diastolic volume discussed earlier in the chapter. In turn, RAP depends on the venous return of blood to the heart. Imagine that we replace the heart and lungs with a simple pump—with adjustable flow—that delivers blood into the aorta and simultaneously takes it back up from the right atrium (Fig. 23-9A). Using this simple pump, we can study the factors that govern venous return from the peripheral systemic circulation to the right side of the heart by varying flow (the independent variable) while recording RAP (the dependent variable).
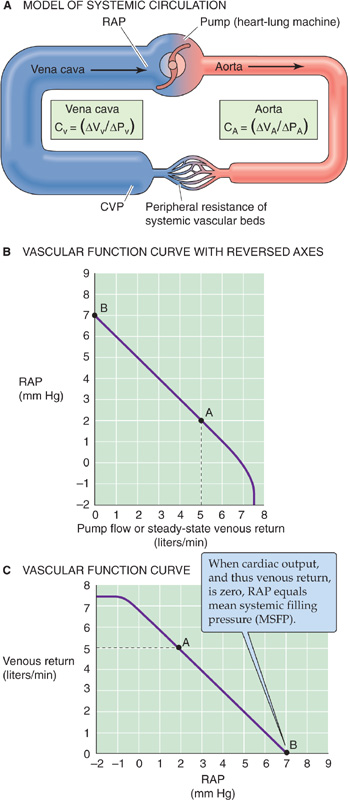
Figure 23-9 Vascular function. In A, a heart-lung machine replaces the right side of the heart, the pulmonary circulation, and the left side of the heart. We can set the pump flow to predetermined values and examine how cardiac output determines central venous pressure (CVP) and right atrial pressure (RAP). CV and CA are vascular compliances. B shows dependent variable (RAP) on the y-axis, whereas C shows RAP on the x-axis.
We start our experiment with the pump generating a normal cardiac output of 5 L/min; the RAP is 2 mm Hg. This situation is represented by point A in Figure 23-9B, which is a plot of RAP versus venous return (i.e., our pump rate). When we reverse the axes, the plot is known as a vascular function curve. Note that we express venous return (i.e., cardiac input) in the same units as cardiac output. We now turn off the pump, a situation analogous to cardiac arrest. For several seconds, blood continues to flow from the arteries and capillaries into the veins because the arterial pressure continues to exceed the venous pressure. Remember that the aortic pressure does not fall to zero during diastole because of the potential energy stored in the elastic recoil of the arterial walls (see Chapter 22 for the box titled Effect of Aortic Compliance on Blood Flow). Similarly, after a cardiac arrest, this potential energy continues to push blood to the venous side until all pressures are equal throughout the vascular tree, and flow stops everywhere.
When blood flow finally ceases after a cardiac arrest, the pressures in the arteries, capillaries, veins, and right atrium are uniform. This pressure is called the mean systemic filling pressure (MSFP) and is ~7 mm Hg (point B in Fig. 23-9B). Why is the MSFP not zero? When you fill an elastic container (e.g., a balloon) with fluid, the pressure inside depends on how much fluid you put in as well as the compliance of the container (see Equation 19-5). In the case of the cardiovascular system, MSFP depends on the blood volume and the overall compliance of the entire vascular system. Now that blood flow has ceased, there is obviously no longer any force (i.e., no ΔP) driving the blood from the veins into the pump. Therefore, RAP equals MSFP.
Now, starting with the system at a standstill (point B in Fig. 23-9B), we increase pump rate to some level, measure the steady-state RAP, and repeat this procedure several times at different pump rates. As the pump rate increases, RAP falls (Fig. 23-9B) because the inflow to the pump draws blood out of the right atrium, the site closest to the inlet of the pump. Because the upstream central venous pressure (CVP) exceeds RAP, blood flows from the large veins into the right atrium. At a pump rate of 5 L/min, the RAP falls to about +2 mm Hg, its original value. At even higher pump rates, RAP eventually falls to negative values.
Cardiovascular physiologists usually work with the vascular function curve with the axes reversed from those shown in Figure 23-9B, treating RAP as the independent variable and plotting it on the abscissa (Fig. 23-9C). As RAP becomes less positive, it provides a greater driving pressure (i.e., greater ΔP = CVP − RAP) for the return of blood from the periphery to the right atrium, as it must for cardiac output to increase. Thus, the cardiac output steadily rises as RAP falls. However, as RAP becomes increasingly negative, the transmural pressure of the large veins becomes negative, so that the large veins feeding blood to the right atrium collapse. No further increment in venous return can occur, even though the driving pressure, ΔP, is increasing. Therefore, the vascular function curve plateaus at negative values of RAP, around −1 mm Hg (Fig. 23-9C).
Two different theories attempt to explain the shape of the vascular function curve in Figure 23-9C. One explanation for the curve’s steepness emphasizes the high compliance of the venous capacitance vessels; the other focuses on their small viscous resistance. In reality, both compliance and resistance are responsible for the steepness of the vascular function curve. (See Note: How Does Cardiac Output Determine Right Atrial Pressure?)
Because the vascular function curve depends on how full the capacitance vessels are, changing the blood volume affects the vascular function curve. An increase in blood volume (e.g., a transfusion) shifts the curve to the right. In the example in Figure 23-10A, the intercept with the x-axis (i.e., MSFP) moves from 7 to 9 mm Hg, as would be expected if more blood were put into a distensible container, whether it is a balloon or the circulatory system. A decrease in blood volume (e.g., hemorrhage) shifts the curve and the x-intercept to the left. Thus, MSFP increases with transfusion and decreases with hemorrhage. However, changes in blood volume do not affect the slope of the linear portion of the vascular function curve as long as there is no change in either vessel compliance or resistance.
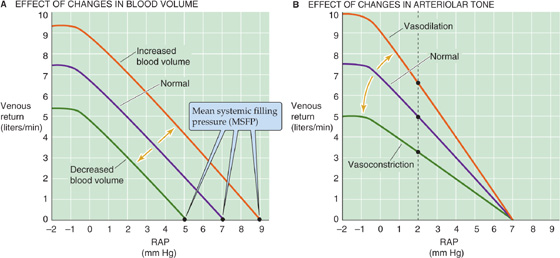
Figure 23-10 Effect of changes in blood volume and vasomotor tone on the vascular function curve. The purple curves are the same as the vascular function curve in Figure 23-9C. In B, dilation of the arterioles increases CVP and thus raises the driving force (CVP − RAP) for venous return. Constriction of arterioles has the opposite effects.
Change in the venomotor tone, by constriction or dilation of only the veins, is equivalent to change in the blood volume. Returning to our balloon analogy, even if we hold the amount of blood constant, we can increase pressure inside the balloon by increasing the tension in the wall. Because most of the blood volume is in the veins, a pure increase in venomotor tone would be equivalent to a blood transfusion (Fig. 23-10A). Conversely, a pure decrease in venomotor tone would reduce the tension in the wall of the container, shifting the curve to the left, just as in a hemorrhage.
Change in the tone of the arterioles has a very different effect on the vascular function curve. Because the arterioles contain only a minor fraction of the blood volume, changes in the arteriolar tone have little effect on MSFP and thus on the x-intercept. However, changes in the arteriolar tone can have a marked effect on the CVP, which along with the RAP determines the driving force for the venous return. Arteriolar constriction flattens the vascular function curve; arteriolar dilation has the opposite effect (Fig. 23-10B). We can understand this effect by examining the vertical line through the three curves at an RAP of 2 mm Hg. For the middle or normal curve, the difference between a CVP of, say, 5 mm Hg and a RAP of 2 mm Hg (ΔP = CVP − RAP = 3 mm Hg) produces a venous return of 5 L/min. Arteriolar constriction might lower the CVP from 5 to 4 mm Hg, thereby reducing ΔP from 3 to 2 mm Hg. Because the driving pressure (ΔP) drops to ⅔ of normal, venous return also falls to ⅔ of normal. Thus, arteriolar constriction flattens the vascular function curve. Similarly, arteriolar dilation might raise CVP from 5 to 6 mm Hg, so that the ΔP increases from 3 to 4 mm Hg, producing a venous return that is 4/3 of normal. Thus, arteriolar dilation steepens the vascular function curve.
In the preceding analysis, we assumed “pure” changes in blood volume or vessel tone. In real life, things can be more complicated. For example, hemorrhage is typically followed by arteriolar constriction for maintenance of the systemic arterial pressure. Thus, real situations may both shift the x-intercept and change the slope of the vascular function curve.
Just as there is a vascular function curve, there is also a cardiac function curve that in effect is Starling’s law. The classical Starling’s law relationship (see the red curve in Fig. 22-11B), which is valid for both ventricles, is a plot of developed pressure versus EDV. However, we already expressed Starling’s law as a cardiac performance curve in Figure 23-11C, plotting stroke work on the y-axis and atrial pressure on the x-axis. Because stroke work—at a fixed arterial pressure and heart rate—is proportional to cardiac output, we can replace stroke work with cardiac output on the y-axis of the cardiac performance curve. The result is the red cardiac function curve in Figure 23-11A. Note that the cardiac function curve is a plot of cardiac output versus RAP, and it has the same units as the vascular function curve. We can plot the two relationships on the same graph (Fig. 23-11A). However, the y-axis for the cardiac function curve is cardiac output, whereas the y-axis for the vascular function curve is venous return. Of course, cardiac output and venous return (i.e., cardiac input) must be the same in the steady state.
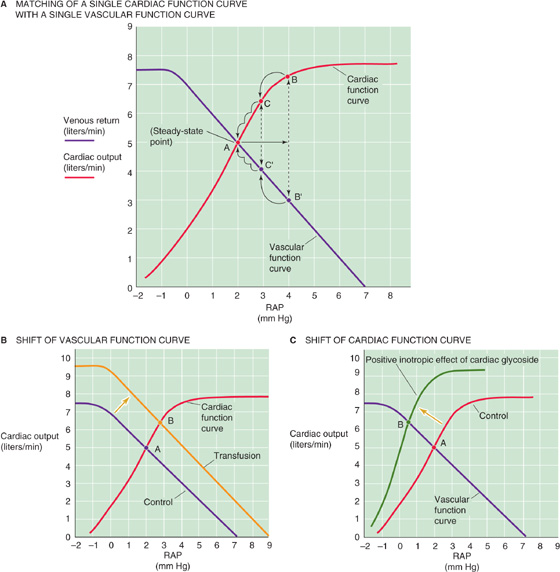
Figure 23-11 Matching of cardiac output with venous return. The purple curves are the same as the vascular function curve in Figure 23-9C. The red cardiac function curves represent Starling’s law. In A, point A is the single RAP at which venous return and cardiac output match. A transient increase in RAP from 2 to 4 mm Hg causes an initial mismatch between cardiac output (point B) and venous return (point B′), which eventually resolves (B′C′A and BCA). In B, permanently increasing blood volume (transfusion) shifts the vascular function curve to the right (as in Fig. 23-10A), so that a match between the cardiac output and venous return now occurs at a higher RAP (point B). In C, permanently increasing cardiac contractility shifts the cardiac function curve upward, so that a match between the cardiac output and the venous return now occurs at a lower RAP (point B).
We can now ask, Do the cardiac output and venous return depend on RAP? Does RAP depend on the cardiac output and venous return? The answer to both questions is an emphatic yes! They all depend on each other. There is no absolute dependent or independent variable in this closed circuit because, in the steady state, venous return and cardiac output must be equal. Venous return (from the vascular function curve) and cardiac output (from the cardiac function curve) can be equal only at the single point where the two curves intersect (point A in Fig. 23-11A). Only transient and small deviations in these two curves are possible unless either or both of the function curves change in shape.
Imagine what would happen if RAP transiently increased from 2 to 4 mm Hg (Fig. 23-11A). Starling’s law states that the increased ventricular filling initially increases cardiac output from starting point A (5 L/min) to point B (7.3 L/min). Simultaneously, the increase in RAP causes a decrease in the driving pressure ΔP for venous return, that is, the difference CVP − RAP. Thus, the increase in RAP would initially reduce the venous return from point A (5 L/min) to point B′ (3 L/min). This imbalance between cardiac output and venous return cannot last very long. The transiently elevated cardiac output will have two effects. First, by sucking the right atrium dry, it will tend to lower RAP. Second, by pumping blood out of the heart and toward the veins, it will raise CVP. As a result, the difference CVP − RAP increases, and venous return moves from point B′ to C′. Because RAP at point C′ is lower than at B′, the cardiac output must also be less at point C than at point B. The imbalance between C and C′ (6.5 vs. 4 L/min) is now less than that between B and B′ (7.3 vs. 3 L/min). In this way, venous return gradually increases, cardiac output gradually decreases, and RAP gradually decreases until once again they all come into balance at point A. Thus, the cardiovascular system has an intrinsic mechanism for counteracting small, transient imbalances between cardiac input and output.
The only way to produce a permanent change in cardiac output, venous return, and RAP is to change at least one of the two function curves. The vascular function curve may be any one of a large family of such curves (Fig. 23-10A, B), depending on the precise blood volume, venomotor tone, and arteriolar tone. Thus, a transfusion of blood shifts the vascular function curve to the right, establishing a new steady-state operating point at a higher RAP (point A → point B in Fig. 23-11B). Similarly, vasodilation would rotate the vascular function curve to a steeper slope, also establishing a new steady-state operating point at a higher RAP.
The cardiac function curve also may be any one of a large family (see Fig. 22-11C), depending on afterload, heart rate, and, above all, the heart’s contractile state. Therefore, increasing contractility by adding a cardiac glycoside such as digitalis shifts the cardiac function curve upward and to the left, establishing another steady-state operating point (point A → point B in Fig. 23-11C). Both physiological and pathological conditions can reset the vascular and cardiac function curves, resulting in a wide range of operating points for the match between venous return and cardiac output.
In addition to the rapidly acting neural mechanisms that control the total peripheral resistance and cardiac output, humoral controls contribute to the homeostasis of the circulation. In most instances, these control systems operate on a time scale of hours or days, far more slowly than the neurotransmitter-mediated reflex control by the CNS.
Two classes of humoral controls influence the circulation.
1. Vasoactive substances released in the blood, or in the proximity of vascular smooth muscle, modulate the vasomotor tone of arteries and veins, affecting blood pressure and the distribution of blood flow.
2. Nonvasoactive substances, which act on targets other than the cardiovascular system, control the effective circulating volume by modulating extracellular fluid volume. By determining the filling of the blood vessels, these nonvasoactive agents also modulate the mean arterial pressure and cardiac output.
Vasoactive substances, both endocrine and paracrine, cause blood vessels to contract or to relax (Table 23-3). In many instances, paracrine control dominates over endocrine control. The chemical messengers controlling the blood vessels can be amines, peptides, or proteins; derivatives of arachidonic acid; or gases such as NO.
Table 23-3 Vasoactive Compounds
Vasoconstrictors |
Vasodilators |
Epinephrine (through α1 receptors) |
Epinephrine (through β2 receptors) |
Serotonin |
Histamine |
ANG II |
ANP |
AVP |
Bradykinins |
Endothelin |
PGE2, PGI2 NO |
Biogenic Amines Monoamines may be either vasoconstrictors (epinephrine and serotonin) or vasodilators (histamine).
1. Epinephrine. The source of this hormone is the adrenal medulla (see Chapter 50). Epinephrine binds to α1 receptors on VSMCs, causing vasoconstriction (see Table 20-7), and to β2 receptors on VSMCs, causing vasodilation (see Table 20-7). Because β2 receptors are largely confined to the blood vessels of skeletal muscle, the heart, the liver, and the adrenal medulla itself, epinephrine is not a systemic vasodilator. Epinephrine also binds to β1 receptors in the heart, thereby increasing the heart rate and contractility. For the cardiovascular system, the effects of catecholamines originating from the adrenal medulla are usually minor compared with those of the norepinephrine released from the sympathetic nerve endings.
2. Serotonin. Also known as 5-hydroxytryptamine (5-HT; see Fig. 13-8B), this monoamine is synthesized by serotonergic nerves, enterochromaffin cells, and adrenal chromaffin cells. 5-HT is also present in platelets and mast cells. Serotonin binds to 5-HT2A or 5-HT2B receptors on VSMCs, causing vasoconstriction (see Table 20-7). Circulating serotonin is generally not involved in normal systemic control of the circulation but rather in local control. Serotonin is particularly important with vessel damage, where it contributes to hemostasis (see Chapter 18).
3. Histamine. Like serotonin, histamine (see Fig. 13-8B) may also be present in nerve terminals. In addition, mast cells release histamine in response to tissue injury and inflammation. Histamine binds to H2 receptors on VSMCs, causing vasodilation (see Table 20-7). Although histamine causes vascular smooth muscle to relax, it causes visceral smooth muscle (e.g., bronchial smooth muscle in asthma) to contract.
Peptides Vasoactive peptides may be either vasoconstrictors or vasodilators (Table 23-3).
1. Angiotensin II (ANG II). Part of the renin-angiotensinaldosterone cascade (see Chapter 40), ANG II, as its name implies, is a powerful vasoconstrictor. The liver secretes angiotensinogen into the blood. The enzyme renin, released into the blood by the kidney, then converts angiotensinogen to the decapeptide ANG I. Finally, angiotensin-converting enzyme (ACE), which is present primarily on endothelial cells, particularly those of the lung, cleaves ANG I to the octapeptide ANG II. Aminopeptidases further cleave it to the heptapeptide ANG III, which is somewhat less vasoactive than ANG II. (See Note: The Metabolism of the Angiotensins)
In VSMCs, ANG II binds to G protein–coupled AT1A receptors, activating phospholipase C, raising [Ca2+]i, and leading to vasoconstriction (see Table 20-7). However, ANG II is normally not present in plasma concentrations high enough to produce systemic vasoconstriction. In contrast, ANG II plays a major role in cardiovascular control during blood loss (see Chapter 25), exercise, and similar circumstances that reduce renal blood flow. Reduced perfusion pressure in the kidney causes the release of renin (see Chapter 40). Plasma ANG II levels rise, leading to an intense vasoconstriction in the splanchnic and renal circulations. The resulting reduced renal blood flow leads to even more renin release and higher ANG II levels, a dangerous positive feedback system that can lead to acute renal failure. A widely studied model of hypertension that demonstrates the importance of this mechanism is the Goldblatt model for hypertension (see the box on hypertension).
ANG II has a range of other effects—besides direct vasoactive effects—that indirectly increase mean arterial pressure: (1) ANG II increases cardiac contractility; (2) it reduces renal plasma flow, thereby enhancing Na+ reabsorption in the kidney; (3) as discussed in the next section, ANG II and ANG III also stimulate the adrenal cortex to release aldosterone; (4) in the CNS, ANG II stimulates thirst and leads to the release of another vasoconstrictor, AVP; (5) ANG II facilitates the release of norepinephrine by postganglionic sympathetic nerve terminals; and (6) finally, ANG II also acts as a cardiac growth factor (see the box in Chapter 22 on cardiac hypertrophy).
2. Arginine vasopressin (AVP). The posterior pituitary releases AVP, also known as antidiuretic hormone. AVP binds to V1a receptors on VSMCs, causing vasoconstriction (see Table 20-7), but only at concentrations higher than those that are strongly antidiuretic (see Chapter 38). Hemorrhagic shock causes enhanced AVP release and a vasoconstriction that contributes to a transient restoration of arterial pressure (see Chapter 25).
3. Endothelins (ETs). Endothelial cells produce ETs (see Chapter 20) that bind to ETA receptors on VSMCs, causing vasoconstriction (see Table 20-7). Although, on a molar basis, ETs are the most powerful vasoconstrictors, it is not clear whether these paracrine agents play a dominant role in overall blood pressure homeostasis.
4. Atrial natriuretic peptide (ANP or ANF). Released from atrial myocytes in response to stretch, this 28–amino acid peptide binds to ANP receptor A (NPR1) on VSMCs, which is membrane-bound guanylyl cyclase, causing vasodilation (see Table 20-7). Although ANP lowers blood pressure, its role in the overall regulation of mean arterial pressure is doubtful. Because ANP also has powerful diuretic and natriuretic actions, it ultimately reduces plasma volume and therefore blood pressure. (See Note: Crosstalk between ANP and Endothelin)
5. Kinins. At least three different kinins exist: (1) the nonapeptide bradykinin, which is formed in plasma; (2) the decapeptide lysyl-bradykinin, which is liberated from tissues; and (3) methionyl-lysyl-bradykinin, which is present in the urine. These kinins are breakdown products of kininogens, catalyzed by kallikreins—enzymes that are present in plasma and in tissues such as the salivary glands, pancreas, sweat glands, intestine, and kidney. Kallikreins form in the blood from the following cascade. Plasmin acts on clotting factor XII, releasing fragments with proteolytic activity. These factor XII fragments convert an inactive precursor, prekallikrein, to kallikreins. The kinins formed by the action of these kallikreins are eliminated by the kininases (kininase I and II). Kininase II is the same as angiotensin-converting enzyme. Thus, the same enzyme (ACE) that generates a vasoconstrictor (ANG II) also disposes of vasodilators (bradykinin). Bradykinin binds to B2 receptors on endothelial cells, causing release of NO and prostaglandins and thereby vasodilation (see Table 20-7). Like histamine, the kinins relax vascular smooth muscle but contract visceral smooth muscle.
Prostaglandins Many tissues synthesize these derivatives of arachidonic acid (see Chapter 3). Prostacyclin (PGI2) binds to prostanoid IP receptors on VSMCs, causing strong vasodilation (see Table 20-7). Prostaglandin E2 (PGE2) binds to prostanoid EP2 and EP4 receptors on VSMCs, also causing vasodilation (see Table 20-7). It is doubtful that prostaglandins play a role in systemic vascular control. In veins and also in some arteries, arachidonic acid or Ca2+ ionophores cause endothelium-dependent contractions. Because cyclooxygenase inhibitors prevent this vasoconstrictor response, venous endothelial cells probably metabolize arachidonic acid into a vasoconstrictive cyclooxygenase product, presumably thromboxane A2.
Nitric Oxide Nitric oxide synthase (NOS) produces NO from arginine in endothelial cells (see Chapter 20). NO activates the soluble guanylyl cyclase in VSMCs, causing vasodilation (see Table 20-7). Although NO is a powerful paracrine vasodilator, it is not clear that it plays an important role in overall blood pressure homeostasis.
The volume of the extracellular fluid (ECF) includes both the blood plasma and the interstitial fluid. The small solutes in the plasma and interstitial fluid exchange freely across the capillary wall, so that the entire ECF constitutes a single osmotic compartment. Because the plasma volume is a more or less constant fraction (~20%) of the ECF volume, changes in the ECF volume produce proportional changes in plasma volume. Thus, assuming that the compliance of the vasculature is constant (see Equation 19-5), such an increase in plasma volume will lead to an increase in transmural blood pressure.
We saw in Chapter 20 that the Starling forces across a capillary (i.e., the hydrostatic and colloid osmotic pressure differences) determine the traffic of fluid between the plasma and the interstitial fluid (see Chapter 20 for the box on interstitial edema). Thus, alterations in the Starling forces acting across the capillary wall can affect the plasma volume and therefore blood pressure.
Because of the importance of the ECF volume and Starling forces in determining the plasma volume, one might expect that the body would have specific sensors for ECF volume, interstitial fluid volume, and blood volume. However, the parameter that the body controls in the intermediate and long-term regulation of the mean arterial pressure is none of these but rather a more vague parameter termed the effective circulating volume. The effective circulating volume is not an anatomical volume but the functional blood volume that reflects the extent of tissue perfusion, as sensed by the fullness or pressure in the vessels. The control mechanisms that defend effective circulating volume include the two classes of stretch receptors described in this chapter. First, the high-pressure receptors in the carotid sinus and aorta do double duty. In the short term, these baroreceptors regulate blood pressure by their direct cardiovascular effects, as was already discussed. In the longer term, they regulate effective circulating volume. Second, the low-pressure receptors—located in the pulmonary artery, the junction of the atria with their corresponding veins, the atria themselves, and the ventricles—regulate effective circulating volume by direct and indirect effects on the cardiovascular system. In addition to these already familiar receptors involved in neural control of the circulation, other sensors monitor effective circulating volume (see Table 40-2): the baroreceptors in the renal artery, the stretch receptors in the liver, and the atrial myocytes themselves as well as—to some extent—osmoreceptors in the CNS.
Hypertension
Hypertension is found in ~20% of the adult population. It can damage endothelial cells, producing a number of proliferative responses, including arteriosclerosis. In the long term, hypertension can lead to coronary artery disease, myocardial infarction, heart failure, stroke, and renal failure. In the great majority of cases, hypertension is the result of dysfunction of the mechanisms used by the circulation for the long-term rather than short-term control of arterial pressure. In fact, chronically hypertensive patients may have diminished sensitivity of their arterial baroreceptors.
Most people with an elevated blood pressure have “primary hypertension,” in which it is not possible to identify a single, specific cause. Renal artery stenosis, which compromises renal blood flow, is the most common cause of secondary hypertension. An experimental equivalent of renal artery stenosis is the “one-clip two-kidney” model of hypertension first described by Goldblatt (see the box on renal hypertension in Chapter 40). This model does not explain most cases of hypertension, but it does give us our best description of the pathophysiological mechanism involved in at least some patients with elevated blood pressure. The most common cause of renal artery stenosis is the narrowing of the renal artery by atherosclerotic plaque. Fibromuscular disease of the renal arterial wall can also be responsible, usually in young women, as can any space-occupying lesion (e.g., metastatic cancer or benign cysts). If the stenosis is removed by angioplasty or surgery, and if preliminary test results show that the stenosis is the likely cause of the elevation in blood pressure, then a significant percentage of patients will experience resolution of their hypertension.
The cumulative obstruction of smaller arteries and arterioles may also produce hypertension, as is often seen in diseases of the renal parenchyma or any end-stage renal disease. Conversely, constriction of larger vessels proximal to the kidneys can also cause hypertension, as is the case with coarctation of the aorta, a congenital malformation that constricts flow through the aorta to the lower parts of the body. Another cause of secondary hypertension is chronic volume overload. Volume overload can be acquired, such as in primary aldosteronism (caused by either a benign adenoma or bilateral hyperplasia) and pheochromocytoma (a tumor of the adrenal medulla that releases excessive amounts of catecholamines into the circulation). Volume overload can be genetic, as in rare mendelian forms of hypertension, such as Liddle disease, and pseudohypoaldosteronism type 2. (See Note: Liddle Disease)
As we will see in Chapter 40, these sensors of effective circulating volume send signals to the dominant effector organ—the kidney—to change the rate of Na+ excretion in the urine. These signals to the kidney follow four parallel effector pathways (see Chapter 40): (1) the renin–ANG II–aldosterone axis, (2) the autonomic nervous system, (3) the posterior pituitary that releases AVP, and (4) the atrial myocytes that release ANP. Among these four parallel pathways, the most important is the renin-angiotensin-aldosterone system. By regulating total body Na+ content, the kidney determines ECF volume. Therefore, the kidney ultimately governs the blood volume and is thus the principal agent in the long-term control of mean arterial pressure.
Books and Reviews
Andresen MC, Kunze DL: Nucleus tractus solitarius: Gateway to neural circulatory control. Annu Rev Physiol 1994; 56:93-116.
Cowley AW Jr: Long-term control of arterial blood pressure. Physiol Rev. 1992; 72:231-300.
Navar LG, Zou L, Von Thun A, et al: Unraveling the mystery of Goldblatt hypertension. News Physiol Sci 1998; 13:170-176.
Pilowsky PM, Goodchild AK: Baroreceptor reflex pathways and neurotransmitters: 10 years on. J Hypertens 2002; 20:1675-1688.
Thrasher TN: Baroreceptors, baroreceptor unloading, and the long-term control of blood pressure. Am J Physiol Regul Integr Comp Physiol 2005; 288:R819-R827.
Journal Articles
Chapleau MW, Abboud FM: Contrasting effects of static and pulsatile pressure on carotid baroreceptor activity in dogs. Circ Res 1987; 61:648-658.
Hajdu MA, Cornish KG, Tan W, et al: The interaction of the Bainbridge and Bezold-Jarisch reflexes in the conscious dog. Basic Res Cardiol: 1991; 86:175-185.
Mukkamala R, Cohen RJ, Mark RG: A computational model-based validation of Guyton’s analysis of cardiac output and venous return curves. Comput Cardiol 2002; 29:561-564.
Potts JT: Inhibitory neurotransmission in the NTS in the nucleus tractus solitarii: Implications for baroreflex resetting during exercise. Exp Physiol 2006; 91:59-72.
Wang JJ, Flewitt JA, Shrive NG, et al: The systemic venous circulation—waves propagating on a windkessel: Relation of arterial and venous windkessels to the systemic vascular resistance. Am J Physiol Heart Circ Physiol 2006; 290:H154-H162.