Walter F. Boron
The field of pulmonary mechanics—the physics of the lungs, airways, and chest wall—deals with how the body moves air in and out of the lungs, producing a change in lung volume (VL). When we examine these mechanical properties while no air is flowing, we are studying static properties. The situation becomes more complicated under dynamic conditions, when the lungs are changing volume and air is flowing either in or out.
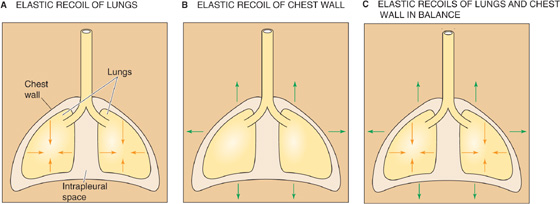
The interaction between the lungs and the thoracic cage determines VL. The lungs have a tendency to collapse because of their elastic recoil, a static property represented by the inwardly directed arrows in Figure 27-1A. The chest wall also has an elastic recoil. However, this elastic recoil tends to pull the thoracic cage outward (Fig. 27-1B). The stage is thus set for an interaction between the lungs and the chest wall: at equilibrium, the inward elastic recoil of the lungs exactly balances the outward elastic recoil of the chest wall (Fig. 27-1C). This interaction between lungs and chest wall does not occur by direct attachment but through the intrapleural space between the visceral and parietal pleurae (see Chapter 26). This space is filled with a small amount of pleural fluid and is extremely thin (5 to 35 μm). Because the lungs and chest wall pull away from each other on opposite sides of the intrapleural space, the intrapleural pressure (PIP) is less than barometric pressure (PB); that is, the intrapleural space is a relative vacuum. Although the designation PIP implies that we are referring exclusively to the intrapleural space, this description is not entirely accurate. Indeed, in addition to the intrapleural space, PIP is probably similar to the pressure in several other regions of the chest cavity:
1. the virtual space between the chest wall or diaphragm and the parietal pleura;
2. the virtual space between the lung and the visceral pleura;
3. the interstitial space that surrounds all pulmonary airways;
4. around the heart and vessels;
5. around and—to the extent that smooth muscle tone can be neglected—inside the esophagus.
Figure 27-1 Opposing elastic recoils of the lungs and chest wall.
It is helpful to think of PIP as the intrathoracic pressure—the pressure everywhere in the thorax except in the lumens of blood vessels, lymphatics, or airways. (See Note: Measurement of Intrapleural Pressure)
The vacuum is not uniform throughout the intrapleural space. When the subject is upright, the vacuum is greatest (i.e., PIP is least) near the apex of the lungs and progressively falls along the longitudinal axis to its lowest value near the bases of the lungs (Fig. 27-2). If a subject whose lungs are ~30 cm tall has finished a quiet expiration, and if PB is 760 mm Hg, PIP is ~753 mm Hg near the apices of the lungs and ~758 mm Hg near the bases. The PIP gradient is about what one would expect, given the density of the lungs. Note that PIP is subatmospheric throughout the chest cavity. Because respiratory physiologists historically measured these small pressures with water manometers rather than with less sensitive mercury manometers, it has become customary to express PIP in cm H2O relative to a PB of 0 cm H2O. Thus, PIP is about −10 cm H2O at the apex and −2.5 cm H2O at the base of the lungs.
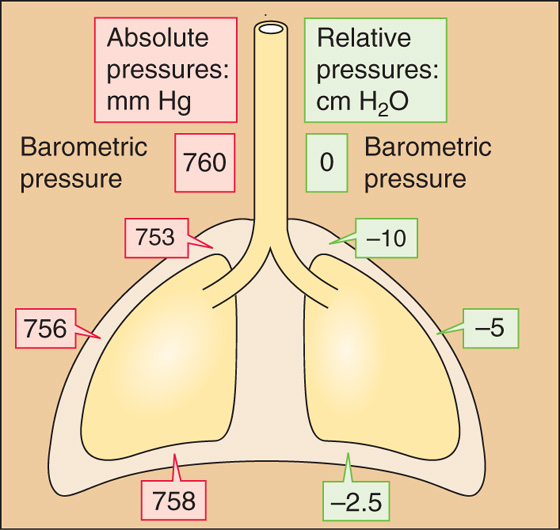
Figure 27-2 Intrapleural pressures. The values are those after a quiet expiration (i.e., functional residual capacity [FRC]).
The reasons for the apex-to-base PIP gradient are gravity and posture. When an individual stands vertically on the surface of the earth, gravity pulls the lungs downward and away from the apex of the thoracic cage. This force creates a greater vacuum (i.e., a lower PIP) at the apex. Gravity also pushes the bases of the lungs into the thoracic cavity, reducing the vacuum there. Standing on one’s head would invert these relationships. Lying on one’s side would create a PIP gradient along a frontal-horizontal axis (i.e., from side to side), although the PIP gradient would be much smaller because the side-to-side dimension of the thorax (and therefore the gradient created by the weight of the lungs) is less than the longitudinal dimension. In outer space, the PIP gradient would vanish. Thus, the local PIP depends on the position within the gravitational field.
For most of the remainder of this book, we ignore the PIP gradient and refer to an average PIP of about −5 cm H2O after a quiet expiration (Fig. 27-2).
We have seen that the opposing elastic recoils of the lungs and chest wall create a negative PIP that keeps the lungs expanded. Any change in the balance between these elastic recoils will cause VL to change as well. For example, imagine a healthy person with a functional residual capacity (FRC) of 3 L and a PIP of −5 cm H2O. If that person now develops pulmonary fibrosis, which increases the elastic recoil of the lungs, FRC would decrease because a PIP of −5 cm H2O would no longer be adequate to keep the resting VL at 3 L. Moreover, as the lungs shrink, PIP would become more negative, causing chest volume to decrease as well. Under normal circumstances, the key elastic recoil is the one we control: the elastic recoil of the chest wall, which we change moment to moment by modulating the tension of the muscles of respiration.
The muscles of inspiration expand the chest, increasing the elastic recoil of the chest wall and making PIP more negative. Despite the PIP gradient from the apex to the base of the lungs when no air is flowing at FRC (Fig. 27-2), the ΔPIP during inspiration is similar throughout the thoracic cavity. Responding to this enhanced intrathoracic vacuum, the lungs expand passively. The increase in VL is virtually the same as the increase in thoracic volume. The muscles that produce a quiet inspiration are called the primary muscles of inspiration and include the diaphragm and many intercostal muscles.
The most important component of the increase in chest volume is the rise in the chest cavity’s rostral-caudal diameter, a result of the action of the diaphragm. Stimulated by the phrenic nerves (derived from cervical roots C3 to C5), the diaphragm contracts and moves downward into the abdomen ~1 cm during quiet ventilation.
The external and internal intercostal muscles, innervated by segmental spinal nerves, span the space between adjacent ribs. The action of each such muscle depends partly on its orientation but especially—because of the shape of the rib cage—on its position along the rostral-caudal axis and around the dorsal-ventral circumference of the rib cage. Thus, not all external intercostals are inspiratory, and not all internal intercostals are expiratory. Inspiratory neurons preferentially stimulate the most rostral and dorsal external intercostals and the parasternal internal intercostals, both of which have inspiratory mechanical advantages. The contraction of these muscles has two consequences (Fig. 27-3A). First, the rib cage and the tissues between the ribs stiffen and are therefore better able to withstand the increasingly negative PIP. Second, thoracic volume increases as ribs 2 through 10 rotate upward and outward, increasing the transverse diameter (bucket-handle effect, Fig. 27-3B), and the upper ribs rotate the sternum upward and outward, increasing the anterior-posterior diameter (water pump–handle effect). (See Note: Actions of External and Internal Intercostal Muscles)
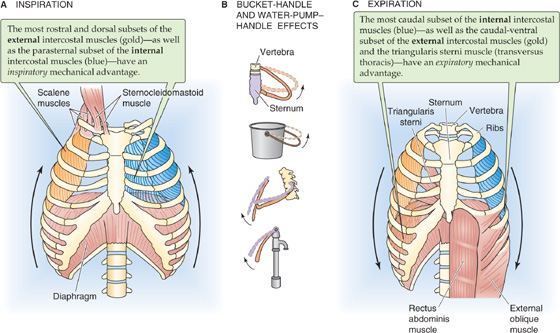
Figure 27-3 Actions of major respiratory muscles. External intercostal muscles slope obliquely between ribs, mostly forward and downward. Internal intercostal muscles also slope obliquely between ribs, but mostly backward and downward.
During a forced inspiration, the accessory (or secondary) muscles of inspiration also come into play:
1. Scalenes. These muscles lift the first two ribs.
2. Sternocleidomastoids. These muscles lift the sternum outward, contributing to the water pump–handle effect.
3. Neck and back muscles. These elevate the pectoral girdle (increasing the cross-sectional area of the thorax) and extend the back (increasing the rostral-caudal length).
4. Upper respiratory tract muscles. The actions of these muscles decrease airway resistance.
During a quiet inspiration, normal lungs store enough energy in their elastic recoil to fuel a quiet expiration, just as stretching of a rubber band stores enough energy to fuel the return to initial length. Thus, a quiet expiration is normally passive, accomplished simply by relaxation of the muscles of inspiration. Thus, there are no primary muscles of expiration.
Expiration is not always entirely passive. One example is a forced expiration in an individual with normal airway resistance. Another is even a quiet expiration of a person with a disease that increases airway resistance (e.g., asthma, chronic bronchitis, emphysema). In either case, the accessory muscles of expiration help make PIP more positive:
1. Abdominal muscles (internal and external oblique, rectoabdominal and transverse abdominal muscles). Contraction of these muscles (Fig. 27-3C) increases intra-abdominal pressure and forces the diaphragm upward into the chest cavity, decreasing the rostral-caudal diameter of the thorax and increasing PIP.
2. Intercostals. The most ventral-caudal external intercostals, the most caudal internal intercostals, and an intercostal-like muscle called the triangularis sterni all have an expiratory mechanical advantage. Expiratory neurons selectively stimulate these muscles, reducing both the anterior-posterior and the transverse diameters of the thorax. These actions are particularly important for coughing.
3. Neck and back muscles. Lowering of the pectoral girdle reduces the cross-sectional area of the thorax, whereas flexion of the trunk reduces the rostral-caudal diameter.
During a forced inspiration, the accessory muscles of inspiration use their energy mainly to increase VL (rather than to overcome resistance to airflow); the lungs store this extra energy in their elastic recoil. During a forced expiration, the accessory muscles of expiration use their energy mainly to overcome the resistance to airflow, as discussed later.
Imagine that a person suffers a puncture wound to the chest cavity, so that air enters the thorax from the atmosphere, raising PIP to the same level as PB. This condition is called a pneumothorax (from the Greek pneuma [air]). With no vacuum to counter their elastic recoil, alveoli will collapse—a condition known as atelectasis. The upper part of Figure 27-4A illustrates an extreme hypothetical case in which pressure is atmospheric throughout the thorax. Even though the lungs are collapsed, VL is not 0 because proximal airways collapse before smaller ones farther downstream, trapping air. The resulting minimal air volume is ~10% of total lung capacity (TLC), ~500 mL.
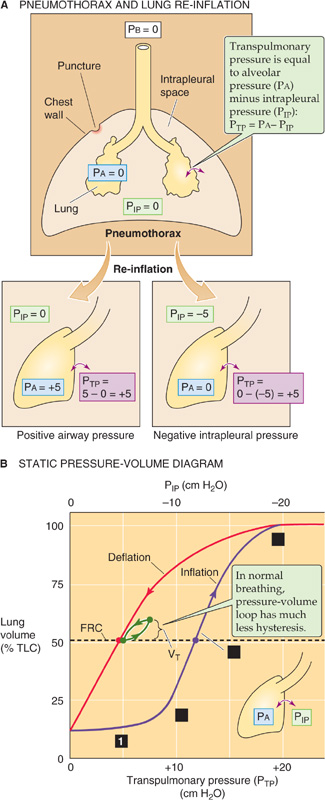
Figure 27-4 Collapse and re-inflation of the lungs. In A, we assume that intrapleural pressure (PIP) rises to barometric pressure (PB), so that transpulmonary pressure (PTP) falls to 0, collapsing the lungs.
We now wish to re-expand the collapsed lungs to their original volume (i.e., FRC). What are the forces at work during such a re-expansion? The force responsible for distending an airway is the transmural pressure (PTM)—the radial pressure difference across an airway wall at any point along the tracheobronchial tree:

PAW is the pressure inside the airway, and PIP is the pressure in the interstitial space surrounding the airway. A special case of PTM is the transmural pressure across the alveolar wall—transpulmonary pressure (PTP):

PA is alveolar pressure. When the glottis is open and no air is flowing, the lungs are under static conditions, and PA must be 0 cm H2O:
Thus, with the glottis open under static conditions, the pressure that inflates the alveoli (i.e., PTP) is simply the negative of PIP. We can re-expand the lungs to FRC by any combination of an increase in PA and a decrease in PIP, as long as PTP ends up at 5 cm H2O (Fig. 27-4A, lower panels). Thus, it makes no difference whether we increase PA from 0 to +5 cm H2O with PIP fixed at 0 (the principle behind positive-pressure ventilation in an intensive care unit) or whether we decrease PIP from 0 to −5 cm H2O with PA fixed at 0 (the principle behind physiological ventilation). In both cases, VL increases by the same amount.
A clinician would treat the pneumothorax by inserting a chest tube through the wound into the thoracic cavity and gradually pumping out the intrathoracic air. The clinician might also insert a tube through the mouth and into the upper trachea (to ensure a patent airway), use a mechanical ventilator (to ensure gas exchange), and sedate the patient (to prevent the patient from fighting the ventilator). Between the inspiratory cycles of the ventilator, the lungs are under static conditions and VL depends only on PTP—that is, the difference between PA (which is set by the ventilator) and PIP. As we remove air from the thorax, PIP becomes more negative and the alveoli re-expand. We can characterize the elastic (or static) properties of the lungs by plotting VL versus PTP as VL increases (Fig. 27-4B, purple curve). How do we obtain the necessary data? In principle, we could determine VL by using one of the methods discussed in Equation 26-4. We could read off PA (needed to compute PTP) directly from the ventilator. Finally, we could in principle measure PIP by using a pressure transducer at the tip of the chest tube. Most important, we must take our readings between inspiratory cycles of the ventilator—under static conditions.
During the re-inflation, measured under static conditions, we can divide the effect on VL into four stages, starting at the left end of the purple curve in Figure 27-4B:
Stage 1: Stable VL. In the lowest range of PIP values, making PIP more negative has little or no effect on VL. For example, decreasing PIP from 0 to −1 cm H2O (i.e., increase PTP from 0 to +1 cm H2O), we record no change in VL. Why? As discussed later, it is very difficult—because of the surface tension created by the air-water interface—to pop open an airway that is completely collapsed. Until PTP is large enough to overcome the collapsing effects of surface tension, a decrease in PIP has no effect on VL.
Stage 2: Opening of airways. Decreasing PIP beyond about −8 cm H2O produces VL increases that are at first small, reflecting the popping open of proximal airways with the greatest compliance. Further decreasing PIP produces larger increases in VL, reflecting the expansion of already open airways as well as recruitment of others.
Stage 3: Linear expansion of open airways. After all the airways are already open, making PIP increasingly more negative inflates all airways further, causing VL to increase in a roughly linear fashion.
Stage 4: Limit of airway inflation. As VL approaches TLC, decreases in PIP produce ever smaller increases in VL, reflecting decreased airway and chest wall compliance and the limits of muscle strength.
What would happen if, having inflated the lungs to TLC, we allowed PIP to increase to 0 cm H2O once again? Obviously, the VL would decrease. However, the lungs follow a different path during deflation (Fig. 27-4B, red curve), creating a PIP-VL loop. The difference between the inflation and the deflation paths—hysteresis—exists because a greater PTP is required to open a previously closed airway, owing to a deficit of surfactant at the air-water interface, than to keep an open airway from closing, reflecting abundant surfactant. We will discuss surfactant in the next section. The horizontal dashed line in Figure 27-4B shows that inflating collapsed lungs to FRC requires a PIP of −12 cm H2O (purple point), whereas maintaining previously inflated lungs at FRC requires a PIP slightly less negative than −5 cm H2O (red point). During normal ventilation, the lungs exhibit much less hysteresis, and the green PIP-VL loop in Figure 27-4B lies close to the red deflation limb of our original loop. The changes in VL in Figure 27-4B reflect mainly changes in the volume of alveoli, with a small contribution from conducting airways.
We will now focus on just the red curve in Figure 27-4B, a portion of which is the middle curve in Figure 27-5. Here, PTP is +5 cm H2O when VL is at FRC. As the subject makes a normal inspiration with a tidal volume (VT) of 500 mL, PTP increases (i.e., PIP decreases) by 2.5 cm H2O. The ratio of ΔVL to ΔPTP (i.e., the slope of the PTP-VL curve) is the compliance and a measure of the distensibility of the lungs. In our example,
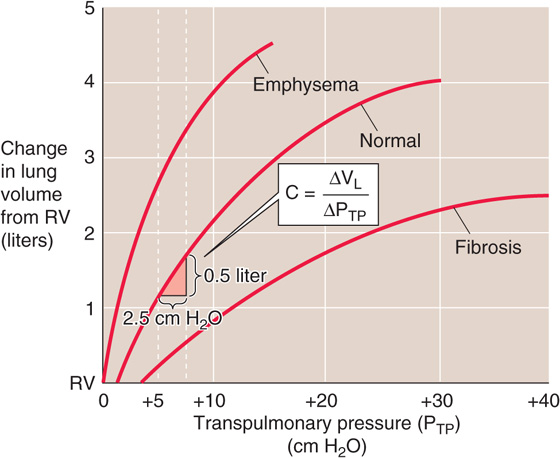
Figure 27-5 Static pressure-volume curves for lungs in health and disease.
Because we made this measurement under conditions of zero airflow, C is the static compliance. Static compliance, like VL, is mainly a property of the alveoli. The elastance of the lungs, which is a measure of their elastic recoil, is the reciprocal of the compliance (E = 1/C). Lungs with a high compliance have a low elastic recoil, and vice versa.
Figure 27-5 also shows representative PTP-VL relationships for lungs of patients with pulmonary fibrosis (bottom curve) and emphysema (top curve). In pulmonary fibrosis, the disease process causes deposition of fibrous tissue, so that the lung is stiff and difficult to inflate. Patients with restrictive lung disease, by definition, have a decreased C (i.e., a decreased slope of the VL versus PTP relationship in Fig. 27-5) at a given VL. The same ΔPTP that produces a 500-mL VL increase in normal lungs produces a substantially smaller VL increase in fibrotic lungs. In other words, static compliance (ΔVL/ΔPTP) is much less, or elastic recoil is much greater.
In emphysema, the situation is reversed. The disease process, a common consequence of cigarette smoking, destroys pulmonary tissue and makes the lungs floppy. An important part of the disease process is the destruction of the extracellular matrix, including elastin, by elastase released from macrophages. Normal mice that are exposed to cigarette smoke develop emphysema rapidly, whereas the disease does not develop in “smoker” mice lacking the macrophage elastase gene. The same increase in PTP that produces a 500-mL VL increase in normal lungs produces a substantially larger VL increase in lungs with emphysema. In other words, static compliance is much greater (i.e., much less elastic recoil).
Because it requires work to inflate the lungs against their elastic recoil, one might think that a little emphysema might be a good thing. Although it is true that patients with emphysema exert less effort to inflate their lungs, the cigarette smoker pays a terrible price for this small advantage. The destruction of pulmonary architecture also makes emphysematous airways more prone to collapse during expiration, drastically increasing airway resistance.
Two additional points are worth noting. First, compliance (i.e., slope of PTP-VL curve) decreases as VL increases from FRC to TLC (Fig. 27-5). Second, the PTP-VL curve is the amalgam of pressure-volume relationships of all alveoli. Different alveoli have different PTP-VL curves and may experience different intrapleural pressures, depending on their position within a gravitational field (Fig. 27-2). This inhomogeneity of static parameters contributes to regional differences in ventilation (see Chapter 31).
Restrictive Pulmonary Disease
Two major categories of pulmonary disease—restrictive and obstructive—can severely reduce total ventilation, that is, the amount of air entering and leaving the lungs per unit of time. Pulmonologists use the term restrictive lung disease in an inclusive sense to refer to any disorder that reduces functional residual capacity, vital capacity, or total lung capacity (see Fig. 26-8), thereby making the lungs difficult to inflate. Pure restrictive disease does not affect airway resistance. Restrictive disease can affect the lung parenchyma or three extrapulmonary structures.
Lung Parenchyma
Restrictive diseases of the lung parenchyma decrease the static compliance of the lung—mainly a property of the alveoli. To overcome increased elastic recoil, the patient must make extra effort to inhale. The patient compensates by making rapid but shallow inspirations. In newborns, an example is infant respiratory distress syndrome, caused by a deficiency in surfactant. Pulmonary edema is a buildup of fluid in the interstitial space between the alveolar and capillary walls and, eventually, the alveolar space. Interstitial inflammation of a variety of causes (e.g., infection, drugs, environmental exposure) can lead to the deposition of fibrous tissue and a group of diseases called diffuse interstitial pulmonary fibrosis.
Pleura
A buildup in the intrapleural space of either air (pneumothorax) or fluid (pleural effusion) can restrict the expansion of a vast number of alveoli.
Chest Wall
Rigidity of the chest wall makes it difficult to increase thoracic volume even if the neuromuscular system (see next) can generate normal forces. Ankylosing spondylitis is an inflammatory disorder of the axial skeleton that may reduce the bucket-handle rotation of the ribs during quiet inspirations and the flexion and extension of the trunk during forced inspirations and expirations. In kyphoscoliosis (angulation and rotation of the spine), deformation of the vertebrae and ribs may reduce ventilation. In both conditions, impairment of coughing predisposes to lung infections.
Neuromuscular System
The central nervous system may fail to stimulate the respiratory muscles adequately, or the muscles may fail to respond appropriately to stimulation. In polio, the virus occasionally attacks respiratory control centers in the brainstem. Amyotrophic lateral sclerosis (ALS or Lou Gehrig’s disease) leads to the destruction of premotor and motor neurons, including those to the muscles of respiration. (See Chapter 32.) Indeed, dyspnea on exertion is a common early symptom of ALS. Certain drug overdoses (e.g., barbiturate poisoning) may temporarily inhibit respiratory control centers in the brainstem. In the absence of supportive therapy (i.e., mechanical ventilation), the respiratory failure can be fatal. The pain that accompanies surgery or other injuries to the chest can also severely limit the ability to ventilate. Local paralysis of intercostal muscles allows the enhanced intrathoracic vacuum to suck in intercostal tissues during inspiration. This paradoxical movement reduces the efficiency of inspiration. Paradoxical movement may also occur with broken ribs, a condition known as flail chest.
What is the basis of the elastic recoil that determines the static compliance of the lungs? The elasticity of pulmonary cells and the extracellular matrix (e.g., elastin and collagen), what we might think of as the “anatomical” component of elastic recoil, generally accounts for a small part. The basis of most of the recoil was suggested in 1929 by von Neergaard, who excised lungs from cats and inflated them by applying positive pressure to the trachea under two conditions. When he filled the lungs with air, the PTP-VL curve looked similar to the one we have seen before (Fig. 27-6A, blue curve). However, when he degassed the airways and re-inflated them with saline, he found that (1) the PTP-VL relationship (Fig. 27-6A, orange curve) exhibited far less hysteresis and (2) the static compliance was substantially greater (i.e., much less pressure was required to inflate the lungs). These changes occurred because the saline-filled lungs lacked the air-water interface that generated surface tension in the air-filled lungs. It is this surface tension that is responsible for a large fraction of the lung’s elastic recoil.
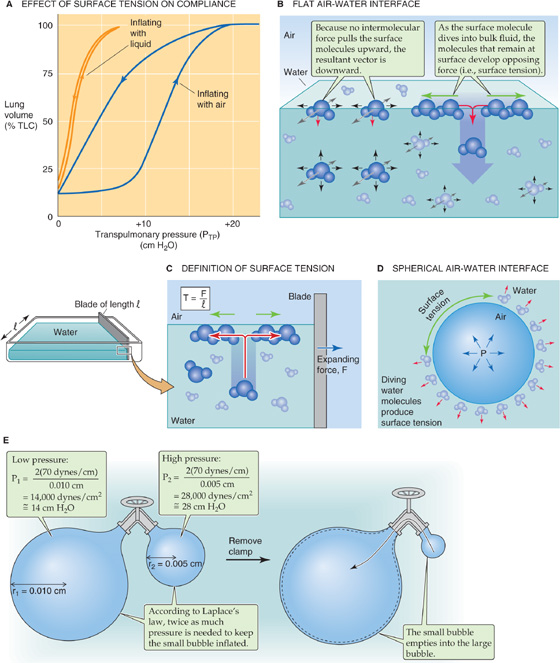
Figure 27-6 Effect of surface tension on the lung.
Surface tension is a measure of the force acting to pull a liquid’s surface molecules together at an air-liquid interface (Fig. 27-6B). Water molecules in the bulk liquid phase are equally attracted to surrounding water molecules in all directions, so that the net force acting on these “deep” water molecules is zero. However, water molecules at the surface are equally attracted to others in all directions but “up,” where no molecules are available to pull surface water molecules toward the air phase. Thus, a net force pulls surface molecules away from the air-water interface toward the bulk water phase.
We can think of the surface water molecules as beads connected by an elastic band. The force that pulls a water molecule down into the bulk also creates a tension between the molecules that remain at the surface, in a direction that is parallel to the surface. If we try to overcome this tension and stretch the air-water interface (Fig. 27-6C), thus increasing its area, we must apply force (F) to bring water molecules from the bulk liquid (a low-energy state) to the surface (a high-energy state). If the body of water on which we tug has a length of l, then the surface tension (T) is
For a simple air-water interface at 37°C, the surface tension is ~70 dynes/cm.
A drop of water falling through the air tends to form into a sphere because this shape has the smallest surface area and thus the lowest energy. Put differently, when the drop is spherical, it is impossible for any additional water molecules to leave the surface.
In the reverse scenario, a spherical air bubble surrounded by water (Fig. 27-6D), unbalanced forces acting on surface water molecules cause them to dive into the bulk, decreasing the surface area and creating tension in the plane of the air-water interface. This surface tension acts like a belt tightening around one’s waist. It tends to decrease the volume of compressible gas inside the bubble and increases its pressure. At equilibrium, the tendency of increased pressure to expand the gas bubble balances the tendency of surface tension to collapse it. Laplace’s equation describes this equilibrium: (See Note: Laplace’s Law for a Sphere)
P is the dependent variable; the surface tension T is a constant for a particular interface, and the bubble radius r is the independent variable. Therefore, the smaller the bubble’s radius, the greater the pressure needed to keep the bubble inflated. See Chapter 19 for a description of how Laplace’s treatment applies to blood vessels.
Our bubble-in-water analysis is important for the lung because a thin layer of water covers the inner surface of the alveolus. Just as surface tension at the air-water interface of our gas bubble causes the bubble to constrict, it also causes alveoli and other airways to constrict, contributing greatly to elastic recoil.
The analogy between air bubbles and alveoli breaks down somewhat because an alveolus only approximates a part of a sphere. A second complicating factor is that not all alveoli are the same size; some may have a diameter that is three or four times larger than that of others. Third, alveoli are interconnected.
Figure 27-6E shows what would happen if two imaginary air bubbles in water were connected by a tube with a valve that allows us to make or break the connection between the bubbles. For both, assume that the surface tension T is 70 dynes/cm. The valve is initially closed. The first bubble has a radius of 0.010 cm. The second is only half as wide. At equilibrium, the pressure required to keep the smaller bubble inflated is twice that necessary to keep the larger bubble inflated (see calculations in Fig. 27-6E). If we now open the valve between the two bubbles, air will flow from the smaller bubble to the larger bubble. To make matters worse for the smaller bubble, the smaller it becomes, the greater is the pressure needed to stabilize its shrinking radius. Because its pressure is less than required, air continues to flow out of the smaller bubble until it implodes completely.
In principle, the lung faces a similar problem. Smaller alveoli tend to collapse into larger ones. As we shall see, pulmonary surfactant minimizes this collapsing tendency by lowering surface tension. However, even without surfactant, the collapse of small alveoli could proceed only so far because each alveolus is tethered to adjacent alveoli, which help hold it open—the principle of interdependence.
Why would it matter if many smaller alveoli collapsed into a few larger alveoli? Such a collapse would reduce the total alveolar surface area available for diffusion of O2 and CO2 (see Chapter 29). Thus, from a teleological point of view, it is important for the lung to keep the alveoli as uniformly inflated as possible.
As noted earlier, surface tension accounts for most of the elastic recoil in normal lungs. However, if it were not for pulmonary surfactant, total elastic recoil would be even higher, and the lungs would be far more difficult to inflate. During quiet breathing, surfactant reduces surface tension to ~25 dynes/cm or less, far below the value of 70 dynes/cm that exists at a pure air-water interface.
The term surfactant means a surface-active agent. Because surfactants have both a hydrophilic region (strongly attracted to water) and a hydrophobic region (strongly repelled by water), they localize to the surface of an air-water interface. An example of a synthetic surfactant is dishwashing detergent. As a younger student, you may have done a simple experiment in which you filled a small-diameter cup with water and carefully floated a thin sewing needle—lengthwise—on the surface. The needle, like an insect that walks on water, is supported by surface tension, which pulls in the plane of the air-water interface. When you add a drop of liquid detergent to the surface of the water, the needle instantly sinks. Why? The detergent greatly reduces the surface tension.
Detergent molecules orient themselves so that their hydrophilic heads point toward (and interact with) the most superficial water molecules, whereas the hydrophobic tails point toward the air (Fig. 27-7A). The hydrophilic surfactant heads pull strongly upward on the most superficial water molecules, greatly reducing the net force on these surface water molecules and minimizing their tendency to dive into the bulk water. What prevents surfactant at the air-surfactant interface from diving into the bulk water? The hydrophobic tails exert a counterforce, pulling the surfactant upward toward the air. The situation is not unlike that of a fishing line with a bobber at one end and a sinker at the other: as long as the bobber is sufficiently buoyant, it remains at the water’s surface. Thus, unlike surface water molecules, which are subjected to a large net force pulling them into the bulk, surfactant experiences a much smaller net force. The greater the surface density of surfactant molecules at the air-water interface (i.e., the smaller the surface occupied by water molecules), the smaller the surface tension.
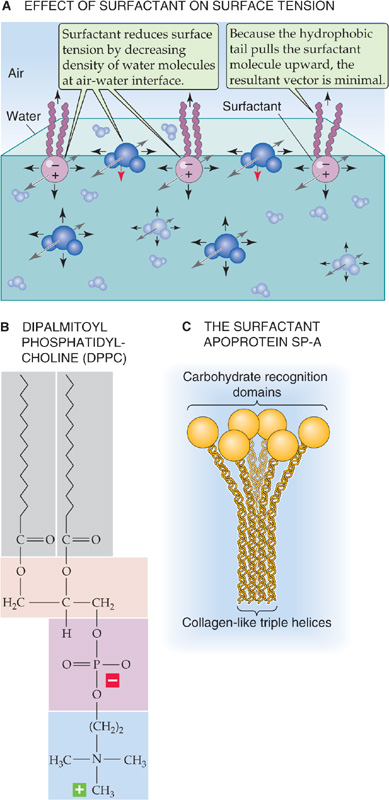
Figure 27-7 Effect of a surface-active agent on surface tension.
Pulmonary surfactant is a complex mixture of lipids and proteins. Type II alveolar cells (see Chapter 26), cuboidal epithelial cells that coexist with the much thinner type I cells, synthesize and secrete pulmonary surfactant. Clara cells in the respiratory bronchioles manufacture at least some components of pulmonary surfactant. Lipids make up ~90% of surfactant and are responsible for the surface-active properties. About half of the lipid is dipalmitoylphosphatidylcholine (DPPC; Fig. 27-7B), also known as dipalmitoyllecithin, which contains two fully saturated 16-carbon fatty acid chains (i.e., palmitates). The second most common lipids in pulmonary surfactant are phosphatidylcholine molecules with unsaturated fatty acid chains. Compared with cell membranes, phosphatidylglycerol (~11% of lipid) is overrepresented in surfactant.
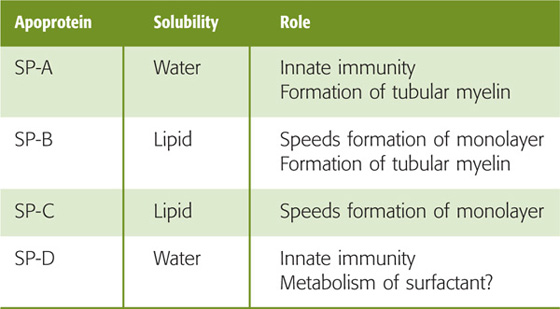
Proteins account for the remaining ~10% of pulmonary surfactant. Plasma proteins (mainly albumin) and secretory IgA make up about half of the protein, and four apoproteins (SP-A, SP-B, SP-C, and SP-D) make up the rest. SP-A and SP-D are water soluble and have collagen-like domains (Table 27-1). Both contribute to “innate immunity” by acting as opsonins to coat bacteria and viruses, thereby promoting phagocytosis by macrophages resident in the alveoli. In addition, SP-A (Fig. 27-7C) may be important for exertion of feedback control that limits surfactant secretion. The two hydrophobic apoproteins, SP-B and SP-C, are intrinsic membrane proteins that greatly increase the rate at which surfactant enters the air-water interface and then spreads as a surface film. The hereditary absence of SP-B leads to respiratory distress that is fatal unless the newborn receives a lung transplant.
Table 27-1 Surfactant Apoproteins
The lipid components of pulmonary surfactant enter type II cells from the bloodstream (Fig. 27-8A). Type II cells use the secretory pathway (see Chapter 2) to synthesize the four apoproteins, all of which undergo substantial post-translational modification. The final assembly of surfactant occurs in lamellar bodies, which are ~1 μm in diameter and consist of concentric layers of lipid and protein (Fig. 27-8B). Some of the material in these lamellar bodies represents newly synthesized components, and some of it represents recycled surfactant components retrieved from the alveolar surface. Each hour, the normal lung secretes into the alveolar space ~10% of the material present in the lamellar bodies.
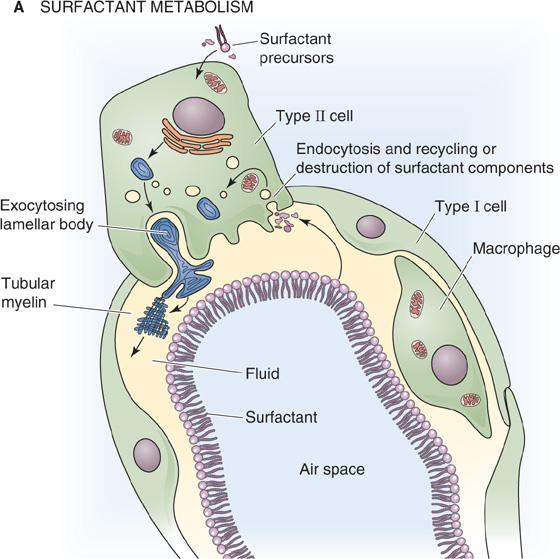
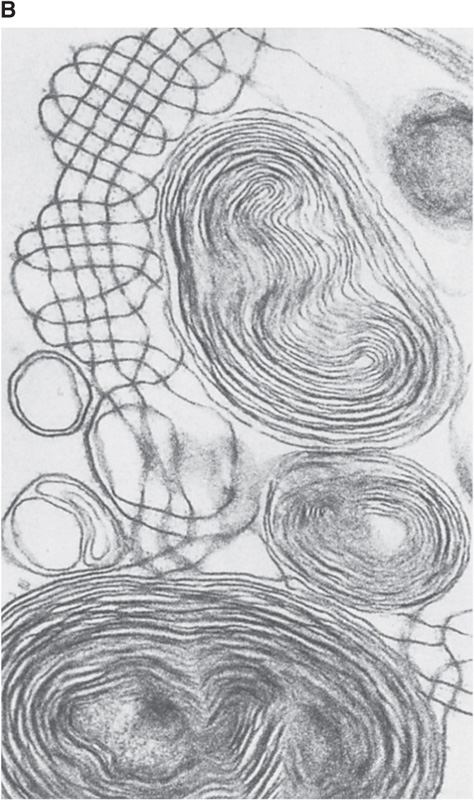
Figure 27-8 Generation of pulmonary surfactant. In B, the structures with concentric layers are lamellar bodies, which are continuous with tubular myelin (grid-like structures). (B courtesy of Dr. M. C. Williams, University of California, San Diego.)
The secretion of pulmonary surfactant occurs by constitutive exocytosis (see Chapter 2). Both synthesis and secretion are quite low until immediately before birth, when a surge in maternal glucocorticoid levels triggers these processes (see Chapter 57). Infants born prematurely may thus lack sufficient levels of surfactant and may develop infant respiratory distress syndrome (IRDS; see Chapter 57 for the box on this topic). In postnatal life, several stimuli enhance the surfactant secretion, including hyperinflation of the lungs (e.g., sighing and yawning), exercise, and pharmacological agents (e.g., β-adrenergic agonists, Ca2+ ionophores).
After its secretion into the thin layer of water that covers the alveolar epithelium, freed from the physical constraints of confinement to a lamellar body, pulmonary surfactant undergoes major structural changes. In this aqueous layer, surfactant takes on the form of a meshwork known as tubular myelin (Fig. 27-8B), which is rich in surfactant apoproteins. It is not clear whether surfactant normally passes through the tubular myelin state before forming a surface film at the air-water interface. However, tubular myelin is not required; SP-A knockout mice lack tubular myelin but have a normal surface film.
Two mechanisms remove components of pulmonary surfactant from the surface of alveoli. Alveolar macrophages degrade some of the surfactant. Type II cells take up the rest and either recycle or destroy it.
The pulmonary surfactant present at the alveolar air-water interface has three major effects.
First, because surfactant reduces surface tension, it increases compliance, making it far easier to inflate the lungs. If surfactant suddenly disappeared from the lungs, mimicking the situation in IRDS, total elastic recoil would increase (i.e., compliance would decrease) twofold or more, causing small airways to collapse partially. The situation would be similar to that described by the fibrosis curve in Figure 27-5. Because the compliance of the lungs is far lower than normal, an infant with IRDS—compared with a normal infant—must produce far larger changes in PTP (or PIP) to achieve the same increase in VL. Therefore, infants with low surfactant levels must expend tremendous effort to contract their inspiratory muscles and expand the lungs.
Second, by reducing surface tension, surfactant minimizes fluid accumulation in the alveolus. In the absence of surfactant, the large surface tension of the liquid layer between the air and the alveolar type I cells would cause the “air bubble” to collapse, drawing fluid into the alveolar space from the interstitium. The net effect would be to increase the thickness of the liquid layer, thereby impairing gas diffusion. With normal levels of surfactant, the surface tension of the water layer is low, and the tendency to draw fluid from the interstitium to the alveolar space is balanced by the negative interstitial hydrostatic pressure (i.e., PIP), which favors fluid movement from the alveolar space into the interstitium.
Third, surfactant helps keep alveolar size relatively uniform during the respiratory cycle. Imagine that we start—after a quiet expiration—with two alveoli having the same radius (e.g., 100 μm) and the same surface density of surfactant (to yield a surface tension of 20 dynes/cm), as indicated by the inner dashed circles of the two alveoli in Figure 27-9. However, either the conducting airway leading to the lower alveolus has a higher resistance or the lower alveolus itself has more fibrous tissue. Either way, the lower alveolus inflates more slowly during inspiration and—at any time—has a smaller volume than the upper one. This size difference has two negative consequences. (1) The total surface area of the two alveoli is less than if they had inflated equally, impairing gas diffusion. (2) Because the final volume increase of the upper alveolus may be greater than that of the lower one, its ventilation may be greater. Such unevenness of ventilation impairs effective gas exchange (see Chapter 31).
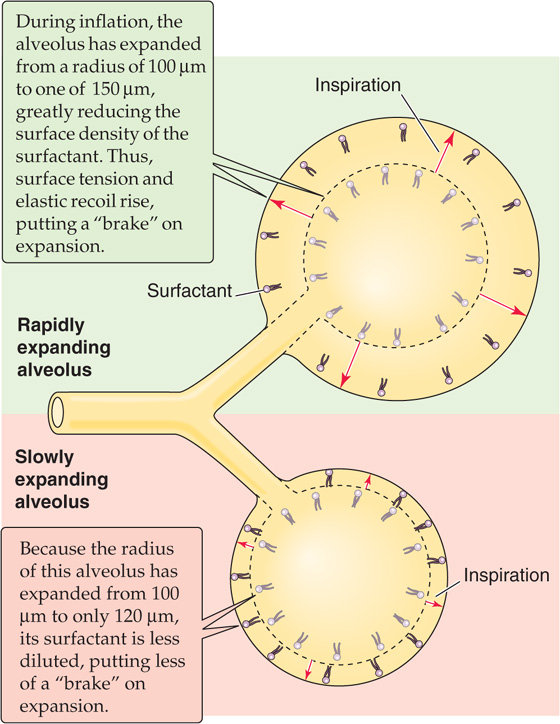
Figure 27-9 Braking action of surfactant on inflation.
Fortunately, surfactant helps alveoli dynamically adjust their rates of inflation and deflation, making ventilation more uniform among alveoli. During rapid inflation, the alveolar surface expands more rapidly than additional surfactant can reach the surface from a surfactant pool beneath the surface. Thus, surfactant on the surface is thought to break up like a flow of ice on the sea, with open areas of pure water between clusters of surfactant. With more exposed water at the surface, surface tension increases. Surface tension may double during inspiration, compared with the resting value at FRC. This effect would be exaggerated in rapidly expanding alveoli, which would develop a higher surface tension more quickly than slowly expanding alveoli. This higher surface tension produces a greater elastic recoil that opposes further expansion. Thus, the dilution of surfactant tends to put more of a brake on rapidly expanding airways, slowing their expansion to more nearly match that of alveoli that tend to inflate more slowly. (See Note: The Role of Surfactant in the "Static" Pressure-Volume Loop)
The opposite appears to happen during expiration, when the surface area of rapidly contracting alveoli falls more rapidly than surfactant can dive back down into the subsurface pool. The compression of surfactant causes surface tension to fall precipitously. Surface tension during expiration may fall to half the resting value at FRC. The more rapidly an alveolus shrinks, the more quickly its surface tension falls, the lower is its elastic recoil, and the greater is its tendency to re-expand. This action puts a brake on rapidly contracting alveoli, slowing their rate of shrinkage to more closely match that of slowly contracting alveoli. These changes in surfactant contribute to the small amount of hysteresis in a PIP-VL loop during quiet breathing (green loop in Fig. 27-4B).
When air is flowing—that is, under dynamic conditions—one must not only exert the force necessary to maintain the lung and chest wall at a certain volume (i.e., static component of force) but also exert an extra force to overcome the inertia and resistance of the tissues and air molecules (i.e., dynamic component of force).
The flow of air through tubes is governed by the same principles governing the flow of blood through blood vessels and the flow of electrical current through wires (see Equation 17-1). Airflow is proportional to driving pressure (ΔP) but inversely proportional to total airway resistance (RAW):
 (measured in liters per second) is airflow; the dot above the V indicates the time derivative of volume. For the lung, the driving pressure is the difference between alveolar pressure (PA) and barometric pressure (PB). Thus, for a fixed resistance, more airflow requires a greater ΔP (i.e., more effort). Viewed differently, to achieve a desired airflow, a greater resistance requires a greater ΔP.
When airflow is laminar—that is, when air molecules move smoothly in the same direction—we can apply Poiseuille’s law, which states that the resistance (R) of a tube is proportional to the viscosity of the gas (η) and length of the tube (l) but inversely proportional to the fourth power of radius:
This equation is the same as Equation 17-11 for laminar blood flow. In general, changes in viscosity and length are not very important for the lung, although the resistance while breathing helium is greater than that for nitrogen, the major component of air, because helium has a greater viscosity. However, the key aspect of Equation 27-8 is that airflow is extraordinarily sensitive to changes in airway radius. The fourth-power dependence of R on radius means that a 10% decrease in radius causes a 52% increase in R—that is, a 34% decrease in airflow. Although Poiseuille’s law strictly applies only to laminar flow conditions, as discussed later, airflow is even more sensitive to changes in radius when airflow is not laminar.
In principle, it is possible to compute the total airway resistance of the tracheobronchial tree from anatomical measurements, applying Poiseuille’s law when the flow is laminar and analogous expressions for airways in which the flow is not laminar. In 1915, Rohrer used this approach, along with painstaking measurements of the lengths and diameters of the airways of an autopsy specimen, to calculate the RAW of the tracheobronchial tree. However, it is not practical to compute RAW values, especially if we are interested in physiological or pathological changes in RAW. Therefore, for both physiologists and physicians, it is important to measure RAW directly. Rearrangement of Equation 27-7 yields an expression for RAW that we can compute after measurement of the driving pressure and the airflow that it produces:
We can measure airflow directly with a flowmeter (pneumotachometer) built into a tube through which the subject breathes. The driving pressure is more of a problem because of the difficulty in measuring PA during breathing. In 1956, DuBois and colleagues met this challenge by cleverly using Boyle’s law and a plethysmograph to measure the PA (Fig. 27-10). For example, if the peak during a quiet inspiration is −0.5 L/s (by convention, a negative value denotes inflow) and PA at the same instant is −1 cm H2O (from the plethysmograph), then

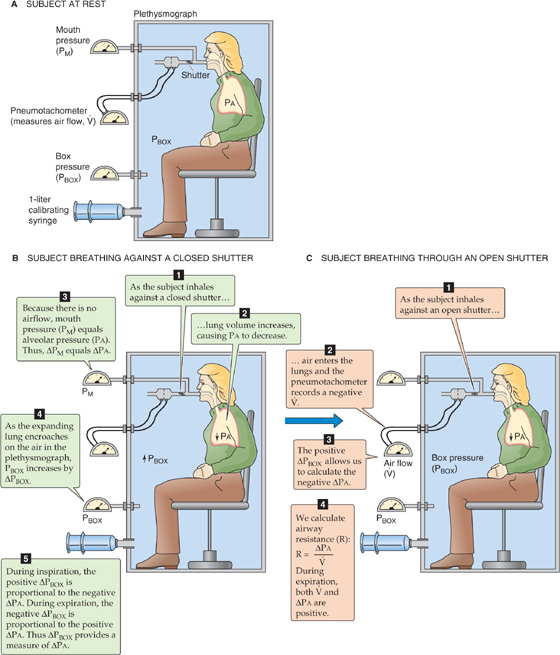
Figure 27-10 Measurement of alveolar pressure (PA) during airflow. This plethysmograph is similar to the one in Figure 26-9C, except that the spirometer is replaced by a sensitive device for measurement of the pressure inside the plethysmograph (PBOX). The subject breathes plethysmograph air through a tube that has an electronically controlled shutter as well as meters for measurement of airflow and pressure at the mouth. In B, with the subject making an inspiratory effort against a closed shutter, pressure at the mouth equals PA. We obtain the calibration ratio ΔPA/ΔPBOX, which allows us to convert future changes in the PBOX to changes in PA. In C, the subject inspires through an open shutter. During the first moments of inspiration, the thorax expands before much air enters the lungs. Because alveoli expand without much of an increase in the number of gas molecules, PA must fall. Conversely, because the thorax encroaches on the plethysmograph air, which has hardly lost any gas molecules to the lungs, PBOX must rise. From the calibration ratio ΔPA/ΔPBOX, we calculate ΔPA from ΔPBOX during inspiration. PA at any point during the respiratory cycle is the sum of the known PB and the measured ΔPA.
In normal individuals, RAW is ~1.5 cm H2O/(L/s) but can range from 0.6 to 2.3. Resistance values are higher in patients with respiratory disease and can exceed 10 cm H2O/(L/s) in extreme cases.
The resistance that we measure in this way is the airway resistance, which represents ~80% of total pulmonary resistance. The remaining 20% represents tissue resistance—that is, the friction of pulmonary and thoracic tissues as they slide past one another as the lungs expand or contract.
We have seen that laminar airflow is governed by a relationship that is similar to Ohm’s law. What happens when the airflow is not laminar? How can we predict whether the airflow is likely to be laminar? The flow of a fluid down a tube is laminar when particles passing any particular point always have the same speed and direction. Because of their viscosity, real fluids move fastest down the midline of the tube, and velocity falls to 0 as we approach the wall of the tube (Fig. 27-11A), as discussed for blood in Chapter 17. If the average velocity of the fluid flowing down the tube passes a critical value, flow becomes turbulent; local irregular currents, called vortices, develop randomly, and they greatly increase resistance to flow. Under ideal laboratory conditions, airflow generally is laminar when the dimensionless Reynolds number (Re) is less than 2000 (see Chapter 17):
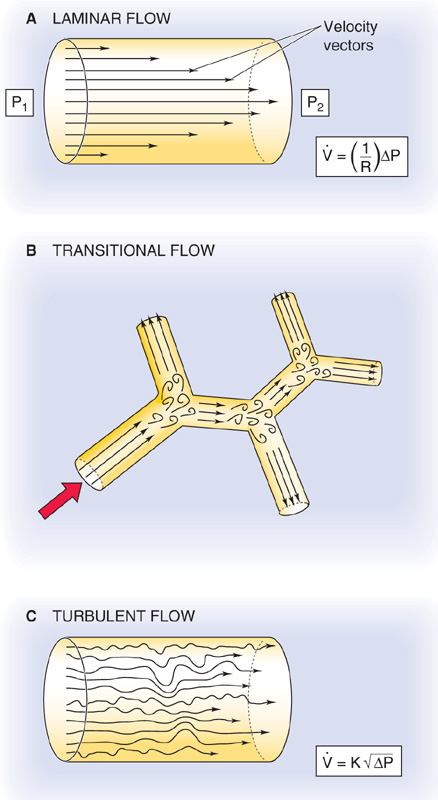
Figure 27-11 Laminar, transitional, and turbulent flow. In A, laminar airflow () is proportional to the driving pressure (ΔP = P1 − P2). In C, where turbulent airflow is proportional to the square root of the driving pressure, a greater ΔP (i.e., effort) is needed to produce the same as in panel A.
r is the radius of the tube,  is the velocity of the gas averaged over the cross section of the tube, ρ is the density of the gas, and η is its viscosity. When Re exceeds ~3000, flow tends to be turbulent. Between Re values of 2000 and 3000, flow is unstable and may switch between laminar and turbulent.
Reynolds developed Equation 27-11 to predict turbulence when fluids flow through tubes that are long, straight, smooth, and unbranched. Pulmonary airways, however, are short, curved, bumpy, and bifurcated. The branches are especially a problem because they set up small eddies (Fig. 27-11B). Although these eddies resolve farther along the airways, the air soon encounters yet other bifurcations, which establish new eddies. This sort of airflow is termed transitional. Because of the complex geometry of pulmonary airways, the critical Re in the lungs is far lower than the ideal value of 2000. In fact, Re must be less than ~1 for lung airflow to be laminar. Such low Re values and thus laminar flow are present only in the small airways that are distal to terminal bronchioles (see Chapter 26).
Airflow is transitional throughout most of the tracheobronchial tree. Only in the trachea, where the airway radius is large and linear air velocities may be extremely high (e.g., exercise, coughing), is airflow truly turbulent (Fig. 27-11C).
The distinction among laminar, transitional, and turbulent airflow is important because these patterns influence how much energy one must invest to produce airflow. When flow is laminar (see Equation 27-7), airflow is proportional to ΔP and requires relatively little energy. When flow is transitional, one must apply more ΔP to produce the same airflow because producing vortices requires extra energy. Thus, the “effective resistance” increases. When flow is turbulent, airflow is proportional not to ΔP but to  . Thus, we must apply an even greater ΔP to achieve a given flow (i.e., effective resistance is even greater).
As discussed earlier, airway resistance for healthy individuals is ~1.5 cm H2O/(L/s). Because effective resistance can increase markedly with increases in airflow—owing to transitional and turbulent airflow—it is customary to measure resistances at a fixed, relatively low flow of ~0.5 L/s. The second column of Table 27-2 shows how RAW normally varies with location as air moves from lips to alveoli during a quiet inspiration. A striking feature is that the greatest aggregate resistance is in the pharynx-larynx and large airways (diameter > 2 mm, or before about generation 8). Of the RAW of 1.5 cm H2O/(L/s) in this normal subject, 0.6 is in the upper air passages, 0.6 is in the large airways, and only 0.3 is in the small airways.
Table 27-2 Airway Resistance*
Locus |
Normal |
COPD |
Pharynx-larynx |
0.6 |
0.6 |
Airways > 2 mm diameter |
0.6 |
0.9 |
Airways < 2 mm diameter |
0.3 |
3.5 |
Total airway resistance |
1.5 |
5.0 |
*Units of resistance, cm H2O/(L/s).
Because R increases with the fourth power of airway radius (see Equation 27-8), it might seem counterintuitive that the small airways have the lowest aggregate resistance. However, although each small airway has a high individual resistance, so many are aligned in parallel that their aggregate resistance is very low. We see this same pattern of resistance in the vascular system, where capillaries make a smaller contribution than arterioles to aggregate resistance (see Chapter 19). (See Note: Aggregate Resistance of Small Airways)
Table 27-2 also shows an example of a patient with moderately severe chronic obstructive pulmonary disease (COPD), a condition in which emphysema or chronic bronchitis increases RAW (see the box on obstructive pulmonary diseases). COPD is a common and debilitating consequence of cigarette smoking, far more common than the lung cancer that receives so much attention in the lay press. Notice where the disease strikes. Even though COPD increases total airway resistance to 5.0 cm H2O/(L/s)—3.3-fold greater than in our normal subject—pharynx-larynx resistance does not change at all, and large-airway resistance increases only modestly. Almost all of the increment in RAW is due to a nearly 12-fold increase in the resistance of the smallest airways! According to Equation 27-8, we could produce a 12-fold increase in RAW by decreasing radius by about half.
Although small airways normally have a very low aggregate resistance, it is within these small airways that COPD has its greatest and earliest effects. Even a doubling of small-airway resistance from 0.3 to 0.6 cm H2O/(L/s) in the early stages of COPD would produce such a small increment in RAW that it would be impossible to identify the COPD patient in a screening test based on resistance measurements. As discussed in Chapter 31, approaches that detect the nonuniformity of ventilation are more sensitive for detection of early airway disease. In addition to COPD, the other common cause of increased RAW is asthma (see the box on asthma).
Obstructive Pulmonary Disease
Two major categories of pulmonary disease can markedly reduce total ventilation: the restrictive pulmonary diseases (discussed in the box on diseases affecting ventilation); and the obstructive pulmonary diseases, in which the pathological process causes a decrease in airway resistance—primarily a property of the conducting airways (see Chapter 26).
The condition can be acute, as with the aspiration of a foreign body, the buildup of mucus in an airway lumen, or the constriction of the airway lumen due to the contraction of smooth muscle in asthma (see the box on that topic).
Chronic obstructive pulmonary disease (COPD) is defined as an increase in airway resistance caused by chronic bronchitis (long-standing inflammation of the bronchi or bronchioles), emphysema (destruction of alveolar walls, producing a smaller number of large alveoli), or a combination of the two. In the United States, COPD is the fourth leading cause of death. The major risk factor is cigarette smoking, although the inherited absence of α1-antitrypsin (see Table 18-1) also predisposes to COPD. Inflammation leads to the infiltration of the walls of conducting airways by macrophages, activated T lymphocytes, and neutrophils and the infiltration of alveolar walls by activated lymphocytes. The release of neutrophil elastase and other proteases overwhelms natural antiproteases, such as α1-antitrypsin. Bronchitis increases airway resistance by narrowing the lumen. With its destruction of alveolar walls, emphysema increases the static compliance, which, by itself, would make it easier to inhale. However, the destruction of parenchyma also reduces the mechanical tethering of conducting airways, leading to an exaggerated collapse of these airways during expiration and thus an increase in airway resistance.
Asthma
Asthma, a common condition, occurs in 5% to 10% of the American population. Asthma is primarily an inflammatory disorder; the familiar bronchospasm is secondary to the underlying inflammation. One hypothesis is that asthma represents the inappropriate activation of immune responses designed to combat parasites in the airways. When a susceptible person inhales a trigger (e.g., pollen), inflammatory cells rush into the airways, releasing a multitude of cytokines, leukotrienes, and other humoral substances (e.g., histamine) that induce bronchospasm.
The patient suffering an acute asthma attack is usually easy to recognize. The classic presentation includes shortness of breath, wheezing, and coughing. Triggers include allergens, heat or cold, a host of occupational irritants, and exercise. The patient can often identify the specific trigger. Spirometry can confirm the diagnosis; the most characteristic feature is a decreased FEV1. Many asthmatics use peak flowmeters at home because the severity of symptoms does not always correlate with objective measurements of the disease’s severity.
The type of treatment depends on the frequency and severity of the attacks. Patients with infrequent attacks that are not particularly severe can often be treated with an inhaled β2-adrenergic agonist, only when needed. These medications, easily delivered by a metered-dose inhaler that can be carried around in one’s pocket or purse, act on β2-adrenergic receptors to oppose bronchoconstriction. A patient who requires such an agent more than one or two times a week should receive an inhaled corticosteroid on a regular basis to suppress inflammation. Inhaled corticosteroids generally lack the side effects of oral corticosteroids, but oral corticosteroids may be required in a patient with sustained and severe asthma. Many patients rely on regular dosing of long-acting β-agonist inhalers and inhaled corticosteroids to keep their asthma under control. Theophylline (a phosphodiesterase inhibitor that raises [cAMP]i; see Chapter 3), once a mainstay of asthma therapy, is now used far less commonly. Inhaled anticholinergic agents are more useful with COPD patients than with asthmatics but can be beneficial in some patients who cannot tolerate the side effects of β-adrenergic agonists (notably tachycardia). Smooth muscle relaxants (e.g., cromakalim-related drugs; see Chapter 7) and other anti-inflammatory agents (e.g., leukotriene inhibitors) also play a role in asthma therapy.
Regardless of its cause, increased RAW greatly increases the energy required to move air into and out of the lungs. If the increase in RAW is severe enough, it can markedly limit exercise. In extreme cases, even walking may be more exercise than the patient can manage. The reason is obvious from the pulmonary version of Ohm’s law (see Equation 27-7). The maximal ΔP (ΔPmax) that we can generate between atmosphere and alveoli during inspiration, for example, depends on how low we can drive alveolar pressure using our muscles of inspiration. For a given ΔPmax, a 3.3-fold increase in RAW (COPD patient in Table 27-2) translates to a 3.3-fold reduction in maximal airflow (max). (See Note: Effect of Increased Airway Resistance on Maximal Airflow)
Several factors can modulate RAW, including the autonomic nervous system (ANS), humoral factors, and changes in the volume of the lungs themselves. The vagus nerve, part of the parasympathetic division of the ANS, releases acetylcholine, which acts on an M3 muscarinic receptor on bronchial smooth muscle (see Chapter 14). The result is bronchoconstriction and therefore an increase in RAW. The muscarinic antagonist atropine blocks this action. Irritants such as cigarette smoke cause a reflex bronchoconstriction (see Chapter 32) in which the vagus nerve is the efferent limb.
Opposing the action of the vagus nerve is the sympathetic division of the ANS, which releases norepinephrine and dilates the bronchi and bronchioles but reduces glandular secretions. However, these effects are weak because norepinephrine is a poor agonist of the β2-adrenergic receptors that mediate this effect through cyclic adenosine monophosphate (cAMP; see Chapter 14).
Humoral factors include epinephrine, released by the adrenal medulla. Circulating epinephrine is a far better β2 agonist than is norepinephrine and therefore a more potent bronchodilator. Histamine constricts bronchioles and alveolar ducts and thus increases RAW. Far more potent is the bronchoconstrictor effect of the leukotrienes LTC4 and LTD4.
One of the most powerful determinants of RAW is VL. RAW is extremely high at residual volume (RV) but decreases steeply as VL increases (Fig. 27-12A). One reason for this effect is obvious: all pulmonary airways—including the conducting airways, which account for virtually all of RAW—expand at high VL, and resistance falls steeply as radius increases (see Equation 27-8). A second reason is the principle of interdependence—alveoli tend to hold open their neighbors by exerting radial traction or mechanical tethering (Fig. 27-12B). This principle is especially important for conducting airways, which have thicker walls than alveoli and thus a lower compliance. At high VL, alveoli dilate more than the adjacent bronchioles, pulling the bronchioles farther open by mechanical tethering. Patients with obstructive lung disease, by definition, have an increased RAW at a given VL (Fig. 27-12A). However, because these patients tend to have a higher than normal FRC, they breathe at a higher VL, where airway resistance is—for them—relatively low.
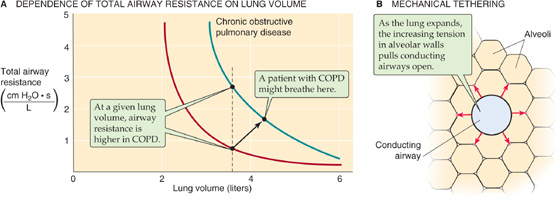
Figure 27-12 Airway resistance.
In Equation 27-2, we defined transpulmonary pressure as the difference between alveolar and intrapleural pressure (PTP = PA − PIP). What is the physiological significance of these three pressures, and how do we control them?
PIP is the parameter that the brain—through the muscles of respiration—directly controls. Rearranging the definition of PTP in Equation 27-2:

Thus, PIP has two components, −PTP and PA, as summarized in Figure 27-13 and Table 27-3. As we will see in the next section, PTP and PA literally flow from PIP.
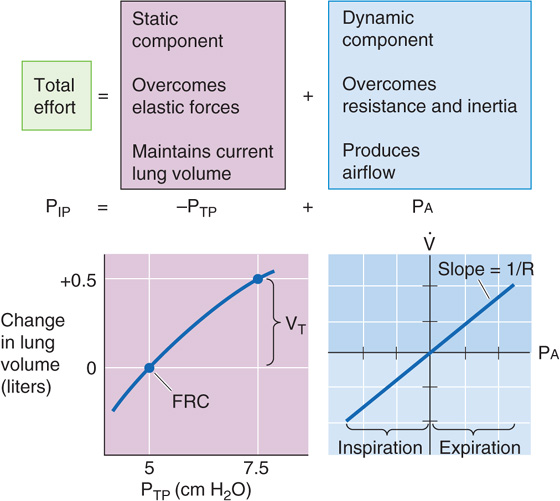
Figure 27-13 The static and dynamic components of intrapleural pressure.
Table 27-3 Static Versus Dynamic Properties of the Lungs
Property |
Static |
Dynamic |
Anatomical correlate |
Alveoli |
Conducting airways |
Key “constant” |
Static compliance, C |
Airway resistance, RAW |
Key pressure |
PTP (PTP = PA − PIP) |
PA |
Key parameter |
VL (C = ΔVL/ΔPTP) |
|
Pathological change |
Restrictive disease (e.g., fibrosis), caused by ↓C |
Obstructive disease (e.g., COPD), caused by ↑RAW |
Transpulmonary Pressure PTP is a static parameter. It does not cause airflow. Rather, along with static compliance, PTP determines VL. The curve in the lower left part of Figure 27-13—like the middle plot of Figure 27-5—describes how VL depends on PTP. That is, this curve describes the PTP required to overcome the elastic (i.e., static) forces that oppose lung expansion but makes no statement about . We have already seen that the slope of this curve is static compliance, a property mainly of the alveoli, and that a decrease in C can produce restrictive lung disease. Note that PTP not only determines VL under static conditions, when there is no airflow, but also under dynamic conditions (i.e., during inspiration and expiration). However, the brain does not directly control PTP.
Alveolar Pressure PA is a dynamic parameter. It does not determine VL directly. Instead, along with airway resistance, PA determines airflow. The curve in the lower right part of Figure 27-13 describes how depends on Pa. That is, this curve describes the PA required to overcome inertial and resistive (i.e., dynamic) forces that oppose airflow but makes no statement about VL. The slope of this plot is airway conductance, the reciprocal of RAW, which is mainly a property of the conducting airways. A decrease in RAW can produce obstructive lung disease. When PA is 0, must be 0, regardless of whether VL is at RV or TLC or anywhere in between. If the PA is positive and the glottis is open, air flows from alveoli to atmosphere, regardless of VL. If PA is negative, air flows in the opposite direction. As is the case with PTP, the brain does not directly control PA. (See Note: Airway Resistance)
During a quiet respiratory cycle—an inspiration of 500 mL, followed by an expiration—the body first generates negative and then positive values of Pa. The four large gray panels of Figure 27-14 show an idealized time course of five key parameters. The uppermost panel is a record of VL. The next panel is a pair of plots, −PTP and PIP. The third shows the record of Pa. The bottom panel shows a simultaneous record of . (See Note: Model of the Respiratory Cycle)
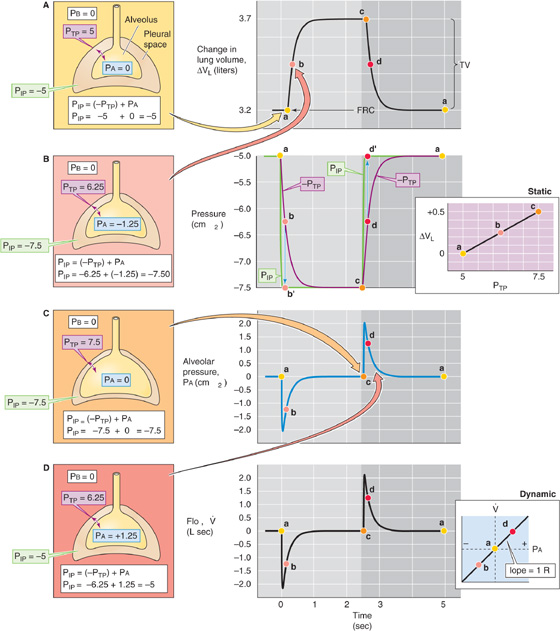
Figure 27-14 The respiratory cycle. PB, PIP, PTP, and PA are all in cm H2O. The colored points (labeled a, b, c, and d) in each of the central panels correspond to the illustrations (on the left) with the same colored background. The two panels on the right are taken from Figure 27-13. VL, lung volume; , airflow.
On the right side of Figure 27-14 are the static PTP-VL curve and the dynamic PA- relationship (both copied from Fig. 27-13). On the left side is a series of four cartoons that represent snapshots of the key pressures (i.e., PIP, PTP, and PA) at four points during the respiratory cycle:
a. Before inspiration begins. The lungs are under static conditions at a volume of FRC.
b. Halfway through inspiration. The lungs are under dynamic conditions at a volume of FRC + 250 mL.
c. At the completion of inspiration. The lungs are once again under static conditions but at a volume of FRC + 500 mL.
d. Halfway through expiration. The lungs are under dynamic conditions at a volume of FRC + 250 mL.
a. At the end of expiration/ready for the next inspiration. The lungs are once again under static conditions at a volume of FRC.
The VL record in the top gray panel of Figure 27-14 shows that VL rises more or less exponentially during inspiration and similarly falls during expiration.
Knowing the time course of VL, we obtained the PTP values in the second gray panel by reading them off the static PTP-VL diagram to the right and plotted them as −PTP (for consistency with Equation 27-12). As VL increases during inspiration, PTP increases (i.e., −PTP becomes more negative). The opposite is true during expiration. Remember that PTP (along with static compliance) determines VL at any time.
The PIP record in the second gray panel shows that PIP is the same as −PTP whenever the lungs are under static conditions (points a, c, and a). During inspiration, PIP rapidly becomes more negative than −PTP but then merges with −PTP by the end of inspiration. The difference between PIP and −PTP is PA, which must be negative to produce airflow into the lungs. During expiration, PIP is more positive than −PTP.
The PA record in the third gray panel shows that alveolar pressure is zero under static conditions (points a, c, and a). During inspiration, PA rapidly becomes negative but then relaxes to 0 by the end of inspiration. The opposite is true during expiration. The PA values in this plot represent the differences between the PIP and −PTP plots in the preceding panel.
We computed (bottom gray panel) from the relationship in Equation 27-7: = (PA − PB)/RAW. Remember that PA (along with RAW) determines at any time. Here, we assume that RAW is fixed during the respiratory cycle at 1 cm H2O/(L/s). Thus, the record has the same time course as Pa.
The key message in Figure 27-14 is that during inspiration, the negative shift in PIP has two effects. The body invests some of the energy represented by ΔPIP into transiently making PA more negative (dynamic component). The result is that air flows into the lungs and VL increases; but this investment in PA is only transient. Throughout inspiration, the body invests an increasingly greater fraction of its energy in making PTP more positive (static component). The result is that the body maintains the new, higher VL. By the end of inspiration, the body invests all of the energy represented by ΔPIP in maintaining VL and none in further expansion. The situation is not unlike that faced by Julius Caesar as he, with finite resources, conquered Gaul. At first, he invested all of his resources in expanding his territory at the expense of the feisty Belgians; but as the conquered territory grew, he was forced to invest an increasingly greater fraction of his resources in maintaining the newly conquered territory. In the end, he necessarily invested all of his resources in maintaining his territory and was unable to expand further.
In the preceding section, we examined pressure, volume, and flow changes during an idealized respiratory cycle of 5 seconds, which corresponds to a respiratory frequency of 12/minute. The top curve in Figure 27-15A shows a normal VL time course during an inspiration. As for any exponential process, the time constant (τ) is the interval required for ΔVL to be ~63% complete. For healthy lungs, τ is ~0.2 second. Thus, for inspiration, the increase in VL is 63% complete after 0.2 second, 86% complete after 0.4 second, 95% complete after 0.6 second, and so on. We will make the simplifying assumption that the time available for inspiration is half this time or 2.5 seconds, which represents more than 12 time constants! Thus, if the VT after infinite time were 500 mL, the ΔVL measured 2.5 seconds after initiation of inspiration would also be ~500 mL (Fig. 27-15A, green point). In Figure 27-15B, we replot this value as the green point at a frequency of 12/minute on the top curve (i.e., normal lungs). (See Note: Calculating the Time Constant for a Change in Lung Volume)
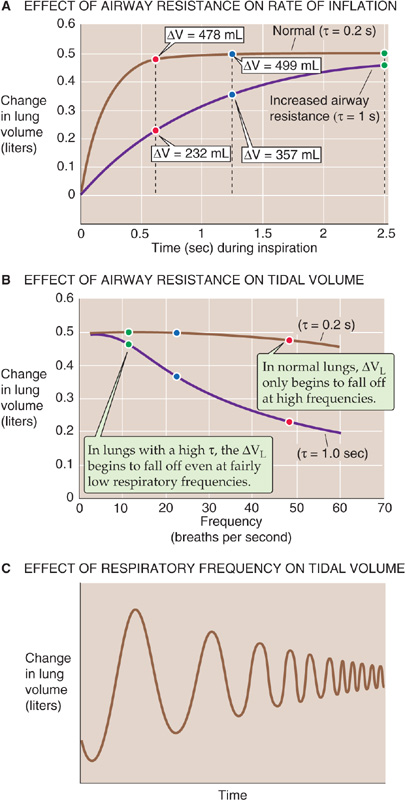
Figure 27-15 Dynamic compliance. In A and B, the colored points represent changes in volume at respiratory frequencies of 12, 24, and 48 breaths per minute.
For a respiratory frequency of 24/minute, 1.25 seconds is available for inspiration. At the end of this time, the ΔVL is ~499 mL (Fig. 27-15B, blue point on the top curve).
If we further increase the respiratory frequency to 48/minute, only 0.625 second is available for inspiration. At the end of this period, only slightly more than 3 time constants, the ΔVL is ~478 mL (Fig. 27-15B, red point on top curve). Thus, over a wide range of frequencies, ΔVL is largely unchanged. Only when respiratory frequency approaches extremely high values does ΔVL begin to fall off.
The situation is very different for a subject with substantially increased airway resistance. If RAW increased 5-fold, τ would also increase 5-fold to 1 second. As a result, the trajectory of VL also would slow by a factor of 5 (Fig. 27-15A, bottom curve). If we could wait long enough during an inspiration, these unhealthy lungs would eventually achieve a ΔVL of 500 mL. The problem is that we cannot wait that long. Therefore, if the frequency is 12/minute and inspiration terminates after only 2.5 seconds (i.e., only 2.5 time constants), the ΔVL would be only 459 mL (Fig. 27-15B, green point on bottom curve). Thus, even at a relatively low frequency, the patient with increased RAW achieves a ΔVL that is well below normal. (See Note: Calculating the Time Constant for a Change in Lung Volume)
For a respiratory frequency of 24/minute, when only 1.25 seconds is available for inspiration, the ΔVL is only 357 mL (Fig. 27-15B, blue point on bottom curve). At a respiratory frequency of 48/minute, when only 0.625 second is available for inspiration, the ΔVL is only 232 mL (Fig. 27-15B, red point on the bottom curve). Thus, the ΔVL for the subject with increased RAW falls rapidly as frequency increases.
We can represent the change in VL during cyclic breathing by a parameter called dynamic compliance:
Note that Cdynamic is proportional to ΔVL in Figure 27-15B. Under truly static conditions (i.e., frequency of 0), ΔPIP equals ΔPTP, and dynamic compliance is the same as static compliance (C or Cstatic) that we introduced in Equation 27-4. As frequency increases, Cdynamic falls below Cstatic. The degree of divergence increases with resistance. For the normal lung in Figure 27-15B, ΔVL and thus Cdynamic fall by only ~5% as frequency rises from 0 to 48/minute. However, for the lung with a 5-fold increased airway resistance, Cdynamic falls by more than 50% as frequency rises from 0 to 48/minute.
This pathological pattern is typical of asthma; RAW is elevated, but Cstatic is relatively normal. In emphysema, both RAW and Cstatic are elevated (Fig. 27-5, upper curve). Thus, a plot of Cdynamic versus frequency would show that Cdynamic is initially greater than Cstatic at low respiratory frequencies, but it falls below Cstatic as frequency increases. What do these frequency-dependent decreases in Cdynamic mean for a patient? The greater the respiratory frequency, the less time is available for inspiration or expiration, and the smaller the VT (Fig. 27-15C). (See Note: Implications of High-Frequency Breathing in a Patient with a High Time Constant)
This analysis greatly oversimplifies what happens in the lungs of real people. Although we have treated the lungs as if there were one value for RAW and one for Cstatic, each conducting airway has its own airway resistance and each alveolar unit has its own static compliance, and these values vary with parameters such as VL, posture, and hormonal status. As a result, some alveolar units have greater time constants than others. Airway disease may make some of these time constants substantially higher. As respiratory frequency increases, alveoli with relatively high time constants will have less time to undergo volume changes. As a result, these “slow” airways—compared with the “faster” airways—will make progressively smaller contributions to the overall ventilation of the lungs. At sufficiently high frequencies, very slow airways may drop out of the picture entirely.
We have noted three factors that modulate airway caliber: (1) the ANS, (2) humoral substances, and (3) VL (Fig. 27-12). A fourth factor that modulates RAW is flow of air through the conducting airway itself. Airflow alters the pressure difference across the walls of an airway, and this change in transmural pressure (PTM) can cause the airway to dilate or to collapse. Figure 27-16A–C depicts the pressures along a single hypothetical airway, extending from the level of the alveolus to the lips, under three conditions: during inspiration (Fig. 27-16A), at rest (Fig. 27-16B), and during expiration (Fig. 27-16C). In all three cases, the lung is at the same volume, FRC; the only difference is whether air is flowing into the lung, not flowing at all, or flowing out of the lung. Because VL is at FRC, PTP (the PTM for the alveoli) is 5 cm H2O in all three cases.
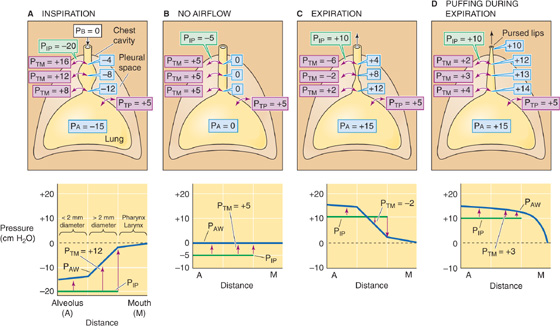
Figure 27-16 Dilation and collapse of airways with airflow. In all four panels, VL is FRC. PTM is the transmural pressure across conducting airways. Airway pressure (PAW) and values in pale blue balloons represent pressures inside conducting airways (all in cm H2O). Graphs at bottom show PAW profiles along airways (blue curve) from alveolus to mouth. PIP is constant throughout the thorax (green curve). The upward arrows tend to expand the airways, whereas the downward arrows tend to squeeze them.
Static Conditions First consider what happens under static conditions (Fig. 27-16B). In the absence of airflow, the pressures inside all airways must be 0. Considering first the alveoli, PTP is 5 cm H2O and the PA is 0, and thus PIP is −5 cm H2O. We will ignore the effects of gravity on PIP and thus assume that PIP is uniform throughout the chest cavity. The PIP of −5 cm H2O acts not only on alveoli but on all conducting airways within the thoracic cavity. For these, PTM at any point is the difference between the pressure inside the airway (PAW) and PIP (see Equation 27-1):

In other words, a transmural pressure of +5 cm H2O acts on all thoracic airways (but not the trachea in the neck, for example), tending to expand them to the extent that their compliance permits.
Inspiration Now consider what happens during a vigorous inspiration (Fig. 27-16A). We first exhale to a VL below FRC and then vigorously inhale, so that the PA is −15 cm H2O at the instant that VL passes through FRC. Because the lung is at FRC, PTP is +5 cm H2O. The PIP needed to produce a PA of −15 cm H2O is
This “inspiring” PIP of −20 cm H2O is just enough to produce the desired airflow and also to maintain the alveoli at precisely the same volume that they had under static conditions. But how does this exceptionally negative PIP affect airways upstream from the alveoli? PAW gradually decays from −15 cm H2O in the alveoli to 0 at the lips. The farther we move from the alveoli, the less negative is PAW, and thus the greater is PTM.
As an illustration, consider a point about halfway up the airway’s resistance profile, where PAW is −8 cm H2O:
Thus, the transmural pressure opposing the elastic recoil at this point has increased from +5 cm H2O at rest (Fig. 27-16B) to +12 cm H2O during this vigorous inspiration (Fig. 27-16A). Because PTM has increased, the airway will dilate. The tendency to dilate increases as we move from the alveoli to larger airways. As shown in the graph in the lower part of Figure 27-16A, PAW (and thus PTM, as indicated by the upward arrows) gradually increases. Note that the very positive PTM values that develop in the larger airways determine only the tendency to dilate. The extent to which an airway actually dilates also depends on its compliance. The amount of cartilage supporting the airways gradually increases from none for 11th-generation airways to a substantial amount for the mainstem bronchi. Because the increasing amount of cartilage in the larger airways decreases their compliance, they have an increasing ability to resist changes in caliber produced by a given change in PTM.
Expiration As might be expected, conducting airways tend to collapse during expiration (Fig. 27-16C). We first inhale to a VL above FRC and then exhale vigorously, so that PA is +15 cm H2O at the instant that VL passes through FRC. Because the lung is at FRC, PTP is +5 cm H2O. The PIP needed to produce a PA of +15 cm H2O is
This PIP of +10 cm H2O is 5 less than the PA and thus maintains the alveoli at the same volume that prevailed under static conditions and during inspiration. What is the effect of this very positive PIP on the upstream airways? PAW must decrease gradually from +15 cm H2O in the alveoli to 0 at the lips. The farther we move from the alveolus, the lower the PAW and thus the lower the PTM. At a point about halfway up the airway’s resistance profile, where PAW is +8 cm H2O:
Thus, at this point during a vigorous expiration, the transmural pressure opposing elastic recoil has fallen sharply from +5 cm H2O at rest (which tends to mildly inflate the airway) to −2 cm H2O during expiration (which actually tends to squeeze the airway). As we move from the alveoli to larger airways, PAW gradually decreases. That is, PTM gradually shifts from an ever-decreasing inflating force (positive values) to an ever-increasing squeezing force (negative values), as indicated by the change in the orientation of the arrows in the lower panel of Figure 27-16C. Fortunately, these larger airways—with the greatest collapsing tendency—have the most cartilage and thus some resistance to the natural collapsing tendency that develops during expiration. In addition, mechanical tethering helps all conducting airways surrounded by alveoli to resist collapse. Nevertheless, RAW is greater during expiration than it is during inspiration.
The problem of airway compression during expiration is exaggerated in patients with emphysema, a condition in which the alveolar walls break down. This process results in fewer and larger air spaces with fewer points of attachment and less mutual buttressing of air spaces. Although the affected alveoli have an increased compliance and thus a larger diameter at the end of an inspiration, they are flimsy and exert less mechanical tethering on the conducting airways they surround. Thus, patients with emphysema have great difficulty exhaling because their conducting airways are less able to resist the tendency to collapse. However, these patients make their expirations easier in three ways. We could predict them all from our knowledge of dynamic respiratory mechanics:
1. They exhale slowly. A low during expiration translates to a less positive PA and thus a less positive PIP, minimizing the tendency to collapse.
2. They breathe at higher VL. A high VL maximizes the mechanical tethering that opposes airway collapse during expiration and thus minimizes RAW (Fig. 27-12A).
3. They exhale through pursed lips. This maneuver—known as puffing—creates an artificial, high resistance at the lips. Because the greatest pressure drop occurs at the location of the greatest resistance, puffing causes a greater share of the PAW drop to occur across the lips rather than along collapsible, cartilage-free airways. Thus, puffing maintains relatively high PAW values farther along the tracheobronchial tree (Fig. 27-16D) and reduces collapsing tendencies throughout. The greatest collapsing tendencies are reserved for the largest airways that have the most cartilage (see Chapter 26). Of course, the patient pays a price for puffing: and thus the ventilation of the alveoli is low.
Cartilage and mechanical tethering oppose the tendency of conducting airways to collapse during expiration. Because tethering increases as VL increases, we expect airways to better resist collapse when VL is high. To see if this is true, we will examine how expiratory airflow varies with effort (i.e., alveolar pressure) at different VL.
Imagine that we make a maximal inspiration and then hold our breath with glottis open (Fig. 27-17A). Thus, PA is 0. In addition, PTP is +30 cm H2O to maintain TLC. From Equation 27-12, PIP = (−PTP) + PA = −30 cm H2O. Now, starting from TLC, we make a maximal expiratory effort. Figure 27-17B summarizes the pressures in the alveoli and thorax at the instant we begin exhaling but before VL has had time to change. PTP is still +30 cm H2O, but PA is now +40 cm H2O (to produce a maximal expiration) and PIP is therefore +10 cm H2O. As VL decreases during the course of the expiration, we will monitor , VL, and PA.
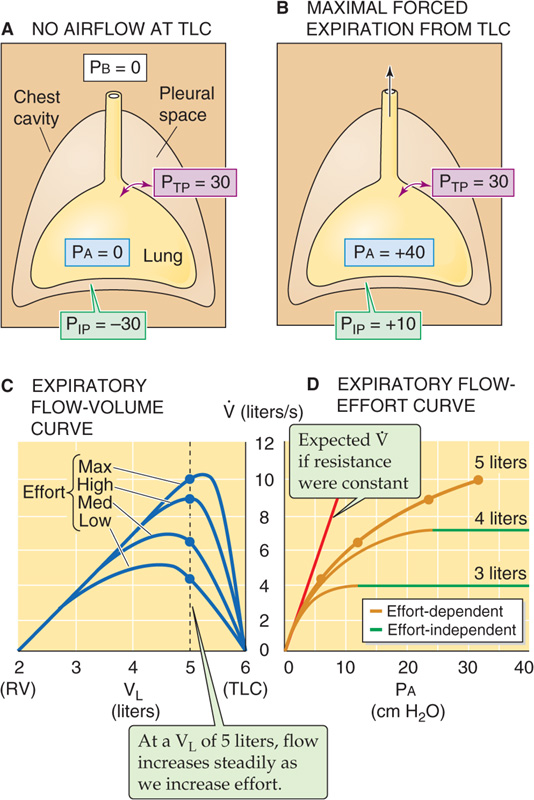
Figure 27-17 Dependence of airflow on effort. In D, note that if airway resistance were fixed, increased effort (i.e., increased PA) would yield a proportionate increase in , as indicated by the red line. However, increased effort tends to narrow airways, raising resistance and tending to flatten the curves. As VL decreases (e.g., 4 or 3 L), airflow becomes independent of effort with increasingly low effort. PB, PIP, PTP, and PA are all in cm H2O.
The top curve in Figure 27-17C shows how changes as a function of VL when, starting from TLC, we make a maximal expiratory effort. Notice that rises to its maximal value at a VL that is somewhat less than TLC and then gradually falls to 0 as VL approaches RV. The data in this top curve, obtained with maximal expiratory effort (i.e., at maximal Pa), will help us determine how expiratory flow varies with effort. To get the rest of the necessary data, we repeat our experiment by again inhaling to TLC and again exhaling to RV. However, with each trial, we exhale with less effort (i.e., at smaller Pa)—efforts labeled as high, medium, and low in Figure 27-17C.
If we draw a vertical line upward from a VL of 5 L in Figure 27-17C, we see that at this very high VL, gets larger and larger as the effort increases from low to medium to high to maximal. Because these efforts correspond to increasing PA values, we can plot these four data points (all obtained at a VL of 5 L) versus PA in the top curve of Figure 27-17D. Because increases continuously with the PA, flow is effort dependent at a VL of 5 L. If the airways were made of steel, this plot of versus PA would be a straight line. Because the actual plot bends downward at higher values of PA (i.e., greater efforts), RAW must have increased with effort (i.e., the airways collapsed somewhat).
Returning to Figure 27-17C, we see that an important characteristic of these data is that the versus VL curve for maximal expiratory effort defines an envelope that none of the other three curves could penetrate. Thus, at a VL of 4 L, is ~7 L/s, regardless of whether the expiratory effort is high or maximal (i.e., the two points overlie one another on the graph). At a VL of 3 L, the four curves have practically merged, so that is ~3.5 L/s regardless of effort. Thus, at lung volumes that are below 3 L, it does not matter how much effort we make; the expiratory flow can never exceed a certain value defined by the envelope.
Shifting back to Figure 27-17D, we see that for the lower two versus PA plots, increases with Pa—up to a point. Further increases in effort (i.e., Pa) are to no avail because they produce a proportional increase in RAW—expiration-induced airway collapse. Thus, the more positive values of PIP not only produce more positive values of PA but also increase RAW, so that Pa/RAW and thus remain constant.
At low lung volumes, flow becomes effort independent because the reduced mechanical tethering cannot oppose the tendency toward airway collapse that always exists during expiration. Moreover, at progressively lower VL, flow becomes effort independent earlier. In other words, particularly at low lung volumes, it simply does not pay to try any harder.
Books and Reviews
De Troyer A, Kirkwood PA, Wilson TA: Respiratory action of the intercostal muscles. Physiol Rev. 2005; 85:717-756.
Dietl P, Haller T: Exocytosis of lung surfactant: From the secretory vesicle to the air-liquid interface. Annu Rev Physiol. 2005; 67:595-621.
Floros J, Kala P: Surfactant proteins: Molecular genetics of neonatal pulmonary diseases. Annu Rev Physiol 1998; 60:365-384.
Fryer AD, Jacoby DB: Muscarinic receptors and control of airway smooth muscle. Am J Respir Crit Care Med 1998; 158:S154-S160.
Lai-Fook S: Pleural mechanics and fluid exchange. Physiol Rev 2005; 84:385-410.
Wright JR: Immunomodulatory functions of surfactant. Physiol Rev 1997; 77:931-962.
Journal Articles
Avery ME, Mead J: Surface properties in relation to atelectasis and hyaline membrane disease. Am J Dis Child 1959; 97:517-523.
Clements JA: Surface tension of lung extracts. Proc Soc Exp Biol Med 1957; 95:170-172.
Mead J, Whittenberger JL, Radford EP Jr: Surface tension as a factor in pulmonary volume-pressure hysteresis. J Appl Physiol 1957; 10:191-196.
Perkins WR, Dause RB, Parente RA: Role of lipid polymorphism in pulmonary surfactant. Science. 1996; 273:330-332.