CHAPTER 18
Emile L. Boulpaep
Blood is a complex fluid consisting of plasma—extracellular fluid rich in proteins—and of formed elements—red blood cells (RBCs), white blood cells (WBCs), and platelets. Total blood volume is ~70 mL/kg body weight in the adult woman and ~80 mL/kg body weight in the adult man (see Table 5-1).
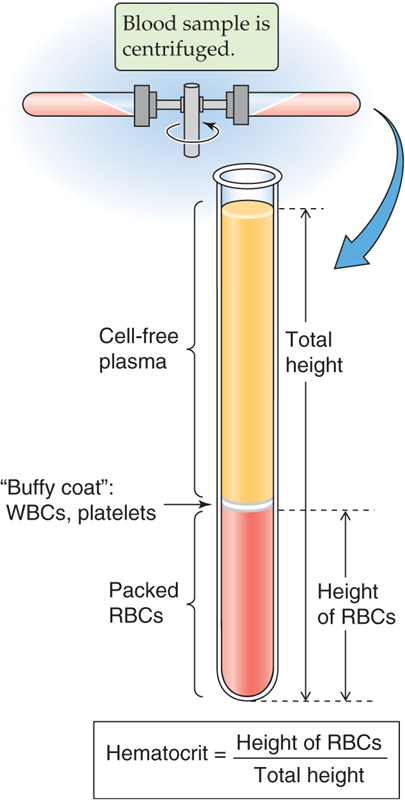
If you spin down a sample of blood containing an anticoagulant for ~5 minutes at 10,000 g, the bottom fraction contains formed elements—RBCs (or erythrocytes), WBCs (leukocytes, which include granulocytes, lymphocytes, and monocytes), and platelets (thrombocytes); the top fraction is blood plasma (Fig. 18-1). The RBCs having the highest density are at the bottom of the tube, whereas most of the WBCs and platelets form a whitish gray layer—the buffy coat—between the RBCs and plasma. Only a small amount of WBCs, platelets, and plasma is trapped in the bottom column of RBCs.
Figure 18-1 Determination of the hematocrit.
The hematocrit (see Chapter 5) is the fraction of the total column occupied by RBCs. The normal hematocrit is ~40% for adult women and ~45% for adult men. The hematocrit in the newborn is ~55% and falls to ~35% at 2 months of age, from which time it rises during development to reach adult values at puberty. The hematocrit is a measure of concentration of RBCs, not of total body red cell mass. Expansion of plasma volume in a pregnant woman reduces the hematocrit, whereas her total red cell volume also increases but less than plasma volume (see Chapter 56). Immediately after hemorrhage, the hematocrit may be normal despite the loss of blood volume (see Chapter 25). Total RBC volume is ~28 mL/kg body weight in the adult woman and ~36 mL/kg body weight in the adult man.
Plasma is a pale-white watery solution of electrolytes, plasma proteins, carbohydrates, and lipids. Pink-colored plasma suggests the presence of hemoglobin caused by hemolysis (lysis of RBCs) and release of hemoglobin into the plasma. A brown-green color may reflect elevated bilirubin levels (see Chapter 46). Plasma can also be cloudy in cryoglobulinemias. The electrolyte composition of plasma differs only slightly from that of interstitial fluid on account of the volume occupied by proteins and their electrical charge (see Table 5-2).
Plasma proteins at a normal concentration of ~7.0 g/dL account for a colloid osmotic pressure or oncotic pressure of ~25 mm Hg (see Chapter 20). Principal plasma proteins are albumin, fibrinogen, globulins, and other coagulation factors. The molecular masses of plasma proteins range up to 970kDa (Table 18-1). The plasma concentration of albumin ranges from 3.5 to 5.5 g/dL, providing the body with a total plasma albumin pool of ~135 g. Albumin is synthesized by the liver at a rate of ~120 mg/kg body weight per day and, because of catabolism, has a half-life in the circulation of ~20 days. Urinary losses of albumin are normally negligible (<20 mg/day; see Chapter 33). Plasma concentration of albumin is typically decreased in hepatic cirrhosis (see Chapter 24). Hepatic synthesis of albumin is strongly enhanced by a low plasma colloid osmotic pressure.
Table 18-1 Major Plasma Proteins*
Protein Fractions of Human Plasma |
Molecular Mass (kDa) |
Function |
Transthyretin |
62 |
Binds T3 and T4 |
|
|
Binds vitamin A |
Albumin |
69 |
Oncotic pressure |
|
|
Binds steroids, T3, bilirubin, bile salts, fatty acids |
α1-Antitrypsin (α1AT) |
54 |
Protease inhibitor; deficiency causes emphysema |
α2-Macroglobulin |
725 |
Broad-spectrum protease inhibitor Synthesized by liver |
Haptoglobin |
100 |
Binds hemoglobin |
β-Lipoprotein (LDL) |
380 |
Binds lipid |
Transferrin |
80 |
Binds iron |
Complement C3 |
185 |
Third component of complement system |
Fibrinogen |
340 |
Clotting protein; precursor of fibrin |
Immunoglobulin A (IgA) |
160 |
Mucosal immunity |
|
|
Synthesized by plasma cells in exocrine glands |
Immunoglobulin D (IgD) |
170 |
Synthesized by B lymphocytes |
Immunoglobulin E (IgE) |
190 |
Synthesized by B lymphocytes |
|
|
Binds to mast cells or basophils |
Immunoglobulin G (IgG) |
150 |
Humoral immunity |
|
|
Synthesized by plasma cells |
Immunoglobulin M (IgM) |
970 |
Humoral immunity |
|
|
Synthesized by B lymphocytes |
*The proteins are in the approximate order of decreasing electrophoretic mobility.
Many plasma proteins are involved in blood coagulation through coagulation cascades, the endpoint of which is the cleavage of fibrinogen into fibrin monomers that further assemble into a fibrin polymer. The fibrinogen molecule is a dimer of identical heterotrimers, each composed of Aα, Bβ, and γ chains. Fibrinogen is synthesized only by the liver (see Table 46-3) and circulates in plasma at concentrations of 150 to 300 mg/dL. The acute-phase response (see the box on erythrocyte sedimentation) greatly enhances fibrinogen synthesis. During clotting, the cross-linked polymers of fibrin form strands that trap red and white cells, platelets, and plasma inside the thrombus (i.e., blood clot). Subsequent interaction of myosin and actin in the platelets of the clot allows the clot to shrink to a plug that expels a slightly yellow-tinged fluid. This residual fluid is serum, which differs principally from plasma by the absence of fibrinogen and other coagulation factors. However, serum still contains albumin, antibodies, and other proteins. Note that plasma can also form a clot, but a plasma clot does not retract because it lacks platelets.
Subtraction of the albumin and fibrinogen moiety from total protein concentration yields the concentration of all the proteins grouped as globulins. Electrophoresis can be used to fractionate plasma proteins. The electrophoretic mobility of a protein depends on its molecular weight (size and shape) as well as its electrical charge. Plasma proteins comprise, in decreasing order of electrophoretic mobility (Fig. 18-2A), albumin, α1-globulins, α2-globulins, β-globulins, fibrinogen, and γ-globulins. The three most abundant peaks are albumin, fibrinogen, and γ-globulins. The γ-globulins include the immunoglobulins or antibodies, which can be separated into IgA, IgD, IgE, IgG, and IgM. Immunoglobulins are synthesized by B lymphocytes and plasma cells.
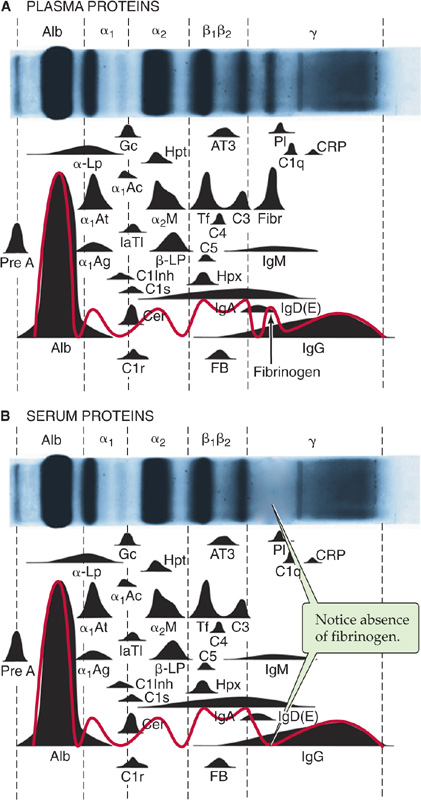
Figure 18-2 Electrophoretic pattern of human plasma proteins (A) and (B) serum proteins (i.e. without fibrinogens). Normal concentration ranges are as follows: total protein, 6 to 8 g/dL; albumin, 3.1 to 5.4 g/dL; α1-globulins, 0.1 to 0.4 g/dL; α2-globulins, 0.4 to 1.1 g/dL; β-globulins, 0.5 to 1.2 g/dL; γ-globulins, 0.7 to 1.7 g/dL.
Clinical laboratories most often perform electrophoresis of blood proteins on serum instead of plasma (Fig. 18-2B). Table 18-1 shows the major protein components that are readily resolved by electrophoresis. Proteins present in plasma at low concentrations are determined by immunological techniques, such as radioimmunoassay (see Chapter 47) and enzyme-linked immunosorbent assay. Not listed in Table 18-1 are several important carrier proteins present in plasma: transcobalamin (see Chapter 45), ceruloplasmin (see Chapter 46), IGF-binding proteins (see Chapter 48), thyroid-binding globulin (see Chapter 49), corticosteroid-binding globulin and sex hormone–binding globulin (see Chapter 50), and vitamin D–binding protein (see Chapter 52). The liver synthesizes most of the globulins and coagulation factors. (See Note: Plasma Proteins*)
If you spread a drop of anticoagulated blood thinly on a glass slide, you can detect under the microscope the cellular elements of blood. In such a peripheral blood smear, the following mature cell types are easily recognized: erythrocytes, granulocytes (divided in neutrophils, eosinophils, and basophils), lymphocytes, monocytes, and platelets (Fig. 18-3).
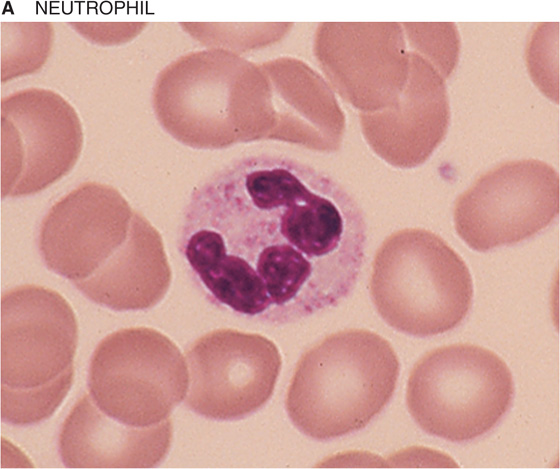
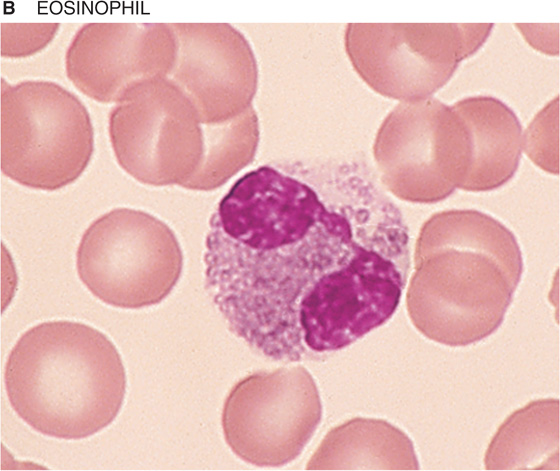
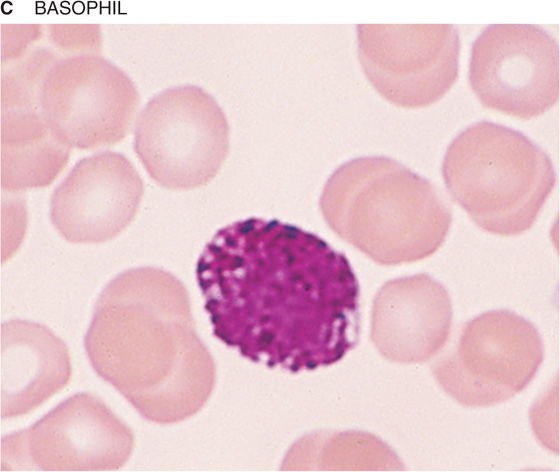
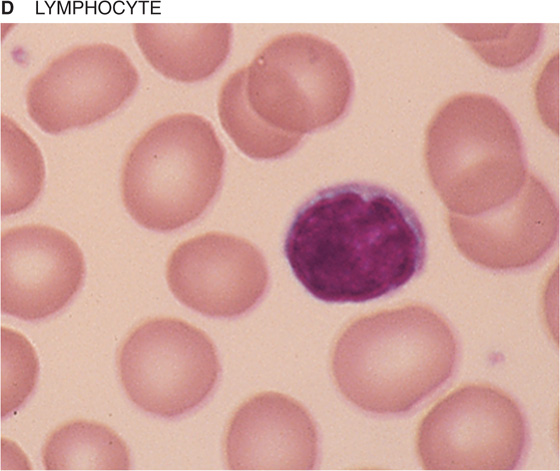
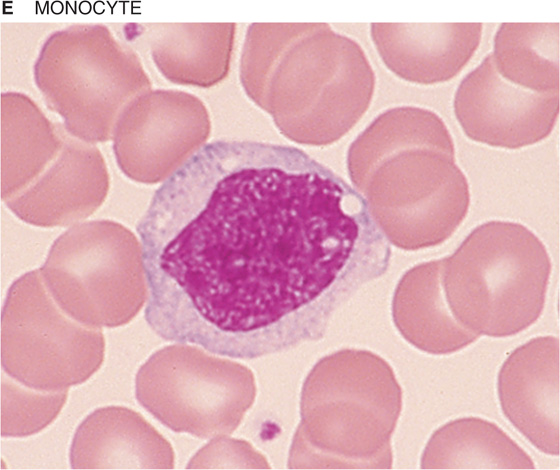
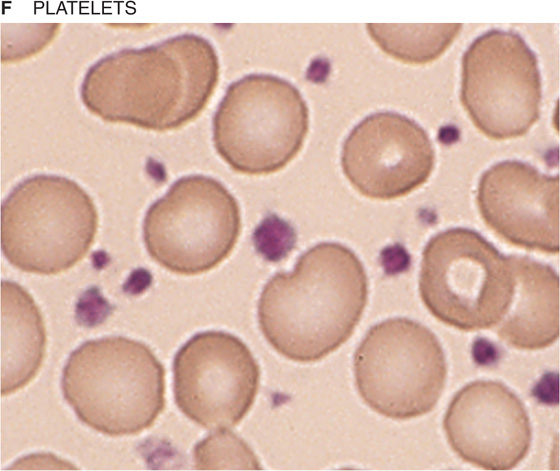
Figure 18-3 Peripheral blood smear. Erythrocytes (average diameter, ~7.5 μm) are present in all panels. The cellular elements are not represented according to their abundance. (From Goldman L, Ausiello D: Cecil’s Textbook of Medicine, 22nd ed. Philadelphia, WB Saunders, 2004.)
Hematopoiesis is the process of generation of all the cell types present in blood. Because of the diversity of cell types generated, hematopoiesis serves multiple roles ranging from the carriage of gases to immune responses and hemostasis. Pluripotent long-term hematopoietic stem cells (LT-HSCs) constitute a population of adult stem cells found in bone marrow that are multipotent and able to self-renew. The short-term HSCs (ST-HSCs) give rise to committed stem cells or progenitors, which after proliferation are able to differentiate into lineages that in turn give rise to burst-forming units (BFUs) or colony-forming units (CFUs), each of which ultimately will produce one or a limited number of mature cell types: erythrocytes, the megakaryocytes that produce platelets, eosinophils, basophils, neutrophils, monocytes-macrophages/dendritic cells, and B or T lymphocytes and natural killer cells (Fig. 18-4). Soluble factors known as cytokines guide the development of each lineage. The research of Donald Metcalf demonstrated the importance of a family of hematopoietic cytokines that stimulate colony formation by progenitor cells, the colony-stimulating factors. The main colony-stimulating factors are granulocyte-macrophage colony-stimulating factor (GM-CSF), granulocyte colony-stimulating factor (G-CSF), macrophage colony-stimulating factor (M-CSF), interleukins 3 and 5 (IL-3 and IL-5; see Chapter 3), thrombopoietin (TPO), and erythropoietin (EPO; see p. 453).
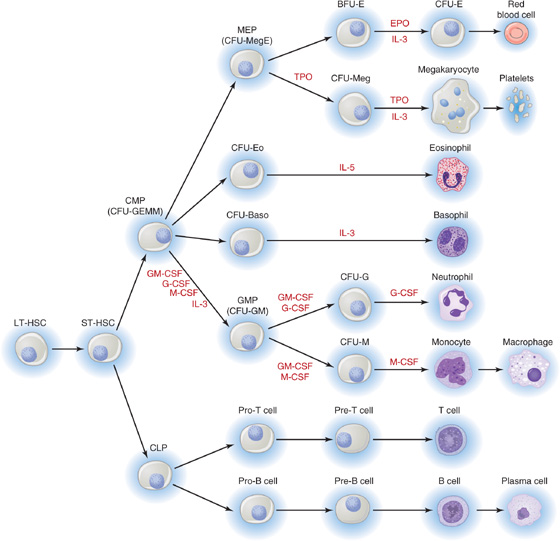
Figure 18-4 Hematopoietic lineages. BFU-E, burst-forming unit–erythroid; CFU, colony-forming unit (with the suffixes -Baso [basophilic], -E [erythroid], -Eo [eosinophil], -G [granulocyte], -GEMM [granulocyte, erythrocyte, monoctye, megakaryocyte], -GM [granulocyte-macrophage], -M [macrophage], -Meg [megakaryocyte], and -MegE [megakaryocyte-erythroid]); CLP, common lymphoid progenitor; CMP, common myeloid progenitor; CSF, colony-stimulating factor (with the prefixes G-[granulocyte], GM-[granulocyte-macrophage], and M-[macrophage]; EPO, erythropoietin; GMP, granulocyte-macrophage progenitor; IL-3 and IL-5, interleukins 3 and 5; LT-HSC, long-term hematopoietic stem cell; MEP, megakaryocyte-erythroid progenitor; ST-HSC, short-term hematopoietic stem cell; TPO, thrombopoietin.
GM-CSF is a glycoprotein that stimulates proliferation of a common myeloid progenitor and promotes the production of neutrophils, eosinophils, and monocytes-macrophages. Recombinant GM-CSF (sargramostim, Leukine) is used clinically after bone marrow transplantation and in certain acute leukemias.
G-CSF and M-CSF are glycoproteins that guide the ultimate development of granulocytes and monocytes-macrophages/dendritic cells, respectively. Recombinant G-CSF (filgrastim, Neupogen) is used therapeutically in neutropenia (e.g., after chemotherapy). M-CSF is also required for osteoclast development (see Chapter 52, particularly Fig. 52-4).
IL-3 (also known as multi-CSF) has a broad effect on multiple lineages. The liver and the kidney constitutively produce this glycoprotein. IL-5 (colony-stimulating factor, eosinophil), a homodimeric glycoprotein, sustains the terminal differentiation of eosinophilic precursors.
TPO binds to a thrombopoietin receptor called c-Mpl, which is the cellular homologue of the viral oncogene v-mpl (murine retrovirus myeloproliferative leukemia virus). On stimulation by TPO, the Mpl receptor induces an increase in number and size of megakaryocytes—the cells that produce platelets—thereby greatly augmenting the number of circulating platelets. (See Note: Erythropoietin)
Erythropoietin (EPO), which is homologous to TPO, is produced by the kidney and to a lesser extent by the liver. This cytokine supports erythropoiesis or red cell development (Fig. 18-5). As described earlier, hypoxia increases the abundance of the α subunit of the hypoxia-inducible factor 1 (HIF-1α), enhancing production of erythropoietin mRNA. Although EPO is not absolutely required for early commitment of progenitor cells to the erythroid lineage, it is essential for the differentiation of burst-forming unit–erythroid cells (BFU-E) to CFU-E or proerythroblasts (also known as pronormoblasts), which still lack hemoglobin. The further maturation of cells downstream of proerythroblasts does not require EPO. Recombinant EPO has proved effective in the treatment of anemia. Hemoglobin first appears at the stage of polychromatic erythroblasts and is clearly evident in orthochromatic erythroblasts. The subsequent exocytosis of the nucleus produces reticulocytes (Fig. 18-5), whereas the loss of ribosomes and mitochondria yields mature erythrocytes, which enter the circulation. The mature erythrocyte has a life span of ~120 days. Immature reticulocytes may also appear in the circulation when erythropoiesis is heavily activated.
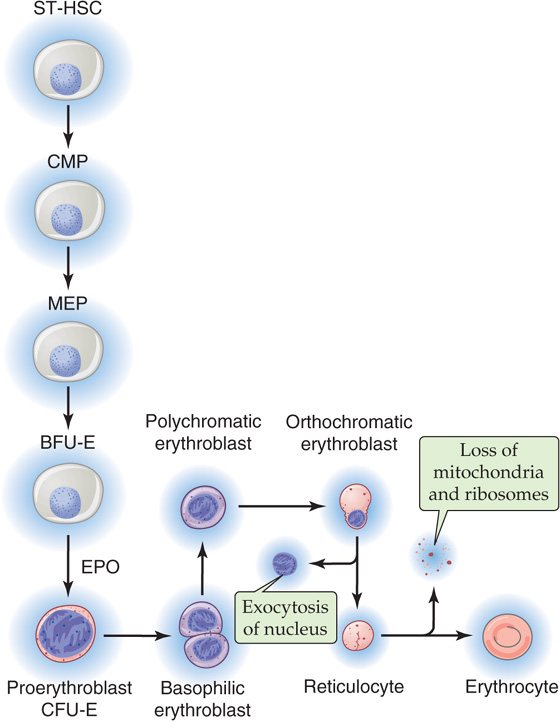
Figure 18-5 Erythropoiesis.
As evidenced by the magnitude of the hematocrit, RBCs are the most abundant elements in blood. RBCs are nonnucleated biconcave cells with a diameter of ~7.5 μm and a volume of ~90 femtoliters (90 × 10−15 L). Maintaining the shape of the RBC is a cytoskeleton that is anchored to the plasma membrane by glycophorin and the Cl-HCO3 exchanger AE1 (see Fig. 2-9). The distinctive shape of the RBC provides a much larger surface-to-volume ratio than that of a spherical cell, thereby maximizing diffusion area and minimizing intracellular diffusion distances for gas exchange. The RBC performs three major tasks: (1) carrying of O2 from the lungs to the systemic tissues, (2) carrying of CO2 from tissues to the lungs, and (3) assisting in the buffering of acids and bases.
Table 18-2 lists the properties of RBCs that are routinely determined in the clinical laboratory. The most important constituent of the RBC is hemoglobin. Globin synthesis begins in the proerythroblast (Fig. 18-5). By the end of the orthochromatic-erythroblast stage, the cell has synthesized all the hemoglobin it will carry. Normal blood hemoglobin content is ~14.0 g/dL in the adult woman and ~15.5 g/dL in the adult man. The hemoglobin concentration in red cell cytosol is extremely high, ~5.5 mM. The mean cell hemoglobin concentration is ~35 g/dL RBC, or about five times the concentration of proteins in plasma. Enclosure of hemoglobin in red cells has the advantage of minimizing the loss of hemoglobin from the plasma through filtration across the blood capillary walls. The structure and various chemical forms of hemoglobin as well as the carriage of O2 and CO2 by hemoglobin are discussed in Chapter 29.
Table 18-2 Typical Blood Cell Parameters
Red cell count (106/μL blood) |
4.0 (female); 4.5 (male) |
Hematocrit (%) |
40 (female); 45 (male) |
Hemoglobin (g/dL blood) |
14.0 (female); 15.5 (male) |
Mean red cell volume—MCV (fL/cell) |
90 |
Mean red cell hemoglobin—MCH (pg/cell) |
30 |
Mean cell hemoglobin concentration—MCHC (g/dL RBC) |
35 |
Red cell distribution width—RDW (%) |
13 |
White cell count (103/μL blood) |
8 |
Platelet count (103/μL blood) |
300 |
Because the mature RBCs contain no nucleus or other organelles, they can neither synthesize proteins nor engage in oxidative metabolism. The RBC can engage in two metabolic pathways: glycolysis, which consumes 90% of glucose uptake; and the pentose shunt (see Chapter 58), which consumes the remaining 10% of glucose. The cell generates its ATP exclusively by glycolysis. An important constituent of the RBC is 2,3-diphosphoglycerate (2,3-DPG). RBCs use DPG mutase to convert 1,3-diphosphoglycerate (1,3-DPG), part of the normal glycolytic pathway (see Chapter 58), into 2,3-DPG. In RBCs, the cytosolic concentration of 2,3-DPG is normally 4 to 5 mM, about the same as the concentration of hemoglobin. 2,3-DPG acts on hemoglobin by reducing the O2 affinity of hemoglobin (see Chapter 29).
Erythrocytes contain glutathione at ~2 mM, more than any other cell of the body outside the hepatocyte (see Chapter 46). A high ratio of reduced glutathione (GSH) to oxidized glutathione (GSSG) protects the RBC against oxidant damage. Glutathione reductase regenerates GSH from GSSG in a reaction that consumes NADPH. The RBC generates all its NADPH from the glycolytic intermediate glucose 6-phosphate through the pentose phosphate pathway (see Fig. 58-1). (See Note: Carbonic Anhydrases)
RBCs carry two cytoplasmic isoforms of carbonic anhydrase, CA I and CA II. These enzymes, which rapidly interconvert CO2 and HCO−3, play a critical role in carrying metabolically produced CO2 from the systemic tissues to the pulmonary capillaries for elimination in the exhaled air. CA II has one of the fastest known enzymatic turnover rates (see Chapter 29).
CO2 carriage also depends critically on the Cl-HCO3 exchanger AE1 (see Chapters 5 and 29) in the RBC membrane. The transporter was originally known as band 3 protein because of its position on an SDS-polyacrylamide gel of RBC membrane proteins. AE1 is the most abundant membrane protein in RBCs, with ~1 million copies per cell. One AE1 molecule can transport as many as 50,000 ions per second—one of the fastest known transporters. AE1 and most other members of the SLC4 family of HCO−3 transporters are blocked by a disulfonic stilbene known as DIDS.
The water channel AQP1 (see Chapter 5) is the second most abundant membrane protein in RBCs, with ~200,000 copies per cell. AQP1 appears to contribute more than half of the CO2 permeability of the RBC membrane (see Chapter 29).
Table 18-3 summarizes the relative abundance of various leukocytes in the blood. These WBCs are in two major groups, the granulocytes on the one hand and the lymphocytes and monocytes on the other. Granulocytes are so named because of their cytoplasmic granules, which on a blood smear stained with Giemsa stain or Wright stain appear red (eosinophils), blue (basophils), or intermediate (neutrophils). The nuclear material is irregularly shaped in the form of the letter S or Z. The name polymorphonuclear leukocytes applies to all three types of granulocytes but often is used to refer specifically to neutrophils. The average diameter of a neutrophil is 12 μm, smaller than that of a monocyte (14 to 20 μm) or eosinophil (13 μm), somewhat larger than that of a basophil, and much larger than that of a lymphocyte (6 to 10 μm). Granulocytes have a brief life span in the blood (<12 hours) but on activation can migrate into the tissues.
Table 18-3 Leukocytes*
|
Count (103/μL blood) |
Differential Count (%) |
Total leukocytes |
7.4 |
100 |
Neutrophils |
4.4 |
59 (56% segmented, 3% band) |
Lymphocytes |
2.5 |
34 |
Monocytes |
0.3 |
4 |
Eosinophils |
0.2 |
3 |
Basophils |
0.04 |
0.5 |
* Listed in order of abundance.
Neutrophils The most abundant leukocytes, neutrophils are identified on the basis of the shape of the nucleus as mature segmented neutrophils (56% of leukocytes) and immature band neutrophils (3% of leukocytes). Segmented neutrophils have at least two lobes separated by a thin filament, whereas band neutrophils have a nucleus of more uniform thickness. Neutrophils have two types of granules (specific and azurophilic) that contain lysosomal enzymes, peroxidase, collagenase, and other enzymes capable of digesting foreign material. In the presence of a chemotactic attractant, neutrophils approach foreign substances, such as bacteria, to phagocytose them within a phagocytic vacuole. By a process known as degranulation, granules merge with the vacuole and empty their contents into the vacuole. Bacteria are destroyed within the vacuole by the action of hydrogen peroxide (H2O2) and superoxide anion radical (O2−).
Eosinophils The granules of eosinophils contain major basic protein (MBP), which is toxic to parasites, as well as other enzymes. These cells are important in the response to parasites and viruses. Eosinophils also play a role in allergic reactions.
Basophils These cells, the least common granulocytes, are a major source of the cytokine IL-4, which in turn stimulates B lymphocytes to produce IgE antibodies. The granules—which nearly obscure the nucleus—contain histamine, heparin, and peroxidase. Like eosinophils, basophils also play a role in allergic reactions.
Lymphocytes Like the monocytes discussed next, lymphocytes do not have granules. Although they cannot be distinguished in a blood smear, lymphocytes come in different classes. The lymphocyte precursors originate in the bone marrow, where lineage commitment occurs.
T lymphocytes or T cells, which represent 70% to 80% of peripheral lymphocytes in blood, undergo maturation primarily in the thymus. T lymphocytes are responsible for cell-mediated immunity.
B lymphocytes or B cells, which represent 10% to 15% of peripheral lymphocytes in blood, undergo maturation in bone marrow and peripheral lymphoid tissue. When B cells interact with antigen in the presence of T cells and macrophages, B cells can transform into plasma cells, which abundantly make and secrete antibodies that are directed against specific antigens. Thus, B cells are responsible for humoral immunity.
The remaining lymphocytes in blood include a variety of classes, such as the natural killer cells.
Monocytes Because they migrate from the bone marrow to peripheral tissues, monocytes are not abundant in blood. Rather, monocytes spend most of their long life in peripheral tissues, where they develop into larger macrophages (20 to 40 μm in diameter). The macrophage (from the Greek macros [large] + phagein [eat]) serves two functions: (1) the phagocytosis of pathogens or cellular debris and (2) the presentation of antigens to lymphocytes.
Platelets form in the bone marrow by budding off from large cells called megakaryocytes, the maturation of which depends on TPO and IL-3. Each megakaryocyte can produce up to a few thousand platelets. Normal blood contains 150,000 to 450,000 platelets per microliter. A feedback mechanism operates between platelets and megakaryocytes, controlling platelet production. Platelets carry receptors for TPO that are able to bind and remove TPO from the plasma. Thus, a hypoplastic marrow generating few megakaryocytes leads to thrombocytopenia (platelet shortage) and thereby little removal of TPO, which in turn stimulates megakaryocyte production and corrects the lack of platelets. Conversely, a hyperplastic marrow creating many megakaryocytes leads to thrombocytosis (platelet excess) and thereby greater TPO removal, which ultimately turns off megakaryocyte production.
The life span of platelets is about 10 days. In their unactivated state, these nucleus-free fragments are disk shaped and 2 to 3 μm in diameter (Fig. 18-6). The external coat is rich in platelet receptors, which are glycoproteins. A circumferential band of microtubules composed of tubulin provides an inner skeleton. Actin and myosin contractile filaments are present in the platelet interior. In addition to mitochondria, lysosomes, and peroxisomes, platelets have two types of special organelles: α granules and, less abundantly, dense-core granules. The α granules store von Willebrand factor, platelet fibrinogen, and clotting factor V. The fibrinogen inside the platelets actually originates in the liver, which secretes it into the blood plasma, where megakaryocytes and platelets then endocytose the fibrinogen. The dense-core granules store ATP, ADP, serotonin, and Ca2+. As discussed later, platelets are essential for hemostasis.
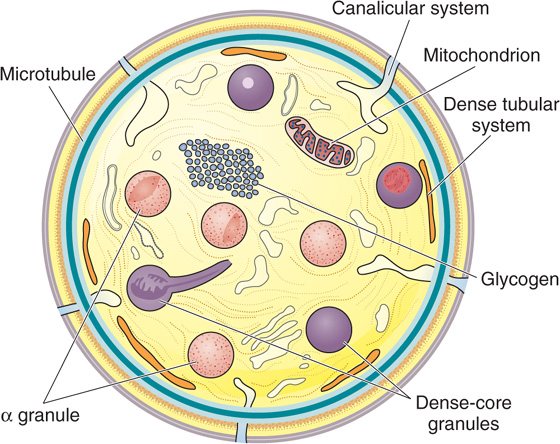
Figure 18-6 Discoid platelet. The surface-connected canalicular system is continuous with the endoplasmic reticulum. (Redrawn from White JG. In Bloom AL, Forbes CD, Thomas DP, Tuddenham EGD [eds]: Haemostasis and Thrombosis, 3rd ed. New York, Churchill Livingstone, 1994.)
Poiseuille’s equation (see Equation 17-9) is based on several important assumptions. In Chapter 17, we considered the first five, and here we consider the sixth, whether the viscosity of whole blood is constant in a newtonian sense.
Water and saline solutions are homogeneous or newtonian liquids. For these, the relationship between shear stress (force needed to move one lamina faster than its neighbor) and shear rate (velocity gradient between laminae) is linear and passes through the origin (Fig. 18-7, blue line). Viscosity (see Equation 17-12) is the slope of this line. The shear stress to shear rate relationship for a non-newtonian fluid, such as latex house paint, is nonlinear. Blood plasma (Fig. 18-7, yellow line) and serum are nearly newtonian. However, normal whole blood is non-newtonian; it has a nonlinear shear stress to shear rate relationship that intersects the y-axis above the origin (Fig. 18-7, red curve). In other words, one has to apply some threshold force (i.e., the yield shear stress) before the fluid will move at all. At lower forces, the fluid is immobile. However, at higher shear rates (such as those achieved physiologically after the velocity of blood flow has increased sufficiently), the relationship between shear stress and shear rate assumes the newtonian ideal, with a slope that corresponds to a viscosity of ~3.2 cP.
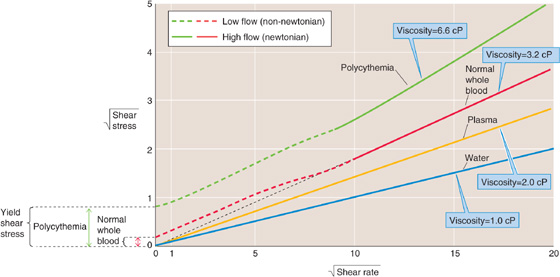
Figure 18-7 Anomalous viscosity of blood. To emphasize deviations from linearity, we plot the square roots of shear stress (Force/Area) and shear rate (Δv/Δx). cP, centipoise.
The concept of yield shear stress can best be understood by comparing two familiar viscous solutions: honey and mayonnaise. By estimating the effort needed to stir a pot of honey or a jar of mayonnaise with a spoon, one might assume that their apparent viscosity is the same because each solution offers about the same resistance to deformation. However, with use of a more modest deforming force, such as gravity, a striking difference between the two fluids emerges. As one removes the spoon from the pot of honey, gravity causes the honey to drip from the spoon in a continuous stream. In contrast, a glob of mayonnaise stays attached to the spoon. The velocity of the mayonnaise is zero because its yield shear stress is greater than the force of gravity. Honey is a newtonian fluid that behaves similarly at low and high forces of deformation. Mayonnaise is similar to blood in that its viscosity appears to be infinite at low forces of deformation.
In practice, the effective viscosity of whole blood depends on several physiological factors: (1) fibrinogen concentration, (2) hematocrit, (3) vessel radius, (4) linear velocity, and (5) temperature. As noted previously, the viscosity of whole blood in the linear (or newtonian) region of Figure 18-7 is ~3.2 cP, assuming a typical fibrinogen concentration of 260mg/dL, a hematocrit of 40%, and a temperature of 37°C. We will now see how each of these five factors influences the viscosity of blood.
Fibrinogen Fibrinogen, a major protein component of human plasma, is a key element in the coagulation cascade. The main reason for the non-newtonian behavior of blood is the interaction of this fibrinogen with RBCs. Thus, plasma (which contains fibrinogen but not RBCs) is newtonian, as is a suspension of washed RBCs in saline (without fibrinogen). However, the simultaneous presence of fibrinogen and blood cells causes the nonlinear behavior illustrated by the red curve in Figure 18-7. At normal hematocrits, fibrinogen and, perhaps, low-density lipoproteins (see Chapter 46), electrophoretically seen as β-lipoproteins, are the only plasma proteins capable of creating a yield shear stress.
At normal hematocrits, the absence of fibrinogen (in congenital afibrinogenemia) eliminates the yield shear stress altogether. Conversely, hyperfibrinogenemia elevates yield shear stress and, in the extreme, leads to a clustering of RBCs that increases their effective density. This increased effective density, in turn, causes the RBCs to settle toward the bottom of a vertical tube—easily measured as an increased erythrocyte sedimentation rate (see the box). Note that fibrinogen levels tend to increase with age and with smoking. (See Note: Effect of Fibrinogen on Blood Viscosity)
Erythrocyte Sedimentation Rate
Almost any acute stress to the body (trauma, infection, disease) induces a reaction called the acute-phase response. During the course of several hours, in response to inflammatory cytokines, the liver rapidly synthesizes and secretes into the circulatory system a number of proteins that aid in the host response to the threat. Among these proteins is fibrinogen, which causes RBCs to cluster and increases their effective density. When anticoagulated blood from a patient with hyperfibrinogenemia is placed in a glass tube, the RBCs fall more quickly under the influence of gravity than when the blood is from a healthy subject. After 1 hour, this sedimentation leaves a layer of clear plasma on the top of the tube (≤15 mm thick for normal blood and often >40 mm thick in certain inflammatory disorders). This rate of fall is called the erythrocyte sedimentation rate (ESR). Although it is nonspecific because so many different conditions can cause it to increase, the ESR is still widely used by clinicians to assess the presence and severity of inflammation. It is a simple technique, easily performed in a physician’s office. As an example of its utility, a patient with an inflammatory process that naturally waxes and wanes, such as lupus erythematosus, may present with nonspecific complaints such as fatigue, weakness, and achiness. An elevated ESR would suggest that these complaints are due to the reactivation of the disease and not just to a poor night’s sleep or depression.
Hematocrit Increases in hematocrit elevate blood viscosity by two mechanisms (Fig. 18-8); one prevails at physiological hematocrits, the other at higher hematocrits. Starting from values of 30%, raising of the hematocrit increases the interactions among RBCs—both directly and by proteins such as fibrinogen—and thereby increases viscosity. The reason is that forcing two RBCs more closely together at higher hematocrits makes them more likely to stick to each other. At hematocrits above 60%, the cells are so tightly packed that further increases lead to cell-cell interactions that increasingly deform the RBCs, thereby increasing viscosity. In patients with polycythemia, not only is viscosity high, but the yield stress can be more than 4-fold higher than normal (Fig. 18-7, green curve). Obviously, the combination of a high hematocrit and a high fibrinogen level can be expected to lead to extremely high viscosities.
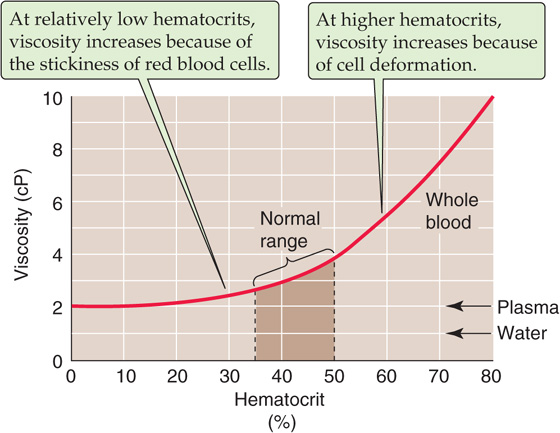
Figure 18-8 Dependence of viscosity on hematocrit.
Vessel Radius In reasonably large vessels (radius > ~1mm), blood viscosity is independent of vessel radius (Fig. 18-9). However, the viscosity decreases steeply at lower radii. This Fahraeus-Lindqvist phenomenon has four major causes.
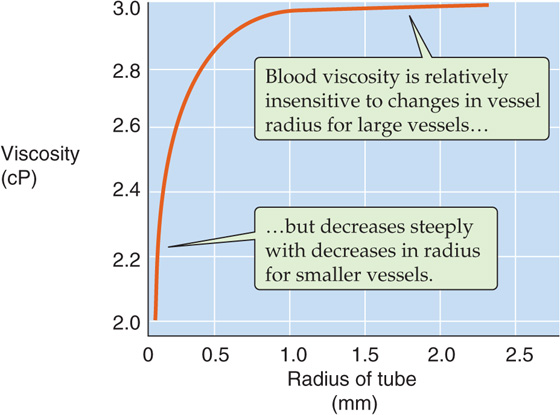
Figure 18-9 Dependence of viscosity on vessel radius.
Poiseuille observed not only that RBCs move faster in the center of an arteriole or venule than at the periphery but also that the concentration of RBCs is greater at the center. Indeed, very near the wall, he observed a “transparent space” occupied only by plasma (Fig. 18-10A). This axial accumulation of RBCs occurs because the plasma imparts a spin to an erythrocyte caught between two layers of plasma sliding past one another at different velocities (see Fig. 17-5B). This spin causes the cell to move toward the center of the vessel, much like a billiard ball curves when struck off center (Fig. 18-10A, inset of upper panel). One consequence of axial accumulation is that local viscosity is lowest in the cell-poor region near the vessel wall and greatest in the cell-enriched core. The net effect in smaller vessels is that the overall viscosity of the blood is decreased because the cell-poor plasma (low intrinsic viscosity) moves to the periphery where the shearing forces are the greatest, whereas the cell-enriched blood (high intrinsic viscosity) is left along the central axis where the shearing forces are least. A second consequence of axial accumulation is that branch vessels preferentially skim the plasma (plasma skimming) from the main stream of the parent vessel, leading to a lower hematocrit in branch vessels. However, some anatomical sites prevent skimming by means of an arterial cushion (Fig. 18-10A, lower panel).
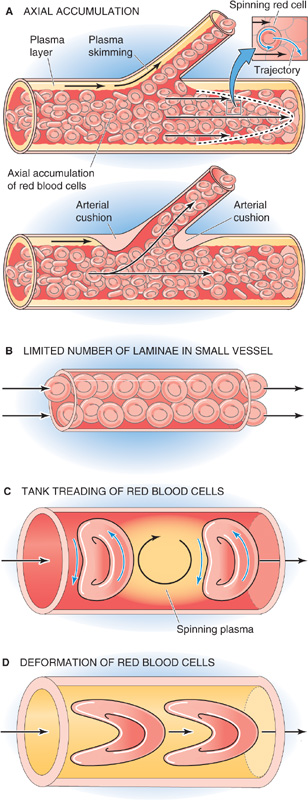
Figure 18-10 Flow of blood in small vessels.
Poiseuille’s equation does not hold in vessels small enough to hold only a few RBCs in their cross section. Hagen’s derivation of the equation assumes an infinite number of concentric laminae inside the vessel. In reality, a lamina can be no smaller than the thickness of an erythrocyte, thus severely limiting the number of laminae in small vessels (Fig. 18-10B). If we were to re-derive a Poiseuille-like equation to model a small vessel, it would predict a viscosity that is lower than that predicted by Poiseuille’s equation for a large vessel.
In vessels (e.g., capillaries) so small that their diameter is about the size of a single erythrocyte, we can no longer speak of the friction between concentric laminae. Instead, in small capillaries, the membrane of the RBC rolls around the cytoplasm in a movement called tank treading, similar to that of the track of a bulldozer (Fig. 18-10C). As two treading erythrocytes shoot down a capillary, they spin the bolus of plasma trapped between them (bolus flow).
In vessels smaller than an erythrocyte, highly deformed—literally bullet-shaped—RBCs squeeze through the capillaries, making the effective viscosity fall even farther below that of the bulk solution (Fig. 18-10D). Under these conditions, a layer of plasma separates the erythrocytes from the capillary wall. The cells automatically “focus” themselves to the centerline of the capillary and maintain a fixed distance between two successive cells.
Velocity of Flow As for an ideal fluid (see Fig. 17-6A), the dependence of flow on pressure is linear for blood plasma (Fig. 18-11, gold curve). However, for whole blood, the pressure-flow relationship deviates slightly from linearity at velocities close to zero, and the situation is even worse for polycythemia. These deviations at very low flows have two explanations. First, at low flows, the shear rate is also low, causing the whole blood (like mayonnaise) to behave in a non-newtonian manner (Fig. 18-7) and to have a high apparent viscosity. In fact, as was already seen, one must apply a threshold force to get the blood to move at all. Thus, the red and green curves in Figure 18-11 have shallower slopes at low flows than at high flows. The second reason for the nonlinear pressure-flow relationship is that the tendency for RBCs to move to the center of the stream—thereby lowering viscosity—requires a modest flow. After this axial accumulation “saturates,” however, the relationship becomes linear.
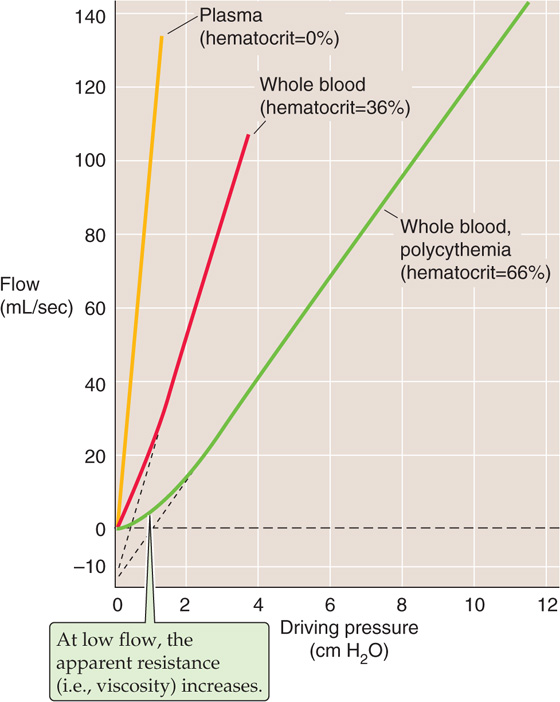
Figure 18-11 Pressure-flow relationships over a range of hematocrits. The slope of the linear portion of each curve is 1/resistance; resistance (or viscosity) increases from plasma to normal whole blood to polycythemic blood.
Temperature Cooling normal whole blood from 37°C to 0°C increases its viscosity ~2.5-fold. However, physiologically, this effect is negligible in humans except during intense cooling of the extremities. On the other hand, in some patients, the presence of cryoglobulins in the blood can cause an abnormal rise in viscosity even with less intense cooling of limbs. Cryoglobulins are immunoglobulins that precipitate at a temperature that is less than 37°C but can partially resolubilize on warming. Different cryoglobulins are associated with infections, particularly hepatitis C, as well as with several autoimmune and lymphoproliferative disorders. High blood viscosity from the precipitated cryoglobulins can lead to vessel obstruction and local thrombosis.
We have already noted that two essential requirements of the circulatory system are that the blood must be a liquid and that it cannot leak through the walls of the blood vessels. Meeting these two requirements is the job of the fibrinolytic and hemostatic machinery. Blood is normally in a liquid state inside blood vessels because it does not come into contact with negatively charged surfaces (e.g., the collagen beneath endothelial cells) that activate an intrinsic coagulation pathway, nor does it contact tissue factors (e.g., released from damaged tissue) that activate an extrinsic pathway. Furthermore, thrombolytic pathways keep the coagulation pathways in check. Indeed, plasma contains proteins that can be converted to proteases that digest fibrin and thereby lyse blood clots.
Hemostasis (from the Greek hemos [blood] + stasis [standing]), or the prevention of hemorrhage, can be achieved by four methods: (1) vasoconstriction, (2) increased tissue pressure, (3) formation of a platelet plug in the case of capillary bleeding, and (4) coagulation or clot formation.
Vasoconstriction contributes to hemostasis because it raises the critical closing pressure—as we discuss in Chapter 19—and thus collapses vessels that have an intravascular pressure below the critical closing pressure. Vessel constriction is also promoted by chemical byproducts of platelet plug formation and of coagulation. For example, activated platelets release the vasoconstrictors thromboxane A2 (see Chapter 3) and serotonin (see Chapter 13). Moreover, thrombin, a major product of the clotting machinery, triggers the endothelium to generate endothelin 1 (see Chapter 20), the most powerful physiological vasoconstrictor.
Increased tissue pressure contributes to hemostasis because it decreases transmural pressure (see Chapter 17), which is the difference between intravascular pressure and tissue pressure. Transmural pressure is the main determinant of blood vessel radius. Given the fourth-power relationship between flow and blood vessel radius (see Chapter 17), an increase in tissue pressure that causes radius to decrease by a factor of 2 would diminish flow by a factor of 16. We all take advantage of this principle when we press a finger against a small cut to stop the bleeding. A tourniquet increases extravascular pressure and can thus halt an arterial hemorrhage in a limb. Finally, surgeons routinely make use of this principle when applying hemostatic clamps to close off “bleeders.”
In this section, we discuss the third and fourth methods of hemostasis, platelet plug formation and coagulation.
In a highly controlled fashion, platelets plug small breaches in the vascular endothelium. Plug formation is a process that includes adhesion, activation, and aggregation.
Adhesion Platelets normally do not adhere to themselves, to other blood cells, or to endothelial membranes. One preventive factor may be the negative surface charge on both platelets and endothelial cells. In the case of endothelial cells, the negative surface charge reflects the presence of proteoglycans, mainly heparan sulfate. Platelet adhesion occurs in response to an increase in the shearing force (see Chapter 17) at the surface of platelets or endothelial cells and in response to vessel injury or humoral signals.
Platelet adhesion—the binding of platelets to themselves or to other components—is mediated by platelet receptors, which are glycoproteins in the platelet membrane. These platelet receptors are integral membrane proteins belonging to a class of matrix receptors known as integrins (see Chapter 2). They are usually heterodimers linked by disulfide bonds. One ligand naturally present in the blood plasma is von Willebrand factor (vWF), a glycoprotein made by endothelial cells and megakaryocytes. vWF is found in Weibel-Palade bodies of the endothelial cells and in α granules of platelets. High shear, certain cytokines, and hypoxia all trigger the release of vWF from endothelial cells. vWF binds to the platelet receptor known as glycoprotein Ib/Ia (Gp Ib/Ia), which is a dimer of Gp Ib linked to Gp Ia. (See Note: von Willebrand’s Disease)
A breach of the endothelium exposes platelet receptors to ligands that are components of the subendothelial matrix. These ligands include collagen, which binds to Gp Ia/IIa, and fibronectin and laminin (see Chapter 2), both of which bind to Gp Ic/IIa.
Activation The binding of these ligands—or of certain other agents (e.g., thrombin) that we will discuss later—triggers a conformational change in the platelet receptors that initiates an intracellular signaling cascade, which leads to an exocytotic event known as the release reaction or platelet activation. The signal transduction cascade involves the activation of phospholipase C (see Chapter 3) and an influx of Ca2+. Activated platelets exocytose the contents of their dense storage granules, which include ATP, ADP, serotonin, and Ca2+. Activated platelets also exocytose the contents of their α granules, which contain several proteins, including a host of growth factors and three hemostatic factors: vWF (see earlier) and two clotting factors that we will discuss later, clotting factor V and fibrinogen. Activated platelets also use cyclooxygenase (see Chapter 3) to initiate the breakdown of arachidonic acid to thromboxane A2, which they release. Platelet activation is also associated with marked cytoskeletal and morphological changes as the platelet extends first a broad lamellipodium and then many finger-like filopodia.
Aggregation Signaling molecules released by activated platelets amplify the platelet activation response. ADP (which binds to P2Y12 receptors on platelets), serotonin, and thromboxane A2 all activate additional platelets, and this recruitment promotes platelet aggregation. Aspirin, an inhibitor of cyclooxygenase, inhibits clotting by reducing the release of thromboxane A2. Another antiplatelet agent—clopidogrel—acts by inhibiting the P2Y12 receptors on the platelet surface. As noted before, vWF released by activated platelets binds to the platelet receptor Gp Ib/Ia, thereby activating even more platelets and forming molecular bridges between platelets. Platelet activation also induces a conformational change in Gp IIb/IIIa, another platelet receptor, endowing it with the capacity to bind fibrinogen. Thus, as a result of the conformational change in Gp IIb/IIIa, the fibrinogen that is always present in blood forms bridges between platelets and thus participates in the formation of a platelet plug. As we will see later, when it is cleaved by thrombin, fibrinogen also plays a critical role in clotting.
A blood clot is a semisolid mass composed of both platelets and fibrin and—entrapped in the mesh of fibrin—erythrocytes, leukocytes, and serum. A thrombus is also a blood clot, but the term is usually reserved for an intravascular clot. Thus, the blood clot formed at the site of a skin wound would usually not be called a thrombus. The relative composition of thrombi varies with the site of thrombosis (i.e., thrombus formation). A higher proportion of platelets is present in clots of the arterial circulation, whereas a higher proportion of fibrin is present in clots of the venous circulation.
Platelet plug formation and blood clotting are related but distinct events that may occur in parallel or in the absence of the other. As we will see later, activated platelets can release small amounts of some of the factors (e.g., Ca2+) that play a role in blood clotting. Conversely, as we have already noted, some clotting factors (e.g., thrombin and fibrinogen) play a role in platelet plug formation. Thus, molecular crosstalk between the machinery involved in platelet plug formation and clot formation helps coordinate hemostasis.
The cardiovascular system normally maintains a precarious balance between two pathological states. On the one hand, inadequate clotting would lead to the leakage of blood from the vascular system and, ultimately, to hypovolemia. On the other hand, overactive clotting would lead to thrombosis and, ultimately, to cessation of blood flow. The cardiovascular system achieves this balance between an antithrombotic (anticoagulant) and a prothrombotic (procoagulant) state by a variety of components of the vascular wall and blood. Promoting an antithrombotic state is a normal layer of endothelial cells, which line all luminal surfaces of the vascular system. Promoting a prothrombotic state are events associated with vascular damage: (1) the failure of endothelial cells to produce the proper antithrombotic factors and (2) the physical removal or injury of endothelial cells, which permits the blood to come into contact with thrombogenic factors that lie beneath the endothelium. Also promoting a prothrombotic state is the activation of platelets by any of the ligands that bind to platelet receptors, as discussed earlier. For instance, as platelets flow past artificial mechanical heart valves, the shearing forces can activate the platelets.
According to the classical view, two distinct sequences can precipitate coagulation: the intrinsic pathway and the extrinsic pathway. It is the intrinsic pathway that becomes activated when blood comes into contact with a negatively charged surface—in the laboratory, we can mimic this process by putting blood into a glass test tube. The extrinsic pathway is activated when blood comes in contact with material from damaged cell membranes. In both cases, the precipitating event triggers a chain reaction that converts precursors into activated factors, which in turn catalyze the conversion of other precursors into other activated factors, and so on. Most of these “precursors” are zymogens that give rise to “activated factors” that are serine proteases. Thus, controlled proteolysis plays a central role in amplifying the clotting signals. However, the cascades do not occur in the fluid phase of the blood, where the concentration of each of these factors is low. In the case of the intrinsic pathway, the chain reaction occurs mainly at the membrane of activated platelets. In the case of the extrinsic pathway, the reactions occur mainly at a “tissue factor” that is membrane bound. Both pathways converge on a common pathway that culminates in generation of thrombin and, ultimately, “stable” fibrin. Table 18-4 summarizes the names, synonyms, and properties of the procoagulant and anticoagulant factors in various parts of the clotting scheme.
Table 18-4 Procoagulant and Anticoagulant Factors
Name |
Alternate Names |
Properties |
Procoagulant Factors |
||
Factor I |
Fibrinogen |
A plasma globulin |
Factor Ia |
Fibrin |
|
Factor II |
Prothrombin |
A plasma α2-globulin |
|
|
Synthesis in liver requires vitamin K* |
Factor IIa |
Thrombin |
A serine protease |
Factor III (cofactor) |
Tissue factor |
An integral membrane glycoprotein; member of type II cytokine receptor family |
|
|
Receptor for factor VIIa |
|
|
Must be present in a phospholipid membrane for procoagulant activity |
Factor IV |
Ca2+ |
|
Factor V |
Labile factor |
A plasma protein synthesized by liver and stored in platelets |
|
Accelerator globulin |
Single-chain protein |
Factor Va (cofactor) |
|
Heterodimer held together by a single Ca2+ ion |
|
|
Highly homologous to factor VIIIa |
Factor VII |
Stable factor |
A plasma protein |
|
Serum prothrombin conversion accelerator (SPCA) |
Synthesis in liver requires vitamin K* |
Factor VIIa |
|
A serine protease |
Factor VIII |
Antihemophilic factor (AHF) |
A plasma protein with phospholipid binding domain |
|
Factor VIII procoagulant component (FVIII:C) |
|
Factor VIIIa (cofactor) |
|
Highly homologous to factor Va |
Factor IX |
Christmas factor |
A plasma protein |
|
Plasma thromboplastin component (PTC) |
Synthesis in liver requires vitamin K* |
Factor IXa |
|
A protease |
|
|
Disulfide-linked heterodimer |
Factor X |
Stuart factor |
A plasma glycoprotein |
|
|
Synthesis in liver requires vitamin K* |
Factor Xa |
|
A protease |
Factor XI |
Plasma thromboplastin antecedent (PTA) |
A plasma protein produced by megakaryocytes and stored in platelets |
Factor XIa |
|
A protease |
|
|
Disulfide-linked homodimer |
Factor XII |
Hageman factor (HAF) |
A plasma glycoprotein |
Factor XIIa |
|
A protease |
Factor XIII |
Fibrin stabilizing factor (FSF) |
A plasma protein stored in platelets |
Factor XIIIa |
|
A transglutaminase |
|
|
A tetramer of two A chains and two B chains |
HMWK |
High-molecular-weight kininogen |
A plasma protein stored in platelets |
|
Fitzgerald factor |
Kallikrein clips bradykinin from HMWK |
Plasma prekallikrein |
Fletcher factor |
A plasma protein |
|
Plasma kallikrein precursor |
|
Plasma kallikrein |
|
A serine protease |
|
|
Kallikrein clips bradykinin from HMWK |
von Willebrand factor |
vWf |
A plasma glycoprotein made by endothelial cells and megakaryocytes |
|
|
Stabilizes factor VIIIa |
|
|
Promotes platelet adhesion and aggregation |
Anticoagulant Factors |
|
|
TFPI |
Tissue factor pathway inhibitor |
Protease inhibitor produced by endothelial cells |
|
|
GPI linked to the cell membrane |
Antithrombin III |
AT III |
A plasma protein |
|
|
Serine protease inhibitor, member of serpin family |
|
|
Inhibits factor Xa and thrombin, and probably also factors XIIa, XIa, and IXa |
|
|
Heparan and heparin enhance the inhibitory action |
Thrombomodulin (cofactor) |
|
Glycosaminoglycan on surface of endothelial cell |
|
|
Binds thrombin and promotes activation of protein C |
Protein C |
Anticoagulant protein C |
A plasma protein |
|
Autoprothrombin IIA |
Synthesis in liver requires vitamin K* |
Protein Ca |
|
A serine protease |
|
|
Disulfide-linked heterodimer |
Protein S (cofactor) |
|
A plasma protein |
|
|
Synthesis in liver requires vitamin K* |
|
|
Cofactor for protein C |
*See Chapter 58 for a discussion of vitamin K.
The proteins of the coagulation cascade have a distinct domain structure, including a signal peptide, a propeptide, an EGF-like domain, a kringle domain, and a catalytic domain, whereas some other domains are variable among these proteins. The signal peptide domain is required for the translocation of the polypeptide into the endoplasmic reticulum, where the signal peptide is cleaved. The propeptide or γ-carboxyglutamic acid–rich domain (Gla domain) is rich in glutamic acid residues that undergo γ-carboxylation under the influence of the γ-carboxylase that is vitamin K dependent. The presence of these γ-carboxyglutamic acid residues is required for Ca2+ binding. The epidermal growth factor–like (EGF-like) domain may appear multiple times and play a role in forming protein complexes. The kringle domain is a loop structure created by several disulfide bonds that also play a role in forming protein complexes and attaching the protease to its target. The catalytic domain confers the serine protease function to the coagulation proteins and is homologous to trypsin, chymotrypsin, and other serine proteases.
Intrinsic Pathway (Surface Contact Activation) The left branch of Figure 18-12 shows the intrinsic pathway, a cascade of protease reactions initiated by factors that are all present within blood. When it is in contact with a negatively charged surface such as glass or the membrane of an activated platelet, a plasma protein called factor XII (Hageman factor) can become factor XIIa—the suffix -a indicates that this is the activated form of factor XII. A molecule called high-molecular-weight kininogen (HMWK), a product of platelets that may in fact be attached to the platelet membrane, helps anchor factor XII to the charged surface and thus serves as a cofactor. However, this HMWK-assisted conversion of factor XII to factor XIIa is limited in speed. Once a small amount of factor XIIa accumulates, this protease converts prekallikrein to kallikrein, with HMWK as an anchor. In turn, the newly produced kallikrein accelerates the conversion of factor XII to factor XIIa—an example of positive feedback. In Chapter 23, we see another example of an interaction between kallikreins and kininogens (e.g., HMWK), in which the proteolytic activity of kallikreins on kininogens leads to the release of small vasodilatory peptides called kinins.
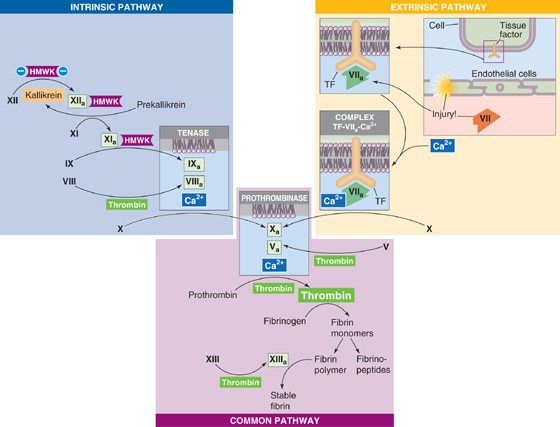
Figure 18-12 The coagulation cascade, showing only the procoagulant factors.
In addition to amplifying its own generation by forming kallikrein, factor XIIa (together with HMWK) also proteolytically cleaves factor XI to factor XIa. In turn, factor XIa (also bound to the charged surface by HMWK) proteolytically cleaves factor IX (Christmas factor) to factor IXa, which is a protease. Factor IXa and two downstream products of the cascade—factors Xa and, most important, thrombin—proteolytically cleave factor VIII to factor VIIIa, a cofactor in the next reaction. Finally, factors IXa and VIIIa together with Ca2+ (which may come largely from activated platelets) and negatively charged phospholipids form a trimolecular complex called tenase. Tenase then converts factor X (Stuart factor) to factor Xa, yet another protease.
Extrinsic Pathway (Tissue Factor Activation) The right branch of Figure 18-12 shows the extrinsic pathway, a cascade of protease reactions initiated by factors that are outside the vascular system. Nonvascular cells constitutively express an integral membrane protein called tissue factor (tissue thromboplastin, or factor III), which is a receptor for a plasma protein called factor VII. When an injury to the endothelium allows factor VII to come into contact with tissue factor, the tissue factor nonproteolytically activates factor VII to factor VIIa. Subsequently, tissue factor, factor VIIa, and Ca2+ form a trimolecular complex analogous to tenase. Like tenase, the trimolecular complex of [tissue factor + factor VIIa + Ca2+] proteolytically cleaves the proenzyme factor X to factor Xa. An interesting feature is that when factor X binds to the trimolecular complex, factor VIIa undergoes a conformational change that prevents it from dissociating from tissue factor.
Regardless of whether factor Xa arises by the intrinsic or extrinsic pathway, the cascade proceeds along the common pathway.
Common Pathway Factor Xa from either the intrinsic or extrinsic pathway is the first protease of the common pathway (center of Fig. 18-12). Reminiscent of the conversion of factor VIII to the cofactor VIIIa in the intrinsic pathway, the downstream product thrombin clips factor V to form the cofactor Va. Factor V is highly homologous to factor VIII, and in both cases, the proteolytic activation clips a single protein into two peptides that remain attached to one another. Factors Xa and Va, together with Ca2+ and phospholipids, form yet another trimolecular complex called prothrombinase. Prothrombinase acts on a plasma protein called prothrombin to form thrombin.
Thrombin is the central protease of the coagulation cascade, responsible for three major kinds of actions:
1. Activation of downstream components in the clotting cascade. The main action of thrombin is to catalyze the proteolysis of fibrinogen by cleaving the Aα chain, releasing fibrinopeptide A, and cleaving the Bβ chain, releasing fibrinopeptide B. The release of the fibrinopeptide results in the formation of fibrin monomers that are still soluble. Fibrin monomers now composed of α, β, and γ chains then spontaneously polymerize to form a gel of fibrin polymers that traps blood cells. Thrombin also activates factor XIII to factor XIIIa, which mediates the covalent cross-linking of the α and γ chains of fibrin polymers to form a mesh called stable fibrin that is even less soluble than fibrin polymers.
2. Positive feedback at several upstream levels of the cascade. Thrombin can catalyze the formation of new thrombin from prothrombin and can also catalyze the formation of the cofactors Va and VIIIa.
3. Paracrine actions that influence hemostasis. First, thrombin causes endothelial cells to release nitric oxide, PGI2, ADP, vWF, and tissue plasminogen activator (see later). Second, thrombin can activate platelets through PAR-1, a protease-activated receptor that belongs to the family of G protein–coupled receptors (see Chapter 3). Thus, thrombin is a key part of the molecular crosstalk introduced earlier between platelet activation and blood clotting, both of which are required for optimal clot formation. On the one hand, thrombin is a strong catalyst for platelet activation, and on the other hand, activated platelets offer the optimal surface for the intrinsic pathway leading to additional thrombin generation.
Coagulation as a Connected Diagram The concept of independent intrinsic and extrinsic branches converging on a common pathway is becoming obsolete. In such a “branching tree” (see Chapter 25), multiple branches converge to form larger downstream branches, eventually converging on a single “trunk”—with no crosstalk between branches. However, coagulation is best conceptualized as a “connected diagram” (see Chapter 25) in which the branches may interconnect in both the upstream and downstream directions. One example of interconnections is thrombin’s multiple actions just discussed. Another example is the trimolecular complex of [tissue factor + factor VIIa + Ca2+] of the extrinsic pathway, which activates factors IX and XI of the intrinsic pathway. In the other direction, factors IXa and Xa of the intrinsic pathway can activate factor VII of the extrinsic pathway. Thus, the intrinsic pathway and extrinsic pathway are strongly interconnected to form a network.
What parts of this network are most important for coagulation in vivo? Clinical evidence suggests that coagulation depends largely on the extrinsic pathway. Although tissue factor is normally absent from intravascular cells, inflammation can trigger peripheral blood monocytes and endothelial cells to express tissue factor, increasing the risk of coagulation. Indeed, during sepsis, the tissue factor produced by circulating monocytes initiates intravascular thrombosis. (See Note: Hemophilias)
Thus far, our discussion has focused on the coagulation cascade and attendant positive feedback. Just as important are the mechanisms that prevent hemostasis from running out of control. Endothelial cells are the main sources of the agents that help maintain normal blood fluidity. These agents are of two general types, paracrine factors and anticoagulant factors.
Paracrine Factors Endothelial cells generate prostacyclin (PGI2; see Chapter 3), which promotes vasodilation (see Chapter 20) and thus blood flow and also inhibits platelet activation and thus clotting. Stimulated by thrombin, endothelial cells also produce nitric oxide (see Chapter 3). Through cGMP, nitric oxide inhibits platelet adhesion and aggregation.
Anticoagulant Factors As summarized in Figure 18-13, endothelial cells also generate anticoagulant factors that interfere with the clotting cascade that generates fibrin. Table 18-4 lists these factors.
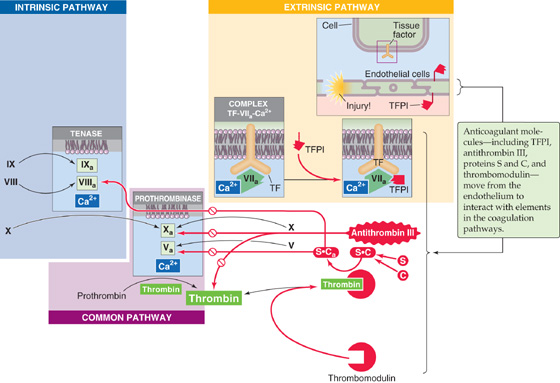
Figure 18-13 An abbreviated version of the coagulation cascade, showing the anticoagulant factors. The anticoagulant pathways are indicated in red.
1. Tissue factor pathway inhibitor (TFPI). TFPI is a plasma protein that binds to the trimolecular complex [tissue factor + factor VIIa + Ca2+] in the extrinsic pathway and blocks the protease activity of factor VIIa. TFPI is GPI linked (see Chapter 2) to the endothelial cell membrane, where it maintains an antithrombotic surface.
2. Antithrombin III (AT III). AT III binds to and inhibits factor Xa and thrombin. The sulfated glycosaminoglycans (see Chapter 2) heparan sulfate and heparin enhance the binding of AT III to factor Xa or to thrombin, thus inhibiting coagulation. Heparan sulfate is present on the external surface of most cells, including endothelial surfaces. Mast cells and basophils release heparin.
3. Thrombomodulin. A glycosaminoglycan product of endothelial cells, thrombomodulin can form a complex with thrombin, thereby removing thrombin from the circulation and inhibiting coagulation. In addition, thrombomodulin also binds protein C.
4. Protein C. After protein C binds to the thrombomodulin portion of the thrombin-thrombomodulin complex, the thrombin activates protein C. Activated protein C (Ca) is a protease. Together with its cofactor protein S, Ca inactivates the cofactors Va and VIIIa, thus inhibiting coagulation.
5. Protein S. This is the cofactor of protein C and is thus an anticoagulant.
Finally, clearance of activated clotting factors by the Kuppfer cells of the liver also keeps hemostasis under control.
As noted earlier, cross-linked stable fibrin traps red and white blood cells as well as platelets in a freshly formed thrombus. Through the interaction of actin and myosin in the platelets, the clot shrinks to a plug and thereby expels serum. After plug formation, fibrinolysis—the breakdown of stable fibrin—breaks up the clot in a more general process known as thrombolysis. As shown in Figure 18-14, the process of fibrinolysis begins with the conversion of plasminogen to plasmin, catalyzed by one of two activators: tissue-type plasminogen activator or urokinase-type plasminogen activator. Table 18-5 summarizes the properties of fibrinolytic factors.
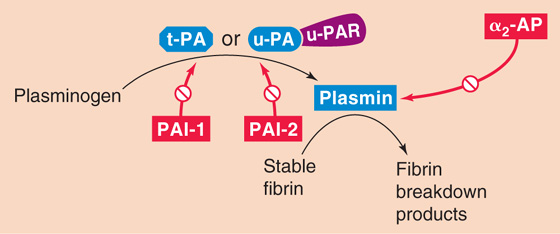
Figure 18-14 The fibrinolytic cascade.
Table 18-5 Fibrinolytic Factors
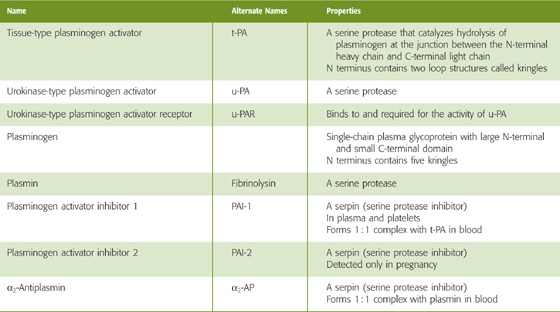
The source of tissue plasminogen activator (t-PA), a serine protease, is endothelial cells. t-PA consists of a single peptide chain with two kringles at the N-terminal portion of the molecule and a protease motif in the C-terminal portion. Kringles are loop structures created by three disulfide bonds and serve to anchor the molecule to its substrate. t-PA converts the plasma zymogen plasminogen to the active fibrinolytic protease plasmin. The presence of fibrin greatly accelerates the conversion of plasminogen to plasmin.
Besides t-PA, the other plasminogen activator, urokinase-type plasminogen activator (u-PA), is present in plasma either as a single-chain protein or as the two-chain product of a proteolytic cleavage. Like t-PA, u-PA converts plasminogen to the active protease plasmin. However, this proteolysis requires that u-PA attach to a receptor on the cell surface called urokinase plasminogen activator receptor (u-PAR).
Plasminogen, mainly made by the liver, is a large, single-chain glycoprotein that is composed of an N-terminal heavy chain (A chain) and a C-terminal light chain (B chain). The N-terminal heavy chain contains five kringles, and the C-terminal light chain contains the protease domain. t-PA cleaves plasminogen at the junction between the heavy and light chains, yielding plasmin. However, the two chains in plasmin remain connected by disulfide bonds.
Plasmin is a serine protease that can break down both fibrin and fibrinogen. The five kringles of the heavy chain of plasminogen are still present in plasmin. These anchors attach to lysine residues on fibrin, holding the protease portion of the molecule in place to promote hydrolysis. Plasmin proteolytically cleaves stable fibrin to fibrin breakdown products. Plasmin can also cleave t-PA between the kringle and protease motifis of t-PA. The C terminus of single-chain t-PA nonetheless retains its protease activity.
The cardiovascular system regulates fibrinolysis at several levels, using both enhancing and inhibitory mechanisms. Catecholamines and bradykinin increase the levels of circulating t-PA. Two serine p rotease in hibitors (serpins) reduce the activity of the plasminogen activators: plasminogen activator inhibitor 1 (PAI-1) and plasminogen activator inhibitor 2 (PAI-2). PAI-1 complexes with and inhibits both single-chain and two-chain t-PA as well as u-PA. PAI-1 is produced mainly by endothelial cells. PAI-2 mainly inhibits u-PA. PAI-2 is important only in pregnancy as it is produced by the placenta and may contribute to increased risk of thrombosis in pregnancy.
It is of interest that activated protein C, which inhibits coagulation as shown in Figure 18-13, also inhibits PAI-1 and PAI-2, thereby facilitating fibrinolysis. Only one serpin targets plasmin, α2-antiplasmin (α2-AP) made by liver, kidney, and other tissues. When plasmin is not bound to fibrin (i.e., when the plasmin is in free solution), α2-AP complexes with and thereby readily inactivates plasmin. However, when plasmin is attached to lysine residues on fibrin, the inhibition by α2-AP is greatly reduced. In other words, the very presence of a clot (i.e., fibrin) promotes the breakdown of the clot (i.e., fibrinolysis).
Books and Reviews
Abrams CS: Intracellular signaling in platelets. Curr Opin Hematol 2005; 12:401-405.
Haynes RH: Physical basis of the dependence of blood viscosity on tube radius. Am J Physiol 1960; 198:1193-1200.
Maeda N, Shiga T: Velocity of oxygen transfer and erythrocyte rheology. News Physiol Sci 1994; 9:22-27.
Monroe DM, Hoffman M: What does it take to make the perfect clot? Arterioscler Thromb Vasc Biol 2006; 26:41-48.
Weisel JW: Fibrinogen and fibrin. Adv Protein Chem 2005; 70:247-299.
Journal Articles
Bishop JJ, Nance PR, Popel AS, et al: Effect of erythrocyte aggregation on velocity profiles in venules. Am J Physiol Heart Circ Physiol 2001; 280:H222-H236.
Cinar Y, Senyol AM, Duman K: Blood viscosity and blood pressure: Role of temperature and hyperglycemia. Am J Hypertens 2001; 14:433-438.
Fähraeus R, Lindqvist T: The viscosity of the blood in narrow capillary tubes. Am J Physiol 1931; 96:562-568.
Pennica D, Holmes WE, Kohr WJ, et al: Cloning and expression of human tissue-type plasminogen activator cDNA in E. coli. Nature 1983; 301:214-221.
Pietrangelo A, Panduro A, Chowdhury JR, Shafritz DA: Albumin gene expression is down-regulated by albumin or macromolecule infusion in the rat. J Clin Invest 1992; 89:1755-1760.