Integration Of Metabolism
Anabolic and catabolic pathways for all major biomolecules such as carbohydrates, lipids and proteins are intricately linked and well coordinated. There are several crossroads among metabolic pathways, which help in the flow of key metabolites. While metabolic pathways of biomolecules are already discussed in previous chapters (9 to 13), this chapter deals with the metabolic interrelationships and the flow of metabolites from one pathway to another. These aspects are described under three metabolic states: fed state (high insulin : glucagon ratio), starvation and diabetes (low insulin: glucagon ratio). A special emphasis is given on the role of hormones in regulating metabolic activities as per the cellular requirements.
After going through this chapter, the student should be able to understand:
Regulation of mainline metabolic pathways by hormones.
Metabolic interconnections and tissue specific metabolism.
Metabolic adaptations to effect variations in fuel metabolism in short-span fasting, prolonged fasting and starvation.
Diabetes mellitus: metabolic alterations, biochemical basis of diabetic ketoacidosis and chronic complications of diabetes.
Metabolism of xenobiotics: reactions and role of P-450 cytochromes.
I Hormonal Regulation of Major Metabolic Pathways
Insulin is the principal hormone which plays important role in regulation of various metabolic pathways. Glucagon, epinephrine, and the glucocorticoids are the other hormones which help in the integration of metabolic processes.
A Insulin
Effect of insulin reaches peak in the fed state when blood glucose and serum insulin levels are high and glucagon levels are low. The high insulin : glucagon ratio is responsible for various metabolic adaptations that occur in the fed state. The major events in liver, skeletal muscles, adipose tissue, erythrocytes and other tissues have been depicted in Figure 15.1 .
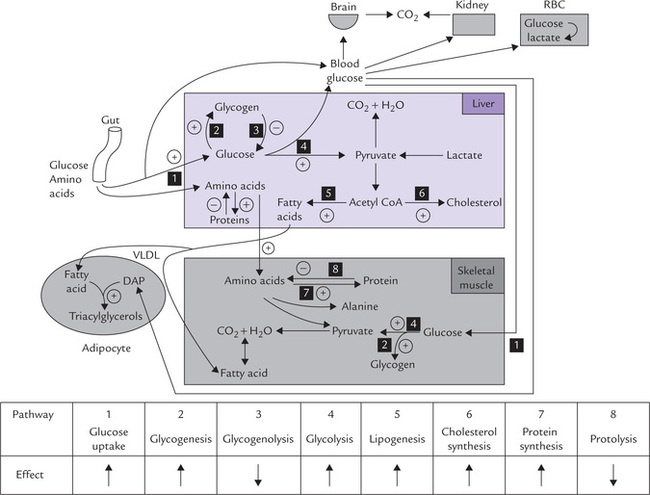
Fig. 15.1 Metabolic adaptations in fed state brought about by insulin (actually, high insulin: glucagon ratio) (DAP = dihydroxy-acetone phosphate, VLDL = very low density lipoprotein. ↑ = stimulates; ↓ = inhibits).
Insulin enhances uptake of glucose by peripheral tissues including skeletal muscles, by promoting carrier-mediated transport. Intracellularly, the glucose is channeled into glycogenesis because insulin-initiated cascade activates glycogen synthase by promoting conversion of the phosphorylated form of the enzyme to the dephosphor-ylated form. The same mechanism causes negative modulation of activity of glycogen phosphorylase, resulting in a concomitant inhibition of glycogenolysis. Insulin increases the transcription of glucokinase gene which, in turn causes increase in glycogen synthesis in liver. Glycolysis is also stimulated due to activation of the key regulatory enzymes of this pathway (e.g. phosphofructokinase-1, pyruvate kinase) by insulin.
Normally the glycolytic sequence is followed by the action of pyruvate dehydrogenase (PDH) which yields acetyl CoA: the latter serves as substrate for lipids in the adipose and other tissues. Insulin enhances the activity of PDH, thus causing an increase in the production of ace-tyl CoA. Moreover, insulin influences various intercellular events which divert the excessive acetyl CoA into lipid synthesis, especially in adipocytes (Chapter 11). Activity of HMG CoA reductase, the principal enzyme of cholesterol biosynthesis, is also enhanced by insulin, therefore causing an increase in the rate of cholesterol biosynthesis (Fig. 15.1).
Insulin increases the protein synthesis and inhibits proteolysis. The action is exerted at different sites:
• Uptake of amino acids by tissues is promoted by insulin that facilitates the transport across the plasma membrane.
• Insulin enhances transcription, which is followed by increased translation.
• Increased synthesis of amino acyl-tRNA accounts for increased translation.
In muscles, insulin causes an increase in the number of ribosomes as well as their translational efficiency.
Synthesis of some proteins such as glucokinase is specially stimulated by insulin.
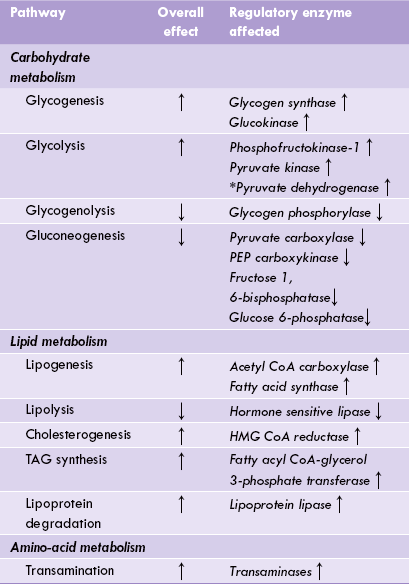
Insulin influences activities of a number of other enzymes as well, which results in inhibition of gluconeo-genesis, lipolysis and glycogenolysis (Table 15.1 ).
B Glucagon
Decreased blood glucose concentration is a potent stimulus for glucagon release from α-cells of pancreas. The major target for glucagon is liver; it is not able to act on the muscles because the muscle cells lack glucagon receptors. Glucagon stimulates glycogenolysis and inhibits glycogenesis in liver (Table 15.2 ). This is because gluca-gon converts the regulatory enzymes of these pathways from dephosphorylated form to phosphorylated form; these effects are mediated via cAMP (Chapter 9). Net result is increased production of glucose 6-phosphate which is converted to glucose (by glucose 6-phosphatase) and released into blood circulation.
Table 15.2
Effects of hormones on intermediary metabolic pathways
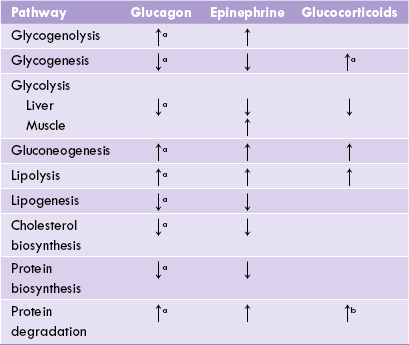
aAction in liver, baction only in muscles, ↑ = stimulates, ↓ = inhibits.
Triacylglycerol degradation (Lipolysis) is enhanced by glucagon because of the stimulation of activity of hormone sensitive lipase. This provides fatty acid substrate molecules for (β-oxidation, and hence turns this pathway on. Production of acetyl CoA, the end product of ( -oxidative pathway, is thereby greatly enhanced; the excessive amount of this compound is then channelled into ketone body formation.

Protein synthesis is decreased by glucagon, but protein and amino acid degradation continues as before (or increases in liver) for producing energy and for providing substrates for glucose production (i.e. gluconeogenesis).
C Epinephrine
Effect of epinephrine in the liver is same as that of glucagon. In addition, epinephrine is the principal hormone that regulates muscle metabolism.
Metabolism in muscle is distinct due to lack of the enzyme glucose 6-phosphatase. Glucose 6-phosphate is generated from glycogen due to stimulation of glycogenolysis by epinephrine; however, glucose 6-phosphatase cannot be converted to glucose in muscle due to the absence of glucose 6-phosphatase. Therefore, glucose 6-phosphate is channeled into glycolysis. Thus, muscle glycogen does not play any role in regulation of blood glucose; this is in contrast to liver glycogen, primary role of which is to liberate free glucose into blood circulation. Furthermore, activity of the glycolytic enzymes in muscle cells is enhanced by epinephrine (Table 15.2), causing an increase in glucose utilization.
During severe muscular exercise, epinephrine promotes muscle glycogen degradation to generate glucose 6-phosphate which is converted to lactate via anaerobic glycolysis. Lactate reaches liver where it is converted to glucose by gluconeogenesis. The concerted action of muscle and liver called Cori cycle, thereby ensure adequate supply of glucose fuel (Chapter 9).
D Testosterone
It is male steroid hormone which has potent anabolic effect. Its principal action is elicited on muscle cells, where it stimulates protein accumulation. The same effect is observed in other tissues as well, though the rate is lower.
E Glucocorticoids
These hormones are liberated from adrenal cortex, more so in stressful state. Glucocorticoids increase protein catab-olism in tissues (except liver; Table 15.2) and decrease transport of amino acids into the peripheral cells. The amino acids liberated from these tissues enter liver cells where they are channeled into the gluconeogenic sequence. Thus, the hepatic glucose generation increases, and therefore, glucocorticoids are said to act in concert with gluca-gon. In addition, the glucocorticoids step up lipolysis by stimulating activity of the hormone sensitive lipase.
Effect of glucocorticoids is elicited slower than that of insulin, glucagon or epinephrine.
II Metabolic Interconnections and Organ Specialization
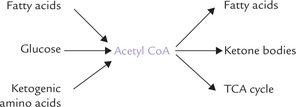
The metabolic processes involving various biomolecules are interconnected through certain branch compounds which lie at junctions of the major metabolic pathways (see Fig. 8.3). Some important branch compounds are acetyl CoA, pyruvate and glucose 6-phosphate. Acetyl CoA is the common degradation product of glucose, fatty acids, and ketogenic amino acids; its acetyl group can be used to synthesize fatty acids or ketone bodies, or can be oxidized via the TCA cycle and oxidative phosphorylation. Interconnections between major pathways via such branch compounds make interconversions of major foodstuffs possible. For example, pyruvate, the degradation product of carbohydrates and glycogenic amino acids can be converted to acetyl CoA, thereby providing its carbons for biosynthesis of cholesterol, fatty acids or other compound lipids.
Interrelationships and coordination of various organs is of crucial significance in maintaining metabolic homeostasis. Metabolic flow between these organs, each of which has a specialized role, occurs in well defined pathways. For example, following a meal, glucose, amino acids and fatty acids are directly available from the intestine. Later, when these fuels are exhausted, the liver and adipose tissue supply various organs with fuel molecules: liver provides glucose and ketone bodies and adipose tissue provides fatty acids. All these organs are connected via the blood stream.
Liver maintains proper levels of circulating fuels for use by other tissues, mainly brain and muscles. It is referred to as the body’s central metabolic clearing house. It is uniquely suited to carry out this task because it is the first organ exposed to all nutrients (except fatty acids) absorbed from intestine, and to insulin and glucagon from pancreas. One of the liver’s major functions is to act as a blood-glucose buffer; it imports and stores glucose following absorption of digested food; and generates and exports glucose into circulation when body needs it. Liver contains glucose 6-phosphatase which enables it to release glucose. Other important functions performed by liver are:
• It is active in cholesterogenesis and production of bile acids and triacylglycerols.
• It exports triacylglycerols and cholesterol as VLDL and takes up HDL (reverse cholesterol transport).
• Liver synthesizes proteins after meals and liver protein is degraded to provide precursors for gluco-neogenesis. The major proteins synthesized in liver include albumin, most of the transport proteins and blood clotting factors. Liver is also the site of production of urea.
• It generates, but cannot utilize ketone bodies. It is responsive to insulin except for glucose transport.
Liver releases 180 g of glucose, 100 g of fat and 14 g of albumin into circulation daily. Evidently, liver has more metabolic versatility than any other organ (Table 15.3 ).
Table 15.3
| Organ | Properties |
| Brain | Constant and voracious user of fuels: uses 200 g of glucose per day and 20% of total ATP produced in resting adult. Glucose is used as exclusive substrate, but can use ketone bodies after few days of fasting. |
| Erythrocyte | Glucose is only substrate for metabolism. Lacks mitochondria and releases lactate into circulation. |
| Kidney | Active in gluconeogenesis, using glutamine. Produces ammonia from glutamine. |
| Adipose tissue | Stores or hydrolyzes triacylglycerol stores as per body requirement. |
| Muscle | Stores glycogen, but cannot release glucose into circulation because of lack of glucose 6-phosphafase. Can perform anaerobic glycolysis, uses fatty acids and ketone bodies for energy. Muscle proteins release amino acids (mainly glutamine and alanine) for gluconeogenesis during fasting and starvation. |
| Intestine | Releases digested carbohydrates into portal vein. Releases branched-chain amino acids and other essential amino acids, but little aspartate, asparagine, or glutamine. Forms chylomicrons for export of dietary cholesterol and triacylglycerols. Uses glutamine for energy production. |
III Metabolic Adaptations in Three Fasting–starvation States
Starvation refers to a state of severe and prolonged (> 10 days) food deprivation while fasting implies voluntary restrain from food. Elaborate biochemical mechanisms exist, as described by Cahil and his associates, which ensure maintenance of normal blood glucose level (Chapter 10) and adequate supply of energy during fasting period. These mechanisms are necessary for survival considering the fact that the body needs energy continually, whereas the food is taken intermittently. Fasting is divided in three broad stages:
1. Initial stage that lasts up to two days of low calorie intake.
Body stores of energy:
The main providers of energy in the body are hepatic and muscle glycogen, adipose tissue triglycerides and muscle proteins (Table 15.4 ). The body begins to derive energy from these sources after about 80 minutes of fasting. Till that time, energy for the basal metabolic requirement is met by the fuels available from plasma.
Table 15.4
Energy reserves of a man weighing 70 kg
| Provider of energy | Grams | Kilocalories |
| Plasma glucose | 12 | 48 |
| Hepatic glycogen | 70 | 280* |
| Muscle glycogen | 280 | 1120 |
| Adipose triglycerides | 13,000 | 117,000 |
| Muscle proteins | 10,000 | 40,000 |
*After a meal. Liver glycogen is 20% to 30% of this value after an overnight fast.
Liver glycogen is the first main provider of energy during a short-term fast. Liver uses this stored glycogen as a readymade source of free glucose. However, this is useful only to a limited extent as the glycogen is exhausted in about 36 hours only. Adipose tissue triglycerides and muscle proteins have much larger reservoirs and can provide energy for 1-3 months. In obese individuals, this duration is expected to be longer because the stores are up to three times as large.
Thus, an obese individual is adapted to survive for three times longer period during starvation. However, the actual duration of survival is shorter because the associated vitamin and mineral deficiencies and infections cause death much before the energy stores are exhausted. Moreover, only about 50% of the body proteins can be lost without any serious risk to body functions. Loss of lean body tissues such as respiratory muscles causes respiratory failure and death.
Initial Stage (Early Fasting)
In initial stages of fasting the metabolic changes are aimed at: (i) maintaining the blood glucose level within normal range and (ii) providing energy from alternate sources (fatty acids and ketone bodies). To maintain blood glucose level, the glycogen stores of liver undergo glycogenolysis, thereby serving as the major source of blood glucose. Glucose is also generated by gluconeogenesis from substrates such as lactate, amino acids and glycerol.
Utilization of alternate substrates starts increasing now (as the glycogen stores are fastly depleting). β-Oxidation of fatty acids is gradually speeded-up; the fatty acids are obtained by lipolysis of triacylglycerol stores of adipose tissue (Fig. 15.2 ).
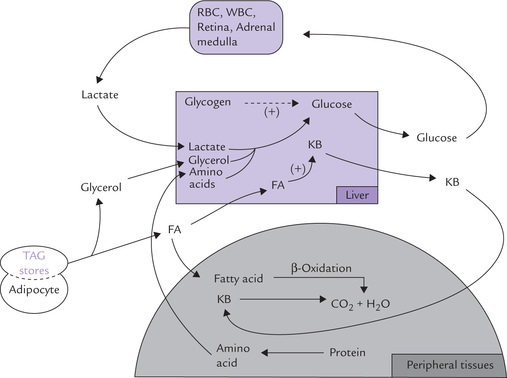
Fig. 15.2 Metabolic and fuel movements during early stages of fasting. Glycogenolysis and glyconeogenesis are speeded up to maintain normal blood glucose level, and ketone body synthesis is increased for use as fuel molecules (FA = fatty acids, KB = ketone bodies).
Insulin : glucagon ratio falls low in this stage, which promotes hepatic generation of ketone bodies which are the readily utilizable metabolic fuels. The ketone bodies can be considered as water-soluble lipids and concentrated energy packets.
It is noteworthy that certain tissues do not use fatty acids and remain dependent on glucose for energy needs. These include red and white blood cells, the retinal cells and adrenal medulla. Lactic acid produced by these tissues is reconverted to glucose in liver.
Intermediate Stage
In the intermediate stage of fasting, the glycogen stores are mostly depleted and so cannot serve as source of blood glucose. This may have serious consequences since no fuel molecule is entering the body from outside. The gluconeogenesis, therefore, assumes added significance for generating glucose and pouring it into blood circulation (Table 15.5 ).
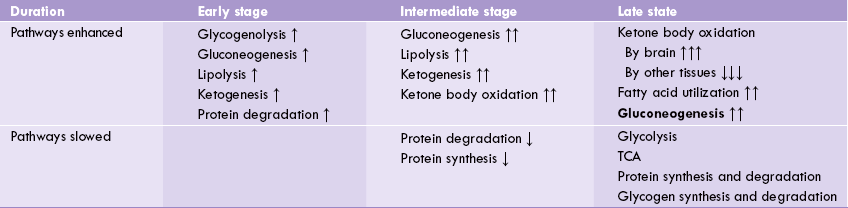
Fatty acids and ketone bodies continue to serve as sources of energy for muscles, heart and kidneys. Significance of these two fuels increases as the availability of glucose falls. An important change at this stage is that decreased availability of glucose makes nervous tissues use ketone bodies as energy source. Protein synthesis and degradation decline in this stage.
Advanced Stage
As the advanced stage of fasting is reached, ketone bodies are used more and more by brain. Utilization of ketone bodies by other tissues such as muscle, heart and kidneys decreases drastically, so that the available ketone bodies are diverted towards brain. These tissues/organs (other than brain) now heavily depend on fatty acids for their energy needs. A small amount of available glucose is utilized by the brain at this stage. Some tissues, however, continue to depend on glucose, though availability of the latter is very low. These include white and red blood cells, retina and adrenal medulla.
Activity of several regulatory enzymes change during advanced stage of fasting and starvation:
• Activity of glycogen synthase, phosphofructokinase, pyruvate kinase, pyruvate dehydrogenase and glucose 6-phosphatase decline.
• Enzymes such as pyruvate carboxylase, fructose 1,6-bisphosphatase, glucose 6-phosphatase and PEP carboxyki-nase become more active. The result of these alterations is that only one metabolic pathway, i.e. liver gluconeo-genesis is enhanced in advanced stage of fasting/starvation; rest of the pathways are suppressed.
Box 15.1 Ketone Body Metabolism in Starvation and Diabetes Mellitus
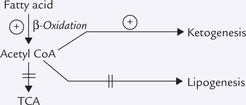
Low insulin : glucagon ratio in fasting, starvation and untreated diabetes leads to hydrolysis of stored triacylglycerols to release fatty acids. Fatty acids enter liver where they are degraded to acetyl CoA by β-oxidation. The acetyl CoA cannot enter the TCA cycle or lipogenesis because of the following metabolic derangements:
1. The NADH produced during β-oxidation converts oxaloacetate to malate, resulting in depletion of oxaloacetate.
2. The low insulin : glucagon ratio enhances gluconeogenesis, as does generation of excess acetyl CoA (acetyl CoA stimulates pyruvate carboxylase). Gluconeogenesis further exacerbates the dearth of oxaloacetate so that acetyl CoA is not able to enter the TCA cycle.
3. Fatty acid synthesis (lipogenesis) is decreased due to decreased induction and activity of acetyl CoA carboxylase (insulin induces this enzyme) and decreased concentration of malonyl CoA.
Under these circumstances, TCA cycle and lipogenesis are inoperative and the acetyl CoA must find another outlet. Therefore, it is channeled into ketone body production. Excessive amount of ketone bodies are released into circulation resulting in ketosis.
Besides substrate availability, enzyme induction is important for ketogenesis. Synthesis of HMG CoA synthase—the rate-limiting enzyme of ketogenesis—is enhanced in insulin deficiency. Fatty acids are also powerful inducers of the enzyme synthesis at the level of transcription.
Ketosis has serious consequences because ketone bodies are acidic in nature, and therefore can disturb the acid-base balance of the body resulting in metabolic acidosis. Ketone bodies displace bicarbonate ions so that the anion gap increases.
Large amount of ketone bodies are excreted in urine during spells of ketosis, and being anionic in nature they carry sodium, the major extracellular cation. Acidosis causes potassium and magnesium ions to move out of the cell and similarly lost in urine. This results in depletion of these ions in the body. Loss of circulating sodium ions may further aggravate aci-dosis because loss of Na+ often results in a decrease in circulatory . In severe cases, diabetic acidosis, hyperglycae-mia and glycosuria induce a severe and prolonged osmotic diuresis, resulting in dehydration.
Dehydration, acidosis and fluid-electrolyte disturbances greatly impair cerebral metabolism and function, leading to coma. The condition is fatal if not promptly treated.
 Major metabolic pathways are altered in starvation to provide glucose for brain and red blood cells. Fatty acids become the major energy source now, and are oxidized directly or after conversion to ketone bodies.
The above-stated metabolic adaptations are seen in diabetes mellitus (type I) as well. For example, metabolism of ketone bodies in starvation and diabetes mellitus shows marked resemblance (Box 15.1). In fact, type I diabetes metabolically resembles starvation, although the metabolic consequences are much exaggerated. Extensive research has been carried out in this field for the past several decades. As a result, the metabolic abnormalities associated with diabetes mellitus are understood better than those of any other disorder, as discussed in the next section.
IV Diabetes Mellitus
Diabetes mellitus is an endocrine disorder caused by relative or absolute insulin deficiency. It is a major cause of suffering and morbidity, afflicting 20-30 million people of all social classes throughout the world. In a vast majority of cases, the diagnosis can be made with reasonable certainty but the underlying aetiology and pathogenesis of this disorder have only been partially understood.
Diabetes mellitus is a syndrome rather than a single disease. For instance, in insulin dependent variety, known as type 1 diabetes mellitus there is total loss of insulin secretion because of degeneration of the pancreatic β-cells. These patients must receive exogenous insulin. In another major type, termed the type 2 diabetes mellitus, adequate insulin is present in circulation, but it fails to act on its target tissues. Decline in the number of insulin receptors in target tissues or blocking of interaction of insulin with its tissue receptors is the underlying cause in type 2 diabetes (Case 15.1).
Type 1 diabetes:
This type has an early onset, usually in childhood or adolescence, and is caused by autoimmune destruction of pancreatic ( -cells. The precipitating cause could be:
• Viral infection initiating a chain of autoimmune reactions, or
• Cytokine response to viral infection could attract monocytes and macrophages that infiltrate and destroy the pancreatic islets. Insulin is no longer produced and the patient requires lifelong insulin injections for survival.
Some patients with type 1 diabetes have antibodies against the ( -cell proteins. These are often present before the diagnosis of diabetes.
Type 2 diabetes:
It is a disease of middle age, usually developing in patients over 40 years of age and typically obese. It is more common and less severe than the type I, and has more complex origin. On lipid screen these patients usually show dyslipidaemia with elevated fasting triglycerides or a low HDL-c level. Impairment of insulin secretion or a reduced responsiveness of the target tissues to circulating insulin (insulin resistance), or both are involved in pathogenesis.
Patients with untreated diabetes have hyperglycaemia, disordered metabolism of carbohydrates, lipids and proteins and are at risk of developing microvascular and macrovascular diabetic complications. Deficiency of or resistance to insulin or both can be ameliorated by regulating diet and monitoring therapy. However, the standard treatment measures may not prevent the development of chronic complications of diabetes, which effect almost every major organ of the body, including eyes, kidneys, nerves, and arteries giving rise to pathogenic conditions such as retinopathy, nephropathy, neuropathy, atherosclerosis, etc.
Differences between the type 1 and the type 2 diabetes are highlighted in Box 15.2.
A Metabolic Alterations in Diabetes Mellitus
In diabetes mellitus, various body tissues may be affected. Although diabetes is considered as a disease of glucose under-utilization, there are indications of shunting of glucose from insulin responsive tissues to insulin unresponsive tissues (such as kidney, erythrocytes, lens and retina). These tissues receive a large glucose load, and metabolize it by opening some alternate pathways such as polyol pathway. This forms basis for the chronic complications of diabetes. Thus, different tissues respond in different ways to insulin deficiency.
Insulin is a hypoglycaemic hormone. It stands alone against on assay of hormones that are hyperglycemic: glucagon, growth hormone, glucocorticoids and epinephrine.
Insulin regulates a number of metabolic processes (Table 15.1). The control over these processes is lost in diabetes, resulting in a number of metabolic alterations described here.
1. Hyperglycaemia of diabetes mellitus is caused by both overproduction and underutilization of glucose. There is a relative excess of glucagon also. As a consequence, glucose is synthesized rather than consumed by liver, and glucose uptake into muscle and adipose tissue is reduced drastically (Table 15.1). All these lead to hyperglycaemia.
As glucose is osmotically active, renal excretion of a large amount of glucose leads to loss of water (osmotic diuresis). Poorly controlled diabetic patients complain of having to drink large quantities of fluids (polydipsia) and of passing large volumes of urine (polyuria). The resulting fluid loss leads to dehydration.
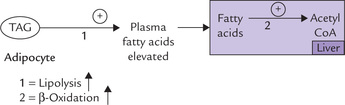
2. Lipolysis is greatly enhanced in adipose tissue because of unopposed action of hormone sensitive lipase (HSL). As evident from Tables 15.1 and 15.2, low insulin : glucagon ratio triggers the enhanced HSL activity, as:
• Insulin is an inhibitor of HSL.
• Glucagon is a stimulator of HSL.
The activated HSL greatly increases the degradation of TAG stores in adipocytes. Increased plasma free fatty acid concentration is a natural consequence of enhanced lipolysis. Excess fatty acids are taken up by liver where they are degraded to acetyl CoA by ( -oxidation.
3. Excess acetyl CoA (over) produces ketone bodies: Acetyl CoA, generated as discussed above, can enter a number of pathways, e.g. lipogenesis, TCA cycle and ketogenesis. However, lipogenesis, and TCA cycle are shut down as described in Box 15.1. Excessive acetyl CoA molecules are, therefore channeled into ketogenesis in liver. These metabolic adaptation are typical of the starving body when adipose tissue and liver have to keep all of the other tissues alive by supplying them with glucose, fatty acids and ketone bodies.
TCA and lipogenesis being blocked (by death of OAA and by reduced activity of the key lipogenic enzyme), the excessive acetyl CoA is channeled into ketogenesis.
Excessive generation of ketone bodies in this way may occur in cases of near or total insulin deficiency in type 1 diabetes, leading to diabetic ketoacidosis with severe fluid and electrolyte imbalances and metabolic acidosis (Case 15.3). However, ketosis does not occur in type 2 diabetes. Reason for this difference is not known.
4. Increased influx of fatty acids in liver leads to another abnormal metabolic state, fatty liver. Decreased VLDL production and therefore, decreased exportation of the hepatic TAG, also contributes to fatty liver.
Lipoprotein lipase activity is decreased in diabetes, resulting in decreased chylomicron and VLDL metabolism. This results in hypertriglyceridaemia.
5. Insulin promotes amino acid transport into cells and enhances protein synthesis; therefore, in diabetes, protein synthesis decreases and proteolysis increases. Muscle releases increased amounts of alanine, thereby providing a substrate for gluconeogenesis and promoting hyperglycaemia. Increased amino acid catabolism and increased urea production causes negative nitrogen balance and muscle wasting.
B Longstanding Diabetes Leads to Complications
In addition to the acute metabolic disturbances, just described diabetic patients suffer from slow development of many pathological changes in course of many years. These include abnormalities of small arteries (microan-giopathy: diabetic retinopathy and nephropathy), large arteries (diabetic macroangiopathy: coronary heart disease and peripheral vascular disease), and diabetic neuropathy, which results from a combination of vascular and structural tissue changes. Though the longstanding complications develop slowly, they are as dangerous as the acute metabolic changes, markedly reducing life expectancy.
The longstanding complications mostly develop in insulin independent tissues: these tissues do not require insulin for entry of glucose, e.g. brain, peripheral nerve tissue, kidney, intestine, lens, and red blood cells. Consequently, in these tissues the intracellular glucose concentration parallels the blood glucose concentration. Intracellular glucose concentration, therefore, markedly rises in uncontrolled diabetes, and leads to longstanding diabetic complications by the following two biochemical mechanisms.
1. The polyol pathway: In, implying low affinity, hypergly-caemia, excess intracellular glucose can be reduced to sorbitol by the action of aldose reductase, which is further oxidized by sorbitol dehydrogenase to fructose (Chapter 10).
• Because Km of aldose reductase for glucose is very high, the pathway is not very active at normal glucose levels.
• In hyperglycaemia, however, glucose levels in insulin independent tissues increase, and consequently there is an increase in the activity of the polyol pathway. This enhances intracellular level of sorbitol. The high level of intracellular sorbitol exerts osmotic effect, and this plays a role in the development of diabetic cataract. In addition, accumulation of sorbitol and fructose interferes with the metabolism of inositol. The cellular levels of inositol have been found to be decreased in diabetic individuals, and the cellular metabolism gets deranged.
2. Protein modification by glucose: The intracellular level of glucose is high in insulin independent tissues, and the glucose tends to attach, non-enzymatically, to protein molecules (protein glycation). This interferes with the normal function or turnover of proteins; for example, glycation of apolipoprotein-B slows down the rate of receptor dependent metabolism of low density lipoproteins (Chapter 12). This plays a major role in atherogenesis.
In fact, modification of proteins follows a sequence of non-enzymatic reactions, collectively known as the Maillard reaction. The reaction products (called Amadori products) transform further to form protein cross-links, known as advanced glycation end products (AGE). AGEs cause cross-linking of long lived body proteins such as tissue collagen or a nerve protein, myelin. It leads to thickening of basement membranes and stiffens the extracellular matrix, and decreases the elasticity of the arterial walls.
3. Enhanced oxidative stress: Accumulation of AGE has been implicated as one of the factors responsible for generation of oxygen free radicals in diabetes (Chapter 27).
C Assessment of a Diabetic Patient
Measurement of blood glucose level, an indispensable tool for diagnosis and monitoring of diabetic patients, has become part of a routine assessment of every patient admitted to hospital. Presently a broader range of tests are performed in diabetic patients.
Test for Diagnosis and Monitoring of Diabetes
1. Urinalysis: It is the most commonly employed and convenient test for screening diabetes mellitus. Generally, urinalysis is performed as a qualitative or semi-quantitative test for glucose and ketone bodies. Whenever the blood glucose level crosses 180 mg/dL (renal threshold), glucose appears in the urine. However, there is no true renal threshold for ketone bodies and they are excreted in trace amounts at normal blood concentrations also. However, in uncontrolled diabetes, substantial quantities of ketone bodies are excreted in urine (ketonuria) together with glucose.
2. Plasma glucose estimation: It remains the mainstay for the initial diagnosis and follow up of diabetes. Diagnostic cutoff for diabetes mellitus is 126 mg/dL in the fasting sample on two different occasions.
3. Glucose tolerance test: It consists of repeated measurement of the Plasma glucose level immediately before and at specific time (2 hours) after the ingestion of a (75 g) glucose solution. Diagnostic cut off between normal and diabetic individuals has been discussed in Case 15.1.
Diagnosis of diabetes based on values of: (i) fasting plasmo glucose (FPG) level, and (ii) 2-hour plasma glucose level after ingesting 75 g anhydrous glucose
FPG = 112-126 mg/dL : Impaired fasting glucose (IFG)
FPG > 126 mg/dL : Diabetes mellitus
2h Plasma glucose < 140 mg/dL : Normal
2h Plasma glucose 140-200 mg/dL : Impaired glucose tolerance (IGT)
2h Plasma glucose > 200 mg/dL : Diabetes mellitus IFG and IGT are pre-diabetic states
4. Glycosylated haemoglobin: It refers to glucose modified haemoglobin. It is formed because of a non-enzymatic glycosylation of haemoglobin: the glucose residue attaches to the free amino termini of the haemoglobin a- and ( -chains. The glycosylated haemoglobins (GHb) make up about 4-6% of the total haemoglobin in normal red blood cells. In uncontrolled diabetes, because of persistent hyperglycaemia, increased formation and increased blood level of GHb results. Thus GHb serves as useful tool for estimating integrated/mean plasma glucose level over preceding few weeks.
The major fraction of the glycosylated haemoglobins is HbA1c. It is formed when glucose is incorporated via N-glycosidic linkage into the N-terminal amino group of valine of each β-chain (Glc-CO-CH2-NH-Val). Glycosyl-ation is a continuous process occurring throughout the 120-day lifespan of the red cell, depending only on the prevailing plasma glucose concentration. Therefore, enhanced levels of HbA1c occur in individuals with elevated plasma glucose levels, for example in diabetes mellitus. HbA1c level may rise to as much as 20% of total haemoglobin in uncontrolled diabetes. However, unlike blood glucose, it remains elevated for the life of the red blood cell even if blood glucose levels decline to normal. HbAlc thus reflects integrated plasma glucose levels over the last 4-6 weeks, and thus identifies patients who do not comply with treatment. It is especially useful in childhood diabetes and during first trimester of pregnancy.
Estimation of GHb levels reflects history of plasma glucose levels over preceding 4-6 weeks. Being present in very small amounts, GHb is not pathological, but rather serves a useful purpose of monitoring patient’s compliance in diabetic state or even in diagnosis of diabetes.
Fructosamine
Quantitation of glycosylated serum proteins, referred to as "fructosamine", reflects history of plasma glucose levels for a relatively shorter period of time (2-3 weeks). Fructosamine is a generic term applied to the stable condensation product of glucose with serum proteins, of which albumin is quantitatively the largest fraction. Because the circulating half-life of albumin is about 20 days, the serum fructosamine levels reflect glucose control over a period of the preceding 2-3 weeks. Fructosamine determination is done colourimetrically and determines the fructosamine-like adduct formed when glucose reacts with NH2 residues of serum proteins.
Tests in Assessment of Long Term Complications of Diabetes
These are primarily tests of renal function, such as the measurement of the concentration of urea and creatinine in plasma. Urinary protein excretion (proteinuria) above 300 mg/day is the most important diagnostic test for diagnosis of diabetic nephropathy. Such overt protein-uria is preceded by presence of trace amount of albumin in urine (microalbuminuria). Microalbuminuria is only detectable by an assay, which is more sensitive than the conventional method for the measurement of albumin. It is used to predict the development of nephropathy.
Regular estimation of serum lipid levels evaluates risk of developing macrovascular complications.
V Metabolism of Xenobiotics
The body is exposed not only to nutrients but also to a variety of non-nutritive chemicals, collectively known as xenobiotics, the word meaning foreign to life.
Xenobiotics include plant metabolites, therapeutic drugs, industrial chemicals (soaps and detergents, dyes, bleaching agents), food additives, pesticides (DDT, aldrin), cosmetics and bacterial toxins. They may enter the body through various routes. Some of them are capable of causing biological damage, and so a prompt metabolism of xenobi-otics is important.
Biological Damages Caused by Xenobiotics
1. Xenobiotics may bind to the body protein to alter its conformation, which may cause functional inactiva-tion of the protein. Inactivation of enzymes or transport proteins in this manner may have deleterious effect on several biological functions.
2. Binding of xenobiotics to DNA may result in mutation often with serious consequences (Chapter 21).
3. Some xenobiotics exhibit structural similarity to a natural metabolite, therefore, act as antagonists. For example, dicumarol, a structural analogue of vitamin K, antagonizes action of this vitamin.
A Metabolism of Xenobiotics
Water-soluble substances can be excreted in urine and bile. Indeed, some water soluble xenobiotic drugs like penicilline and amphetamine are disposed off by this simple route. Lipophilic xenobiotics, on the other hand, cannot be easily excreted and tend to accumulate in adipose tissue and other lipid-rich structures. A number of chemical transformations are required for metabolizing them to water-soluble products. These products are not only excretable, but also less toxic. However, there are some exceptions; for example, methyl pyridine derived from pyridine is more toxic than the parent compound. Similarly, benzpyrene and aflatoxins are converted to mutagenic epoxides, discussed later.
Liver is the most important organ of xenobiotic metabolism. It can handle an infinite range of molecules because of the low substrate specificity of the hepatic enzymes involved in xenobiotic metabolism. The metabolism proceeds in two phases:
• The Phase I includes reactions like hydroxylation, oxidation, reduction and hydrolysis; and
• The Phase II reactions include conjugation and methylation.
Polarity of the xenobiotic is increased in the Phase I because of introduction of functional group(s); and, the conjugated and methylated metabolites produced in the second phase are highly soluble. These metabolites can, therefore, be easily excreted.
Lipophilic xenobiotics are metabolized to water-soluble products (in two phases) that can be excreted.
Some xenobiotics are excreted after the Phase I, but the majority are eliminated after the Phase II. Mostly the final products are excreted in urine or bile, but some are also eliminated in expired air and faeces.
Phase I Reactions
Hydroxylation:
It is the most common reaction type in phase I metabolism, which introduces hydroxyl group in the substrate molecule
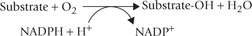
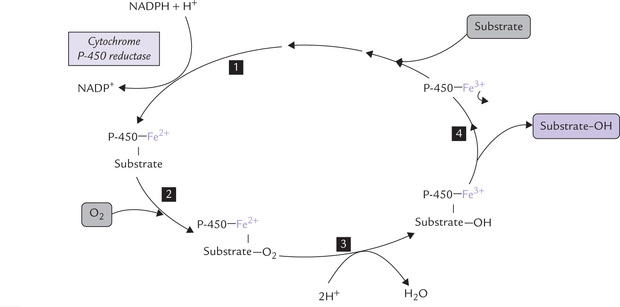
The reactions are monooxygenase reactions that require cytochrome P-450 as electron carrier. Cytochrome P-450 is not a single protein but a whole superfamily of haem-containing proteins, each having 400-530 amino acids. The haem iron is liganded to both a conserved cysteine residue and a water molecule. All known P-450 cytochromes co-localize the microsomal (endoplasmic reticulum) membrane with (i) reduced nicotinamide adenine dinucleotide phosphate (NADPH) and (ii) cytochrome P-450 reductase. They hydroxylate a vast range of hydrophobic molecules (e.g. steroids, drugs, vitamin D intermediates, etc.) to more soluble products. The reaction sequences, as catalyzed by these enzymes, is shown in Figure 15.3 .
Further information about cytochrome P-450 is given in next section.
Reaction sequence: The haem iron of cyto P-450 is normally liganded to a water molecule (shown by arrow), as discussed. When a substrate binds with cytochrome P-450, it displaces this water molecule, thus making space for binding of oxygen molecule to the haem iron. The bound oxygen is activated by transfer of an electron from cytochrome P-450 reductase, and after accepting electron, oxygen becomes highly reactive. It is readily incorporated in the substrate as hydroxyl group. It may be observed that one of the atoms of the molecular oxygen is incorporated into the substrate as hydroxyl group, and the other is reduced to water.
Oxidation:
Immunosuppressant drugs like azathioprine and anticancer drugs like 6-mercaptopurine are metabolized by oxidative reactions. Azathioprine is first converted to 6-mercaptopurine, which is oxidized by the enzyme xanthine oxidase to 6-thiouric acid. Xanthine oxidase inhibitors, used in treatment of gout, therefore, impede metabolism of these drugs.
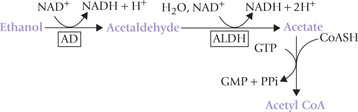
Detoxification of alcohol in liver also occurs by oxida-tive reactions catalyzed by two enzymes: alcohol dehydro-genase (AD) and aldehyde dehydrogenase (ALDH). The former oxidizes ethanol to acetaldehyde, which is further oxidized by aldehyde dehydrogenase to acetyl coenzyme A. Nicotinamide adenine dinucleotide is the cofactor for both these reactions, being reduced to NADH.
The consequences of this pathway are discussed later in this chapter.
Methanol is also metabolized by the alcohol dehydrogenase/ALDH pathway, but it is converted into more toxic metabolites, formaldehyde and formic acid. Therapeu-tically, ethanol is used for the treatment of methanol poisoning.
Reduction:
The major group of compounds which are metabolized by reductive reactions are nitro compounds. These are reduced to their amines, e.g. nitrobenzene converted to aminobenzene. Aldehydes and ketones are reduced to the corresponding alcohols.
Hydrolysis:
Esters, amides and carbamates are subject to hydrolysis. Some important compounds metabolized in this way (i.e. by hydrolysis) are aspirin, procaine, clofibrate, indomethacin, di-isopropyl fluorophosphates (DFP), etc.
Phase I reactions oxidize the xenobiotic to effect change(s) in its biological properties. Mostly, this oxidation takes form of hydroxylation reaction, making it more polar.
The given reactions metabolize compounds to less toxic products, but sometimes have hazardous consequences, such as activation of a carcinogen (Box 15.3).
Phase II Reactions
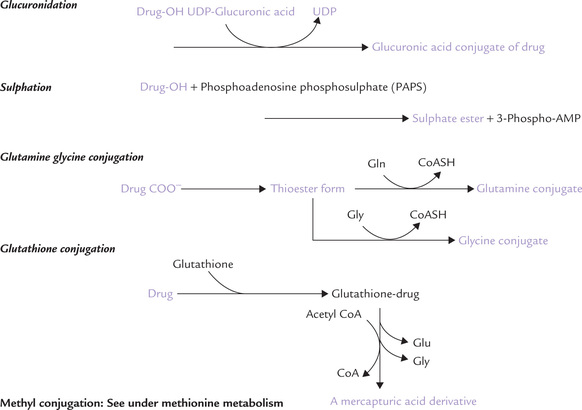
In this phase, the metabolite of Phase I is conjugated with a hydrophilic molecule such as glucuronic acid, sulphate, glycine, glutamine or glutathione. Most of the reactions take place in liver and yield water-soluble products which are not only more water soluble and excretable, but also lose biological activity of the parent compound (Fig. 15.4 ). Conjugation may occur with the following compounds:
Glucuronic acid:
It is the commonest reaction of phase II. Glucuronyl moiety of UDP-glucuronic acid is added to xenobiotics by UDP-glucuronyl transferases. Bilirubin is a good example of an endogenous compound excreted after glucuronidation. Some xenobiotics, e.g. phenol, acetaminophen, diazepam and morphine are also conjugated with glucuronic acid.
Sulphate:
Steroids and methyldopa are examples of the drugs that are sulphated. Phosphoadenosine phosphosul-phate (PAPS) transfers the sulphate group to xenobiotics.
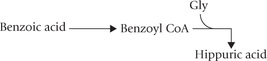
Glutamine-glycine conjugate:
Several drugs are converted to the corresponding thioester form and then conjugated with glycine/glutamine. For example, benzoic acid, after conversion to benzoyl CoA is conjugated with glycine.
Glutathione:
Some carcinogens and acetaminophen are conjugated with glutathione: γ-glutamyl-glycinyl-cysteine. Conjugation occurs with the sulphydryl group of the cys-teine residue; and the glutamate and glycine residues are split off. The cysteine residue is acetylated to form the mercapturic acid derivative of the xenobiotic, which is excreted.
Acetate:
Sulphanilamide, caffeine and isoniazid are conjugated with acetate. N-Acetyl transferase-2 transfers acetyl group from acetyl CoA to the xenobiotics.
In Phase II reactions, the xenobiotic (or its metabolite) is conjugated with a hydrophilic molecule (e.g. glucuronic acid, glycine, glutamine, glutathione) to form excretable product that has lost biological activity of the parent compound.
The methyl conjugation is discussed under methio-nine metabolism (Chapter 13).
B The Most Versatile Biocatalysts: P-450 Cytochromes
The P-450 cytochromes are the most important enzymes of xenobiotic metabolism that catalyze hydroxylation reactions in phase I, using NADPH and oxygen. They are so named because they absorb light of wavelength 450 nm, when exposed to carbon monoxide. Several hundred types of cytochrome P-450 are known, which occur as membrane bound proteins either in the micro-somes or in the inner mitochondrial membrane. They can be broadly divided into two varieties:
1. Lipid metabolizing variety: About a dozen of cytochrome P-450 participate in lipid metabolism, e.g. in ω-oxidation of fatty acids and in synthesis of steroid hormones. This variety of P-450 flavoproteins has a tight substrate specificity.
2. Drug metabolizing variety: These cytochromes are present in microsomes where they co-localize with NADPH and an enzyme called cytochrome P-450 reductase. The latter is a membrane flavoprotein. This variety of cytochrome P-450 has broad specificity, which enables them to produce a wide ranging efficacy in xenobiotic metabolism.
P-450 cytochromes have wide and overlapping substrate specificities which enable them to hydroxylate almost any xenobiotic.
Cytochrome P-450 are most versatile biocatalysts that can oxidize any conceivable foreign molecule. They are inducible by their own substrate.
Cytochrome P-450 are highly inducible: One of the most interesting aspects of cytochrome P-450 is that its substrates (and other xenobiotic agents) often induce the enzyme synthesis, usually by increasing the rate of transcription. Such self-induction provides an efficient mechanism of detoxification. However, it also results in rapid development of tolerance against drugs. For example, dose of the antiepileptic drug, phenobarbital has to be increased 3-4-fold within a week of starting the therapy in order to maintain the original therapeutic effect. Phenobarbital also induces the cytochrome P-450 that metabolizes other drugs such as dicumarol. This necessitates increase in the dosage of this anticoagulant if the patient is treated with phenobarbital.
C Isoforms of Cytochrome P-450 (CYP)
A large number of isoforms of cytochrome P-450 (about 150) have been identified. Recall that they are encoded by at least 12 gene families. Three of these gene families— designated CYP1, CYP2, and CYP3—share responsibility for xenobiotic metabolism. Members of a particular family show at least 40 per cent homology in amino acid sequence. Many families comprise subfamilies; for example, CYP2 has five subfamilies (CYP2A, CYP2B, CYP2C, CYP2D, CYP2E), and each of these subfamilies comprise individual members or isoforms.

For example, CYP1A1 and CYP1A2 denote cyto-chromes that are members of family 1 and subfamily A, and are the first two isoforms (individual members) of that subfamily.
The CYP3A subfamily appears to be involved in the metabolism of most drugs, and CYP3A4 appears to be the most active member of this subfamily.
In human tissues, at least 12 families of cytochrome P-450 have been identified. Most families have many subfamilies, each of which comprise isoforms.
Mutations in CYP genes can lead to decreased activity of certain isoforms of CYP, which in turn, will also affect the pharmacologic activity of some drugs. The best described example is that of the CYP2D6 (family 2, subfamily Di isoform 6th). It causes hydroxylation of debriso-quine, a now little-used blood pressure decreasing drug. CYP2D6 also metabolizes a significant number of other commonly used drugs (e.g. timolol, nortryptiline, perphenazine, fluxetine, dextremethorphan), so its deficiency remains a clinically significant condition.
Certain inhibitors (e.g. quinidine and haloperidol) cause inhibition of the CYP2D6, thereby affecting metabolism of these drugs.
VI Alcohol Metabolism
Alcohol is not only an intoxicant but also a nutrient. Oxidation of 1 g of ethanol provides about 7 kcal of energy, so a person consuming 100-120 g of alcohol per day covers about one-third of his energy needs. Excess intake of alcohol remains one of the most serious health concerns all over the world. As mentioned earlier, alcohol is oxidized in the liver, mainly by alcohol dehydrogenase, to form acetaldehyde, which is oxidized by aldehyde dehydrogenase to acetyl CoA. An isoform of P-450 cyto-chrome, CYP2E1, also contributes to ethanol metabolism. This route, however, contributes only for a small proportion of total alcohol metabolisms under most conditions.
Ethanol is oxidized in liver to acetyl CoA and, therefore, is a substrate for generation of metabolic energy (empty calories).
Biochemical consequences:
Unlike carbohydrate and fatty acid oxidation, alcohol metabolism in liver is not subject to negative feedback controls, so the oxidation of alcohol takes preference over the oxidation of other nutrients. Because NAD+ is the cofactor for both the reactions of the alcohol metabolism and is reduced to NADH, alcohol metabolism leads to an increased NADH to NAD ratio. This causes:
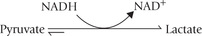
1. Inhibition of oxidation of lactate to pyruvate—a step that requires NAD+ as a cofactor. Lactate accumulation results, which may lead to lactic acidosis.
2. Inhibition of gluconeogenesis, because hepatic gluco-neogenesis requires pyruvate as a substrate. Therefore, alcoholism carries risk of hypoglycaemia.
3. Alcoholics have poor glycogen stores in liver, therefore the likelihood of hypoglycaemia is increased when they fast.
4. Increased NADH : NAD+ ratio also inhibits β-oxidation of fatty acids and promotes triglyceride synthesis.
Polymorphism
Both the enzymes of alcohol metabolizing pathway— alcohol dehydrogenase and ALDH—are subject to genetic polymorphisms, and these contribute to individual differences in alcohol tolerance.
Three genetic variants of alcohol dehydrogenase with different pH optima and Vmax values have been described. The most interesting polymorphism, however, affects the mitochondrial aldehyde dehydrogenase, i.e. the ALDH2 allele, which encodes an enzyme with reduced catalytic activity. This leads to increased plasma concentrations of acetaldehyde after the ingestion of alcohol. As a result, an individual experiences unpleasant flushing with tachycardia and sweating, which discourages alcohol abuse. Indeed, alcoholism is rare among such individuals. Some 30-40% of Chinese, Japanese, Mongolians, Koreans, Vietnamese, and Indonesians, and also many South American Red-Indians have this ALDH2 allele.
Disulphiram (an antabuse), a drug that inhibits ALDH, also leads to these symptoms when alcohol is taken, and may be given for the treatment of alcoholics. But use of this drug requires strict medical supervision: fatal reactions have occurred when disulphiram was mixed into an unsuspecting alcoholic’s drinks.
Exercises
Essay type questions
1. Explain briefly the biochemical changes in starvation and uncontrolled diabetes.
2. Describe the diverse biochemical effects of insulin. Mention the biochemical tests for diagnosis and monitoring of a case of diabetes mellitus.
3. Explain biochemical basis of development of complications in longstanding diabetes mellitus.
4. What is detoxification? Discuss two examples of metabolism of xenobiotics.
5. Discuss the pathway for metabolism of alcohol and the biochemical changes it leads to. Explain metabolic consequences of alcoholism.