Chapter 14 Cardiovascular disease
Essential anatomy, physiology and embryology of the heart
Introduction
Myocardial cells constitute 75% of the heart mass but only about 25% of the cell number. They are designed to perform two fundamental functions: initiation and conduction of electrical impulses and contraction. Although most myocardial cells are able to perform both these functions, the vast majority are predominantly contractile cells (myocytes) and a small number are specifically designed as electrical cells. The latter, collectively known as the conducting system of the heart, are not nervous tissue but modified myocytes lacking in myofibril components. They have the ability to generate electrical impulses which are then conducted to the myocytes, leading to contraction by a process known as excitation-contraction coupling. The rate of electrical impulse generation and the force of myocardial contraction are modified by numerous factors including autonomic input and stretch.
Three epicardial coronary arteries supply blood to the myocardium, and a more complex network of veins is responsible for drainage. In the face of continuous arterial pressure fluctuations, blood vessels, especially in the cerebral circulation, maintain constant tissue perfusion by a process known as ‘autoregulation’; blood vessel control is, however, complex involving additional local and central mechanisms.
The conduction system of the heart
The sinus node
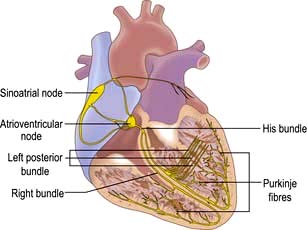
The sinus node is a complex spindle-shaped structure that lies in the lateral and epicardial aspects of the junction between the superior vena cava and the right atrium (Fig. 14.1). Physiologically, it generates impulses automatically by spontaneous depolarization of its membrane at a rate quicker than any other cardiac cell type. It is therefore the natural pacemaker of the heart.
A number of factors are responsible for the spontaneous decay of the sinus node cell membrane potential (‘the pacemaker potential’), the most significant of which is a small influx of sodium ions into the cells. This small sodium current has two components: the background inward current (Ib) and the ‘funny’ (If) current (or pacemaker current) (Fig. 14.2). The term ‘funny’ current denotes ionic flow through channels activated in hyperpolarized cells (−60 mV or greater), unlike other time- and voltage-dependent channels activated by depolarization. The rate of depolarization of the sinus node membrane potential is modulated by autonomic tone (i.e. sympathetic and parasympathetic input), stretch, temperature, hypoxia, blood pH and in response to other hormonal influences (e.g. tri-iodothyronine and serotonin).
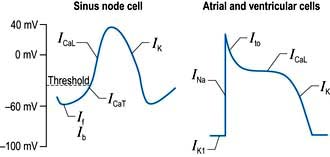
Figure 14.2 Myocardial action potentials. Ib, background inward sodium current; If, ‘funny’ current; ICaT, transient (or ‘T’ type) and ICaL, long-lasting (or ‘L’ type) calcium channels; INa, inward sodium current; ITo, transient outward potassium current; IKl, inward rectifier potassium current; IK delayed rectifier potassium current.
Atrial and ventricular myocyte action potentials
Action potentials in the sinus node trigger depolarization of the atrial and subsequently the ventricular myocytes. These cells have a different action potential from that of sinus node cells (Fig. 14.2). Their resting membrane potential is a consequence of a small flow of potassium ions into the cells through open ‘inward rectifier’ channels (IKl); at this stage sodium and calcium channels are closed. The arrival of adjacent action potentials triggers the opening of voltage-gated, fast, self-inactivating sodium channels, resulting in a sharp depolarization spike. This is followed by a partial repolarization of the membrane due to activation of ‘transient outward’ potassium channels.
The plateau phase which follows is unique to myocytes and results from a small, but sustained inward calcium current through L-type calcium channels (ICaL) lasting 200–400 ms. This calcium influx is caused by a combined increase in permeability of the cell, especially the sarcolemmal membranes to calcium (Fig. 14.3). This plateau (or refractory) phase in myocyte action potential prevents early reactivation of the myocytes and directly determines the strength of contraction. The gradual inactivation of the calcium channels activates delayed rectifier potassium channels (IK) repolarizing the membrane. Atrial tissue is activated like a ‘forest fire’, but the activation peters out when the insulating layer between the atrium and the ventricle – the annulus fibrosus – is reached. Controversy exists about whether impulses from the sinoatrial (SA) node travel over specialized conducting ‘pathways’ or over ordinary atrial myocardium.
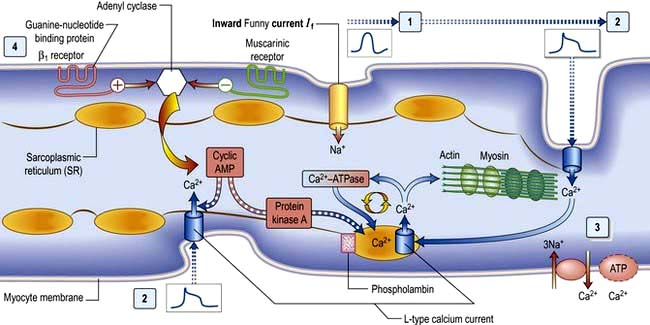
Figure 14.3 The ‘complete’ cardiac cell. (1) Spontaneous depolarization in sinus node cells due to sodium (Na) influx through the ‘funny’ current generates the ‘pacemaker’ potential. (2) This activates other atrial and ventricular myocytes, triggering action potentials and activating L-type calcium (Ca) channels in the surface and transverse tubule membranes (at top and bottom of figure). (3) The resulting Ca influx acts on Ca-induced Ca release channels (RyR2) on the sarcoplasmic reticulum (SR), resulting in release of stored Ca, which acts on actin and myosin fibrils, resulting in contraction. Ca reuptake pumps in the SR, regulated by phospholamban, replenish the stores; various exchange pumps also expel Ca from the cell. (4) Autonomic input has either a positive chronotropic/inotropic effect (β1 receptors) or a negative chronotropic/inotropic effect (muscarinic receptors).
The atrioventricular node, His bundle and Purkinje fibres
The depolarization continues to conduct slowly through the atrioventricular (AV) node. This is a small, bean-shaped structure that lies beneath the right atrial endocardium within the lower interatrial septum. The AV node continues as the His bundle, which penetrates the annulus fibrosus and conducts the cardiac impulse rapidly towards the ventricle. The His bundle reaches the crest of the interventricular septum and divides into the right bundle branch and the main left bundle branch.
The right bundle branch continues down the right side of the interventricular septum to the apex, from where it radiates and divides to form the Purkinje network, which spreads throughout the subendocardial surface of the right ventricle. The main left bundle branch is a short structure, which fans out into many strands on the left side of the interventricular septum. These strands can be grouped into an anterior superior division (the anterior hemi-bundle) and a posterior inferior division (the posterior hemi-bundle). The anterior hemi-bundle supplies the subendocardial Purkinje network of the anterior and superior surfaces of the left ventricle, and the inferior hemi-bundle supplies the inferior and posterior surfaces. Impulse conduction through the AV node is slow and depends on action potentials largely produced by slow transmembrane calcium flux. In the atria, ventricles and His-Purkinje system, conduction is rapid and is due to action potentials generated by rapid transmembrane sodium diffusion.
The cellular basis of myocardial contraction – excitation-contraction coupling
Each myocyte, approximately 100 µm long, branches and interdigitates with adjacent cells. An intercalated disc permits electrical conduction to adjacent cells. Myocytes contain bundles of parallel myofibrils. Each myofibril is made up of a series of sarcomeres (Fig. 14.4). A sarcomere (which is the basic unit of contraction) is bound by two transverse Z lines, to each of which is attached a perpendicular filament of the protein actin. The actin filaments from each of the two Z bands overlap with thicker parallel protein filaments known as myosin. Actin and myosin filaments are attached to each other by cross-bridges that contain ATPase, which breaks down adenosine triphosphate (ATP) to provide the energy for contraction.
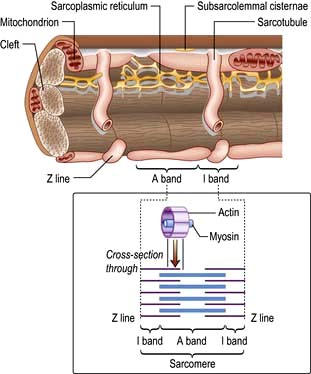
Figure 14.4 Schematic diagram showing the structure of a myofibril within a myocyte. The myofibrils are made up of a series of sarcomeres joined at the Z line.
Two chains of actin molecules form a helical structure, with another molecule, tropomyosin, in the grooves of the actin helix, and a further molecule, troponin, is attached to every seven actin molecules. During cardiac contraction the length of the actin and myosin monofilaments does not change. Rather, the actin filaments slide between the myosin filaments when ATPase splits a high-energy bond of ATP. To supply the ATP, the myocyte (which cannot stop for a rest) has a very high mitochondrial density (35% of the cell volume). As calcium ions bind to troponin C, the activity of troponin I is inhibited, which induces a conformational change in tropomyosin. This event unlocks the active site between actin and myosin, enabling contraction to proceed.
Calcium is made available during the plateau phase of the action potential by calcium ions entering the cell and by being mobilized from the sarcoplasmic reticulum through the ryanodine receptor (RyR2) calcium-release channel. RyR2 activity is regulated by the protein calstabin 2 (see p. 770) and nitric oxide. The force of cardiac muscle contraction (‘inotropic state’) is thus regulated by the influx of calcium ions into the cell through calcium channels (Fig. 14.3). T (transient) calcium channels open when the muscle is more depolarized, whereas L (long-lasting) calcium channels require less depolarization. The extent to which the sarcomere can shorten determines the stroke volume of the ventricle. It is maximally shortened in response to powerful inotropic drugs or severe exercise.
Starling’s law of the heart
The contractile function of an isolated strip of cardiac tissue can be described by the relationship between the velocity of muscle contraction, the load that is moved by the contracting muscle, and the extent to which the muscle is stretched before contracting. As with all other types of muscle, the velocity of contraction of myocardial tissue is reduced by increasing the load against which the tissue must contract. However, in the non-failing heart, pre-stretching of cardiac muscle improves the relationship between the force and velocity of contraction (Fig. 14.5).
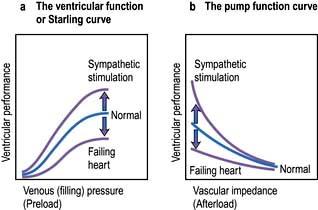
Figure 14.5 The Frank–Starling mechanism, showing the effect on ventricular contraction of alteration in filling pressures and outflow impedance in the normal, failing and sympathetically stimulated ventricle.
This phenomenon was described in the intact heart as an increase of stroke volume (ventricular performance) with an enlargement of the diastolic volume (preload), and is known as ‘Starling’s law of the heart’ or the ‘Frank–Starling relationship’. It has been transcribed into more clinically relevant indices. Thus, stroke work (aortic pressure × stroke volume) is increased as ventricular end-diastolic volume is raised. Alternatively, within certain limits, cardiac output rises as pulmonary capillary wedge pressure increases. This clinical relationship is described by the ventricular function curve (Fig. 14.5), which also shows the effect of sympathetic stimulation.
Nerve supply of the myocardium
Adrenergic nerves supply atrial and ventricular muscle fibres as well as the conduction system. β1-Receptors predominate in the heart with both epinephrine (adrenaline) and norepinephrine (noradrenaline) having positive inotropic and chronotropic effects. Cholinergic nerves from the vagus supply mainly the SA and AV nodes via M2 muscarinic receptors. The ventricular myocardium is sparsely innervated by the vagus. Under basal conditions, vagal inhibitory effects predominate over the sympathetic excitatory effects, resulting in a slow heart rate.
Adrenergic stimulation and cellular signalling
β1-Adrenergic stimulation enhances Ca2+ flux in the myocyte and thereby strengthens the force of contraction (Fig. 14.3). Binding of catecholamines, e.g. norepinephrine (noradrenaline), to the myocyte β1-adrenergic receptor stimulates membrane-bound adenylate kinases. These enzymes enhance production of cyclic adenosine monophosphate (cAMP) that activates intracellular protein kinases, which in turn phosphorylate cellular proteins, including L-type calcium channels within the cell membrane. β1-Adrenergic stimulation of the myocyte also enhances myocyte relaxation.
The return of calcium from the cytosol to the sarcoplasmic reticulum (SR) is regulated by phospholamban (PL), a low-molecular-weight protein in the SR membrane. In its dephosphorylated state, PL inhibits Ca2+ uptake by the SR ATPase pump (Fig. 14.3). However, β1-adrenergic activation of protein kinase phosphorylates PL, and blunts its inhibitory effect. The subsequently greater uptake of Ca2+ ions by the SR hastens Ca2+ removal from the cytosol and promotes myocyte relaxation.
The increased cAMP activity also results in phosphorylation of troponin I, an action that inhibits actin-myosin interaction, and further enhances myocyte relaxation.
The cardiac cycle
The cardiac cycle (Fig. 14.6) consists of precisely timed rhythmic electrical and mechanical events that propel blood into the systemic and pulmonary circulations. The first event in the cardiac cycle is atrial depolarization (a P wave on the surface ECG) followed by right atrial and then left atrial contraction. Ventricular activation (the QRS complex on the ECG) follows after a short interval (the PR interval). Left ventricular contraction starts and shortly thereafter right ventricular contraction begins. The increased ventricular pressures exceed the atrial pressures, and close first the mitral and then the tricuspid valves.
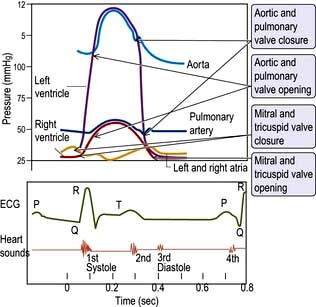
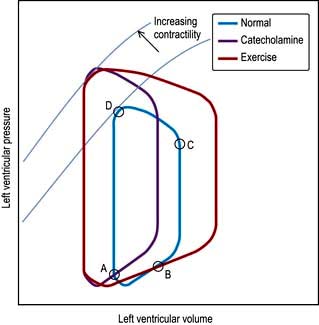
Until the aortic and pulmonary valves open, the ventricles contract with no change of volume (isovolumetric contraction). When ventricular pressures rise above the aortic and pulmonary artery pressures, the pulmonary valve and then the aortic valve open and ventricular ejection occurs. As the ventricles begin to relax, their pressures fall below the aortic and pulmonary arterial pressures, and aortic valve closure is followed by pulmonary valve closure. Isovolumetric relaxation then occurs. After the ventricular pressures have fallen below the right atrial and left atrial pressures, the tricuspid and mitral valves open. The cardiac cycle can be graphically depicted as the relationship between the pressure and volume of the ventricle. This is shown in Figure 14.7, which illustrates the changing pressure-volume relationships in response to increased contractility and to exercise.
The coronary circulation
The coronary arterial system (Fig. 14.8) consists of the right and left coronary arteries. These arteries branch from the aorta, arising immediately above two cusps of the aortic valve. These arteries are unique in that they fill during diastole, when not occluded by valve cusps and when not squeezed by myocardial contraction. The right coronary artery arises from the right coronary sinus and courses through the right side of the AV groove, giving off vessels that supply the right atrium and the right ventricle. The vessel usually continues as the posterior descending coronary artery, which runs in the posterior interventricular groove and supplies the posterior part of the interventricular septum and the posterior left ventricular wall.
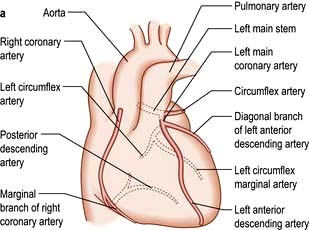
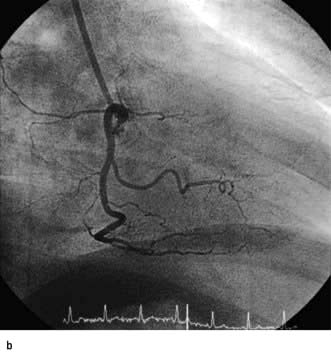
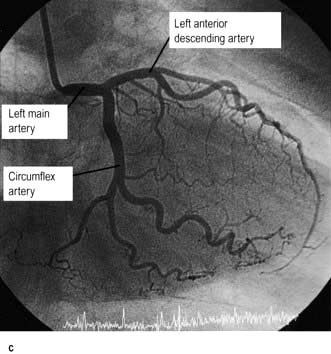
Figure 14.8 (a) Diagram of the normal coronary arterial anatomy. (b) Angiogram of non-dominant right coronary system. (c) Angiogram of dominant left coronary system from the same patient. Right anterior oblique projection.
Within 2.5 cm of its origin from the left coronary sinus, the left main coronary divides into the left anterior descending artery and the circumflex artery. The left anterior descending artery runs in the anterior interventricular groove and supplies the anterior septum and the anterior left ventricular wall. The left circumflex artery travels along the left AV groove and gives off branches to the left atrium and the left ventricle (marginal branches).
The sinus node and the AV node are supplied by the right coronary artery in about 60% and 90% of people, respectively. Therefore, disease in this artery may cause sinus bradycardia and AV nodal block. The majority of the left ventricle is supplied by the left coronary artery and disease in this vessel can cause significant myocardial dysfunction.
Some blood from the capillary beds in the wall of the heart drains directly into the cavities of the heart by tiny veins, but the majority returns by veins which accompany the arteries, to empty into the right atrium via the coronary sinus. An extensive lymphatic system drains into vessels that travel along the coronary vessels and then into the thoracic duct.
Blood vessel control and functions of the vascular endothelium
In functional terms, the tunica intima with the vascular endothelium and the smooth-muscle-cell-containing tunica media are the main constituents of blood vessels. These two structures are closely interlinked by a variety of mechanisms to regulate vascular tone. The central control of blood vessels is achieved via the neuroendocrine system. Sympathetic vasoconstrictor and parasympathetic vasodilator nerves regulate vascular tone in response to daily activity. Where neural control is impaired, or in various pathological states, e.g. haemorrhage, endocrine control of blood vessels mediated through epinephrine (adrenaline), angiotensin and vasopressin takes over.
At a local level, tissue perfusion is maintained automatically and by the effect of various factors synthesized and/or released in the immediate vicinity. In the face of fluctuating arterial pressures, blood vessels vasoconstrict independently of nervous input when blood pressure drops and vice versa. This process of autoregulation is a consequence of:
 The Bayliss myogenic response – the ability of blood vessels to constrict when distended
The vasodilator washout effect – the vasoconstriction triggered by a decrease in the concentration of tissue metabolites.
The vascular endothelium is a cardiovascular endocrine organ, which occupies a strategic interface between blood and other tissues. It produces various compounds (e.g. nitric oxide (NO), prostacyclin (PGI2), endothelin, endothelial-derived hyperpolarizing factor (ERHF), adhesion molecules, vascular endothelial growth factor (VEGF)) and has enzymes located on the surface controlling the levels of circulating compounds such as angiotensin, bradykinin and serotonin. It has many regulatory roles:
Vasomotor control
Nitric oxide is a diffusible gas with a very short half-life, produced in endothelial cells from the amino acid L-arginine via the action of the enzyme NO synthase (NOS), which is controlled by cytoplasmic calcium/calmodulin (Fig. 14.9). It is produced in response to various stimuli (Table 14.1), triggering vascular smooth muscle relaxation through activation of guanylate cyclase, leading to an increase in the intracellular levels of cyclic 3,5-guanine monophosphate (cGMP). Its cardiovascular effects protect against atherosclerosis, high blood pressure, heart failure and thrombosis. NO is also the neurotransmitter in various ‘nitrergic’ nerves in the central and peripheral nervous systems and may play a role in the central regulation of vascular tone. The class of drugs used to treat erectile dysfunction, the phosphodiesterase (PDE5) inhibitors, prevent the breakdown of cGMP and promote vasodilatation.
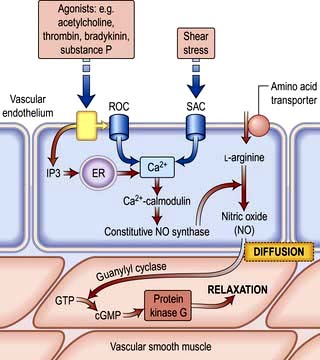
Figure 14.9 Nitric oxide (NO): the stimulus for production and function of NO. Various stimuli lead to the production of NO via cytoplasmic calcium/calmodulin. NO triggers smooth muscle relaxation via the activation of guanyl cyclase. ROC, receptor-operated Ca2+ channel; SAC, stretch-activated Ca2+ channel; IP3, inositol triphosphate; ER, endoplasmic reticulum; GTP, guanine triphosphate; cGMP, cyclic guanine monophosphate.
Table 14.1 Some of the products and functions of the vascular endothelium
| Endothelial product | Function(s) | Stimulus |
|---|---|---|
Nitric oxide |
||
Prostacyclin (PGI2) |
||
Prostanoids |
||
Endothelin |
||
Endothelial-derived hyperpolarizing factor |
||
Angiotensin-converting enzyme |
||
von Willebrand factor |
||
Adhesion molecules |
|
|
P, L, E selectins |
||
Vascular endothelial growth factor (VEGF) |
ICAM, intracellular adhesion molecule; VCAM, vascular cell adhesion molecule, PECAM, platelet/endothelial cell adhesion molecule; TNF, tumour necrosis factor; IL, interleukin.
PGI2 is synergistic to NO and also plays a role in the local regulation of vasomotor tone.
Endothelin is a 21-amino-acid peptide that counteracts the effects of NO. Its production is inhibited by shear stress, i.e. the stress exerted on the vessel wall by the flowing blood, and it causes profound vasoconstriction and vascular smooth muscle hypertrophy. It is thought to play a role in the genesis of hypertension and atheroma.
Angiotensin-converting enzyme located on the endothelial cell membrane converts circulating angiotensin I (synthesized by the action of renin on angiotensinogen) to angiotensin II which has vasoconstrictor properties and leads to aldosterone release (Fig. 12.5). Aldosterone promotes sodium absorption from the kidney and together with the angiotensin-induced vasoconstriction provides haemodynamic stability.
Other factors which influence vasomotor tone include histamine (released by mast cells), bradykinin (synthesized from kininogen by the action of coagulation factor XIIa) and serotonin released by platelets.
Anti- and pro-thrombotic mechanisms
PGI2, produced from arachidonic acid in the endothelial cell membrane by the action of the enzyme cyclo-oxygenase, inhibits platelet aggregation. Low-dose aspirin prevents activation of the cyclo-oxygenase pathway in platelets but only to a degree that does not affect PGI2 synthesis, unlike higher doses. Other antithrombotic agents such as clopidogrel (ADP receptor antagonist) and glycoprotein IIb/IIIa inhibitors achieve their effects by acting directly on platelet receptors. The antithrombotic effect of PGI2 is aided by NO, affecting platelets via activation of guanylate cyclase. The endothelial cell membrane also produces other anticoagulant molecules such as thrombomodulin, heparin sulphate and various fibrinolytic factors. Clinically used, fast-acting, heparin preparations are identical to this naturally occurring molecule.
In addition to their ability to prevent clotting, endothelial cells also aid thrombosis. They are responsible for the production of von Willebrand factor through a unique organelle called the Weibel–Palade body, which not only acts as a carrier for factor VIII but also promotes platelet adhesion by binding to exposed collagen (p. 414).
Modulation of immune responses
In response to various inflammatory mediators, the vascular endothelium expresses various so-called ‘adhesion molecules’ which promote leucocyte attraction, adhesion and infiltration into the blood vessel wall (Chapter 3).
Symptoms of heart disease
The following symptoms occur with heart disease:
The severity of cardiac symptoms or fatigue is classified according to the New York Heart Association (NYHA) grading of cardiac status (see Table 14.19). The differential diagnosis of chest pain is given in Table 14.2.
Table 14.2 Differential diagnosis of chest pain
| Central | Lateral/peripheral |
|---|---|
Cardiac |
Pulmonary |
Ischaemic heart disease (infarction or angina) |
Infarction |
Coronary artery spasm |
Pneumonia |
Pericarditis/myocarditis |
Pneumothorax |
Mitral valve prolapse |
Lung cancer |
Aortic aneurysm/dissection |
Mesothelioma |
Non-cardiac |
Non-pulmonary |
Pulmonary embolism |
Bornholm disease (epidemic myalgia) |
Oesophageal disease (see Box 6.3) |
Herpes zoster |
Mediastinitis |
Trauma (ribs/muscular) |
Costochondritis (Tietze disease) |
|
Trauma (soft tissue, rib) |
|
Central chest pain
This is the most common symptom associated with heart disease. The pain of angina pectoris and myocardial infarction is due to myocardial hypoxia. Types of pain include:
Retrosternal heavy or gripping sensation with radiation to the left arm or neck that is provoked by exertion and eased with rest or nitrates – angina (p. 729)
Similar pain at rest – acute coronary syndrome (p. 734)
Severe tearing chest pain radiating through to the back – aortic dissection (p. 787)
Sharp central chest pain that is worse with movement or respiration but relieved with sitting forward – pericarditis pain (p. 774)
Sharp stabbing left submammary pain associated with anxiety – Da Costa’s syndrome.
Dyspnoea
Left ventricular failure causes dyspnoea due to oedema of the pulmonary interstitium and alveoli. This makes the lungs stiff (less compliant), thus increasing the respiratory effort required to ventilate the lungs. Tachypnoea (increased respiratory rate) is often present owing to stimulation of pulmonary stretch receptors.
Orthopnoea refers to breathlessness on lying flat. Blood is redistributed from the legs to the torso, leading to an increase in central and pulmonary blood volume. The patient uses an increasing number of pillows to sleep.
Paroxysmal nocturnal dyspnoea (PND) is when a patient is woken from sleep fighting for breath. It is due to the same mechanisms as orthopnoea. However, as sensory awareness is reduced whilst asleep, the pulmonary oedema can become quite severe before the patient is awoken.
Hyperventilation with alternating episodes of apnoea (Cheyne–Stokes respiration) occurs in severe heart failure.
Central sleep apnoea syndrome (CSAS). If hypopnoea occurs rather than apnoea, the phenomenon is termed ‘periodic breathing’, but the two variations are known together as CSAS. This occurs due to malfunctioning of the respiratory centre in the brain, caused by poor cardiac output with concurrent cerebrovascular disease. The symptoms of CSAS, such as daytime somnolence and fatigue, are similar to those of obstructive sleep apnoea syndrome (OSAS, p. 818) and there is considerable overlap with the symptoms of heart failure. CSAS is believed to lead to myocardial hypertrophy and fibrosis, deterioration in cardiac function and complex arrhythmias, including non-sustained ventricular tachycardia, hypertension and stroke. Patients with CSAS have a worse prognosis compared to similar patients without CSAS.
Palpitations
These represent an increased awareness of the normal heart beat or the sensation of slow, rapid or irregular heart rhythms. The most common arrhythmias felt as palpitations are premature ectopic beats and paroxysmal tachycardias. A useful trick is to ask patients to tap out the rate and rhythm of their palpitations, as the different arrhythmias have different characteristics:
Premature beats (ectopics) are felt by the patient as a pause followed by a forceful beat. This is because premature beats are usually followed by a pause before the next normal beat, as the heart resets itself. The next beat is more forceful as the heart has had a longer diastolic period and therefore is filled with more blood before this beat.
Paroxysmal tachycardias (see p. 698) are felt as a sudden racing heart beat.
Bradycardias (p. 702) may be appreciated as slow, regular, heavy or forceful beats. Most often, however, they are simply not sensed. All palpitations can be graded by the NYHA cardiac status (see Table 14.19).
Syncope
Syncope is a transient loss of consciousness due to inadequate cerebral blood flow. The cardiovascular causes are listed in Table 14.3.
Table 14.3 Cardiovascular causes of syncope
|
|
A vasovagal attack is a simple faint and is the most common cause of syncope. The mechanism begins with peripheral vasodilatation and venous pooling of blood, leading to a reduction in the amount of blood returned to the heart. The near-empty heart responds by contracting vigorously, which in turn stimulates mechanoreceptors (stretch receptors) in the inferoposterior wall of the left ventricle. These in turn trigger reflexes via the central nervous system, which act to reduce ventricular stretch (i.e. further vasodilatation and sometimes profound bradycardia), but this causes a drop in blood pressure and therefore syncope. These episodes are usually associated with a prodrome of dizziness, nausea, sweating, tinnitus, yawning and a sinking feeling. Recovery occurs within a few seconds, especially if the patient lies down.
Postural (orthostatic) hypotension is a drop in systolic blood pressure of 20 mmHg or more on standing from a sitting or lying position. Usually, reflex vasoconstriction prevents a drop in pressure but if this is absent or the patient is fluid depleted or on vasodilating or diuretic drugs, hypotension occurs.
Postprandial hypotension is a drop in systolic blood pressure of ≥20 mmHg or the systolic blood pressure drops from above 100 mmHg to under 90 mmHg within 2 hours of eating. The mechanism is unknown but may be due to pooling of blood in the splanchnic vessels. In normal subjects, this elicits a homeostatic response via activation of baroreceptors and the sympathetic system, peripheral vasoconstriction and an increase in cardiac output.
Micturition syncope refers to loss of consciousness whilst passing urine.
Carotid sinus syncope occurs when there is an exaggerated vagal response to carotid sinus stimulation, provoked by wearing a tight collar, looking upwards or turning the head.
Obstructive. The obstructive cardiac causes listed in Table 14.3 all lead to syncope due to restriction of blood flow from the heart into the rest of the circulation, or between the different chambers of the heart.
Arrhythmias. Stokes–Adams attacks (p. 700) are a sudden loss of consciousness unrelated to posture and due to intermittent high-grade AV block, profound bradycardia or ventricular standstill. The patient falls to the ground without warning, is pale and deeply unconscious. The pulse is usually very slow or absent. After a few seconds the patient flushes brightly and recovers consciousness as the pulse quickens. Often there are no sequelae, but patients may injure themselves during falls. Occasionally a generalized convulsion may occur if the period of cerebral hypoxia is prolonged, leading to a misdiagnosis of epilepsy.
FURTHER READING
Moya A, Sutton R, Ammirati F et al. Task Force for the Diagnosis and Management of Syncope; European Society of Cardiology (ESC); European Heart Rhythm Association (EHRA); Heart Failure Association (HFA); Heart Rhythm Society (HRS). Guidelines for the diagnosis and management of syncope (version 2009). Eur Heart J 2009; 30(21):2631–2671.
Fatigue
Fatigue may be a symptom of inadequate systemic perfusion in heart failure. It is due to poor sleep, a direct side-effect of medication, particularly beta-blockers, electrolyte imbalance due to diuretic therapy and as a systemic manifestation of infection such as endocarditis.
Peripheral oedema
Heart failure results in salt and water retention due to renal underperfusion and consequent activation of the renin-angiotensin-aldosterone system (p. 566). This leads to dependent pitting oedema.
Examination of the cardiovascular system
General examination
General features of the patient’s wellbeing should be noted as well as the presence of conjunctival pallor, obesity, jaundice and cachexia.
Clubbing (p. 799) is seen in congenital cyanotic heart disease, particularly Fallot’s tetralogy and also in 10% of patients with subacute infective endocarditis.
Splinter haemorrhages. These small, subungual linear haemorrhages are frequently due to trauma, but are also seen in infective endocarditis.
Cyanosis is a dusky blue discoloration of the skin (particularly at the extremities) or of the mucous membranes when the capillary oxygen saturation is less than 85%. Central cyanosis (p. 799) is seen with shunting of deoxygenated venous blood into the systemic circulation, as in the presence of a right-to-left heart shunt. Peripheral cyanosis is seen in the hands and feet, which are cold. It occurs in conditions associated with peripheral vasoconstriction and stasis of blood in the extremities leading to increased peripheral oxygen extraction. Such conditions include congestive heart failure, circulatory shock, exposure to cold temperatures and abnormalities of the peripheral circulation, e.g. Raynaud’s, p. 788.
The arterial pulse
The first pulse to be examined is the right radial pulse. A delayed femoral pulsation occurs because of a proximal stenosis, particularly of the aorta (coarctation).
Pulse rate
The pulse rate should be between 60 and 80 beats per minute (b.p.m.) when an adult patient is lying quietly in bed.
Rhythm
The rhythm is regular except for a slight quickening in early inspiration and a slowing in expiration (sinus arrhythmia).
Premature beats occur as occasional or repeated irregularities superimposed on a regular pulse rhythm. Similarly, intermittent heart block is revealed by occasional beats dropped from an otherwise regular rhythm.
Atrial fibrillation produces an irregularly irregular pulse. This irregular pattern persists when the pulse quickens in response to exercise, in contrast to pulse irregularity due to ectopic beats, which usually disappears on exercise.
Character of pulse
Carotid pulsations are not normally apparent on inspection of the neck but may be visible (Corrigan’s sign) in conditions associated with a large-volume pulse, including high output states (such as thyrotoxicosis, anaemia or fever) and in aortic regurgitation.
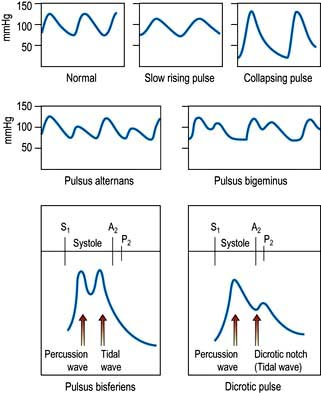
A ‘collapsing’ or ‘water hammer’ pulse (Fig. 14.10) is a large-volume pulse characterized by a short duration with a brisk rise and fall. This is best appreciated by palpating the radial artery with the palmer aspect of four fingers while elevating the patient’s arm above the level of the heart. A collapsing pulse is characteristic of aortic valvular regurgitation or a persistent ductus arteriosus.
A small-volume pulse is seen in cardiac failure, shock and obstructive valvular or vascular disease. It may also be present during tachyarrhythmias.
A plateau pulse is small in volume and slow in rising to a peak due to aortic stenosis (Fig. 14.10).
Alternating pulse (pulsus alternans). This is characterized by regular alternate beats that are weak and strong. It is a feature of severe myocardial failure and is due to the prolonged recovery time of damaged myocardium; it indicates a very poor prognosis. It is easily noticed when taking the blood pressure because the systolic pressure may vary from beat to beat by as much as 50 mmHg (Fig. 14.10).
Bigeminal pulse (pulsus bigeminus). This is due to a premature ectopic beat following every sinus beat. The rhythm is not regular (Fig. 14.10) because every weak pulse is premature.
Pulsus bisferiens (Fig. 14.10). This is a pulse that is found in hypertrophic cardiomyopathy and in mixed aortic valve disease (regurgitation combined with stenosis). The first systolic wave is the ‘percussion’ wave produced by the transmission of the left ventricular pressure in early systole. The second peak is the ‘tidal’ wave caused by recoil of the vascular bed. This normally happens in diastole (the dicrotic wave), but when the left ventricle empties slowly or is obstructed from emptying completely, the tidal wave occurs in late systole. The result is a palpable double pulse.
Dicrotic pulse (Fig. 14.10) results from an accentuated dicrotic wave. It occurs in sepsis, hypovolaemic shock and after aortic valve replacement.
Paradoxical pulse. Paradoxical pulse is a misnomer, as it is actually an exaggeration of the normal pattern. In normal subjects, the systolic pressure and the pulse pressure (the difference between the systolic and diastolic blood pressures) fall during inspiration. The normal fall of systolic pressure is <10 mmHg, and this can be measured using a sphygmomanometer. It is due to increased pulmonary intravascular volume during inspiration. In severe airflow limitation (especially severe asthma) there is an increased negative intrathoracic pressure on inspiration which enhances the normal fall in blood pressure. In patients with cardiac tamponade, the fluid in the pericardium increases the intrapericardial pressure, thereby impeding diastolic filling of the heart. The normal inspiratory increase in venous return to the right ventricle is at the expense of the left ventricle, as both ventricles are confined by the accumulated pericardial fluid within the pericardial space. Paradox can occur through a similar mechanism in constrictive pericarditis but is less common.
The blood pressure
The peak systemic arterial blood pressure is produced by transmission of left ventricular systolic pressure. Vascular tone and an intact aortic valve maintain the diastolic blood pressure. How to take the blood pressure is outlined in Practical Box 14.1.
 Practical Box 14.1
Taking the blood pressure
Use a properly calibrated machine.
1. The blood pressure is taken in the (right) arm with the patient relaxed and comfortable.
2. The sphygmomanometer cuff is wrapped around the upper arm with the inflation bag placed over the brachial artery.
3. The cuff is inflated until the pressure exceeds the arterial pressure – when the radial pulse is no longer palpable.
4. The diaphragm of the stethoscope is positioned over the brachial artery just below the cuff.
5. The cuff pressure is slowly reduced until sounds (Korotkoff sounds) can be heard (phase 1). This is the systolic pressure.
6. The pressure is allowed to fall further until the Korotkoff sounds become suddenly muffled (phase 4).
7. The pressure is allowed to fall still further until they disappear (phase 5).
The diastolic pressure is usually taken as phase 5 because this phase is more reproducible and nearer to the intravascular diastolic pressure. The Korotkoff sounds may disappear (phase 2) and reappear (phase 3) between the systolic and diastolic pressures. Do not mistake phase 2 for the diastolic pressure or phase 3 for the systolic pressure.
Jugular venous pressure
There are no valves between the internal jugular vein and the right atrium. Observation of the column of blood in the internal jugular system is therefore a good measure of right atrial pressure. The external jugular cannot be relied upon because of its valves and because it may be obstructed by the fascial and muscular layers through which it passes; it can only be used if typical venous pulsation is seen, indicating no obstruction to flow.
Measurement of jugular venous pressure (JVP)
See Practical Box 14.2.
Practical Box 14.2
Measurement of jugular venous pressure
The patient is positioned at about 45° to the horizontal (between 30° and 60°), wherever the top of the venous pulsation can be seen in a good light.
The jugular venous pressure is measured as the vertical distance between the manubriosternal angle and the top of the venous column.
The normal jugular venous pressure is usually <3 cmH2O, which is equivalent to a right atrial pressure of 8 cmH2O when measured with reference to a point midway between the anterior and posterior surfaces of the chest.
The venous pulsations are not usually palpable (except for the forceful venous distension associated with tricuspid regurgitation).
Compression of the right upper abdomen causes a temporary increase in venous pressure and makes the JVP more visible (hepatojugular reflux).
Elevation of the jugular venous pressure occurs in heart failure. It is also produced by an elevated jugular venous pressure which occurs in constrictive pericarditis and cardiac tamponade (increases in inspiration – Kussmaul’s sign), renal disease with salt and water retention, overtransfusion or excessive infusion of fluids, congestive cardiac failure and superior vena cava obstruction. A reduced jugular venous pressure occurs in hypovolaemia.
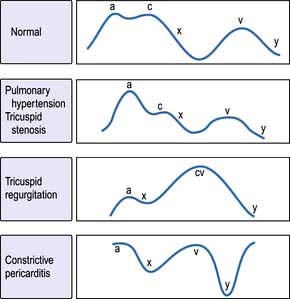
The jugular venous pressure wave
This consists of three peaks and two troughs (Fig. 14.11). The peaks are described as a, c and v waves and the troughs are known as x and y descents:
The a wave is produced by atrial systole and is increased with right ventricular hypertrophy secondary to pulmonary hypertension or pulmonary stenosis. Giant cannon waves occur in complete heart block and ventricular tachycardia.
The x descent occurs when atrial contraction finishes.
The c wave occurs during the x descent and is due to transmission of right ventricular systolic pressure before the tricuspid valve closes.
The v wave occurs with venous return filling the right atrium. Giant v waves occur in tricuspid regurgitation.
The y descent follows the v wave when the tricuspid valve opens. A steep y descent is seen in constrictive pericarditis and tricuspid incompetence.
Examination of the precordium
With the patient at 45°, the cardiac apex is located in the 5th intercostal space mid-clavicular line. Left ventricular dilatation will displace the apex downwards and laterally. It may be impalpable in patients with emphysema, obesity, pericardial or pleural effusions.
A tapping apex is a palpable first sound and occurs in mitral stenosis.
A vigorous apex may be present in diseases with volume overload, e.g. aortic regurgitation.
A heaving apex may occur with left ventricular hypertrophy – aortic stenosis, systemic hypertension and hypertrophic cardiomyopathy.
A double pulsation may occur in hypertrophic cardiomyopathy.
A sustained left parasternal heave occurs with right ventricular hypertrophy or left atrial enlargement.
A palpable thrill may be felt overlying an abnormal cardiac valve, e.g. systolic thrill with aortic stenosis.
Auscultation
The bell of the stethoscope is used for low-pitched sounds (heart sounds and mid-diastolic murmur in mitral stenosis). The diaphragm is used for high-pitched sounds (systolic murmurs, aortic regurgitation, ejection clicks and opening snaps). The areas of auscultation are described in (Fig. 14.12). Left-sided valve murmurs may be more prominent in expiration and right-sided in inspiration. Mitral murmurs may be more audible with the patient reclining to the left.
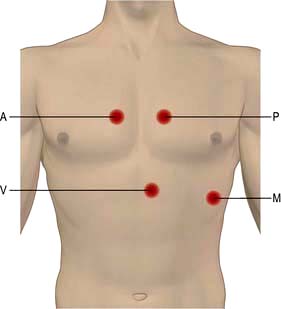
Figure 14.12 Heart auscultation. A, aortic area 2nd ICS right sternal edge. P, pulmonary area 2nd ICS left sternal edge. M, mitral area 5th ICS, mid-clavicular line. T, tricuspid area 3rd to 5th ICS, left sternal edge.
First heart sound (S1)
This is due to mitral and tricuspid valve closure. A loud S1 occurs in thin people, hyperdynamic circulation, tachycardias and mild-moderate mitral stenosis. A soft S1 occurs in obesity, emphysema, pericardial effusion, severe calcific mitral stenosis, mitral or tricuspid regurgitation, heart failure, shock, bradycardias and first-degree block.
Second heart sound (S2)
This is due to aortic and pulmonary valve closure. Physiological splitting of S2 occurs during inspiration in children and young adults.
Third and fourth heart sounds
Heart murmurs
These are due to turbulent blood flow and occur in hyperdynamic states or with abnormal valves. (Listen online in Student Consult.) Innocent or flow murmurs are soft, early systolic, short and non-radiating. They are heard frequently in children and young adults. Heart murmurs can be graded with the following scale:
1/6 very faint; not always heard in all positions
2/6 quiet but not difficult to hear
5/6 very loud ± thrills; are heard with stethoscope partly off chest
6/6 is heard with stethoscope completely off chest; ± thrills
The individual murmurs are discussed under valve disease, page 740.
Cardiac investigations
Blood tests
Routine haematology, urea/creatinine and electrolytes, liver biochemistry, cardiac enzymes, thyroid function and brain natriuretic peptides (BNP).
Chest X-ray
Ideally, this is taken in the postero-anterior (PA) direction at maximum inspiration with the heart close to the X-ray film to minimize magnification with respect to the thorax. A lateral may give additional information if the PA is abnormal. The cardiac structures and great vessels that can be seen on these X-rays are indicated in Figure 14.13. An antero-posterior (AP) view is only taken in an emergency.
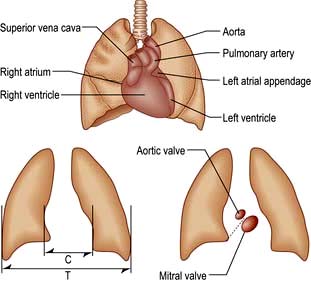
Figure 14.13 Diagrams to show the heart silhouette on the chest X-ray, measurements of the cardiothoracic ratio (CTR) and the location of the cardiac valves. The dotted line is an arbitrary line from the left hilum to the right cardiophrenic angle: a calcified aortic valve is seen above this line. CTR = (C/T) × 100%; normal CTR <50%.
Heart size
Heart size can be reliably assessed only from the PA chest film. The maximum transverse diameter of the heart is compared with the maximum transverse diameter of the thorax measured from the inside of the ribs (the cardiothoracic ratio). The cardiothoracic ratio (CTR) is usually <50%, except in neonates, infants, athletes and patients with skeletal abnormalities such as scoliosis and funnel chest. A transverse cardiac diameter of more than 15.5 cm is abnormal. Pericardial effusion or cardiac dilatation causes an increase in the ratio.
A pericardial effusion produces a globular heart (see Fig. 14.115, p. 775). This enlargement may occur quite suddenly and, unlike in heart failure, there is no associated change in the pulmonary vasculature. The echocardiogram is more specific (p. 776).
Certain patterns of specific chamber enlargement may be seen on the chest X-ray:
Left atrial dilatation. This results in prominence of the left atrial appendage and a straightening or convex bulging of the upper left heart border, a double atrial shadow to the right of the sternum, and splaying of the carina because a large left atrium elevates the left main bronchus (Fig. 14.14). On a lateral chest X-ray an enlarged left atrium bulges backwards, impinging on the oesophagus.
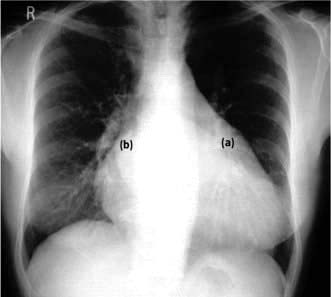
Figure 14.14 Plain PA chest X-ray of a patient with mixed mitral valve disease. The left atrium is markedly enlarged (a). Note the large bulge on the left heart border (left atrium). The ‘double shadow’ (border of the right and left atria) (b) is on the right side of the heart. There is cardiac (left ventricular) enlargement due to mitral regurgitation.
Left ventricular enlargement. This results in an increase in the CTR and a smooth elongation and increased convexity of the left heart border.
Right atrial enlargement. This results in the right border of the heart projecting into the right lower lung field.
Right ventricular enlargement. This results in an increase of the CTR and an upward displacement of the apex of the heart because the enlarging right ventricle pushes the left ventricle leftwards, upwards and eventually backwards. Differentiation of left from right ventricular enlargement may be difficult from the shape of the left heart border alone, but the lateral view shows enlargement anteriorly for the right ventricle and posteriorly for the left ventricle.
Ascending aortic dilatation or enlargement. This is seen as a prominence of the aortic shadow to the right of the mediastinum between the right atrium and superior vena cava.
Dissection of the ascending aorta. This is seen as a widening of the mediastinum on chest X-ray but an ultrasound/magnetic resonance imaging (MRI) should be performed.
Enlargement of the pulmonary artery. Enlargement of the pulmonary artery in pulmonary hypertension, pulmonary artery stenosis and left-to-right shunts produces a prominent bulge on the left-hand border of the mediastinum below the aortic knuckle.
Calcification
Calcification in the cardiovascular system occurs because of tissue degeneration. Calcification is visible on a lateral or a penetrated PA film, but is best studied with computed tomography (CT) scanning.
Lung fields
Pulmonary plethora results from left-to-right shunts (e.g. atrial or ventricular septal defects). It is seen as a general increase in the vascularity of the lung fields and as an increase in the size of hilar vessels (e.g. in the right lower lobe artery), which normally should not exceed 16 mm diameter.
Pulmonary oligaemia is a paucity of vascular markings and a reduction in the width of the arteries. It occurs in situations where there is reduced pulmonary blood flow, such as pulmonary embolism, severe pulmonary stenosis and Fallot’s tetralogy.
Pulmonary hypertension may result from pulmonary embolism, chronic lung disease or chronic left heart disease, e.g. left ventricular failure or mitral valve disease such as shunts due to a ventricular septal defect or mitral valve stenosis. In addition to X-ray features of these conditions, the pulmonary arteries are prominent close to the hila but are reduced in size (pruned) in the peripheral lung fields. This pattern is usually symmetrical. Normal pulmonary capillary pressure is 5–14 mmHg at rest. Mild pulmonary capillary hypertension (15–20 mmHg) produces isolated dilatation of the upper zone vessels.
Interstitial oedema occurs when the pressure is between 21 and 30 mmHg. This manifests as fluid collections in the interlobar fissures, interlobular septa (Kerley B lines) and pleural spaces. This gives rise to indistinctness of the hilar regions and haziness of the lung fields.
Alveolar oedema occurs when the pressure exceeds 30 mmHg, appearing as areas of consolidation and mottling of the lung fields (Fig. 14.15) and pleural effusions. Patients with long-standing elevation of the pulmonary capillary pressure have reactive thickening of the pulmonary arteriolar intima, which protects the alveoli from pulmonary oedema. Thus, in these patients the pulmonary venous pressure may increase to well above 30 mmHg before frank pulmonary oedema develops.
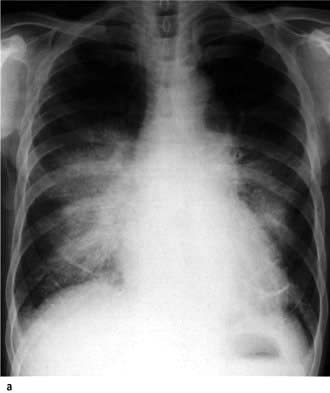
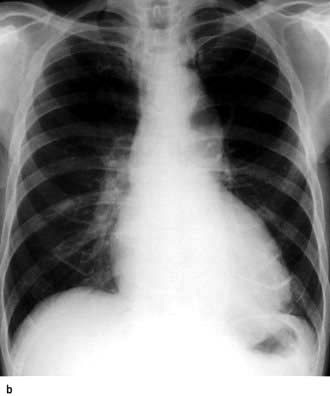
Figure 14.15 Acute pulmonary oedema. This pair of chest X-rays were taken from a patient before (a) and after (b) treatment of acute pulmonary The X-ray taken when the oedema was present demonstrates hilar haziness, Kerley B lines, upper lobe venous engorgement and fluid in the right horizontal interlobar fissure. These abnormalities are resolved on the film taken after successful treatment.
Electrocardiography
The electrocardiogram (ECG) is a recording of the electrical activity of the heart. It is the vector sum of the depolarization and repolarization potentials of all myocardial cells (see Fig. 14.2, p. 670). At the body surface these generate potential differences of about 1 mV, and the fluctuations of these potentials create the familiar P-QRS-T pattern. At rest the intracellular voltage of the myocardium is polarized at −90 mV compared with that of the extracellular space. This diastolic voltage difference occurs because of the high intracellular potassium concentration, which is maintained by the sodium potassium pump despite the free membrane permeability to potassium. Depolarization of cardiac cells occurs when there is a sudden increase in the permeability of the membrane to sodium. Sodium rushes into the cell and the negative resting voltage is lost (phase 0 in Fig. 14.37, p. 698). The depolarization of a myocardial cell causes the depolarization of adjacent cells and, in the healthy heart, the entire myocardium is depolarized in a coordinated fashion. During repolarization, cellular electrolyte balance is slowly restored (phases 1, 2 and 3). Slow diastolic depolarization (phase 4) follows until the threshold potential is reached. Another action potential then follows.
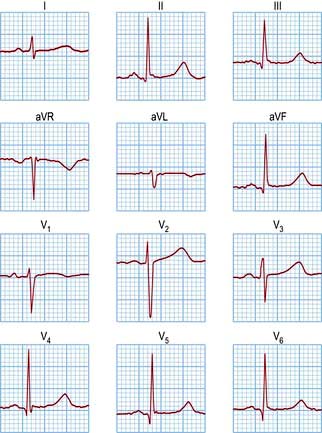
The ECG is recorded from two or more simultaneous points of skin contact (electrodes). When cardiac activation proceeds towards the positive contact, an upward deflection is produced on the ECG. Correct representation of a three-dimensional spatial vector requires recordings from three mutually perpendicular (orthogonal) axes. The shape of the human torso does not make this easy, so the practical ECG records 12 projections of the vector, called ‘leads’ (Fig. 14.16).
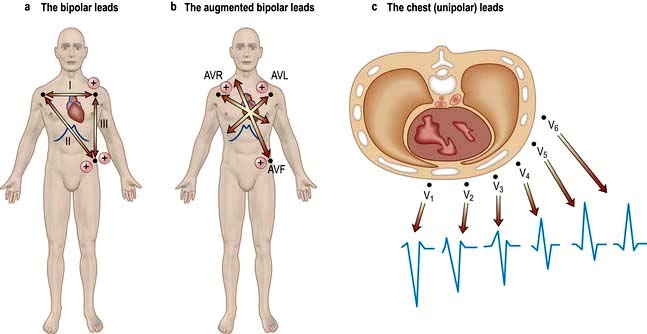
Six of the leads are obtained by recording voltages from the limbs (I, II, III, AVR, AVL and AVF). The other six leads record potentials between points on the chest surface and an average of the three limbs: RA, LA and LL. These are designated V1–V6 and aim to select activity from the right ventricle (V1–V2), interventricular septum (V3–V4) and left ventricle (V5–V6). Note that leads AVR and V1 are oriented towards the cavity of the heart, leads II, III and AVF face the inferior surface, and leads I, AVL and V6 face the lateral wall of the left ventricle. A V4 on the right side of the chest (V4R) is occasionally useful (e.g. for the diagnosis of right ventricular infarction).
Most ECG machines are simultaneous three-channel recorders with output either as a continuous strip or with automatic channel switching. Many ECG machines also analyse the recordings and print the analysis on the record. Usually the machine interpretation is correct, but many arrhythmias still defy automatic analysis.
The ECG waveform
The shape of the normal ECG waveform (Fig. 14.17) has similarities, whatever the orientation. The first deflection is caused by atrial depolarization, and it is a low-amplitude slow deflection called a P wave. The QRS complex reflects ventricular activation or depolarization and is sharper and larger in amplitude than the P wave. An initial downward deflection is called the Q wave. An initial upward deflection is called an R wave. The S wave is the last part of ventricular activation. The T wave is another slow and low-amplitude deflection that results from ventricular repolarization.
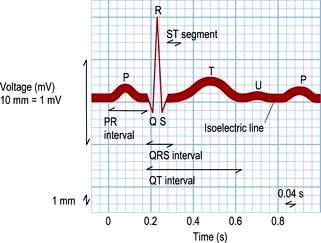
The PR interval is the length of time from the start of the P wave to the start of the QRS complex. It is the time taken for activation to pass from the sinus node, through the atrium, AV node and His–Purkinje system to the ventricle.
The QT interval extends from the start of the QRS complex to the end of the T wave. This interval represents the time taken to depolarize and repolarize the ventricular myocardium. The QT interval varies greatly with heart rate and is often represented as a corrected QT interval (or QTc) for a given heart rate. There are a number of formulae for derivation of QTc, but the most widely accepted are Bazett’s formula and Fridericia’s correction (Table 14.4).
Table 14.4 Normal ECG intervals
P wave duration |
≤0.12 s |
PR interval |
0.12–0.22 s |
QRS complex duration |
≤0.10 s |
Corrected QT (QTc) |
≤0.44 s in males |
≤0.46 s in female |
|
QTcB = QT√2 (R – R) |
Bazett’s square root formula |
QTcF = QT√3 (R – R) |
Fridericia’s cube root formula |
An abnormally prolonged QTc can predispose to a risk of dangerous ventricular arrhythmias. Prolongation of QT interval may be congenital or can occur in many acquired conditions (see Table 14.12, p. 709).
The ST segment is the period between the end of the QRS complex and the start of the T wave. In the normal heart, all cells are depolarized by this phase of the ECG, i.e. the ST segment represents ventricular repolarization.
A normal 12-lead ECG is shown in Figure 14.18, and the normal values for the electrocardiographic intervals are indicated in Table 14.4. Leads that face the lateral wall of the left ventricle have predominantly positive deflections, and leads looking into the ventricular cavity are usually negative. Detailed patterns depend on the size, shape and rhythm of the heart and the characteristics of the torso.
Cardiac vectors
At any point in time during depolarization and repolarization, electrical potentials are being propagated in different directions. Most of these cancel each other out and only the net force is recorded. This net force in the frontal plane is known as the cardiac vector.
The mean QRS vector can be calculated from the six standard leads (Fig. 14.19):
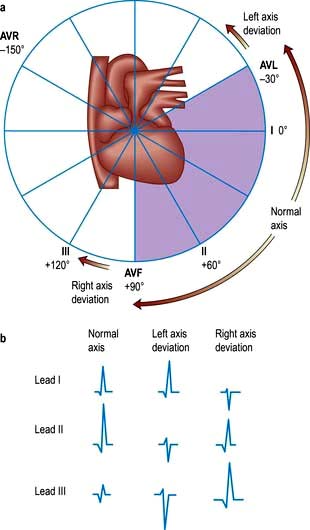
Figure 14.19 Cardiac vectors. (a) The hexaxial reference system, illustrating the six leads in the frontal plane, e.g. lead I is 0°, lead II is +60°, lead III is +120°. (b) Calculating the direction of the cardiac vector. In the first column the QRS complex with zero net amplitude (i.e. when the positive and negative deflections are equal) is seen in lead III. The mean QRS vector is therefore perpendicular to lead III and is either −150° or +30°. Lead I is positive, so the axis must be +30°, which is normal. In left axis deviation (second column) the main deflection is positive (R wave) in lead I and negative (S wave) in lead III. In right axis deviation (third column) the main deflection is negative (S wave) in lead I and positive (R wave) in lead III. The frontal plane QRS axis is normal only if the QRS complexes in leads I and II are predominantly positive.
Calculation of this vector is useful in the diagnosis of some cardiac disorders.
Exercise electrocardiography
This is less used than previously (see p. 730) because of its low sensitivity. The ECG is recorded whilst the patient walks or runs on a motorized treadmill. The test is based upon the principle that exercise increases myocardial demand on coronary blood supply, which may be inadequate during exercise, and at peak stress can result in relative myocardial ischaemia. Most exercise tests are performed according to a standardized method, e.g. the Bruce protocol. Recording an ECG after exercise is not an adequate form of stress test. Normally there is little change in the T wave or ST segment during exercise.
The patient’s exercise capacity (the total time achieved) will depend on many factors; however, patients who can only exercise for <6 min generally have a poorer prognosis.
Myocardial ischaemia provoked by exertion results in ST segment depression (>1 mm) in leads facing the affected area. The form of ST segment depression provoked by ischaemia is characteristic: it is either planar or shows down-sloping depression (Fig. 14.20). Up-sloping depression is a nonspecific finding. The degree of ST segment depression is positively correlated to the degree of myocardial ischaemia.
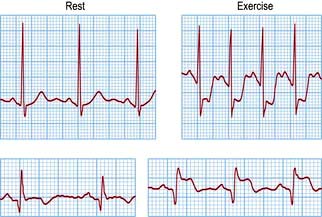
Figure 14.20 Electrocardiographic changes during exercise test. Upper trace: significant horizontal ST segment depression during exercise. Lower trace: ST elevation during exercise.
ST segment elevation during an exercise test is induced much less frequently than ST depression. When it occurs, it reflects transmural ischaemia caused by coronary spasm or critical stenosis.
Although most abnormalities are detected in leads V5 (anterior and lateral ischaemia) or AVF (inferior ischaemia), it is best to record a full 12-lead ECG. During an exercise test the blood pressure and rhythm responses to exercise are also assessed. Exercise normally causes an increase in heart rate and blood pressure. A sustained fall in blood pressure usually indicates severe coronary artery disease. A slow recovery of the heart rate to basal levels has also been reported to be a predictor of mortality.
Frequent premature ventricular depolarizations during the test are associated with a long-term increase in the risk of death from cardiovascular causes and further testing is required in these patients. Use of the exercise test in angina is described on page 682.
24-Hour ambulatory taped electrocardiography
This records transient changes such as a brief paroxysm of tachycardia, an occasional pause in the rhythm, or intermittent ST segment shifts (Fig. 14.21). A conventional 12-lead ECG is recorded in less than a minute and usually samples less than 20 complexes. In a 24-hour period, over 100 000 complexes are recorded. Such a large amount of data must be analysed by automatic or semi-automatic methods. This technique is called ‘Holter’ electrocardiography after its inventor.
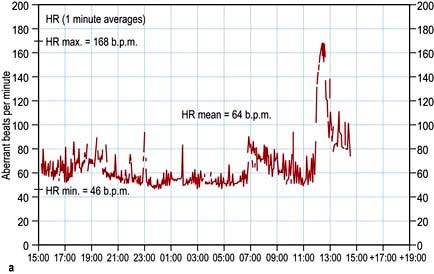
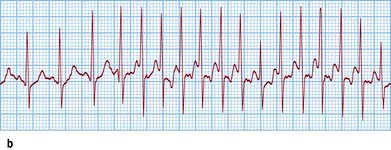
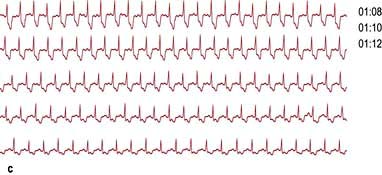
Figure 14.21 Examples of Holter recordings. (a) Tachograph showing sudden increase in heart rate between 11:00 and 13:00 h. (b) Ambulatory ECG record of the same patient, revealing supraventricular tachycardia. (c) Ambulatory ECG showing ST depression in a patient with silent myocardial ischaemia.
Event recording is another technique that is used to record less frequent arrhythmias. The patient is provided with a pocket-sized device that can record and store a short segment of the ECG. The device may be kept for several days or weeks until the arrhythmia is recorded. Most units of this kind will also allow transtelephonic ECG transmission so that the physician can determine the need for treatment or the continued need for monitoring.
A very small event recorder, known as an implantable loop recorder (ILR), can also be implanted subcutaneously, triggered by events or a magnet, and interrogated by the physician.
Other tests
Non-invasive methods that make use of digitalized Holter recordings to identify increased risk of ventricular arrhythmias include assessment of heart rate variability, signal averaged ECG (SAECG) and T wave alternans.
Heart rate variability (HRV) can be assessed from a 24 hour ECG. HRV is decreased in some patients following myocardial infarction and represents an abnormality of autonomic tone or cardiac responsiveness. Low HRV is a major risk factor for sudden death and ventricular arrhythmias in patients discharged from hospital following myocardial infarction.
Signal-averaged ECG (SAECG) is a technique that requires amplification and averaging of abnormal low-amplitude signals which occur beyond the end of the QRS complex and extend well into the ST segment. These signals are therefore also known as late potentials and are too small to be detected on a surface ECG. They arise in areas of slow conduction in the myocardium, such as the border zone of an infarct, where re-entrant ventricular arrhythmias can originate.
T wave alternans (TWA) is a valuable technique used as a non-invasive marker of susceptibility to ventricular arrhythmias and sudden cardiac death. TWA represents microvolt level changes in the morphology of the T waves in every other beat and can be detected during acute myocardial ischaemia using amplification techniques. Visible TWA on an ordinary surface ECG is quite a rare phenomenon, except in patients with long QT syndromes, particularly during emotion or exercise.
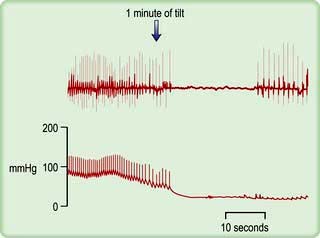
Tilt testing
Patients with suspected neurocardiogenic (vasovagal) syncope should be investigated by upright tilt testing. The patient is secured to a table which is tilted to +60° to the vertical for ≥45 minutes. The ECG and blood pressure are monitored throughout. If neither symptoms nor signs develop, isoprenaline may be slowly infused or glyceryl trinitrate inhaled and the tilt repeated. A positive test results in hypotension, sometimes bradycardia (Fig. 14.22) and pre-syncope/syncope, and supports the diagnosis of neurocardiogenic syncope. If symptoms and signs appear, placing the patient flat can quickly reverse them. The effect of treatment can be evaluated by repeating the tilt test, but it is not always reproducible. The overall sensitivity, specificity and reproducibility is low.
Carotid sinus massage
Carotid sinus massage (Practical Box 14.3) may lead to asystole (>3 s) and/or a fall of systolic blood pressure (>50 mmHg). This hypersensitive response occurs in many of the normal (especially elderly) population, but may also be responsible for loss of consciousness in some patients with carotid sinus syndrome (p. 676). In one-third of cases, carotid sinus massage is only positive when the patient is standing. Atherosclerosis can cause narrowing and stenosis of carotid arteries. Carotid sinus massage should thus be avoided in patients with carotid bruits.
Practical Box 14.3
Carotid sinus massage
Ensure there is no significant carotid artery disease (carotid bruits).
Provide continuous electrocardiographic monitoring.
Patient is in supine position with the head slightly extended.
Start with right carotid sinus massage.
Apply firm rotary pressure to the carotid artery at the level of the third cervical vertebra for 5 s.
Alternatively, steady pressure can be applied.
If no response, massage left carotid sinus.
Generally, right carotid sinus massage decreases the sinus node discharge, and left carotid sinus massage slows atrioventricular conduction.
Do not massage both carotid sinuses at the same time.
Single application of carotid sinus pressure may be effective in about 20–30% of patients with paroxysmal supraventricular tachycardias; multiple applications can terminate tachycardia in about 50% of patients.
Echocardiography
Echocardiography is a non-invasive diagnostic technique that is widely used in clinical cardiology. It involves the use of ultrasound (either alone or with contrast agent) to assess cardiac structure and function. A physician or technician performs the studies and a comprehensive examination takes 15–45 minutes. The ultrasound machines are either mobile on wheels, or are handheld.
Physics
Echocardiography uses transmitted ultrasound wavelengths of ≤1 mm, which correspond to frequencies of approximately ≥2 MHz (≥2 million cycles per second). At such high frequencies, the ultrasound waves can be focused into a ‘beam’ and aimed at a particular region of the heart. The waves are generated in very short bursts or pulses a few microseconds long by a crystal transducer, which also detects returning echoes and converts them into electrical signals.
When the handheld crystal transducer is placed on the body surface the emitted ultrasound pulses encounter interfaces between various body tissues as they pass through the body. In crossing each interface, some of the wave energy is reflected, and if the beam path is approximately at right angles to the plane of the interface, the reflected waves return to the transducer as an echo. Since the velocity of sound in body tissues is almost constant (1550 m/s), the time delay for the echo to return measures the distance of the reflecting interface. Thus, if a single ultrasound pulse is transmitted, a series of echoes return, the first of which is from the closest interface.
Echocardiographic modalities
M mode and two-dimensional echocardiography
M-mode echocardiography is a technique that details the changing motion of structures along the ultrasound beam with time. Thus the motion of the interventricular septum during the cardiac cycle (either towards or away from the transducer placed on the chest wall) can be assessed and quantified. Stationary structures thus generate horizontal straight lines, the distances of which from the top of the screen indicate their depths, and movements, such as those of heart valves, are indicated by zigzag lines (Fig. 14.23c). Alternatively, a series of views from different positions can be obtained in the form of a two-dimensional image (cross-sectional 2-D echocardiography) (Fig. 14.23a,b). This method is useful for delineating anatomical structures and for quantifying volumes of cardiac chambers. M mode can be used to estimate LV systolic function by comparing end-diastolic and end-systolic dimensions. For example, the percentage reduction in the left ventricular cavity size (‘shortening fraction’ – SF) is given by:
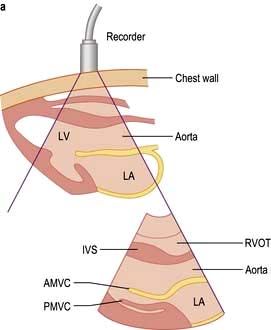
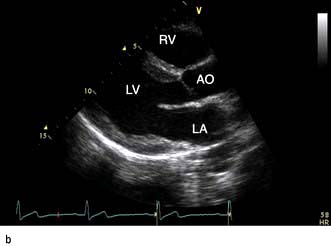
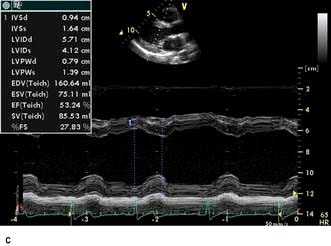
Figure 14.23 Echocardiograms. (a) Diagram showing the anatomy of the area scanned and a diagrammatic representation of the echocardiogram. (b) and (c) Echocardiograms from a normal subject: (b) Two-dimensional long-axis view. (c) M-mode recording with the ultrasound beam directed across the left ventricle, just below the mitral valve. AMVC, anterior mitral valve cusp; AO, aorta; IVS, interventricular septum; LA, left atrium; LV, left ventricle; LV(d), LV(s), left ventricular end-diastolic and end-systolic dimensions; MV, mitral valve; PM, papillary muscle; PMVC, posterior mitral valve cusp; PVW, posterior ventricular wall; RA, right atrium; RV, right ventricle; RVOT, right ventricular outflow tract.
where LVDD is left ventricular diastolic diameter and LVSD is left ventricular systolic diameter, at the base of the heart. The normal range is 30–45%.
This method is easy to perform, but is an inaccurate measure of ejection fraction (EF) because it does not take account of reduced regional function of the mid or apical myocardium, due to infarction for example. For this reason, estimation of EF based upon the difference in LV volumes from systole to diastole, derived from planimetered measurements of LV area in at least two planes, is more accurate. A normal EF is >55%. This method is helpful in assessing the response of the patient with heart failure to therapy. It also permits estimation of LV mass.
Three-dimensional echocardiography
Three-dimensional echocardiography is a novel development in cardiac imaging in which a volumetric dataset is acquired using a multiplane probe rotating around a fixed axis. Clinical uses include accurate volumetric assessment of ventricular function and mass, assessment of mitral and aortic valve disease and assessment of adult congenital heart disease (Fig. 14.24).
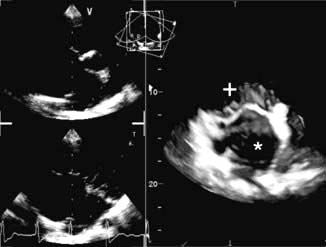
Figure 14.24 3-D Echocardiograph in a patient with an atrial septal defect (*). The mitral valve (+) and the left atrial anatomy are well delineated.
(AVI available online: http://www.asecho.org/files/3D.pdf.)
Doppler echocardiography
Echocardiography imaging utilizes echoes from tissue interfaces. Using high amplification, it is also possible to detect weak echoes scattered by small targets, including those from red blood cells. Blood velocity in the heart chambers is typically much more rapid (>1 m/s) than the movement of myocardial tissue. If the blood is moving in the same direction as the direction of the ultrasound beam, the frequency of the returning echoes will be changed according to the Doppler phenomenon. The Doppler shift frequency is directly proportional to the blood velocity. Blood velocity data can be acquired and displayed in several ways.
Pulsed-wave (PW) Doppler extracts velocity data from the pulse echoes used to form a 2-D image and gives useful qualitative information. PW echoes can be specified from locations within an image identified by a sample volume cursor placed on the screen. Such information from the left ventricular outflow tract (LVOT) and right ventricular outflow tract provides the stroke distance, and is used to estimate cardiac output (CO) and also to quantify intracardiac shunts.
Cardiac output can then be derived using the formula: CO = stroke volume × heart rate. Stroke volume is the stroke distance multiplied by the area of the LVOT, which can also be measured echocardiographically. PW Doppler of the flow across the mitral valve and into the left atrium through the pulmonary veins can be used as part of the estimation of left ventricular filling pressure.
Colour flow Doppler. Doppler colour flow imaging uses one colour for blood flowing towards the transducer and another colour for blood flowing away. This technique allows the direction, velocity and timing of the flow to be measured with a simultaneous view of cardiac structure and function. Colour flow Doppler is used to help assess valvular regurgitation (Fig. 14.25) and may be useful in the assessment of coronary blood flow.
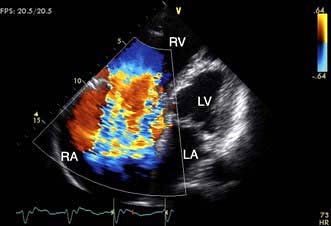
Figure 14.25 Colour Doppler shows blood flowing away from the echocardiography probe as a blue signal and towards the probe as a red signal. In this patient with tricuspid regurgitation, blood leaks from the right ventricle to the right atrium during cardiac systole.
Continuous-wave (CW) Doppler collects all the velocity data from the path of the beam and analyses it to generate a spectral display. This is unlike PW Doppler, which provides information from a particular sample volume at one location along a line. Thus, CW Doppler does not provide any depth information.
The outline of the envelope of the spectral display is used to estimate the value of peak velocity throughout the cardiac cycle. CW Doppler is used typically to assess valvular obstruction, which then causes increased velocities. For example, normal flow velocities are of the order of 1 m/s across the normal aortic valve, but if there is a severe obstructive lesion, such as a severely stenotic aortic valve, velocities of 4 m/s or more can occur. These velocities are generated by the pressure gradient that exists across the lesion.
According to the Bernoulli equation, the pressure difference between two chambers is calculated as: 4 multiplied by the square of the CW Doppler velocity between chambers. Thus a velocity of 5 m/s across the aortic valve suggests a peak gradient of 4 × 5 × 5 = 100 mmHg between the ascending aorta and the left ventricle. This equation has been validated in a wide variety of clinical situations, including valve stenoses, ventricular septal defects and intraventricular obstruction (as in hypertrophic cardiomyopathy). It is often clinically unnecessary to resort to invasive methods such as cardiac catheterization to measure intracardiac pressure gradients.
Similarly, pulmonary artery (PA) systolic pressure and right ventricular diastolic pressure can be calculated using the Bernoulli equation. In this case, CW Doppler tracing of the tricuspid regurgitant jet is used to estimate the pressure gradient between the right ventricle and the right atrium. The PA systolic pressure is then calculated by adding the estimated right atrial pressure to the pressure gradient between the right ventricle and the right atrium.
Tissue Doppler is similar to PW Doppler. It measures myocardial tissue velocities within a particular sample volume placed on the image. Such velocities are of the order of 1 cm/s. Currently, tissue Doppler of the mitral annulus is used as part of the estimation of left ventricular filling pressure.
Other ultrasound modalities. Harmonic power Doppler, pulse inversion Doppler and ultraharmonics are used to detect and amplify microsphere-specific signals as part of the echocardiographic assessment of myocardial perfusion.
Transoesophageal echocardiography (TOE)
A transducer mounted on a flexible tube is placed into the oesophagus. This involves the use of local anaesthesia and sometimes intravenous sedation. High-resolution images can be obtained because of the close proximity of the heart to the transducer in the oesophagus, and also because of the higher frequencies that are used relative to transthoracic imaging. TOE is most commonly used in the assessment of valve structure and function (to assess for reparability of mitral valve prolapse), for features and complications of infective endocarditis, to assess the aorta for aortic dissection and to assess for a cardiac source of embolus.
Wall motion stress echocardiography
Echocardiography can be used clinically to evaluate the patient for the presence of myocardial scars and of reversible ischaemia. Since ultrasound cannot directly detect red blood cells in capillaries, myocardial wall motion is used as a surrogate for perfusion. Myocardial segments that demonstrate a change in function (defined as a change or reduction in thickening) from rest to stress can be assumed to be supplied by a flow-limiting stenosis in the epicardial artery or graft.
Stress for this indication needs to be inotropic to induce true ischaemia. Physiological stress includes treadmill exercise, which is complicated by the difficulty in obtaining reliable images rapidly as the patient comes off the treadmill, before heart rate reduces back to sub-maximal levels. Alternatively, pharmacological stress can be induced with dobutamine at graded doses. This is relatively safe but complications such as ventricular arrhythmia have been reported. This technique can also be used to assess for viability of the myocardium and for hibernating or stunned myocardium (p. 721).
Myocardial perfusion echocardiography
In order to assess myocardial perfusion by echocardiography (MPE), microspheres of similar size to red blood cells are used as an intravenous contrast agent. Microsphere-specific ultrasound modes such as harmonic power Doppler can be used for detection. MPE involves the use of intravenous infusion of contrast to fill the myocardium. A pulse of ultrasound destroys microspheres within the capillaries (and not the LV cavity), and the time taken to replenish the capillaries is a measure of myocardial blood flow. The time taken to fill should be significantly shorter at stress than at rest.
Contrast echo for LV opacification
Intravenous contrast agents opacify the left ventricle and can define the endocardial border. Their clinical utility has reduced with the advent of harmonic imaging, which has improved image quality in previously ‘difficult to image’ patients.
FURTHER READING
Hung J, Lang R, Flachskampf F et al. 3D Echocardiography: a review of the current status and future directions. J Am Soc Echocardiogr 2007; 20:213–233.
Quinones MA, Otto CM, Stoddard M et al. Recommendations for quantification of Doppler echocardiography: a report from the Doppler Quantification Task Force of the Nomenclature and Standards Committee of the American Society of Echocardiography. J Am Soc Echocardiogr 2002; 15:167–184.
Nuclear imaging
Nuclear imaging is used to detect myocardial infarction or to measure myocardial function, perfusion or viability, depending on the radiopharmaceutical used and the technique of imaging. These data are particularly valuable when used in combination. All involve a significant radiation dose (p. 688).
Image type
Gamma cameras produce a planar image in which structures are superimposed as in a standard radiograph. Single-photon-emission computed tomography (SPECT) imaging uses similar raw data to construct tomographic images, just as a CT image is reconstructed from X-rays. This gives finer anatomical resolution, but is technically demanding. These methods may be used with any of the radiopharmaceuticals.
Myocardial perfusion and viability
Thallium-201 is rapidly taken up by the myocardium, so an image taken immediately after injection reflects the distribution of blood flow to the myocardium. Areas of ischaemia or infarction receive less 201Tl and appear dark. Between 2 and 24 h after injection, 201Tl is redistributed so that all cardiac myocytes contain a comparable concentration. Images at this time show dark areas where the myocardium has infarcted, but normal density in ischaemic areas. Comparison of the early and late images is one method of predicting whether an ischaemic area of myocardium contains enough viable tissue to justify coronary bypass or angioplasty. Technetium-99-labelled tetrofosmin (Fig. 14.26) is also taken up rapidly by cardiac myocytes, but does not undergo redistribution. When this substance is injected during exercise, its distribution in the myocardium reflects the distribution of blood at the time of the exercise, even if the image is taken several hours later. This is a sensitive method of detecting myocardial viability. Images produced following injection of [99mTc]tetrofosmin during exercise can be compared to images produced following injection at rest to decide which areas of ischaemia are reversible (p. 721). In patients unable to exercise, the heart can be stressed with drugs, e.g. dipyridamole or dobutamine.
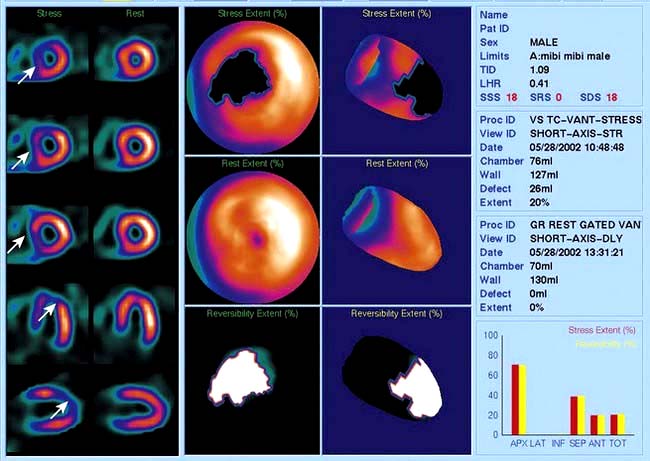
Figure 14.26 Myocardial SPECT study acquired with [99mTc]tetrofosmin tracer. Left panel: three short-axis slices, a horizontal and a vertical axis plane of the left ventricle after stress and following a resting re-injection of tracer. The rest images demonstrate normal tracer uptake (orange signal) in the whole of the left ventricle. The stress images demonstrate reduced tracer uptake (arrows; purple-blue signal) in the anterior and septal walls consistent with a significant stenosis in the left anterior descending artery. Middle panel: polar maps of the whole myocardium can localize the ischaemic territory. Right panel: quantitative analysis can help define the extent and reversibility of the ischaemia.
Infarct imaging
Perfusion images produced using compounds labelled with 201Tl or [99mTc]sestamibi show a myocardial infarction as a perfusion defect or ‘cold spot’. These methods are sensitive for detecting and localizing the infarct, but give no information about its age. [99mTc]Pyrophosphate is preferentially taken up by myocardium which has undergone infarction within the previous few days. Images are difficult to interpret because the isotope is also concentrated by bone and cartilage.
Cardiac computed tomography
Computed tomography is useful for the assessment of the thoracic aorta and mediastinum. The development of 64-slice multidetector CT (MDCT) scanners has enabled accurate non-invasive imaging of the coronary arteries.
Coronary artery calcification
Calcium is absent in normal coronary arteries but is present in atherosclerosis and increases with age. Studies have demonstrated a positive correlation between calcification and the presence of coronary artery stenoses, although the relationship is non-linear. Electron beam CT (EBT) and MDCT scanners are used to obtain multiple thin axial slices through the heart and then the calcium score is calculated. The calcium score is based on the X-ray attenuation coefficient or CT number measured in Hounsfield units. Meta-analyses have demonstrated that a higher calcium score is associated with higher event rate and higher relative risk ratios, although currently no study has shown a net effect on health outcomes of calcium scoring. The current NICE chest pain guidelines recommend the use of CT calcium scoring in patients with chest pain and a 10–29% likelihood of coronary artery disease (p. 730).
FURTHER READING
Budoff MJ, Ashenbach S, Blumenthal RS et al. Assessment of coronary artery disease by cardiac computed tomography: a scientific statement from the American Heart Association Committee on Cardiovascular Imaging and Intervention, Council on Cardiovascular Radiology and Intervention, and Committee on Cardiac Imaging, Council on Clinical Cardiology. Circulation 2006; 114:1761–1791.
Hundley WG, Bluemke DA, Finn JP et al.; American College of Cardiology Foundation Task Force on Expert Consensus Documents. ACCF/ACR/AHA/NASCI/SCMR 2010 expert consensus document on cardiovascular magnetic resonance: a report of the American College of Cardiology Foundation Task Force on Expert Consensus Documents. Circulation 2010; 121; 2462–2508.
SIGNIFICANT WEBSITE
A minimum dataset for a standard transoesphageal echocardiogram from the British Society of Echocardiography Education Committee: http://bsecho.org/TOE%20NEW_Amended%202%20LOW.pdf
CT coronary angiography
CT coronary angiography (CTCA) is performed with a supine patient connected to a 3-lead ECG for cardiac synchronization. The 64-slice MDCT scanners have a temporal resolution of 165–210 ms and image quality is optimal with a slow and steady heart rate (<65–70 b.p.m.), which can be obtained with the use of oral or intravenous beta-blockers. Sublingual nitroglycerin (0.4–0.8 mg dose) may improve visualization of the coronary artery lumen. A volume dataset containing the whole heart is acquired during a single breath-hold with the injection of 60–80 mL of iodinated contrast agent at 4–6 mL/s. The radiation dose during the scan is 11–22 mSv but this can be reduced to 7–11 mSv with ECG-controlled dose modulation; this compares with 2.5–5.0 mSv for diagnostic coronary angiography and 15–20 mSv for SPECT. The volume dataset is then analysed with multiplanar reformatting for the presence of coronary artery stenoses (Fig. 14.27). Recent studies have reported high sensitivity (>85%) and specificity (>90%) for the detection of coronary artery disease with a very high negative predictive value (>95%). CTCA may become part of an acute chest pain service in the emergency medicine department to exclude aortic dissection, pulmonary embolism and coronary artery disease. However CT coronary angiography does expose the patient to ionizing radiation.
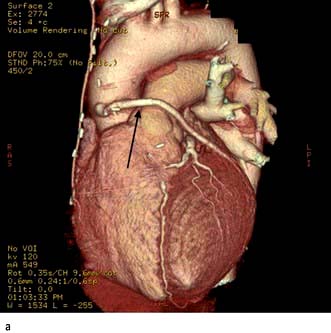
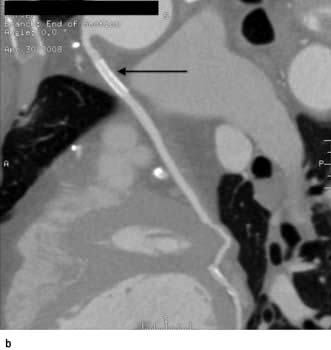
Figure 14.27 Coronary artery stent: multi-slice CT. (a) Volume-rendered image in a patient with coronary artery stent insertion (arrow) in a saphenous vein graft to the native circumflex coronary artery. (b) Multi-planar reformatted image demonstrates the stent patency (arrow) and the insertion of the graft to the circumflex coronary artery.
Cardiovascular magnetic resonance
Cardiovascular magnetic resonance (CMR), a non-invasive imaging technique that does not involve harmful radiation, is increasingly used in the investigation of patients with cardiovascular disease.
CMR is usually performed with multiple breath-holds to minimize respiratory motion artefacts and cardiac gating to reduce blurring during the cardiac cycle. Several different sequences are used to provide anatomical and functional information. Most sequences do not require a contrast agent but intravenous gadolinium may be required for magnetic resonance angiography, myocardial perfusion, infarct and fibrosis imaging. The major contraindications are permanent pacemaker or defibrillator, intracerebral clips and significant claustrophobia. Patients with coronary stents and prosthetic valves can be safely scanned.
Clinical use of CMR
The current indications for CMR are summarized in Table 14.5.
Table 14.5 Cardiovascular magnetic resonance (CMR)
Indications |
Congenital heart disease
CMR provides additional and complementary information to echocardiography in patients with congenital heart disease. Cine imaging can accurately assess systemic and non-systemic ventricular function and mass. Extracardiac conduits, anomalous pulmonary venous return and aortic coarctations pre- and post-repair can be studied by CMR and the studies repeated for long-term follow-up without the risk of ionizing radiation.
Cardiomyopathies, pericardial disease and cardiac masses
In hypertrophic cardiomyopathy CMR accurately defines the extent and distribution of myocardial hypertrophy and can be used in patients with sub-optimal echocardiograms. Intravenous gadolinium can be used to demonstrate regional myocardial fibrosis which is associated with an adverse prognosis. In patients with suspected arrhythmogenic right ventricular cardiomyopathy, CMR is the imaging investigation of choice to detect global and regional wall motion abnormalities of the right ventricle and right ventricular outflow tract, and to detect fatty or fibro-fatty infiltration of the right and left ventricles. In constrictive pericarditis and restrictive cardiomyopathy CMR can demonstrate the effects of the impaired ventricular filling common to both conditions (dilated right atrium and inferior vena cava), but can also determine the thickness of the pericardium (usually 4 mm in normal individuals) (Fig. 14.28). In patients with dilated cardiomyopathy CMR can accurately quantify bi-ventricular function and with gadolinium can demonstrate myocardial fibrosis. In inflammatory and infiltrative conditions of the myocardium, such as myocarditis, sarcoidosis and amyloidosis, CMR is increasingly used as a diagnostic investigation due to different patterns of signal enhancement seen with gadolinium. In patients with thalassaemia, CMR can detect iron deposition within the myocardium and guide chelation therapy. CMR can be useful in patients with cardiac masses to differentiate benign from malignant tumours and to identify thrombus not visualized on echocardiography.
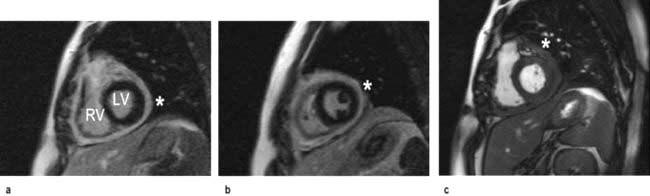
Diseases of the aorta
CMR is an excellent technique for assessing patients with aortic dissection and can detect the clinical features of an aortic dissection; the intimal flap, thrombosis in a false lumen, aortic regurgitation, pericardial effusion and aortic dilatation. As it does not involve radiation or need contrast, CMR is an ideal method of surveillance of patients with dilated thoracic aortas or repaired coarctation.
Valvular heart disease
Valvular stenosis produces signal void on gradient-echo CMR. CMR can quantify the velocity across a stenosed valve using phase-contrast velocity mapping. Valvular regurgitation can be accurately quantified using phase-contrast velocity mapping across the valve, or by calculating the stroke volumes of the left and right ventricle which are equal in the absence of significant regurgitation. However, in most patients, transthoracic and transoesophageal echocardiography should provide sufficient information.
Coronary artery disease
CMR can be used to assess coronary artery anatomy, left ventricular function, myocardial perfusion and viability in a ‘one-stop’ approach to the assessment of patients with coronary artery disease. Coronary artery anatomy and stenoses can be identified with ultra-fast breath-hold or respiratory-gated sequences with high accuracies. Global left ventricular function and wall motion abnormalities can be detected with ciné imaging performed at rest and during dobutamine stress. Myocardial perfusion can be assessed with gadolinium and first-pass imaging; ischaemia can be demonstrated with adenosine for coronary vasodilatation. Myocardial viability can be determined using gadolinium and ‘delayed enhancement’ images. With these techniques CMR is increasingly used both for the assessment of ischaemia in patients with suspected coronary disease and to assess myocardial viability prior to revascularization in patients with impaired cardiac function (Figs 14.29, 14.30).
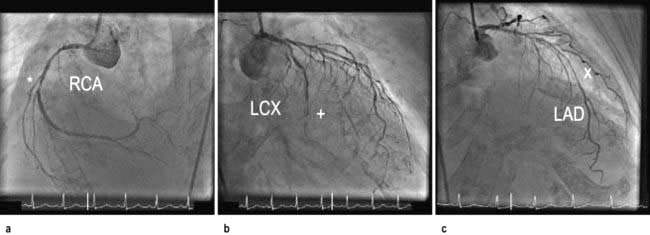
Figure 14.29 Cardiac magnetic resonance (CMR). A diagnostic coronary angiography in a patient with type 2 diabetes mellitus and exertional breathlessness demonstrates a severe stenosis (*) in the right coronary artery (RCA), a sub-totally occluded (+) circumflex coronary artery (LCX), and a long segment of disease (X) in the left anterior descending coronary artery (LAD).
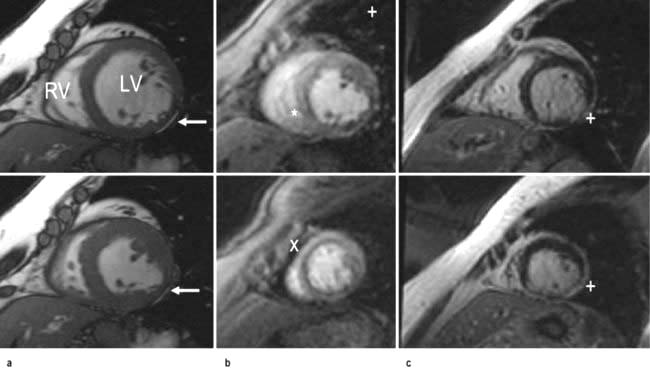
Figure 14.30 Cardiac magnetic resonance (CMR). (a) Short-axis CMR FIESTA ciné imaging (diastole top, systole bottom) demonstrates thinning and hypokinesia of the inferolateral wall (arrows) but with preserved function of the rest of the myocardium. LV, left ventricle; RV, right ventricle. (b) First-pass perfusion CMR (mid top, apex bottom) demonstrates subendocardial perfusion defects in the inferolateral wall (+), infero-septum (*) and apical segments (X). (c) Delayed enhancement CMR confirms a transmural myocardial infarction of the mid-apical infero-lateral wall (+) secondary to a previous infarction from the circumflex coronary artery and confirms inducible ischaemia in the right and left coronary territories.
Positron emission tomography (PET)
This is a technique based on detection of high-energy emissions caused by annihilation of positrons released from unstable isotopes. There are several advantages of PET over other techniques, e.g. improved spatial resolution, accurate quantification, the use of biological isotopes of carbon, nitrogen and oxygen. However, PET is expensive and requires a cyclotron to produce the short-lived tracers. PET has become a useful investigation in the detection of viable myocardium in patients who are suitable for revascularization.
Myocardial perfusion and ischaemia can be determined using PET with 13N-ammonia or oxygen-15 with greater sensitivity than SPECT. Myocardial metabolism and viability can be detected with the use of 18F-fluorodeoxyglucose (FDG), which the cardiac myocyte utilizes for energy production in the presence of reduced oxygen supply and blood flow. There may be reduced perfusion to infarcted or fibrotic myocardium, but also reduced FDG uptake. In hibernating myocardium, with viable but dysfunctional myocardium, PET can demonstrate reduced myocardial perfusion but with preserved or increased FDG uptake.
Cardiac catheterization
Cardiac catheterization is the introduction of a thin radio-opaque tube (catheter) into the circulation. The right heart is catheterized by introducing the catheter into a peripheral vein (usually the right femoral or internal jugular vein) and advancing it through the right atrium and ventricle into the pulmonary artery. The pressures in the right heart chambers, and pulmonary artery can be measured directly. An indirect measure of left atrial pressure can be obtained by ‘wedging’ a catheter into the distal pulmonary artery (p. 874). In this position the pressure from the right ventricle is obstructed by the catheter and only the pulmonary venous and left atrial pressures are recorded. Left heart catheterization is usually performed via the right femoral or radial artery. A pigtail catheter is advanced up the aorta and manipulated through the aortic valve into the left ventricle. Pressure tracings are taken from the left ventricular cavity. The end-diastolic pressure is invariably elevated in patients with left ventricular dysfunction. A power injection of radio-opaque contrast material is used to opacify the left ventricular cavity (left ventriculography) and thereby assesses left ventricular systolic function. The catheter is then withdrawn across the aortic valve into the aorta and the ‘pullback’ gradient across the valve is measured. Aortography (a power injection into the aortic root) can be performed to assess the aortic root and the presence and severity of aortic regurgitation. Specially designed catheters are then used to selectively engage the left and right coronary arteries, and contrast ciné-angiograms are taken in order to define the coronary circulation and identify the presence and severity of any coronary artery disease. During the procedure intracoronary nitrate or adenosine may be used to dilate the coronary arteries. During cardiac catheterization, blood samples may be withdrawn to measure the oxygen content. These estimations are used to quantify intracardiac shunts and measure cardiac output.
Therapeutic procedures
Cardiac resuscitation
When cardiac arrest occurs, basic life support must be started immediately. The longer the period of respiratory and circulatory arrest, the lower is the chance of restoring healthy life. The chain of survival (Fig. 14.31) includes early recognition of cardiac arrest; early activation of emergency services; early cardiopulmonary resuscitation (CPR); early defibrillation and early advanced life support; and high quality post resuscitation care.
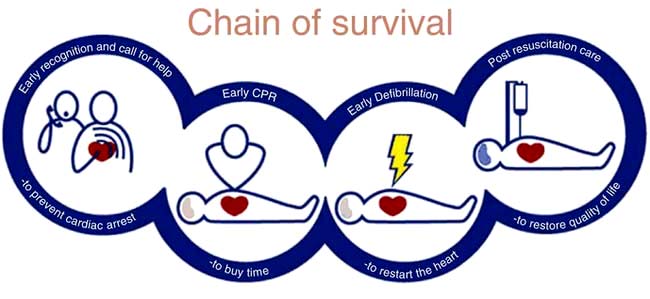
Basic life support (BLS)
The first step is to ensure the safety of the victim and rescuer. The next is to ascertain that the victim is unresponsive by shaking him/her and shouting into one ear. If no response is obtained, help should be sought immediately prior to commencement of basic life support. If the victim has absent or abnormal breathing then cardiac arrest is confirmed and basic life support should be started (Emergency Box 14.1).
 Emergency Box 14.1
Adult basic life support (out of hospital)
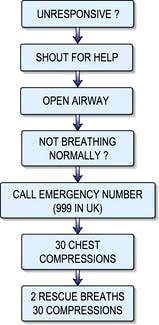
With permission from Resuscitation Council UK; http://www.resus.org.uk.
Airway
Debris (e.g. blood and mucus) in the mouth and pharynx should be removed. Loose or ill-fitting dentures should be removed. The airway should be opened gently by flexing the neck and extending the head (‘sniffing the morning air’ position). This manoeuvre is not recommended if a cervical spine injury is suspected. Any obstruction deep in the oral cavity or upper respiratory tract may require abdominal and/or chest thrusts (Heimlich manoeuvre, in this chapter).
Circulation
Most adult cardiac arrest is due to a primary cardiac disorder, e.g. acute coronary syndrome, and results in circulatory collapse. Pulse detection can be difficult and if the victim is unresponsive with absent or abnormal breathing then external chest compression should be started immediately:
The heel of one hand is placed over the centre of the chest and the heel of the second hand is placed over the first with the fingers interlocked.
The arms are kept straight and the sternum is rhythmically depressed by 5–6 cm at a rate of approximately 100–120/min allowing for complete recoil between compressions.
Chest compressions do not massage the heart. The thorax acts as a pump and the heart provides a system of one-way valves to ensure forward circulation. Respiratory and circulatory support is continued by providing two effective breaths for every 30 cardiac compressions (30 : 2 for one or two persons, 15 : 2 in paediatric patients). Compressions alone is as good as compressions with rescue breaths (American Heart Association updated guidelines). This maintains adequate cerebral and coronary perfusion pressures. There is evidence to suggest that if the person performing compressions tires, the quality of resuscitation deteriorates.
Breathing
After 30 compressions the rescuer opens the victim’s airway by tilting the head backwards (head tilt) and pulling the chin pulled forward (chin lift) or (jaw thrust). The rescuer then pinches the nostrils firmly and takes a deep breath and seals his/her lips around the mouth of the victim. Two effective breaths are given over 1 s each. In paediatric patients respiratory arrests are more common and patients should be given five rescue breaths and a minute of CPR before a sole rescuer leaves the victim to seek help. CPR should not be interrupted to reassess the victim unless they start to show signs of life and start to breathe normally.
Advanced cardiac life support
By the time effective life support has been established, more help should have arrived and advanced cardiac life support can begin. This consists of ECG monitoring, advanced airway management (endotracheal intubation or supraglottic airway tube) and setting up an intravenous infusion in a large peripheral or central vein (an intraosseous needle may be used if i.v. access is not possible). As soon as possible the cardiac rhythm should be established as this determines which pathway of the European Resuscitation Council and the Resuscitation Council UK ACLS Algorithm is followed (Fig. 14.32). This can be determined with an automated external defibrillator (AED), or the paddles or limb leads of a standard defibrillator.
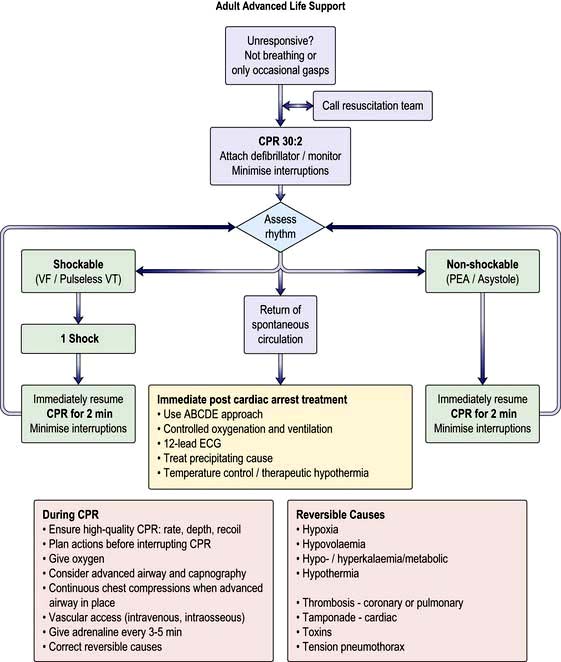
Figure 14.32 Adult advanced life support algorithm. CPR, cardiopulmonary resuscitation; PEA, pulseless electrical activity; VF, ventricular fibrillation.
(Reproduced with permission from the Resuscitation Council: http://www.resus.org.uk/pages/alsalgo.pdf)
If the ECG shows a shockable rhythm – ventricular fibrillation or pulseless ventricular tachycardia then an unsynchronized shock of 150–200 J biphasic (360 J monophasic) is delivered without delay via paddles or self-adhesive pads followed immediately by 2 minutes of CPR. For a non-shockable rhythm – asystole or pulseless electrical activity, 2 minutes of CPR is delivered with 1 mg of intravenous adrenaline (epinephrine).
For both sides of the algorithm, it is necessary to maintain CPR, ensure oxygenation, and to exclude/treat reversible causes – the ‘4 Hs and 4Ts’:
Hypoxia should be minimized by ventilating the patient with oxygen and a bag-valve mask or advanced airway (endotracheal intubation or supraglottic airway tube) insuring that there is bilateral air entry and chest expansion. With an advanced airway CPR should continue with a ventilation rate of 10/minute without interrupting cardiac massage.
Hypovolaemia is a frequent cardiac of pulseless electrical activity due to haemorrhage. Intravenous volume should be replaced.
Hyper- or hypokalaemia may cause ECG abnormalities and should be detected by biochemical testing. Intravenous calcium chloride may be helpful in hyperkalaemia or hypocalcaemia. Acidosis should be managed with effective ventilation.
Hypothermia should be excluded with a low reading thermometer and treated with external or internal warming.
Tension pneumothorax may occur during central venous cannulation or following chest trauma. Clinical diagnosis (deviated trachea, hyperresonant chest, absent breath-sounds, ultrasound) and needle thoracocentesis/thoracostomy may be required.
Tamponade should be excluded with echocardiography and if present treated with pericardiocentesis.
Toxins may have been ingested by accident or deliberate self-harm and specific antidotes should be considered in appropriate patients.
Thromboembolism and massive pulmonary embolism may cause pulseless electrical activity and patients should be considered for intravenous thrombolysis.
Causes of unexpected cardiac arrest
Each year in the UK, there are approximately 100 000 unexpected deaths occurring within 24 hours of the development of cardiac symptoms. About half of these deaths are almost instantaneous. There are several causes (Table 14.6).
Table 14.6 Causes of unexpected cardiac arrest
Most deaths are due to ventricular fibrillation or rapid ventricular tachycardia, and a small proportion are due to severe bradyarrhythmias. Coronary artery disease accounts for approximately 80% of sudden cardiac deaths in western society. Transient ischaemia is suspected as the major trigger factor; however, only a small proportion of survivors have clinical evidence of acute myocardial infarction.
There are two mechanisms of sudden unexpected cardiac arrest:
Ventricular fibrillation or pulseless ventricular tachycardia (VF/VT)
Non-VF/VT (asystole and pulseless electrical activity also known as electromechanical dissociation).
The principal difference in the management of these two groups of arrhythmias is the need for attempted defibrillation in those patients with VF/VT (Fig. 14.32).
Three-quarters of arrests are due to ventricular fibrillation or rapid ventricular tachycardia. Only a very small proportion is due to pulseless electrical activity. The remainder is due to asystole. An agonal rhythm is characterized by an inexorable slowing and widening of the QRS complexes associated with falling blood pressure and cardiac output. This type of arrhythmia is very difficult to reverse and usually no attempt should be made because it is the result rather than the cause of death.
Arrests are treated in the following ways:
Ventricular fibrillation or pulseless ventricular tachycardia is readily treated with IMMEDIATE defibrillation, cardiopulmonary resuscitation (CPR) and drugs. Intravenous amiodarone is the first-line drug in refractory VF/pulseless VT. When treating VF/VT cardiac arrest, adrenaline 1 mg is given after the third shock and then every 3–5 min. Amiodarone 300 mg is also given after the third shock, particularly if VT/VF have recurred after defibrillation.
Asystole is more difficult to treat but the heart may respond to atropine. However atropine is not longer recommended for routine use. More recently, vasopressin has been shown to be successful. If there is any sign of slow electromechanical activity (e.g. bradycardia with a weak pulse), emergency pacing should be used. Continued CPR is critical and drug management is rarely effective.
Pulseless electrical activity: several potentially reversible causes are listed in the universal algorithm (Fig. 14.32). It carries a very poor prognosis. Effective treatment involves continued CPR and addressing the underlying cause.
Defibrillation
This technique is used to convert ventricular fibrillation to sinus rhythm. When the defibrillator is discharged, a high-voltage field envelopes the heart which depolarizes the myocardium and allows an organized heart rhythm to emerge. Electrical energy is discharged through two paddles with gel pads or adhesive pads placed on the chest wall.
The paddles are placed in one of two positions:
One paddle is placed to the right of the upper sternum and the other over the cardiac apex.
One paddle is placed under the tip of the left scapula and the other is placed over the anterior wall of the left chest.
All personnel should stand clear of the patient. The person performing defibrillation has the responsibility for ensuring the safety of the patient and other people present. Conventional defibrillators employ a damped monophasic waveform. Biphasic defibrillators which require less energy are increasingly common. Automated external defibrillators (AEDs) which recognize ventricular fibrillation automatically deliver a shock if indicated. These are available in some public places (in the UK their location is noted by a specific sign as shown). It is the responsibility of all healthcare practitioners to be familiar with the range of defibrillators they may be called on to use in their workplace. Provision of AEDs in residential areas or in the homes of patients at risk has not proved an effective therapy.
Post resuscitation – therapeutic hypothermia
Randomized studies have supported the use of therapeutic hypothermia in unconscious adult patients with spontaneous circulation after an out-of-hospital cardiac arrest due to ventricular fibrillation. These patients should be cooled with careful temperature monitoring to 32–34°C for 12–24 h. External cooling methods include the use of cooling blankets; ice packs to the groin, axillae and neck; wet towels; and a cooling helmet. Invasive methods include intravenous infusions and peritoneal and pleural lavage. Shivering should be prevented by the use of a neuromuscular blocker and sedation to reduce oxygen consumption. Neurological recovery is more favourable in patients with purposeful movements and EEG activity within 3 days of a cardiac arrest.
DC cardioversion (DCC)
Tachyarrhythmias that do not respond to medical treatment or that are associated with haemodynamic compromise (e.g. hypotension, worsening heart failure) may be converted to sinus rhythm by the use of a transthoracic electric shock. A short-acting general anaesthetic or powerful sedation is used. Muscle relaxants are not usually given.
When the arrhythmia has definite QRS complexes, the delivery of the shock should be timed to occur with the downstroke of the QRS complex (synchronization) (Fig. 14.33). The machine being used to perform the cardioversion will do this automatically if the appropriate button is pressed. There is a crucial difference between defibrillation and cardioversion: a non-synchronized shock is used to defibrillate. Accidental defibrillation of a patient who does not require it may itself precipitate ventricular fibrillation.
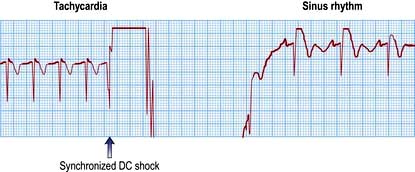
Figure 14.33 DC-cardioversion of a supraventricular tachycardia to sinus rhythm. The direct current shock is delivered synchronously with the QRS complex.
Typical indications for DCC include:
If atrial fibrillation or flutter has been present for >48 hours, it is necessary to anticoagulate the patient adequately for 3 weeks before elective cardioversion to reduce the risk of embolization. Alternatively, cardioversion may be performed if intra-atrial thrombus is ruled out using a transoesophageal echocardiogram. The duration of anticoagulation after successful cardioversion for atrial fibrillation is a complex issue and depends on a number of factors: it should be for at least 4 weeks after the procedure and should be indefinite if risk factors for stroke exist.
Digoxin toxicity may lead to ventricular arrhythmias or asystole following cardioversion. Therapeutic digitalization does not increase the risks of cardioversion, but it is conventional to omit digoxin several days prior to elective cardioversion in order to be sure that toxicity is not present.
Temporary pacing
Therapeutic cardiac pacing is employed in any patient with sustained symptomatic or haemodynamically compromising bradycardia. Bradycardias may be due to either a slow intrinsic heart rate (e.g. sinus node dysfunction) or atrioventricular block. Prophylactic cardiac pacing is employed in asymptomatic patients with either bradycardia or conduction abnormalities in whom the risk of progression to symptomatic bradycardia justifies such a strategy.
Transvenous pacing is the preferred method in patients with symptomatic bradycardias. In summary, a thin (French gauge 5 or 6), bipolar pacing electrode wire is inserted via an internal jugular vein, a femoral vein or a subclavian vein and is positioned at the right ventricular apex using cardiac fluoroscopy. The energy needed for successful pacing (the pacing threshold) is assessed by reducing the energy until the pacemaker fails to stimulate the tissue (loss of capture). The output energy is then set at three times the threshold value to prevent inadvertent loss of capture. If the threshold increases above 5 V, the pacemaker wire should be resited. A temporary pacemaker unit (Fig. 14.34a) is almost always set to work ‘on demand’ – to fire only when a spontaneous beat has not occurred. The rate of temporary pacing is usually 60–80/minute.
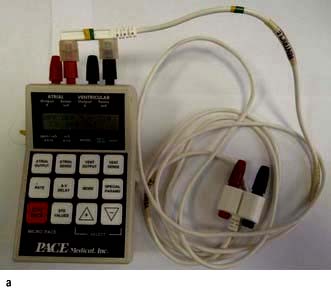
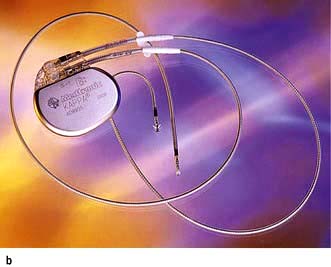
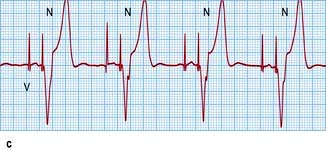
Figure 14.34 Pacemakers. (a) A temporary pacemaker unit. (b) A permanent pacemaker with atrial (placed in the right atrium, usually in its high lateral wall) and ventricular (placed in the right ventricular apex) leads. (c) An electrocardiogram showing dual (atrial and ventricular) chamber pacing. A wide QRS complex results from abnormal activation of the ventricles from the right ventricular apex.
Transcutaneous pacing is the preferred method in selected patients with asymptomatic bradycardia or conduction abnormalities and may be life-saving for patients in whom a cardiac arrest is precipitated by bradycardia. In this method the myocardium is depolarized by current flow between two large adhesive electrodes positioned anteriorly and posteriorly on the chest wall. Transcutaneous pacing is uncomfortable for the conscious patient. However, it can usually be tolerated until a temporary transvenous pacemaker is inserted.
SIGNIFICANT WEBSITE
Resuscitation Council (UK) Resuscitation Guidelines 2010: http://www.resus.org.uk/pages/guide.htm
Permanent pacing
Permanent pacemakers are fully implanted in the body and connected to the heart by one or two electrode leads (Fig. 14.34b). The pacemaker is powered by solid-state lithium batteries, which usually last 5–10 years. Pacemakers are ‘programmable’ in that their operating characteristics (e.g. the pacing rate) can be changed by a programmer that transmits specific electromagnetic signals through the skin. The pacemaker leads are passed transvenously to the right heart chambers.
Pacemakers are designed to both pace and sense either the ventricles or the atria or more commonly both chambers. A single chamber ventricular pacemaker is described as a ‘VVI’ unit because it paces the ventricle (V), senses the ventricle (V) and is inhibited (I) by a spontaneous ventricular signal. Occasionally (e.g. in symptomatic sinus bradycardia), an atrial pacemaker (AAI) may be implanted. Pacemakers that are connected to both the right atrium and ventricle (‘dual chamber’ pacemakers) are used to simulate the natural pacemaker and activation sequence of the heart. This form of pacemaker is called DDD because it paces the two (dual) chambers, senses both (D) and reacts in two (D) ways – pacing in the same chamber is inhibited by spontaneous atrial and ventricular signals, and ventricular pacing is triggered by spontaneous atrial events (Fig. 14.34c).
In addition, pacemakers may be ‘rate responsive’ (R). A rate-responsive pacemaker detects motion (level of vibration or acceleration), respiration, or changes in QT interval, and by employing one or more biosensors, changes its rate of pacing so that it is appropriate to the level of exertion.
The choice of pacemaker mostly depends on the underlying rhythm abnormality and the general condition of the patient. For example, complete heart block in patients with sinus rhythm should be treated with a dual-chamber device in order to maintain AV synchrony, whereas inactive or infirm patients may not benefit from the most sophisticated units. Specialized biventricular pacemakers are used for the treatment of severe heart failure.
Permanent pacemakers are inserted under local anaesthetic using fluoroscopy to guide the insertion of the electrode leads via the cephalic or subclavian veins. Perioperative prophylactic antibiotics are routinely prescribed. The pacemaker is usually positioned subcutaneously in front of the pectoral muscle. Following surgery, which usually takes 60–90 minutes, the patient rests in bed for 6–12 hours before being discharged. Patients may not drive for at least 1 week after implantation, and must inform the licensing authorities and their motor insurers.
Complications are few but can prove to be very difficult to manage, and patients should be referred to the pacemaker clinic. They include the following:
Pericardiocentesis
A pericardial effusion is an accumulation of fluid between the parietal and visceral layers of pericardium. Fluid is removed to relieve symptoms that are due to haemodynamic embarrassment or for diagnostic purposes. This can be a technically difficult procedure, particularly in the acute setting. In an emergency it can be performed at the bedside.
Pericardial aspiration or pericardiocentesis is performed by inserting a needle into the pericardial space, usually via a subxiphisternal route under ultrasound guidance. Certain effusions, particularly posterior ones, require surgical drainage under a general anaesthetic. If a large volume of fluid is to be removed, a wide-bore needle and cannula are inserted. The needle may be removed and the cannula left in situ to drain the fluid. Fluid that is removed is sent for chemical analysis, microscopy, including cytology, Gram-stain and culture. If a reaccumulation of pericardial fluid is anticipated, the cannula may be left in place for several days, or an operation can be performed to cut a window in the parietal pericardium (fenestration) or to remove a large section of the pericardium.
Right-heart bedside catheterization
Bedside catheterization (Fig. 16.18) of the pulmonary artery with a pulmonary artery balloon flotation catheter (Swann–Ganz catheter) is performed in patients with:
Intra-aortic balloon pumping
This is a technique used to assist temporarily the failing left ventricle. A catheter with a long sausage-shaped balloon at its tip is introduced percutaneously into the femoral artery and manipulated under X-ray control so that the balloon lies in the descending aorta just below the aortic arch (Fig. 14.35). The balloon is rhythmically deflated and inflated with carbon dioxide gas. Using the ECG or intra-aortic pressure changes, the inflation is timed to occur during ventricular diastole to increase diastolic aortic pressure and consequently to improve coronary and cerebral blood flow. During systole the balloon is deflated, resulting in a reduction in the resistance to left ventricular emptying. Intra-aortic balloon pumping is used for circulatory support in the following acute situations:
Acute heart failure. Balloon pumping is used to improve cardiac output when there is a transient or reversible depression of left ventricular function, such as in a patient with severe mitral valve regurgitation who is awaiting surgical replacement of the mitral valve, or in a patient with a ventricular septal defect that is due to septal infarction. It may also be used to support patients awaiting heart transplantation.
Unstable angina pectoris. Balloon pumping is used to treat unstable angina pectoris by improving coronary flow and decreasing myocardial oxygen consumption by reducing the ‘afterload’. This technique may be successful, even when medical therapy has failed. It is followed by early angiography and appropriate definitive therapy such as surgery or coronary angioplasty.
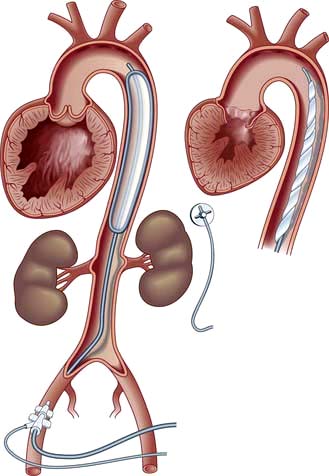
Balloon pumping should not be used when there is no remediable cause of cardiac dysfunction. It is also unsuitable in patients with severe aortic regurgitation, aortic dissection and severe peripheral vascular disease.
Complications of balloon pumping occur in about 20% of patients and include aortic dissection, leg ischaemia, emboli from the balloon and balloon rupture. Embolic complications are reduced by anticoagulation with heparin.