Chapter 20 Diabetes mellitus and other disorders of metabolism
Diabetes mellitus
Hyperglycaemia, insulin and insulin action
Introduction
Diabetes mellitus (DM) is a syndrome of chronic hyperglycaemia due to relative insulin deficiency, resistance or both. It affects more than 220 million people worldwide, and it is estimated that it will affect 440 million by the year 2030. Diabetes is usually irreversible and, although patients can lead a reasonably normal lifestyle, its late complications result in reduced life expectancy and major health costs. These include macrovascular disease, leading to an increased prevalence of coronary artery disease, peripheral vascular disease and stroke, and microvascular damage causing diabetic retinopathy and nephropathy. Neuropathy is another major complication.
Insulin structure and secretion
Insulin is the key hormone involved in the storage and controlled release within the body of the chemical energy available from food. It is coded for on chromosome 11 and synthesized in the beta cells of the pancreatic islets (Fig. 20.1). The synthesis, intracellular processing and secretion of insulin by the beta cell is typical of the way that the body produces and manipulates many peptide hormones. Figure 20.2 illustrates the cellular events triggering the release of insulin-containing granules. After secretion, insulin enters the portal circulation and is carried to the liver, its prime target organ. About 50% of secreted insulin is extracted and degraded in the liver; the residue is broken down by the kidneys. C-peptide is only partially extracted by the liver (and hence provides a useful index of the rate of insulin secretion) but is mainly degraded by the kidneys.
Figure 20.1 Part of a beta cell. The ribosomes manufacture pre-proinsulin from insulin mRNA. The hydrophobic ‘pre’ portion of pre-proinsulin allows it to transfer to the Golgi apparatus, and is subsequently enzymatically cleaved off. Proinsulin is parcelled into secretory granules in the Golgi apparatus. These mature and pass towards the cell membrane where they are stored before release. The proinsulin molecule folds back on itself and is stabilized by disulphide bonds. The biochemically inert peptide fragment known as connecting (C) peptide splits off from proinsulin in the secretory process, leaving insulin as a complex of two linked peptide chains. Equimolar quantities of insulin and C-peptide are released into the circulation via the ‘regulated pathway’. A small amount of insulin is secreted by the beta cell directly via the ‘constitutive pathway’, which bypasses the secretory granules.
Figure 20.2 Local forces regulating insulin secretion from beta cells. Glucose enters the beta cell via the GLUT-2 transporter protein, which is closely associated with the glycolytic enzyme glucokinase. Metabolism of glucose within the beta cell generates ATP. ATP closes potassium channels in the cell membrane (a). If a sulfonylurea binds to its receptor, this also closes potassium channels. Closure of potassium channels predisposes to cell membrane depolarization, allowing calcium ions to enter the cell via calcium channels in the cell membrane (b). The rise in intracellular calcium triggers activation of calcium-dependent phospholipid protein kinase which, via intermediary phosphorylation steps, leads to fusion of the insulin-containing granules with the cell membrane and exocytosis of the insulin-rich granule contents. Similar mechanisms produce hormone-granule secretion in many other endocrine cells.
An outline of glucose metabolism
Blood glucose levels are closely regulated in health and rarely stray outside the range of 3.5–8.0 mmol/L (63–144 mg/dL), despite the varying demands of food, fasting and exercise. The principal organ of glucose homeostasis is the liver, which absorbs and stores glucose (as glycogen) in the post-absorptive state and releases it into the circulation between meals to match the rate of glucose utilization by peripheral tissues. The liver also combines 3-carbon molecules derived from breakdown of fat (glycerol), muscle glycogen (lactate) and protein (e.g. alanine) into the 6-carbon glucose molecule by the process of gluconeogenesis.
About 200 g of glucose is produced and utilized each day. More than 90% is derived from liver glycogen and hepatic gluconeogenesis, and the remainder from renal gluconeogenesis.
The brain is the major consumer of glucose, and its function depends upon an uninterrupted supply of this substrate. Its requirement is 1 mg/kg bodyweight per minute, or 100 g daily in a 70 kg man. Glucose uptake by the brain is obligatory and is not dependent on insulin, and the glucose used is oxidized to carbon dioxide and water. Other tissues, such as muscle and fat, are facultative glucose consumers. The effect of insulin peaks associated with meals is to lower the threshold for glucose entry into cells; at other times, energy requirements are largely met by fatty-acid oxidation. Glucose taken up by muscle is stored as glycogen or metabolized to lactate or carbon dioxide and water. Fat uses glucose as a source of energy and as a substrate for triglyceride synthesis; lipolysis releases fatty acids from triglyceride together with glycerol, a substrate for hepatic gluconeogenesis.
Insulin is a major regulator of intermediary metabolism, although its actions are modified in many respects by other hormones. Its actions in the fasting and postprandial states differ (Fig. 20.3). In the fasting state, its main action is to regulate glucose release by the liver, and in the postprandial state, it additionally promotes glucose uptake by fat and muscle. The effect of counter-regulatory hormones (glucagon, epinephrine (adrenaline), cortisol and growth hormone) is to cause greater production of glucose from the liver and less utilization of glucose in fat and muscle for a given level of insulin.
Figure 20.3 Fasting and postprandial effects of insulin. In the fasting state, insulin concentrations are low and it acts mainly as a hepatic hormone, modulating glucose production (via glycogenolysis and gluconeogenesis) from the liver. Hepatic glucose production rises as insulin levels fall. In the postprandial state insulin concentrations are high and it then suppresses glucose production from the liver and promotes the entry of glucose into peripheral tissues (increased glucose utilization).
Cell membranes are not inherently permeable to glucose. A family of specialized glucose-transporter (GLUT) proteins carry glucose through the membrane into cells.
 GLUT-1 – enables basal non-insulin-stimulated glucose uptake into many cells (see Fig. 6.29).
GLUT-2 – transports glucose into the beta cell, a prerequisite for glucose sensing, and is also present in the renal tubules and hepatocytes.
GLUT-3 – enables non-insulin-mediated glucose uptake into brain neurones and placenta.
GLUT-4 – enables much of the peripheral action of insulin. It is the channel through which glucose is taken up into muscle and adipose tissue cells following stimulation of the insulin receptor (Fig. 20.4).
Figure 20.4 Insulin signalling in peripheral cells (e.g. muscle and adipose tissue). The insulin receptor consists of α- and β-subunits linked by disulphide bridges (top right of figure). The β-subunits straddle the cell membrane. The transporter protein GLUT-4 (bottom left of figure) is stored in intracellular vesicles. The binding of insulin to its receptor initiates many intracellular actions including translocation of these vesicles to the cell membrane, carrying GLUT-4 with them; this allows glucose transport into the cell.
This is a glycoprotein (400 kDa), coded for on the short arm of chromosome 19, which straddles the cell membrane of many cells (Fig. 20.4). It consists of a dimer with two α-subunits, which include the binding sites for insulin, and two β-subunits, which traverse the cell membrane. When insulin binds to the α-subunits it induces a conformational change in the β-subunits, resulting in activation of tyrosine kinase and initiation of a cascade response involving a host of other intracellular substrates. One consequence of this is migration of the GLUT-4 glucose transporter to the cell surface and increased transport of glucose into the cell. The insulin-receptor complex is then internalized by the cell, insulin is degraded, and the receptor is recycled to the cell surface.
Classification of diabetes
Diabetes may be primary (idiopathic) or secondary (Table 20.1). Primary diabetes is classified into:
Type 1 diabetes, which has an immune pathogenesis and is characterized by severe insulin deficiency
Type 2 diabetes, which results from a combination of insulin resistance and less severe insulin deficiency.
Table 20.1 Aetiological classification of diabetes mellitus, based on classification by the American Diabetes Association (ADA)
Note: Patients with any form of diabetes may require insulin treatment at some stage of their disease. Such use of insulin does not, of itself, classify the patient.
(Adapted from ADA. Diagnosis and classification of diabetes mellitus. Diabetes Care 2008; 31(Suppl 1):S55–S60.)
The key clinical features of the two main forms of diabetes are listed in Table 20.2. Type 1 and type 2 diabetes represent two distinct diseases from the epidemiological point of view, but clinical distinction can sometimes be difficult. The two diseases should from a clinical point of view be seen as a spectrum, distinct at the two ends but overlapping to some extent in the middle. Hybrid forms are increasingly recognized, and patients with immune-mediated diabetes (type 1) may, for example, also be overweight and insulin resistant. This is sometimes referred to as ‘double diabetes’. It is more relevant to give the patient the right treatment on clinical grounds than to worry about how to label their diabetes. The classification of primary diabetes continues to evolve. Monogenic forms have been identified (see p. 1007), in some cases with significant therapeutic implications. Although secondary diabetes accounts for barely 1–2% of all new cases at presentation, it should not be missed because the cause can sometimes be treated. All forms of diabetes derive from inadequate insulin secretion relative to the needs of the body, and progressive insulin secretory failure is characteristic of both common forms of diabetes. Thus, some patients with immune-mediated diabetes type 1 may not at first require insulin, whereas many with type 2 diabetes will eventually do so.
Table 20.2 The spectrum of diabetes: a comparison of type 1 and type 2 diabetes mellitus
| Type 1 | Type 2 | |
|---|---|---|
Age |
Younger (usually <30) |
Older (usually >30) |
Weight |
Lean |
Overweight |
Symptom duration |
Weeks |
Months/years |
Higher risk ethnicity |
Northern European |
Asian, African, Polynesian and American-Indian |
Seasonal onset |
Yes |
No |
Heredity |
HLA-DR3 or DR4 in >90% |
No HLA links |
Pathogenesis |
Autoimmune disease |
No immune disturbance |
Ketonuria |
Yes |
No |
Clinical |
Insulin deficiency |
Partial insulin deficiency initially |
|
± ketoacidosis |
± hyperosmolar state |
|
Always need insulin |
Need insulin when beta cells fail over time |
Biochemical |
C-peptide disappears |
C-peptide persists |
Type 1 diabetes mellitus
Epidemiology
Type 1 diabetes is a disease of insulin deficiency. In western countries almost all patients have the immune-mediated form of the disease, otherwise known as type 1A. Type 1 diabetes is a disease of childhood, reaching a peak incidence around the time of puberty, but can present at any age. A ‘slow-burning’ variant with slower progression to insulin deficiency occurs in later life and is sometimes called latent autoimmune diabetes in adults (LADA). LADA may be difficult to distinguish from type 2 diabetes. Clinical clues are: leaner build, rapid progression to insulin therapy following an initial response to other therapies, and the presence of circulating islet autoantibodies. The highest rates of type 1 diabetes in the world are seen in Finland and other Northern European countries, and on the island of Sardinia, which for unknown reasons, has the second highest rate in the world (Fig. 20.5). The incidence of type 1 diabetes appears to be increasing in most populations. In Europe, the annual increase is of the order of 2–3%, and is most marked in children under the age of 5 years. WHO estimated in 1995 that there were 19.4 million people with type 1 diabetes and that the number will rise to 57.2 million by 2025.
Causes
Type 1 diabetes belongs to a family of HLA-associated immune-mediated organ-specific diseases. Genetic susceptibility is polygenic, with the greatest contribution from the HLA region. Autoantibodies directed against pancreatic islet constituents appear in the circulation within the first few years of life, and often predate clinical onset by many years. Autoantibodies are also found in older patients with LADA and carry an increased risk of progression to insulin therapy.
Genetic susceptibility and inheritance
Increased susceptibility to type 1 diabetes is inherited, but the disease is not genetically predetermined. The identical twin of a patient with type 1 diabetes has a 30–50% chance of developing the disease, which implies that non-genetic factors must also be involved. The risk of developing diabetes by age 20, curiously, is greater with a diabetic father (3–7%) than with a diabetic mother (2–3%). If one child in a family has type 1 diabetes, each sibling has a ~6% risk of developing diabetes by age 20. This risk rises to about 20% in HLA-identical siblings who have the same HLA type as the proband. Since type 1 diabetes can present at any age, the lifetime risk for a sibling or child is at least double the risk by age 20.
HLA system
The HLA genes on chromosome 6 are highly polymorphic and modulate the immune defence system of the body. More than 90% of patients with type 1 diabetes carry HLA-DR3-DQ2, HLA-DR4-DQ8 or both, as compared with some 35% of the background population. All DQB1 alleles with an aspartic acid at residue 57 confer neutral to protective effects with the strongest effect from DQB1*0602 (DQ6), while DQB1 alleles with an alanine at the same position (i.e. DQ2 and DQ8) confer strong susceptibility. Genotypic combinations have a major influence upon risk of disease. For example, HLA DR3-DQ2/HLA DR4-DQ8 heterozygotes have a considerably increased risk of disease, and some HLA class I alleles also modify the risk conferred by class II susceptibility genes.
Genome-wide association studies have greatly broadened our understanding of the genetic background to type 1 diabetes and more than 50 non-HLA genes or gene regions that influence risk have been identified to date. The greatest genetic contribution still comes from the HLA region, but this is modulated by a large number of genes with small effects. These include the gene encoding insulin (INS) on chromosome 11 and a number of genes involved in immune responses, including the cytotoxic T-lymphocyte-associated protein-4 (CTLA4) gene, the lymphoid-specific protein tyrosine phosphatase (PTPN22) gene and the IL-2R α-subunit of the IL-2 receptor complex locus (IL2RA), all of which are implicated in a variety of HLA-associated autoimmune conditions.
Autoimmunity and type 1 diabetes
Type 1 diabetes is associated with other organ-specific autoimmune diseases including autoimmune thyroid disease, coeliac disease, Addison’s disease and pernicious anaemia. Autopsies of patients who died following diagnosis of type 1 diabetes show infiltration of the pancreatic islets by mononuclear cells. This appearance, known as insulitis, resembles that in other autoimmune diseases such as thyroiditis. Several islet antigens have been characterized, and these include insulin itself, the enzyme glutamic acid decarboxylase (GAD), protein tyrosine phosphatase (IA-2) (Fig. 20.6) and the cation transporter ZnT8. Recent studies have shown that GAD immunotherapy has no benefit. The observation that treatment with immunosuppressive agents such as ciclosporin prolongs beta-cell survival in newly diagnosed patients has confirmed that the disease is immune-mediated.
Figure 20.6 Islet autoantibodies. Islet cell antibodies are detected by a fluorescent antibody technique which detects binding of autoantibodies to islet cells. Much of this staining reaction is due to antibodies specific for glutamic acid decarboxylase (GAD) and protein tyrosine phosphatase – IA-2 (also known as ICA512). Not all the staining seen with ICA is due to these two autoantibodies, so it is assumed that other islet autoantibodies are also involved. Insulin autoantibodies also appear in the circulation but do not contribute to the ICA reaction.
Environmental factors
The incidence of childhood type 1 diabetes is rising across Europe at the rate of 2–3% each year, suggesting that environmental factor(s) are involved in its pathogenesis. Islet autoantibodies (see above) appear in the first few years of life, indicating prenatal or early postnatal interactions with the environment. Exposures to dietary constituents, enteroviruses such as Coxsackie B4 and relative deficiency of vitamin D are possible candidates, but their role in the causation of the disease has yet to be confirmed. A cleaner environment with less early stimulation of the immune system in childhood may increase susceptibility for type 1 diabetes, as for atopic/allergic conditions (the hygiene hypothesis) (see p. 824), and more rapid weight gain in childhood and adolescence leading to increased insulin resistance might accelerate clinical onset (the accelerator hypothesis).
Pre-type 1 diabetes and prevention of type 1 diabetes
Children who test positive for two or more autoantibodies have a >80% risk of progression to diabetes, and the risk approaches 100% in those who additionally lose their first phase insulin response to intravenous glucose and/or develop glucose intolerance. The ability to predict type 1 diabetes with this degree of precision has opened the way to trials of disease prevention, but intervention before clinical onset of diabetes has so far proved unsuccessful.
Type 2 diabetes mellitus
Epidemiology
Type 2 diabetes is a common condition in all populations enjoying an affluent lifestyle, and has increased in parallel with the adoption of a western lifestyle and increasing obesity. The four major determinants are increasing age, obesity, ethnicity and family history. In poor countries, diabetes is a disease of the rich, but in rich countries, it is a disease of the poor; obesity being the common factor. Glucose intolerance or frank diabetes may be present in a subclinical or undiagnosed form for years before diagnosis, and 25–50% of patients already have some evidence of vascular complications at the time of diagnosis. Onset may be accelerated by the stress of pregnancy, drug treatment or intercurrent illness. The overall prevalence within the UK is 4–6%, and the lifetime risk is around 15–20%. Type 2 diabetes is 2–4 times as prevalent in people of South Asian, African and Caribbean ancestry who live in the UK, and the life-time risk in these groups exceeds 30%. High rates also affect people of Middle Eastern and Hispanic American origin living western lifestyles. Obesity increases the risk of type 2 diabetes 80–100 fold, and this is reflected by the increasing prevalence of diabetes in different populations. On average, the inhabitants of affluent countries gain almost 1 g daily between the ages of 25 and 55 years. This gain, due to a tiny excess in energy intake over expenditure – 90 kcal or one chocolate-coated digestive biscuit per day – is often due to reduced exercise rather than increased food intake. Further, our sedentary lifestyle means that the proportion of obese young adults is rising rapidly, and epidemic obesity will create a huge public health problem for the future. The increasing numbers of obese adolescents presenting with type 2 diabetes, particularly within high-risk ethnic groups, is a matter for concern.
Type 2 diabetes is associated with central obesity, hypertension, hypertriglyceridaemia, a decreased HDL-cholesterol, disturbed haemostatic variables and modest increases in a number of pro-inflammatory markers. Insulin resistance is strongly associated with many of these variables, as is increased cardiovascular risk. This group of conditions is referred to as the metabolic syndrome (see p. 223). The International Diabetes Federation has proposed criteria based on increased waist circumference (or BMI >30) plus two of the following: diabetes (or fasting glucose >6.0 mmol/L), hypertension, raised triglycerides or low HDL cholesterol. On this definition, about one-third of the adult population has features of the syndrome, not necessarily associated with diabetes. Critics would argue that the metabolic syndrome is not a distinct entity, but one end of a continuum in the relationship between exercise, lifestyle and bodyweight on the one hand, and genetic make-up on the other, and that diagnosis adds little to standard clinical practice in terms of diagnosis, prognosis or therapy.
Causes
Inheritance
Identical twins of patients with type 2 diabetes have >50% chance of developing diabetes; the risk to non-identical twins or siblings is of the order of 25%, confirming a strong inherited component to the disease. Type 2 diabetes is a polygenic disorder, and, as with type 1 diabetes, genome-wide studies of associations between common DNA variants and disease have allowed identification of numerous susceptibility loci. Several of these loci subserve beta-cell development or function, and there is no overlap with the immune function genes identified for type 1 diabetes. There is no major gene susceptibility, involving the HLA region. However, transcription factor-7-like (TCF7-L2) is the most common variant observed in type 2 diabetes in Europeans, and KCNQ1 (a potassium voltage-gated channel) in Asians. TCF7-L2 carries an increased risk of around 35%, while other common variants account for no more than 10–20%. TCF7-L2 has now been shown to modulate pancreatic islet cell function. Paradoxically, the genes for type 2 diabetes account for a relatively small fraction of its observed heritability. They do not allow subtypes of the condition to be identified with any confidence, or provide useful disease prediction.
Environmental factors: early and late
An association has been noted between low weight at birth and at 12 months of age and glucose intolerance later in life, particularly in those who gain excess weight as adults. The concept is that poor nutrition early in life impairs beta-cell development and function, predisposing to diabetes in later life. Low birthweight has also been shown to predispose to heart disease and hypertension.
Inflammation
Subclinical inflammatory changes are characteristic of both type 2 diabetes and obesity, and in diabetes, high-sensitivity C-reactive protein (CRP) levels are modestly elevated in association with raised fibrinogen and increased plasminogen activator inhibitor-1 (PAI-1), and contribute to cardiovascular risk. Circulating levels of the pro-inflammatory cytokines TNF-α and IL-6 are elevated in both diabetes and obesity.
Abnormalities of insulin secretion and action
The relative role of secretory failure versus insulin resistance in the pathogenesis of type 2 diabetes has been much debated, but even massively obese individuals with a fully functioning beta-cell mass do not necessarily develop diabetes, which implies that some degree of beta-cell dysfunction is necessary. Insulin binds normally to its receptor on the surface of cells in type 2 diabetes, and the mechanisms of ‘insulin resistance’ are still poorly understood. Insulin resistance is, however, associated with central obesity and accumulation of intracellular triglyceride in muscle and liver in type 2 diabetes, and a high proportion of patients have non-alcoholic fatty liver disease (NAFLD), see page 303. It has long been stated that patients with type 2 diabetes retain up to 50% of their beta-cell mass at the time of diagnosis, as compared with healthy controls, but the shortfall is greater than this when they are matched with healthy individuals who are equally obese. In addition, patients with type 2 diabetes almost all show islet amyloid deposition at autopsy, derived from a peptide known as amylin or islet amyloid polypeptide (IAPP), which is co-secreted with insulin. It is not known if this is a cause or consequence of beta-cell secretory failure.
Abnormalities of insulin secretion manifest early in the course of type 2 diabetes. An early sign is loss of the first phase of the normal biphasic response to intravenous insulin. Established diabetes is associated with hypersecretion of insulin by a depleted beta-cell mass. Circulating insulin levels are therefore higher than in healthy controls, although still inadequate to restore glucose homeostasis. Relative insulin lack is associated with increased glucose production from the liver (owing to inadequate suppression of gluconeogenesis) and reduced glucose uptake by peripheral tissues. Hyperglycaemia and lipid excess are toxic to beta cells, at least in vitro, a phenomenon known as glucotoxicity, and this is thought to result in further beta-cell loss and further deterioration of glucose homeostasis. Circulating insulin levels are typically higher than in non-diabetics following diagnosis and tend to rise further, only to decline again after months or years due to secretory failure, an observation sometimes referred to as the ‘Starling curve’ of the pancreas. Type 2 diabetes is thus a condition in which insulin deficiency relative to increased demand leads to hypersecretion of insulin by a depleted beta-cell mass and progression towards absolute insulin deficiency requiring insulin therapy. Its time course varies widely between individuals.
Genetic predisposition determines whether an individual is susceptible to type 2 diabetes; if and when diabetes develops largely depends upon lifestyle. A dramatic reduction in the incidence of new cases of adult-onset diabetes was documented in the Second World War when food was scarce, and clinical trials in individuals with impaired glucose tolerance have shown that diet, exercise or agents such as metformin have a marked effect in deferring the onset of type 2 diabetes. Established diabetes can be reversed, even if temporarily, by successful diet and weight loss or by bariatric surgery. Diabetes is therefore largely preventable, although the most effective measures would be directed at the whole population and implemented early in life. Prevention is well worth while, for diabetes diagnosed in a man between the ages of 40 and 59 reduces life expectancy by 5–10 years. By contrast, type 2 diabetes diagnosed after the age of 70 has limited effect on life expectancy in men.
Monogenic diabetes mellitus
The genetic causes of some rare forms of diabetes are shown in Table 20.3. Considerable progress has been made in understanding these rare variants of diabetes. Genetic defects of beta-cell function (previously called ‘maturity-onset diabetes of the young’, MODY) are dominantly inherited, and several variants have been described, each associated with different clinical phenotypes (Table 20.4). These should be considered in people presenting with early-onset diabetes in association with an affected parent and early-onset diabetes in ~50% of relatives. They can often be treated with a sulfonylurea.
Table 20.3 Rare genetic causes of type 2 diabetes
| Disorder | Features |
|---|---|
Insulin receptor mutations |
Obesity, marked insulin resistance, hyperandrogenism in women, acanthosis nigricans (areas of hyperpigmented skin) |
Maternally inherited diabetes and deafness (MIDD) |
Mutation in mitochondrial DNA. Diabetes onset before age 40. Variable deafness, neuromuscular and cardiac problems, pigmented retinopathy |
Wolfram’s syndrome (DIDMOAD – diabetes insipidus, diabetes mellitus, optic atrophy and deafness) |
Recessively inherited. Mutation in the transmembrane gene, WFS1. Insulin-requiring diabetes and optic atrophy in the first decade. Diabetes insipidus and sensorineural deafness in the second decade progressing to multiple neurological problems. Few live beyond middle age |
Severe obesity and diabetes |
Alström’s, Bardet–Biedl and Prader–Willi syndromes. Retinitis pigmentosa, mental insufficiency and neurological disorders |
Disorders of intracellular insulin signalling. All with severe insulin resistance |
Leprechaunism, Rabson–Mendenhall syndrome, pseudoacromegaly, partial lipodystrophy: lamin A/C gene mutation |
Genetic defects of beta-cell function |
See Table 20.4 |
Infants who develop diabetes before 6 months of age are likely to have a monogenic defect and not true type 1 diabetes. Transient neonatal diabetes mellitus (TNDM) occurs soon after birth, resolves at a median of 12 weeks, and 50% of cases ultimately relapse later in life. Most have an abnormality of imprinting of the ZAC and HYMAI genes on chromosome 6q. The commonest cause of permanent neonatal diabetes mellitus (PNDM) is mutations in the KCNJ11 gene encoding the Kir6.2 subunit of the beta-cell potassium-ATP channel.
Neurological features are seen in 20% of patients. Diabetes is due to defective insulin release rather than beta-cell destruction, and patients can be treated successfully with sulfonylureas, even after many years of insulin therapy.
FURTHER READING
Chan JC, Malik V, Jia W et al. Diabetes in Asia: epidemiology, risk factors and pathophysiology. JAMA 2009; 301:2129–2140.
Ramachandran A, Ma RC, Snehalatha C. Diabetes in Asia. Lancet 2010; 375:408–418.
Sturnvoll M, Goldstein BJ, van Haefken TW. Type 2 diabetes; pathogenesis and treatment. Lancet 2008; 371:2153–2156.
Clinical presentation of diabetes
Presentation may be acute, subacute or asymptomatic.
Acute presentation
Young people often present with a 2–6-week history and report the classic triad of symptoms:
Polyuria – due to the osmotic diuresis that results when blood glucose levels exceed the renal threshold
Thirst – due to the resulting loss of fluid and electrolytes
Weight loss – due to fluid depletion and the accelerated breakdown of fat and muscle secondary to insulin deficiency.
Ketonuria is often present in young people and may progress to ketoacidosis if these early symptoms are not recognized and treated.
Subacute presentation
The clinical onset may be over several months or years, particularly in older patients. Thirst, polyuria and weight loss are typically present but patients may complain of such symptoms as lack of energy, visual blurring (owing to glucose-induced changes in refraction) or pruritus vulvae or balanitis that is due to Candida infection.
Asymptomatic diabetes
Glycosuria or a raised blood glucose may be detected on routine examination (e.g. for insurance purposes) in individuals who have no symptoms of ill-health. Glycosuria is not diagnostic of diabetes but indicates the need for further investigations. About 1% of the population have renal glycosuria. This is an inherited low renal threshold for glucose, transmitted either as a Mendelian dominant or recessive trait.
Physical examination at diagnosis
Evidence of weight loss and dehydration may be present, and the breath may smell of ketones. Older patients may present with established complications, and the presence of the characteristic retinopathy is diagnostic of diabetes. In occasional patients, there will be physical signs of an illness causing secondary diabetes (see Table 20.1). Patients with severe insulin resistance may have acanthosis nigricans, which is characterized by blackish pigmentation at the nape of the neck and in the axillae (p. 1217).
Diagnosis and investigation of diabetes
Diabetes is easy to diagnose when overt symptoms are present, and a glucose tolerance test is hardly ever necessary for clinical purposes. The oral glucose tolerance test has, however, allowed more detailed epidemiological characterization based on the existence of separate glucose thresholds for macrovascular and microvascular disease. These correspond with the levels for the diagnosis of impaired glucose tolerance (IGT) and diabetes as specified by the WHO criteria set out in Box 20.1. Epidemiological studies show that for every person with known diabetes, there is another undiagnosed in the population. A much larger proportion fall into the intermediate category of impaired glucose tolerance.
 Box 20.1
WHO diagnostic criteria
WHO criteria for the diagnosis of diabetes are:
Fasting plasma glucose >7.0 mmol/L (126 mg/dL)
Random plasma glucose >11.1 mmol/L (200 mg/dL)
One abnormal laboratory value is diagnostic in symptomatic individuals; two values are needed in asymptomatic people. The glucose tolerance test is only required for borderline cases and for diagnosis of gestational diabetes.
The glucose tolerance test – WHO criteria

Adult: 75 g glucose in 300 mL water
Child: 1.75 g glucose/kg bodyweight
Only a fasting and a 120-min sample are needed
Results are for venous plasma – whole blood values are lower.
Note: There is no such thing as mild diabetes. All patients who meet the criteria for diabetes are liable to disabling long-term complications.
Impaired glucose tolerance (IGT)
This is not a clinical entity but a risk factor for future diabetes and cardiovascular disease. The diagnosis can only be made with a glucose tolerance test, and is complicated by poor reproducibility of the key 2-hour value in this test. The group is heterogeneous; some patients are obese, some have liver disease and others are on medication that impairs glucose tolerance. Individuals with IGT have the same risk of cardiovascular disease as those with frank diabetes, but do not develop the specific microvascular complications.
Impaired fasting glucose (IFG)
This diagnostic category (fasting plasma glucose between 6.1 and 6.9 mmol/L) has the practical advantage that it avoids the need for a glucose tolerance test. It is not a clinical entity, but indicates future risk of frank diabetes and cardiovascular disease. IFG only overlaps with IGT to a limited extent, and the associated risks of cardiovascular disease and future diabetes are not directly comparable. A lower cut-off of 5.6 mmol/L (rather than 6.1 mmol/L) has been recommended by the American Diabetes Association (ADA) and would, if implemented, greatly increase the number of those in this category.
Haemoglobin A1c (HbA1c)
HbA1c is an integrated measure of an individual’s prevailing blood glucose concentration over several weeks (see below). Standardization of this measure has enabled it to be proposed as an alternative diagnostic test for diabetes by the American Diabetes Association. As currently proposed, an HbA1c >6.5% (48 mmol/mol) would be considered diagnostic of diabetes, whereas a level of 5.7–6.4% (39–46 mmol/mol) would denote increased risk of diabetes. A WHO Consultation recently also concluded that HbA1c ‘can be used as a diagnostic test for diabetes’. Unfortunately, there is relatively little concordance between IGT, IFG and HbA1c as markers of ‘prediabetes’. Furthermore, there will be many people in a mixed population who are ‘diabetic’ using the HbA1c criteria but ‘normal’ on glucose tolerance testing. Many are uncomfortable with this concept.
Other investigations
No further tests are needed to diagnose diabetes. Other routine investigations include urine testing for protein, a full blood count, urea and electrolytes, liver biochemistry and random lipids. The latter test is useful to exclude an associated hyperlipidaemia and, if elevated, should be repeated fasting after diabetes has been brought under control. Diabetes may be secondary to other conditions (see Table 20.1), may be precipitated by underlying illness and be associated with autoimmune disease or hyperlipidaemia. Hypertension is present in 50% of patients with type 2 diabetes and a higher proportion of African and Caribbean patients.
Treatment of diabetes
The role of patient education and community care
The care of diabetes is based on self-management by the patient, who is helped and advised by those with specialized knowledge. The quest for improved glycaemic control has made it clear that whatever the technical expertise applied, the outcome depends on willing cooperation by the patient. This in turn depends on an understanding of the risks of diabetes and the potential benefits of glycaemic control and other measures such as maintaining a lean weight, stopping smoking and taking care of the feet. If accurate information is not supplied, misinformation from friends and other patients will take its place. For this reason the best time to educate the patient is soon after diagnosis. Organized education programmes involve all healthcare workers, including nurse specialists, dieticians and podiatrists, and should include ongoing support and updates wherever possible.
Diet
The diet for people with diabetes is no different from that considered healthy for everyone. Table 20.5 lists recommendations on the ideal composition of this diet. To achieve this, food for people with diabetes should be:
low in sugar (though not sugar free)
high in starchy carbohydrate (especially foods with a low glycaemic index), i.e. slower absorption
Table 20.5 Recommended composition of the diet for people with diabetes, with comments on how this may be achieved
| Component of diet | Comment |
|---|---|
Protein |
1 g/kg ideal bodyweight (approx.) |
Total fat |
<35% of energy intake. Limit: fat/oil in cooking, fried foods, processed meats (burgers, salami, sausages), high-fat snacks (crisps, cake, nuts, chocolate, biscuits, pastry). Encourage: lower-fat dairy products (skimmed milk, reduced-fat cheese, low-fat yoghurt), lean meat |
Saturated and trans-unsaturated fat |
<10% of total energy intake |
n-6 polyunsaturated fat |
<10% of total energy intake |
n-3 polyunsaturated fat |
No absolute quantity recommended. Eat fish, especially oily fish, once or twice weekly. Fish oil supplements not recommended |
Cis-monounsaturated fat |
10–20% of total energy intake (olive oil, avocado) |
Total carbohydrate |
40–60% of total energy intake Encourage: artificial (intense) sweeteners instead of sugar (sugar-free fizzy drinks, squashes and cordials). Limit: fruit juices, confectionery, cake, biscuits |
Sucrose |
Up to 10% of total energy intake, provided this is eaten in the context of a healthy diet (examples: fibre-rich breakfast cereals, baked beans) |
Fibre |
No absolute quantity recommended. Soluble fibre has beneficial effects on glycaemic and lipid metabolism. Insoluble fibre has no direct effects on glycaemic metabolism, but benefits satiety and gastrointestinal health |
Vitamins and antioxidants |
Best taken as fruit and vegetables (five portions per day) in a mixed diet. There is no evidence for the use of supplements |
Alcohol |
Not forbidden. Its energy content should be taken into account, as should its tendency to cause delayed hypoglycaemia in those treated with insulin |
Salt |
<6 g/day (lower in hypertension) |
The overweight or obese should be encouraged to lose weight by a combination of changes in food intake and physical activity.
Carbohydrates
The glucose peak seen in the blood after eating pasta is much flatter than that seen after eating the same amount of carbohydrate as white potato. Pasta has a lower ‘glycaemic index’. Foods with a low glycaemic index prevent rapid swings in circulating glucose, and are thus preferred to those with a higher glycaemic index.
Prescribing a diet
Most people find it extremely difficult to modify their eating habits, and repeated advice and encouragement are needed if this is to be achieved. A diet history is taken, and the diet prescribed should involve the least possible interference with the person’s lifestyle. Advice from dieticians is more likely to affect medium-term outcome than advice from doctors. People taking insulin or oral agents have traditionally been advised to eat roughly the same amount of food (particularly carbohydrate) at roughly the same time each day, so that treatment can be balanced against food intake and exercise. Knowledgeable and motivated patients with type 1 diabetes, who get feedback from regular blood glucose monitoring, can vary the amount of carbohydrate consumed, or meal times, by learning to adjust their exercise pattern and treatment. This is the basis of the DAFNE (Dose Adjustment For Normal Eating) regimen.
Exercise
Diet treatment is incomplete without exercise. Any increase in activity levels is to be encouraged, but participation in more formal exercise programmes is best. Where facilities for this exist, exercise should be prescribed for everyone with diabetes. Several trials have shown that regular exercise reduces the risk of progression to type 2 diabetes by 30–60%, and the lowest long-term morbidity and mortality is seen in those with established disease who have the highest levels of cardiorespiratory fitness. Both aerobic and resistance training improve insulin sensitivity and metabolic control in type 1 and type 2 diabetes, although reported effects on metabolic control are inconsistent. Patients on insulin or sulfonylureas should be warned that there is an increased risk of hypoglycaemia for up to 6–12 h following heavy exertion.
Tablet treatment for type 2 diabetes
Diet and lifestyle changes are the key to successful treatment of type 2 diabetes, and no amount of medication will succeed where these have failed. The concept is that controlling diabetes is not just a matter of swallowing tablets, and these should in general never be prescribed until lifestyle changes have been implemented. Tablets will however be needed if satisfactory metabolic control (see ‘Measuring control’ below) is not established within 4–6 weeks. A consensus treatment pathway is shown in Figure 20.9 (p. 1013). The three main options are metformin, a sulfonylurea or a thiazolidinedione.
Biguanide (metformin)
Metformin is the only biguanide currently in use, and remains the best validated primary treatment for type 2 diabetes. It activates the enzyme AMP-kinase, which is involved in regulation of cellular energy metabolism, but its precise mechanism of action remains unclear. Its effect is to reduce the rate of gluconeogenesis, and hence hepatic glucose output, and to increase insulin sensitivity. It does not affect insulin secretion, does not induce hypoglycaemia and does not predispose to weight gain. It is thus particularly helpful in the overweight, although normal weight individuals also benefit, and may be given in combination with sulfonylureas, thiazolidinediones, dipeptidyl peptidase-4 (DPP4) inhibitors or insulin. Metformin was as effective as sulfonylurea or insulin in glucose control and reduction of microvascular risk in the UK Prospective Diabetic Study (UKPDS), but proved unexpectedly beneficial in reducing cardiovascular risk, an effect that could not be fully explained by its glucose-lowering actions. Adverse effects include anorexia, epigastric discomfort and diarrhoea, and these prohibit its use in 5–10% of patients. Diarrhoea should never be investigated in a diabetic patient without testing the effect of stopping metformin or changing to a slow release preparation. Lactic acidosis has occurred in patients with severe hepatic or renal disease, and metformin is contraindicated when these are present. A Cochrane review showed little risk of lactic acidosis with standard clinical use, but most clinicians withdraw the drug when serum creatinine exceeds 150 µmol/L.
Sulfonylureas (Table 20.6)
These act upon the beta cell to promote insulin secretion in response to glucose and other secretagogues. They are ineffective in patients without a functional beta-cell mass, and they are usually avoided in pregnancy. Their action is to bind to the sulfonylurea receptor on the cell membrane, which closes ATP-sensitive potassium channels and blocks potassium efflux. The resulting depolarization promotes influx of calcium, a signal for insulin release (Fig. 20.2). Sulfonylureas are cheap and more effective than the other agents in achieving short-term (1–3 years) glucose control, but their effect wears off as the beta-cell mass declines. There are theoretical concerns that they might hasten beta-cell apoptosis and they promote weight gain, and are best avoided in the overweight. They can also cause hypoglycaemia and although the episodes are generally mild, fatal hypoglycaemia may occur. Severe cases should always be admitted to hospital, monitored carefully, and treated with a continuous glucose infusion since some sulfonlyureas have long half-lives. Sulfonylureas should be used with care in patients with liver disease. Patients with renal impairment should only be given those primarily excreted by the liver. Tolbutamide is the safest drug in the very elderly because of its short duration of action.
Table 20.6 Properties of the most commonly used sulfonylureas
| Drug | Features |
|---|---|
Tolbutamide |
Lower maximal efficacy than other sulfonylureas |
Short half-life – preferable in elderly |
|
Largely metabolized by liver – can use in renal impairment |
|
Glibenclamide |
Long biological half-life |
Severe hypoglycaemia |
|
Do not use in the elderly |
|
Glipizide and Glimepiride |
Active metabolites |
Renal excretion – avoid in renal impairment |
|
Gliclazide |
Intermediate biological half-life |
Largely metabolized by liver – can use in renal impairment |
|
More costly |
|
Chlorpropamide |
Very long biological half-life |
Renal excretion – avoid in renal impairment |
|
1–2% develop inappropriate ADH-like syndrome |
|
Facial flush with alcohol |
|
Very inexpensive – major issue for developing countries |
|
Can produce fatal hypoglycaemia |
|
Not recommended in the elderly |
Meglitinides
Meglitinides, e.g. repaglinide and nateglinide, are insulin secretagogues. Meglitinides are the non-sulfonylurea moiety of glibenclamide. As with the sulfonylureas, they act via closure of the K+-ATP channel in the beta cells (see Fig. 20.2). They are short-acting agents that promote insulin secretion in response to meals. Their effects are similar to that of the short-acting sulfonylurea tolbutamide, but they are much more costly.
Thiazolidinediones
The thiazolidinediones (more conveniently known as the ‘glitazones’) reduce insulin resistance by interaction with peroxisome proliferator-activated receptor-gamma (PPAR-γ), a nuclear receptor which regulates large numbers of genes including those involved in lipid metabolism and insulin action. The paradox that glucose metabolism should respond to a drug that binds to nuclear receptors mainly found in fat cells is still not fully understood. One suggestion is that they act indirectly via the glucose-fatty acid cycle, lowering free fatty acid levels and thus promoting glucose consumption by muscle. They reduce hepatic glucose production, an effect that is synergistic with that of metformin, and also enhance peripheral glucose uptake. Like metformin, the glitazones potentiate the effect of endogenous or injected insulin. The glitazones have yet to demonstrate unique advantages in the treatment of diabetes, and their place in routine diabetes care remains uncertain. Troglitazone and rosiglitazone have been withdrawn for safety concerns (liver failure and increased cardiovascular risk, respectively), and pioglitazone is the only remaining agent in this class. Unwanted effects of pioglitazone include weight gain of 5–6 kg, together with fluid retention and heart failure. Mild anaemia and osteoporosis resulting in peripheral bone fractures have also been reported, and there is a possible increase in the risk of bladder cancer.
Dipeptidyl peptidase-4 (DPP4) inhibitors
These enhance the incretin effect (Box 20.2). The enzyme dipeptidyl peptidase 4 (DPP4) rapidly inactivates GLP-1 as this is released into the circulation. Inhibition of this enzyme thus potentiates the effect of endogenous GLP-1 secretion. Four agents are currently available (linagliptin, saxagliptin, sitagliptin and vildagliptin) with more likely to be available in the future. They have a moderate effect in lowering blood glucose and are weight neutral. They are most effective in the early stages of type 2 diabetes when insulin secretion is relatively preserved, and are currently recommended for second-line use in combination with metformin or a sulfonylurea. Adverse events are uncommon: the main side-effect is nausea, and there have been occasional reports of acute pancreatitis. Their place in the management of type 2 diabetes has yet to be fully established. Although the short-term safety record is good, DPP4 is widely distributed in the body, and the long-term consequences of inhibition of this enzyme in other tissues are unknown.
Box 20.2
The incretin effect
The insulin response to oral glucose is greater than the response to intravenous glucose.
Cause: two intestinal peptide hormones, glucose-dependent insulinotropic peptide (GIP) and glucagon-like peptide-1 (GLP-1) have a potentiating effect on pancreatic secretion of insulin.
GIP causes 30%, and GLP-1 70%, of the incretin effect.
Both hormones have very short half-lives in the circulation, being degraded predominantly by the enzyme dipeptidyl peptidase-4 (DPP4).
GIP is secreted from the K cells in the duodenum and GLP-1 from the L cells of the ileum in response to food.
Magnitude: the incretin effect is diminished in type 2 diabetes.
Injection therapies for type 2 diabetes
GLP-1 agonists
Exenatide and liraglutide are injectable long-acting analogues of GLP-1, which enhance the incretin effect (Box 20.2). They promote insulin release, inhibit glucagon release, reduce appetite and delay gastric emptying, thus blunting the postprandial rise in plasma glucose and promoting weight loss. Their main clinical disadvantage is the need for subcutaneous injection (twice daily for exenatide and once daily for liraglutide), and their major advantage is improving glucose control whilst inducing useful weight reduction. They work well in 70% but have limited benefit in 30% of those treated. Side-effects include nausea, acute pancreatitis and acute kidney injury. At present they are used as an alternative to insulin, particularly in the overweight. A once weekly version of exenatide has been developed.
GLP-1 promotes beta-cell replication in immature rodents, but there is no evidence to suggest that it can do so in adult humans. GLP-1 receptors are also present in the exocrine pancreas, and the long-term clinical implications of this observation remain unclear.
Other therapies
Intestinal enzyme inhibitors include acarbose, a sham sugar that competitively inhibits α-glucosidase enzymes situated in the brush border of the intestine, reducing absorption of dietary carbohydrate. Undigested starch may then enter the large intestine where it will be broken down by fermentation. Abdominal discomfort, flatulence and diarrhoea can result, and dosage needs careful adjustment to avoid these side-effects.
Orlistat is a lipase inhibitor which reduces the absorption of fat from the diet. It benefits diabetes indirectly by promoting weight loss in patients under careful dietary supervision on a low fat diet. This is necessary to avoid unpleasant steatorrhoea.
Gastric banding and gastric bypass surgery (see p. 220) have been used in those with marked obesity unresponsive to 6 months’ intensive attempts at dieting and graded exercise. NICE recommends consideration of surgery in those with a BMI >40, or in those with BMI >35 and co-morbidities such as diabetes or hypertension which will be alleviated by weight loss. In the USA, the FDA-recommended BMI thresholds are lower. The risks of surgery are not insignificant, and long-term specialist care and follow-up are needed, including psychological support and nutritional supplements for those with bowel resection, but these concerns should be balanced against the risk of patients staying as they are. About one-third of patients become non-diabetic after gastric bypass, but the condition may recur.
Insulin treatment
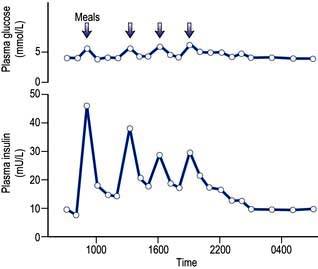
Insulin is found in every vertebrate, and the key parts of the molecule show few species differences. Small differences in the amino acid sequence may alter the antigenicity of the molecule. The glucose and insulin profiles in normal subjects are shown in Figure 20.7.
Insulins derived from beef or pig pancreas have been replaced in most countries by biosynthetic human insulin. This is produced by adding a DNA sequence coding for insulin or proinsulin into cultured yeast or bacterial cells. Short-acting insulins are used for pre-meal injection in multiple dose regimens, for continuous intravenous infusion in labour or during medical emergencies, and in patients using insulin pumps. Human insulin is absorbed slowly, reaching a peak 60–90 min after subcutaneous injection, and its action tends to persist after meals, predisposing to hypoglycaemia. Absorption is delayed because soluble insulin is in the form of stable hexamers (six insulin molecules around a zinc core) and needs to dissociate to monomers or dimers before it can enter the circulation. Short-acting insulin analogues have been engineered to dissociate more rapidly following injection without altering the biological effect. Insulin analogues (Fig. 20.8) such as the rapid-acting insulins (insulin lispro, insulin aspart and insulin glulisine) enter the circulation more rapidly than human soluble insulin, and also disappear more rapidly. Although widely used, the short-acting analogues have little effect upon overall glucose control in most patients, mainly because improved postprandial glucose is balanced by higher levels before the next meal. A Cochrane review has concluded that there is little evidence as to their benefit in type 2 diabetes.
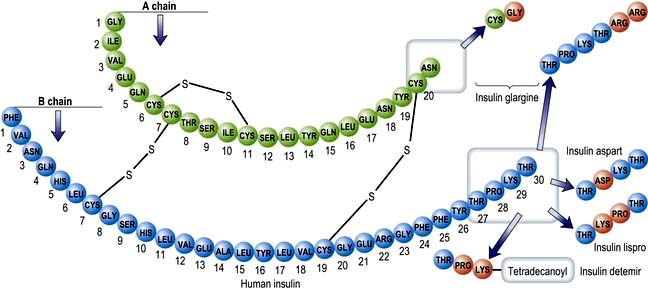
Figure 20.8 Amino acid structure of human insulin. Lispro is a genetically engineered rapidly acting insulin analogue created by reversing the order of the amino acids proline and lysine in positions 28 and 29 of the B chain. Insulin aspart is a similar analogue created by replacing proline at position 28 of the B chain with an aspartic acid residue. Insulin glargine is a genetically engineered long-acting insulin created by replacing asparagine in position 21 of the A chain with a glycine residue and adding two arginines to the end of the B chain. Insulin detemir discards threonine in position 30 of the B chain and adds a fatty acyl chain to lysine in position B29.
Intermediate and longer-acting insulins
The action of human insulin can be prolonged by the addition of zinc or protamine derived from fish sperm. The most widely used form is NPH (isophane insulin), which has the advantage that it can be premixed with soluble insulin to form stable mixtures (biphasic insulins), of which the combination of 30% soluble with 70% NPH is most widely used. Long-acting analogues have their structure modified to delay absorption or to prolong their duration of action. Insulin glargine is soluble in the vial as a slightly acidic (pH 4) solution, but precipitates at subcutaneous pH, thus prolonging its duration of action. Insulin detemir has a fatty acid ‘tail’ which allows it to bind to serum albumin, and its slow dissociation from the bound state prolongs its duration of action. Although popular and widely used, these insulins have little demonstrated advantage over NPH in many clinical situations, although useful in those on intensified therapy or with troublesome hypoglycaemia.
Practical management of diabetes
All patients with diabetes require advice about diet and lifestyle. Lifestyle changes, i.e. controlling weight, stopping smoking and taking regular exercise, can prevent or delay the onset of type 2 diabetes in people with glucose intolerance. Good glycaemic control is unlikely to be achieved with insulin or oral therapy when diet is neglected, especially when the patient is also overweight. Regular exercise helps to control weight and reduces cardiovascular risk. Blood pressure control is vital using an angiotensin converting enzyme (ACE) inhibitor or angiotensin II receptor (AIIR) antagonist (see p. 782); Most patients will also benefit from a statin and low-dose aspirin (see p. 1022).
FURTHER READING
Inzucchi SE, Bergenstal RM, Buse JB et al. Management of hyperglycemia in type 2 diabetes: a patient-centered approach. Position Statement of the American Diabetes Association (ADA) and the European Association for the Study of Diabetes (EASD). Diabetes Care, published online 19 April 2012.
Rejeski W et al. Lifestyle change and mobility in obese adults with type 2 diabetes. N Engl J Med 2012; 366:1209–1217.
The great majority of patients presenting over the age of 40 will have type 2 diabetes, but do not miss the occasional type 1 patient presenting late. An approach to their management is illustrated in Figure 20.9. Goals of treatment are described on page 1016. Type 2 diabetes is characterized by progressive beta-cell failure, and glucose control deteriorates over time, requiring a progressive and pre-emptive escalation of diabetes therapy. Regular review is essential for this to be achieved. Most patients on tablets will eventually require insulin, and it is helpful to explain this from the outset. The most widespread error in management at this stage is procrastination; the patient whose control is inadequate on oral therapy should start insulin without undue delay. Targets for glucose control are discussed later (p. 1016).
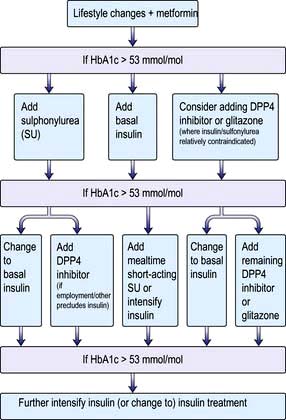
Figure 20.9 A treatment pathway for type 2 diabetes mellitus. Note that discussion of lifestyle changes and compliance should be undertaken at every stage. All patients require BP control, statin therapy and low-dose aspirin. GLP-1 agonists are also used in many countries, but not NICE-recommended in the UK. DPP4, dipeptidyl peptidase-4.
There is little consensus regarding the optimal insulin regimen in type 2 diabetes, but an intermediate insulin given at night with metformin during the day is initially as effective as multidose insulin regimens in controlling glucose levels, and is less likely to promote weight gain, which is a common complication of insulin therapy. Metformin is a useful adjunct to insulin in those able to tolerate it. Addition of a morning dose of insulin may become necessary to control postprandial hyperglycaemia. Twice-daily injections of pre-mixed soluble and isophane insulins (i.e. biphasic isophane insulin) are widely used and reasonably effective (Fig. 20.10a). More aggressive treatment, with multiple injections or continuous infusion pumps, is increasingly used in younger patients with type 2 diabetes.
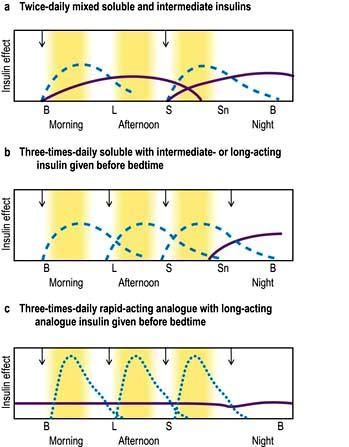
Figure 20.10 Insulin regimens. Profiles of soluble insulins are shown as: dashed lines; intermediate- or long-acting insulin as solid lines (purple); and rapid-acting insulin as dotted lines (blue). The arrows indicate when the injections are given. B, breakfast; L, lunch; S, supper; Sn, snack (bedtime).
Principles of insulin treatment
Injections
The needles used to inject insulin are very fine and sharp. Even though most injections are virtually painless, patients are understandably apprehensive and treatment begins with a lesson in injection technique. Insulin is usually administered by a pen injection device but can be drawn up from a vial into special plastic insulin syringes marked in units (100 U in 1 mL). Injections are given into the fat below the skin on the abdomen, thighs or upper arm, and the needle is usually inserted to its full length. Slim adults and children usually use a 31 gauge 6 mm needle and fatter adults a 30 gauge 8 mm needle. Both reusable and disposable pen devices are available, together with a range of devices to aid injection. The injection site used should be changed regularly to prevent areas of lipohypertrophy (fatty lumps). The rate of insulin absorption depends on local subcutaneous blood flow, and is accelerated by exercise, local massage or a warm environment. Absorption is more rapid from the abdomen than from the arm, and is slowest from the thigh. All these factors can influence the shape of the insulin profile.
Insulin administration
In healthy individuals a sharp increase in insulin occurs after meals; this is superimposed on a constant background of secretion (Fig. 20.7). Insulin therapy attempts to reproduce this pattern, but ideal control is difficult to achieve for four reasons:
In normal subjects, insulin is secreted directly into the portal circulation and reaches the liver in high concentration; about 50% of the insulin produced by the pancreas is cleared by the liver. By contrast, insulin injected subcutaneously passes into the systemic circulation before passage to the liver. Insulin-treated patients therefore have lower portal levels of insulin and higher systemic levels relative to the physiological situation.
Subcutaneous soluble insulin takes 60–90 min to achieve peak plasma levels, so the onset and offset of action are too slow.
The absorption of subcutaneous insulin into the circulation is variable.
Basal insulin levels are constant in normal people, but injected insulin invariably peaks and declines in people with diabetes, with resulting swings in metabolic control.
A multiple injection regimen with short-acting insulin and a longer-acting insulin at night is appropriate for most younger patients (Fig. 20.10b). The advantages of multiple injection regimens are that the insulin and the food go in at roughly the same time so that meal times and sizes can vary, without greatly disturbing metabolic control. The flexibility of multiple injection regimens is of great value to patients with busy jobs, shift workers and those who travel regularly. Some recovery of endogenous insulin secretion may occur over the first few months (the ‘honeymoon period’) in type 1 patients and the insulin dose may need to be reduced or even stopped for a period. Requirements rise thereafter. Strict glucose control from diagnosis in type 1 diabetes prolongs beta-cell function, resulting in better glucose levels and less hypoglycaemia. Target blood glucose values should normally be 4–7 mmol/L before meals and 4–10 mmol/L after meals, assuming that this can be achieved without troublesome hypoglycaemia.
All patients need careful training for a life with insulin. This is best achieved outside hospital, provided that adequate facilities exist for outpatient diabetes education. A scheme for adjusting insulin regimens is given in Table 20.7. DAFNE is described on page 1010.
Table 20.7 Guide to adjusting insulin dosage according to blood glucose test results
| Blood glucose persistently too high | Blood glucose persistently too low | |
|---|---|---|
Before breakfast |
Increase evening long-acting insulin |
Reduce evening long-acting insulin |
Before lunch |
Increase morning short-acting insulin |
Reduce morning short-acting insulin or increase mid-morning snack |
Before evening meal |
Increase morning long-acting insulin or lunch short-acting insulin |
Reduce morning long-acting insulin or lunch short-acting insulin or increase mid-afternoon snack |
Before bed |
Increase evening short-acting insulin |
Reduce evening short-acting insulin |
When to use insulin analogues
Hypoglycaemia between meals and particularly at night is the limiting factor for many patients on multiple injection regimens. The more expensive rapid-acting insulin analogues (Fig. 20.10c) are a useful substitute for soluble insulin in some patients. They reduce the frequency of nocturnal hypoglycaemia due to reduced carry-over effect from the day-time. They are often used on grounds of convenience, since patients can inject shortly before meals but standard insulins injected at the same time give equivalent overall control. High or erratic morning blood sugar readings can prove a problem for about a quarter of all patients on conventional multiple injection regimens, because the bedtime intermediate-acting insulin falls and the absorption is variable. The long-acting insulin analogues insulin glargine and insulin detemir may help to overcome these problems and reduce the risk of nocturnal hypoglycaemia.
Infusion devices
CSII (continuous subcutaneous insulin infusion) is delivered by a small pump strapped around the waist that infuses a constant trickle of insulin via a needle in the subcutaneous tissues. Meal-time doses are delivered by the user telling the pump to deliver a bolus of insulin at the start of a meal.
This approach is particularly useful in the overnight period, since the basal overnight infusion rate can be programmed to fit each patient’s needs. Disadvantages include the nuisance of being attached to a gadget, skin infections, the risk of ketoacidosis if the flow of insulin is broken (since these patients have no protective reservoir of injected depot insulin) and cost. Infusion pumps should only be used by specialized centres able to offer a round-the-clock service to their patients. This form of treatment has revolutionized the lives of some people with type 1 diabetes.
Complications of insulin therapy
Shallow injections result in intradermal insulin delivery and painful, reddened lesions or even scarring. Injection site abscesses occur but are extremely rare.
Local allergic responses sometimes occur early in therapy but usually resolve spontaneously. Generalized allergic responses are exceptionally rare. Fatty lumps, known as lipohypertrophy, may occur as the result of overuse of a single injection site with any type of insulin.
The most common cause of mild insulin resistance is obesity. Occasional unstable patients require massive insulin doses, sometimes with a fluctuating requirement. Rare syndromes of insulin resistance may be present, but most cases are unexplained. Insulin resistance associated with antibodies directed against the insulin receptor has been reported in patients with acanthosis nigricans (Table 20.3).
Many patients show weight gain on insulin treatment, especially if the insulin dose is increased inappropriately, but this can to some extent be overcome by emphasis on the need for diet and exercise, plus addition of metformin. Patients who are in poor control when insulin is started tend to gain (or regain) most weight.
Hypoglycaemia during insulin treatment
This is the most common complication of insulin therapy, and limits what can be achieved with insulin treatment. It is a major cause of anxiety for patients and relatives. It results from an imbalance between injected insulin and a patient’s normal diet, activity and basal insulin requirement. The times of greatest risk are before meals, during the night, and during exercise. Irregular eating habits, unusual exertion and alcohol excess may precipitate episodes; other cases appear to be due simply to variation in insulin absorption.
Symptoms develop when the blood glucose level falls below 3 mmol/L and typically develop over a few minutes, with most patients experiencing ‘adrenergic’ features of sweating, tremor and a pounding heartbeat. Virtually all patients with type 1 diabetes experience intermittent hypoglycaemia and one in three will go into a coma at some stage in their lives. A small minority suffer attacks that are so frequent and severe as to be virtually disabling.
Physical signs include pallor and a cold sweat. Many patients with longstanding diabetes report loss of these warning symptoms (hypoglycaemic unawareness) and are at a greater risk of central nervous dysfunction (neuroglycopenia) resulting in altered behaviour or conscious level. Such patients appear pale, drowsy or detached, signs that their relatives quickly learn to recognize. Behaviour is clumsy or inappropriate, and some become irritable or even aggressive. Others slip rapidly into hypoglycaemic coma. Occasionally, patients develop convulsions during hypoglycaemic coma, especially at night. This must not be confused with idiopathic epilepsy. Another presentation is with a hemiparesis that resolves when glucose is administered.
People with diabetes have an impaired ability to counter-regulate glucose levels after hypoglycaemia. The glucagon response is invariably deficient, even though the α cells are preserved and respond normally to other stimuli. The epinephrine (adrenaline) response may also fail in patients with a long duration of diabetes, and this is associated with hypoglycaemia unawareness. Recurrent hypoglycaemia may itself induce a state of hypoglycaemia unawareness, and the ability to recognize the condition may sometimes be restored by relaxing control for a few weeks.
Nocturnal hypoglycaemia. Basal insulin requirements fall during the night but increase again from about 4 a.m. onwards, at a time when levels of injected insulin are falling. As a result many patients wake with high blood glucose levels, but find that injecting more insulin at night increases the risk of hypoglycaemia in the early hours of the morning. The problem may be helped by the following:
Checking that a bedtime snack is taken regularly
Patients taking twice-daily mixed insulin can separate their evening dose and take the intermediate insulin at bedtime rather than before supper
Reducing the dose of soluble insulin before supper, since the effects of this persist well into the night
Changing to a rapid-acting insulin analogue, with a long-lasting insulin analogue at night.
Changing to an insulin infusion pump which can be programmed to deliver lower doses of insulin at the time of night when a patient has been experiencing hypoglycaemia.
Any form of rapidly absorbed carbohydrate will relieve the early symptoms, and glucose or sweets should always be carried. Drowsy individuals will be able to take carbohydrate in liquid form (e.g. Lucozade). All patients and their close relatives need training about the risks of hypoglycaemia. More carbohydrate than necessary should not be taken during the recovery period, since this causes a rebound to hyperglycaemia. Alcohol excess increases the risk of hypoglycaemia, and this requires careful explanation, together with the need to guard against hypoglycaemia while driving.
The diagnosis of severe hypoglycaemia resulting in confusion or coma is simple and can usually be made on clinical grounds, backed by a bedside blood test. If real doubt exists, blood should be taken for glucose estimation before treatment is given. Patients should carry a card or wear a bracelet or necklace to say that they have diabetes, and these should be looked for in unconscious patients.
Unconscious patients should be given either intramuscular glucagon (1 mg) or intravenous glucose (25–50 mL of 50% glucose solution) followed by a flush of 0.9% saline to preserve the vein (since 50% glucose scleroses veins). Glucagon acts by mobilizing hepatic glycogen, and works almost as rapidly as glucose. It is simple to administer and can be given at home by relatives. It does not work when liver glycogen levels are low, as after a prolonged fast. Oral glucose is given to replenish glycogen reserves once the patient revives.
Whole pancreas and pancreatic islet transplantation
Whole pancreas transplantation has been performed for some 30 years, usually in diabetic patients who require immunosuppression for a kidney transplant. Surgical advances have greatly improved the outcome of this procedure. In experienced hands graft function lasts longer with considerable improvement in quality of life. Patient survival is better in those who receive simultaneous pancreas and kidney grafts, mainly because of the delay involved in waiting for a pancreas to become available following renal transplantation. There is some evidence of protection against or reversal of some complications of diabetes, but this comes at the cost of long-term immunosuppression.
Islet transplantation is performed by harvesting pancreatic islets from cadavers (two or three pancreata are usually needed); these are then injected into the portal vein and seed themselves into the liver. This form of treatment had limited success for many years, but improved treatment protocols have now achieved more promising results. The main indication is disabling hypoglycaemia, and the main disadvantage is the need for powerful immunosuppressive therapy, with its associated costs and complications.
Measuring the metabolic control of diabetes
Urine tests
Urine dipstick tests, although less informative than blood tests, offer some feedback on metabolic control. Patients with consistently negative tests and no symptoms of hypoglycaemia are generally well controlled. Nevertheless, the correlation between urine tests and simultaneous blood glucose is poor for three reasons:
Home blood glucose testing
Blood tests offer invaluable feedback to everyone affected by diabetes, but their routine use varies according to need. Patients soon learn to provide their own profiles using finger-prick blood samples and reagent strips which can be read with the aid of a meter. Blood is taken from the side of a finger tip (not from the tip, which is densely innervated) using a special lancet usually fitted to a spring-loaded device, a range of which are available. The fasting blood glucose concentration is reproducible in diet or tablet-treated type 2 diabetes, and is therefore a useful guide to therapy, supplemented by occasional tests after meals. Those on insulin treatment require more frequent testing in order to adjust their therapy and avoid hypoglycaemia. Regular profiles (e.g. four daily samples on at least two days each week) are needed in those on intensified therapy, and should be recorded electronically or in a record book. Patients on insulin are encouraged to adjust their insulin dose as appropriate (Table 20.7) and should be able to obtain advice over the telephone when needed. Blood glucose monitoring does not in itself result in better control, but is essential to those wishing to achieve it.
Glycosylated haemoglobin (HbA1 or HbA1c) and fructosamine
Glycosylation of haemoglobin occurs as a two-step reaction, resulting in the formation of a covalent bond between the glucose molecule and the terminal valine of the β chain of the haemoglobin molecule. The rate at which this reaction occurs is related to the prevailing glucose concentration. Glycosylated haemoglobin is expressed as a percentage of the normal haemoglobin (standardized range 4–6.1%; 20–44 mmol/mol). This test provides an index of the average blood glucose concentration over the life of the haemoglobin molecule (approximately 6 weeks). The figure will be misleading if the life-span of the red cell is reduced or if an abnormal haemoglobin or thalassaemia is present. There is considerable interindividual variation in HbA1c levels, even in health. Although the glycosylated haemoglobin test provides a rapid assessment of glycaemic control in a given patient, blood glucose testing is needed before the clinician can know what to do about it.
Glycosylated plasma proteins (‘fructosamine’) may also be measured as an index of control. Glycosylated albumin is the major component, and fructosamine measurement relates to glycaemic control over the preceding 2–3 weeks. It is useful in patients with anaemia or haemoglobinopathy and in pregnancy (when haemoglobin turnover is changeable) and other situations where changes of treatment need a swift means of assessing progress.
Targets for glucose control
Data from the UK Prospective Diabetic Study (UKPDS) and the Diabetes Control and Complications Trial (DCCT) suggest that patients with both type 1 diabetes and type 2 diabetes should ideally aim to run their glycosylated haemoglobin readings below 7.0% (53 mmol/mol) in order to reduce the risk of long-term microvascular complications (Table 20.8). Hypoglycaemia, patterns of eating and lifestyle, weight problems and problems accepting and coping with diabetes limit what can be achieved (see p. 1017). Some will, but most will not, be able to reach these target values, particularly as their duration of diabetes increases. Realistic goals should be set for each patient, taking into account what is likely to be achievable, and this applies in particular to elderly patients and those with a limited prognosis.
Table 20.8 Target goals of risk factors for diabetic patients
| Parameter | Ideal | Reasonable but not ideal |
|---|---|---|
HbA1c |
<7% (53 mmol/mol) |
<8% (64 mmol/mol) |
Blood pressure (mmHg) |
<130/80 |
<140/80 |
Total cholesterol (mmol/L) |
<4.0 |
<5.0 |
LDL |
<2.0 |
<3.0 |
HDL* |
>1.1 |
>0.8 |
Triglycerides |
<1.7 |
<2.0 |
Standards from American Diabetes Association (2003).
Does good glucose control matter?
Blood glucose is just one measure of the diverse metabolic consequences of diabetes which not only affect carbohydrate metabolism but also the metabolism of lipids and proteins.
The DCCT in the USA compared standard and intensive insulin therapy in a large prospective controlled trial of young patients with type 1 diabetes. Despite intensive therapy, mean blood glucose levels were still 40% above the non-diabetic range, but even at this level of control, the risk of progression to retinopathy was reduced by 60%, nephropathy by 30% and neuropathy by 20% over the 7 years of the study. Near-normoglycaemia should, therefore, be the goal for all young patients with type 1 diabetes. The unwanted effects of this policy include weight gain and a two- to three-fold increase in the risk of severe hypoglycaemia. Control should be less strict in those with a history of recurrent severe hypoglycaemia.
The UKPDS compared standard and intensive treatment in a large prospective controlled trial of type 2 diabetes patients. There was a 25% overall reduction in microvascular disease end-points, a 33% reduction in albuminuria and a 30% reduction in the need for laser treatment for retinopathy in the more intensively treated patients. These benefits persisted for many years after conclusion of the trial (the ‘legacy effect’). This study also showed blood pressure control to be equally necessary in the prevention of retinopathy, but there is no legacy effect and good blood pressure control needs to be maintained. There appeared to be little difference in outcome between the agents used to achieve good metabolic control (metformin, sulfonylurea or insulin). Intensive blood pressure control very considerably reduced the cardiovascular risk.
Recent trials in type 2 diabetes. Three large outcome studies in type 2 diabetes have confirmed the benefits of good glucose control upon microvascular complications, although these benefits diminish with increasing age. Glucose control appears to be of less value in prevention of arterial disease, and the current trend is to aim for more relaxed glucose control in older patients (e.g. HbA1c <8% (<64 mmol/mol)), while attention to blood pressure and lipids should take priority. In the recent ACCORD study the use of intensive therapy to target a glycated hemoglobin level below 6% in people with type 2 diabetes increased 5-year mortality. Such an intensive strategy thus cannot be recommended, particularly for high-risk patients with advanced type 2 diabetes.
Regular checks for patients with diabetes
Box 20.3 is modified from the guidelines set out in The European Patients’ Charter published by the St Vincent Declaration Steering Committee of the WHO. The charter sets out goals for both the healthcare team and the patient.
Box 20.3
Regular checks for patients with diabetes
Checked at least once a year
Biochemical assessment of metabolic control (e.g. glycosylated Hb test)
Measure plasma lipids (except in extreme old age)
Examine state of retina (ophthalmoscope or retinal photo)
Test urine for proteinuria/microalbuminuria
Test blood for renal function (creatinine, eGFR)
Check condition of feet, pulses and neurology
Review cardiovascular risk factors
FURTHER READING
DCCT/Epidemiology of Diabetes Interventions and Complications Research Group. Retinopathy and nephropathy in patients with type 1 diabetes four years after a trial of intensive insulin therapy. N Engl J Med 2000; 342:381–389.
Holman RR, Paul SK, Bethel MA et al. Long-term follow-up after tight control of blood pressure in type 2 diabetes. N Engl J Med 2008; 359:1565–1576.
Holman RR, Paul SK, Bethel MA et al. 10 year follow-up of intensive glucose control in type 2 diabetes. N Engl J Med 2008; 359:1577–1589.
Mazzone T, Chait A, Plutzky J. Cardiovascular disease risk in type 2 diabetics. Lancet 2008; 371:1800–1809.
The ACCORD Study Group. Long-term effects of intensive glucose lowering on cardiovascular outcomes. N Engl J Med 2011; 364:818–828.
Psychosocial implications of diabetes
Patients starting tablet or insulin treatment should live as normal a life as possible, but this is not always easy. Tact, empathy, encouragement and practical support are needed from all members of the clinical team. Diabetes, like any chronic disease, has psychological sequelae. Most patients will experience periods of not coping, of helplessness, of denial and of acceptance often fluctuating over time. Other problems include:
You cannot take a ‘holiday’ from diabetes – yet the human psyche is poorly developed to cope with unremitting adversity.
Concessions or sympathy are often denied to the person with diabetes, since its presence is invisible.
The treatment is complex and demanding, and the person with diabetes must make trade-offs between short-term and long-term wellbeing.
Embarrassing loss of control over personal behaviour or consciousness can occur in insulin-treated patients when minor miscalculation leads to hypoglycaemia.
Risk-taking behaviour is indulged in by all humans when emotion is in conflict with logical thought, but its effects can be much greater for the person with diabetes (particularly the risks of unplanned pregnancy, alcohol and tobacco).
Poor self-image is a very common problem.
Eating disorders are more common in people with diabetes – 30–40% of young women will report disordered eating at some stage of their diabetes.
Omission of tablets or insulin is common since non-adherence to treatment regimens is universal in all illness. Between one in four and one in five tablets prescribed for diabetes is not consumed within the designated treatment period. Insulin omission is very common in young women in whom the pressure to lose weight may overcome concerns about long-term complications.
Adolescence
A period of poor metabolic control, or dropping out of medical care for a time and re-emerging with complications, is very common in adolescence. Diabetic Summer Camps (e.g. run by Diabetes UK) help prevent a feeling of isolation and not knowing anyone else with the same problem. Separate adolescent clinics allow:
Practical aspects
Patients need to inform the driving and vehicle licensing authority and their insurance companies after diagnosis. They would also be wise to inform their family, friends and employers in case unexpected hypoglycaemia occurs. Insulin treatment can be undertaken by people in most walks of life. A few jobs are unsuitable; these include driving Heavy Goods or Public Service vehicles; working at heights; piloting aircraft or working close to dangerous machinery in motion. Certain professions such as the police and the armed forces are barred to all diabetic patients. There are few other limitations, although a considerable amount of ill-informed prejudice exists. Doctors can sometimes help support patients in the face of misinformed work practices.
Diabetic metabolic emergencies
The main terms used are defined in Table 20.9.
Table 20.9 Terms used in uncontrolled diabetes
Ketonuria |
Detectable ketone levels in the urine; it should be appreciated that ketonuria occurs in fasted non-diabetics and may be found in relatively well-controlled patients with insulin-dependent diabetes mellitus |
Ketosis |
Elevated plasma ketone levels in the absence of acidosis |
Diabetic ketoacidosis |
A metabolic emergency in which hyperglycaemia is associated with a metabolic acidosis due to greatly raised (>5 mmol/L) ketone levels |
Hyperosmolar hyperglycaemic state |
A metabolic emergency in which uncontrolled hyperglycaemia induces a hyperosmolar state in the absence of significant ketosis |
Lactic acidosis |
A metabolic emergency in which elevated lactic acid levels induce a metabolic acidosis. In diabetic patients it is rare and associated with biguanide therapy |
Diabetic ketoacidosis
Diabetic ketoacidosis (DKA) is the hallmark of type 1 diabetes. It is usually seen in the following circumstances:
The majority of cases reaching hospital could have been prevented by earlier diagnosis, better communication between patient and doctor and better patient education. The most common error of management is for patients to reduce or omit insulin because they feel unable to eat, owing to nausea or vomiting. This is a factor in at least 25% of all hospital admissions. Insulin may need adjusting up or down but should never be stopped.
Pathogenesis
Ketoacidosis is a state of uncontrolled catabolism associated with insulin deficiency. Insulin deficiency is a necessary precondition since only a modest elevation in insulin levels is sufficient to inhibit hepatic ketogenesis, and stable patients do not readily develop ketoacidosis when insulin is withdrawn. Other factors include counter-regulatory hormone excess and fluid depletion. The combination of insulin deficiency with excess of its hormonal antagonists leads to the parallel processes shown in Figure 20.11. In the absence of insulin, hepatic glucose production accelerates, and peripheral uptake by tissues such as muscle is reduced. Rising glucose levels lead to an osmotic diuresis, loss of fluid and electrolytes, and dehydration. Plasma osmolality rises and renal perfusion falls. In parallel, rapid lipolysis occurs, leading to elevated circulating free fatty-acid levels. The free fatty acids are broken down to fatty acyl-CoA within the liver cells, and this in turn is converted to ketone bodies within the mitochondria (Fig. 20.12). Accumulation of ketone bodies produces a metabolic acidosis. Vomiting leads to further loss of fluid and electrolytes. The excess ketones are excreted in the urine but also appear in the breath, producing a distinctive smell similar to that of acetone. Respiratory compensation for the acidosis leads to hyperventilation, graphically described as ‘air hunger’. Progressive dehydration impairs renal excretion of hydrogen ions and ketones, aggravating the acidosis. As the pH falls below 7.0 ([H+] >100 nmol/L), pH-dependent enzyme systems in many cells function less effectively. Untreated, severe ketoacidosis is invariably fatal.
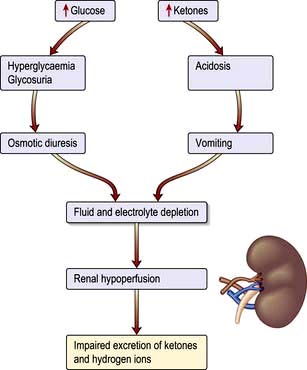
Figure 20.11 Dehydration occurs during ketoacidosis as a consequence of two parallel processes. Hyperglycaemia results in osmotic diuresis, and hyperketonaemia results in acidosis and vomiting. Renal hypoperfusion then occurs and a vicious circle is established as the kidney becomes less able to compensate for the acidosis.
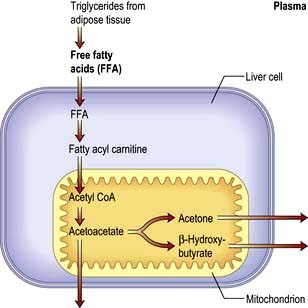
Clinical features
The features of ketoacidosis are those of uncontrolled diabetes with acidosis, and include prostration, hyperventilation (Kussmaul respiration), nausea, vomiting and, occasionally, abdominal pain. The latter is sometimes so severe that it can be confused with a surgical acute abdomen.
Some patients are mentally alert at presentation, but confusion and stupor are present in more severe cases. Up to 5% present in coma. Evidence of marked dehydration is present and the eyeball is lax to pressure in severe cases. Hyperventilation is present but becomes less marked in very severe acidosis owing to respiratory depression. The smell of ketones on the breath allows an instant diagnosis to be made by those able to detect the odour. The skin is dry and the body temperature is often subnormal, even in the presence of infection; in such cases, pyrexia may develop later.
Diagnosis
This is confirmed by demonstrating hyperglycaemia with ketonaemia or heavy ketonuria, and acidosis. No time should be lost, and treatment is started as soon as the first blood sample has been taken. Hyperglycaemia is demonstrated by dipstick, while a venous blood sample is sent to the laboratory for confirmation. Ketonaemia is confirmed by centrifuging a blood sample and testing the plasma with a dipstick that measures ketones. Hand-held sensors measuring β-hydroxybutyrate in 30 s are available. An arterial blood sample is taken for blood gas analysis.
The severity of DKA can be assessed as follows. One or more suggest severe DKA.
Pulse >100 b.p.m. or <60 b.p.m.
Glasgow Coma Score of <12 (see Table 22.10, p. 1092) or abnormal ‘Alert, Voice, Pain, Unresponsive’ scale (AVPU)
Management (pathophysiology)
The principles of management are as follows (Emergency Box 20.1); these should be carried out in a high dependency area.
Replace the fluid losses with 0.9% saline. Average loss of water is 5–7 litres with a sodium loss of 500 mmol.
Replace the electrolyte losses. Patients have a total body potassium deficit of 350 mmol, although initial plasma levels may not be low. Insulin therapy leads to uptake of potassium by the cells with a consequent fall in plasma K+ levels. Potassium is therefore given as soon as insulin is started.
Restore the acid–base balance. A patient with healthy kidneys will rapidly compensate for the metabolic acidosis once the circulating volume is restored. Bicarbonate is seldom necessary and is only used if the pH is below 7.0 ([H+] >100 nmol/L), and is best given as an isotonic (1.26%) solution.
Replace the deficient insulin. Relatively modest doses of insulin lower blood glucose by suppressing hepatic glucose output rather than by stimulating peripheral uptake, and are therefore much less likely to produce hypoglycaemia. Insulin and glucose together both inhibit gluconeogenesis, and thus ketone production, and are needed to metabolize ketones into less harmful substances. Short-acting insulin is given as an intravenous infusion where facilities for adequate supervision exist or as hourly intramuscular injections. The subcutaneous route is avoided because subcutaneous blood flow is reduced in shocked patients.
Monitor blood glucose closely (see Emergency Box 20.1).
Seek the underlying cause. Physical examination may reveal a source of infection (e.g. a perianal abscess). Two common markers of infection are misleading: fever is unusual even when infection is present, and polymorpholeucocytosis is present even in the absence of infection. Relevant investigations include a chest X-ray, urine and blood cultures and an ECG (to exclude myocardial infarction). The serum amylase may be elevated in the absence of pancreatitis. If infection is suspected, broad-spectrum antibiotics are started once the appropriate cultures have been taken.
 Emergency Box 20.1
Guidelines for the diagnosis and management of diabetic ketoacidosis
Phase 1
Phase 2
INSULIN AND GLUCOSE: When blood glucose falls to 10–12 mmol/L, change infusion fluid to 1 L 5% glucose plus 20 mmol KCl 6-hourly. Continue insulin with dose adjusted according to hourly blood glucose test results (e.g. i.v. 3 U/h glucose 15 mmol/L; 2 U/h when glucose 10 mmol/L).
Phase 3
Once stable and able to eat and drink normally, transfer patient to four times daily subcutaneous insulin regimen (based on previous 24 hours’ insulin consumption and trend in consumption).
Subsequent management
Note: The regimen of fluid replacement set out above is a guide for patients with severe ketoacidosis. Excessive fluid can precipitate pulmonary and cerebral oedema; inadequate replacement may cause renal failure. Fluid replacement must therefore be tailored to the individual and monitored carefully throughout treatment.
Problems of management
Hypotension. This may lead to renal shutdown. Plasma expanders (or whole blood) are therefore given if the systolic blood pressure is below 80 mmHg. A central venous pressure line is useful in this situation. A bladder catheter is inserted if no urine is produced within 2 h, but routine catheterization is not necessary.
Coma. The usual principles apply (see p. 1093). It is essential to pass a nasogastric tube to prevent aspiration, since gastric stasis is common and carries the risk of aspiration pneumonia if a drowsy patient vomits.
Cerebral oedema. This is a rare, but serious complication and has mostly been reported in children or young adults. Excessive rehydration and use of hypertonic fluids such as 8.4% bicarbonate may sometimes be responsible. The mortality is high.
Hypothermia. Severe hypothermia with a core temperature below 33°C may occur and can be overlooked unless a rectal temperature is taken with a low-reading thermometer.
Late complications. These include pneumonia and deep-vein thrombosis (DVT prophylaxis, see p. 429 is essential) and occur especially in the comatose or elderly patient.
Complications of therapy. These include hypoglycaemia and hypokalaemia, due to loss of K+ in the urine from osmotic diuresis. Overenthusiastic fluid replacement may precipitate pulmonary oedema in the very young or the very old. Hyperchloraemic acidosis may develop in the course of treatment since patients have lost a large variety of negatively charged electrolytes, which are replaced with chloride. The kidneys usually correct this spontaneously within a few days.
Subsequent management
Intravenous glucose and insulin are continued until the patient feels able to eat and keep food down. The drip is then taken down and a similar amount of insulin is given as four injections of soluble insulin subcutaneously at meal times and a dose of intermediate-acting insulin at night.
Sliding-scale regimens are unnecessary and may even delay the establishment of stable blood glucose levels.
The mortality of diabetic ketoacidosis is around 5%, and is increased in older patients. Its treatment is incomplete without a careful enquiry into the causes of the episode and advice as to how to avoid its recurrence.
Hyperosmolar hyperglycaemic state
This condition, in which severe hyperglycaemia develops without significant ketosis, is the metabolic emergency characteristic of uncontrolled type 2 diabetes. Patients present in middle or later life, often with previously undiagnosed diabetes. Common precipitating factors include consumption of glucose-rich fluids, concurrent medication such as thiazide diuretics or steroids, and intercurrent illness. The hyperosmolar hyperglycaemic state and ketoacidosis represent two ends of a spectrum rather than two distinct disorders (Box 20.4). The biochemical differences may partly be explained as follows:
Age. The extreme dehydration characteristic of hyperosmolar hyperglycaemic state may be related to age. Old people experience thirst less acutely, and more readily become dehydrated. In addition, the mild renal impairment associated with age results in increased urinary losses of fluid and electrolytes.
The degree of insulin deficiency. This is less severe in the hyperosmolar hyperglycaemic state. Endogenous insulin levels are sufficient to inhibit hepatic ketogenesis, but insufficient to inhibit hepatic glucose production.
Box 20.4
Electrolyte changes in diabetic ketoacidosis and the hyperosmolar hyperglycaemic state
Examples of blood values
| Severe ketoacidosis | Hyperosmolar hyperglycaemic state | |
|---|---|---|
Na+ (mmol/L) |
140 |
155 |
K+ (mmol/L) |
5 |
5 |
Cl− (mmol/L) |
100 |
110 |
HCO3− (mmol/L) |
5 |
25 |
Urea (mmol/L) |
8 |
15 |
Glucose (mmol/L) |
30 |
50 |
Arterial pH |
7.0 |
7.35 |
The normal range of osmolality is 285–300 mOsm/kg. It can be measured directly, or can be calculated approximately from the formula:

For instance, in the example of severe ketoacidosis given above:

and in the example of the hyperosmolar hyperglycaemic state:

The normal anion gap is <17. It is calculated as (Na+ + K+) – (Cl− + HCO3−). In the example of ketoacidosis the anion gap is 40, and in the example of the hyperosmolar hyperglycaemic state, the anion gap is 25. Mild hyperchloraemic acidosis may develop in the course of therapy. This will be shown by a rising plasma chloride and persistence of a low bicarbonate even though the anion gap has returned to normal.
Clinical features
The characteristic clinical features on presentation are dehydration and stupor or coma. Impairment of consciousness is directly related to the degree of hyperosmolality. Evidence of underlying illness such as pneumonia or pyelonephritis may be present, and the hyperosmolar state may predispose to stroke, myocardial infarction or arterial insufficiency in the lower limbs.
Investigations and treatment
These are (with some exceptions) according to the guidelines for ketoacidosis. The plasma osmolality is usually extremely high. It can be measured directly or calculated as (2(Na+ + K+) + glucose + urea), all in mmol/L. Many patients are extremely sensitive to insulin, and the glucose concentration may plummet. The resultant change in osmolality may cause cerebral damage. It is sometimes useful to infuse insulin at a rate of 3 U/hour for the first 2–3 hours, increasing to 6 U/hour if glucose is falling too slowly. The standard fluid for replacement is 0.9% saline. Avoid 0.45% saline, since rapid dilution of the blood may cause more cerebral damage than a few hours of exposure to hypernatraemia. Low-molecular-weight heparin should be given to counter the increased risk of thromboembolic complications associated with this condition.
Prognosis
The reported mortality ranges as high as 20–30%, mainly because of the more advanced age of the patients and the frequency of intercurrent illness. Unlike ketoacidosis, the hyperosmolar hyperglycaemia state is not an absolute indication for subsequent insulin therapy, and survivors may do well on diet and oral agents.
Lactic acidosis
Lactic acidosis may occur in diabetic patients on biguanide therapy. The risk in patients taking metformin is extremely low provided that the therapeutic dose is not exceeded and the drug is withheld in patients with advanced hepatic or renal dysfunction.
Patients present in severe metabolic acidosis with a large anion gap (normally <17 mmol/L), usually without significant hyperglycaemia or ketosis. Treatment is by rehydration and infusion of isotonic 1.26% bicarbonate. The mortality is in excess of 50%.