Orthodontic Diagnosis
The Problem-Oriented Approach
In diagnosis, whether in orthodontics or other areas of dentistry or medicine, it is important not to concentrate so closely on one aspect of the patient’s overall condition that other significant problems are overlooked. In contemporary orthodontics, this is particularly true because patients’ concerns and priorities are often critical determinants of treatment plans, and it can be difficult sometimes for the orthodontist not to “rush to judgment” during the initial examination. It is important not to characterize the dental occlusion while overlooking a jaw discrepancy, developmental syndrome, systemic disease, periodontal problem, psychosocial problem, or the cultural milieu in which the patient is living.
A natural bias of any specialist (and one does not have to be a dental specialist to already take a very specialized point of view) is to characterize problems in terms of his or her own special interest. This bias must be recognized and consciously resisted. Diagnosis, in short, must be comprehensive and not focused only on a single aspect of what in many instances can be a complex situation. Orthodontic diagnosis requires a broad overview of the patient’s situation and must take into consideration both objective and subjective findings.
The problem-oriented approach to diagnosis and treatment planning has been widely advocated in medicine and dentistry as a way to overcome the tendency to concentrate on only one aspect of a patient’s problems. The essence of the problem-oriented approach is to develop a comprehensive database of pertinent information so that no problems will be overlooked.
For orthodontic purposes, the database may be thought of as derived from three major sources: (1) interview data from questions (written and oral) of the patient and parents, (2) clinical examination of the patient, and (3) evaluation of diagnostic records, including dental casts, radiographs, and photographs. Since all possible diagnostic records will not be obtained for all patients, one of the goals of clinical examination is to determine what diagnostic records are needed. The steps in assembling an adequate database are presented here in sequence. A discussion of which diagnostic records are needed is included.
At all stages of the diagnostic evaluation, a specialist may seek more detailed information than would a generalist, and this is a major reason for referring a patient to a specialist. The specialist is particularly likely to obtain more extensive diagnostic records, some of which may not be readily available to a generalist. In orthodontics, cephalometric radiographs and cone-beam computed tomography (CBCT) are examples. Nevertheless, the basic approach is the same for any orthodontic patient and any practitioner. A competent generalist will follow the same sequence of steps in evaluating a patient as an orthodontist would and will use the same approach in planning treatment if he or she will do the orthodontics. After all, from both legal and moral perspectives, the same standard of care is required whether the treatment is rendered by a generalist or specialist.
Questionnaire/Interview
The goal of the interview process is to establish the patient’s chief concern (major reason for seeking consultation and treatment), and to obtain further information about three major areas: (1) medical and dental history, (2) physical growth status, and (3) motivation, expectations, and other social and behavioral factors. In orthodontic specialty practice, it can be quite helpful to send the patient an interview form to fill out before the first visit to the office. An example of a form focused on the chief concern, which could be sent to the patient in advance or used as an outline for the interview with the patient, is shown in Figure 6-1. Note its emphasis on learning the extent to which the parent or adult patient is concerned about facial appearance. A form to elicit the medical/dental history, which should be filled out in advance, would accompany it, but the medical history form becomes only an outline for discussion because so many parents and patients do not list things they think are of no concern to the orthodontist.
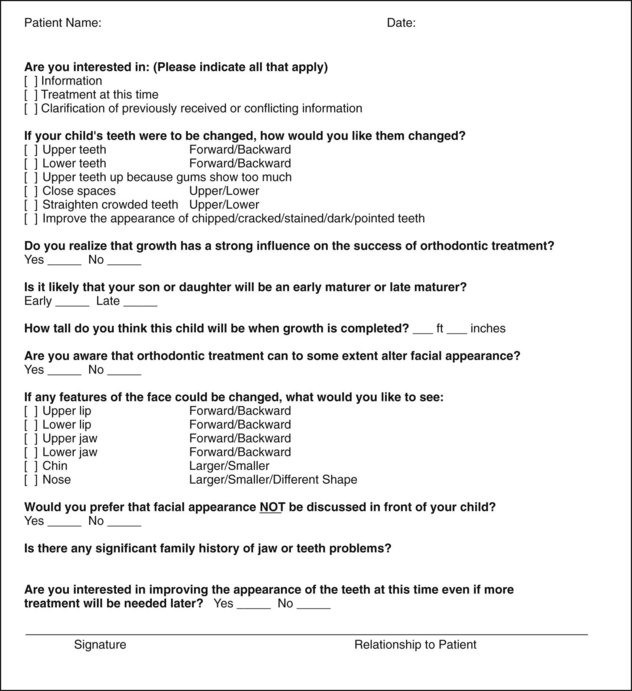
FIGURE 6-1 “Why are you here?” and “Why now?” are important questions at the initial orthodontic interview. A form of this type that patients or parents fill out in advance can be very helpful in determining what they really want. (Adapted from Dr. Alan Bloore.)
Chief Concern
As we have discussed in some detail in Chapter 1, there are three major reasons for patient concern about the alignment and occlusion of the teeth: impaired dentofacial appearance and a diminished sense of social well-being, impaired function, and impaired oral health. Although more than one of these reasons often may contribute to seeking orthodontic treatment, it is important to establish their relative importance to the patient. The dentist should not assume that appearance is the patient’s major concern just because the teeth appear unesthetic. Nor should the dentist focus on the functional implications of, for instance, a crossbite with a lateral shift without appreciating the patient’s concern about what seems to be a trivial space between the maxillary central incisors. For an individual with reasonably normal function and appearance and reasonable psychosocial adaptation, the major reason for seeking treatment may well be a desire to enhance appearance beyond the normal, thus potentially improving quality of life (QOL). The greater orientation of modern family practice toward cosmetic dentistry increases the chance that a patient may be referred to an orthodontist for comprehensive treatment simply to enhance dental and facial appearance.
When patients inquire about whether they need orthodontic treatment, a series of leading questions should be asked, beginning with, “Do you think you need braces?” If the answer is yes, one might next inquire “What bothers you most about your teeth or your appearance?” and “What do you want treatment to do for you?” The answer to that and follow-up questions will clarify what is most important to the patient. The dentist or orthodontist may or may not agree with the patient’s assessment—that judgment comes later. At this stage, the objective is to find out what is important to the patient.
Medical and Dental History
Orthodontic problems are almost always the culmination of a developmental process, not the result of pathology. As the discussion in Chapter 5 illustrates, often it is difficult to be certain of the etiology, but it is important to establish the cause of malocclusion if this can be done and at least rule out some of the possible causes. A careful medical and dental history is needed for orthodontic patients both to provide a proper background for understanding the patient’s overall situation and to evaluate specific concerns.
The outline of an appropriate medical and dental history is presented in Figure 6-2. A number of the items are annotated to explain their implications for an orthodontic patient.
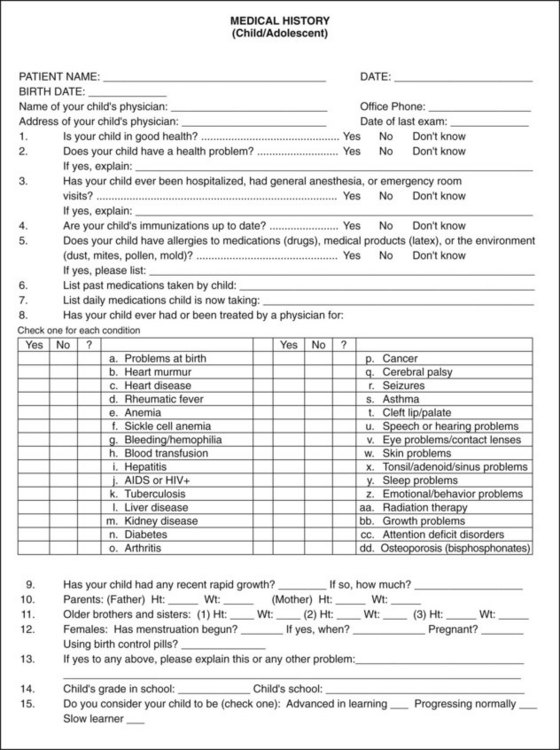
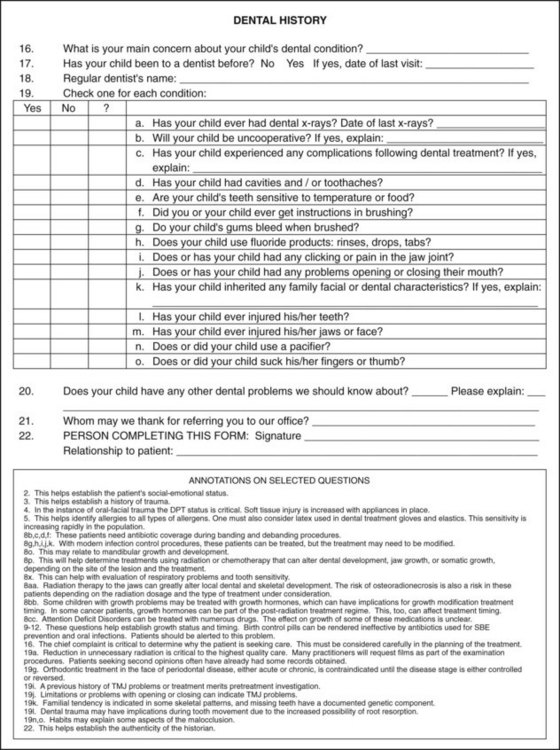
FIGURE 6-2 Form for obtaining medical/dental history for young orthodontic patients. A separate but similar form is needed for adult patients. Annotated comments explaining why some of the questions are asked are placed immediately below the dental history form and are keyed by number to the question to which they refer. Note especially 8dd in the medical history and annotations: bisphosphonate use in children can lead to important orthodontic complications.
Two areas deserve a special comment. First, although most children with a condylar fracture of the mandible recover uneventfully, remember that a growth deficit related to an old injury is the most probable cause of true facial asymmetry (Figure 6-3). It has become apparent in recent years that early fractures of the condyle occur more frequently than was previously thought (see Chapter 5). A mandibular fracture in a child can easily be overlooked in the aftermath of an accident that caused other trauma, so a jaw injury may not have been diagnosed at the time. Although old jaw fractures have particular significance, trauma to the teeth may also affect the development of the occlusion and should not be overlooked.
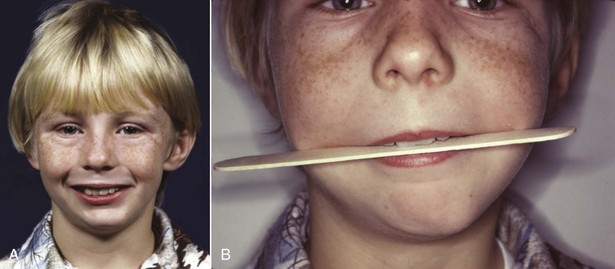
FIGURE 6-3 A, Facial asymmetry developed in this boy after fracture of the left mandibular condylar process at age 5 because scarring in the fracture area prevented normal translation of the mandible on that side during growth (see Chapter 2). B, Note the cant to the occlusal plane and the resulting roll deformity (illustrated in more detail in Figure 6-68). This develops as failure of the mandible to grow vertically on the affected side restricts eruption of both maxillary and mandibular teeth. Trauma is the most frequent cause of asymmetry of this type.
Second, it is important to note whether the patient is on long-term medication of any type and, if so, for what purpose. This may reveal systemic disease or metabolic problems that the patient did not report in any other way. Chronic medical problems in adults or children do not contraindicate orthodontic treatment if the medical problem is under control, but special precautions may be necessary if orthodontic treatment is to be carried out. For example, orthodontic treatment would be possible in a patient with controlled diabetes but would require especially careful monitoring, since the periodontal breakdown that could accompany loss of control might be accentuated by orthodontic forces (see Chapter 7). In adults being treated for arthritis or osteoporosis and now increasingly also in children with chronic disease treated with drugs (like glucocorticoids) that can be osteotoxic, high doses of resorption-inhibiting agents, such as bisphosphonates, often are used. This impedes orthodontic tooth movement and may increase the chance of complications (see Chapter 9). It may be necessary to ask specifically about these medications because parents sometimes do not mention things they think are not related to orthodontic treatment.
Physical Growth Evaluation
A third major area that should be explored by questions to the patient or parents is the individual’s physical growth status. This is important for a number of reasons, not the least of which is the gradient of facial growth discussed in Chapters 2 to 4. Rapid growth during the adolescent growth spurt facilitates tooth movement, but any attempt at growth modification will surely fail in a child who is beyond the peak of the adolescent growth spurt.
For normal youths who are approaching puberty, several questions usually provide the necessary information about where the child is on the growth curve: How rapidly has the child grown recently? Have clothes sizes changed recently? Are there signs of sexual maturation? When did sexual maturation occur in older siblings? Valuable information can also be obtained from observing the stage of secondary sexual characteristics (see later).
If a child is being followed for referral to an orthodontist at the optimum time or by an orthodontist for observation of growth before beginning treatment, height and weight changes can provide important insight into growth status (see Figure 2-4 for current charts). In many instances, height–weight records and the child’s progress on growth charts can be obtained from the pediatrician.
Occasionally, a more precise assessment of whether a child has reached the adolescent growth spurt is needed, and calculating bone age from the vertebrae as seen in a cephalometric radiograph can be helpful (see Figure 3-12). The primary indication for this is a child with a skeletal Class II problem who would benefit from orthodontic treatment to modify growth if that were possible. If the analysis of vertebral maturation shows delayed skeletal development, the growth spurt probably still is in the future; if the skeletal age indicates considerable maturity, adolescent growth of the jaws probably has already occurred.
Unfortunately, the stage of vertebral development is less useful in establishing other factors that sometimes are important clinically such as a patient’s position on the growth curve before or after puberty or whether jaw growth has subsided to adult levels in a teenager with mandibular prognathism. Hand–wrist radiographs are an alternative method for evaluating skeletal maturity, but these also are not an accurate way to determine when growth is completed.1 Serial cephalometric radiographs offer the most accurate way to determine whether facial growth has stopped or is continuing.
Social and Behavioral Evaluation
Social and behavioral evaluation should explore several related areas: the patient’s motivation for treatment, what he or she expects as a result of treatment, and how cooperative or uncooperative the patient is likely to be.
Motivation for seeking treatment can be classified as external or internal. External motivation is supplied by pressure from another individual, as with a reluctant child who is being brought for orthodontic treatment by a determined mother, or with an adult who is seeking alignment of incisor teeth because her new significant other wants her teeth to look better. Internal motivation, on the other hand, comes from within the individual and is based on his or her own assessment of the situation and desire for treatment. Even quite young children can encounter difficulties in their interaction with others because of their dental and facial appearance, which sometimes produces a strong internal desire for treatment. Other children with apparently similar malocclusions do not perceive a problem; therefore they are less motivated internally. Older patients usually are aware of psychosocial difficulties or functional problems related to their malocclusion and so are likely to have some component of internal motivation.
Although now some preadolescent children express a desire to have “an appliance” or “braces” because many of their peers are having early treatment, it is rare to find strong internal motivation in that age group. To them, orthodontics usually is something they have to do because a parent requires it. Self-motivation for treatment often does not develop until adolescence. Nevertheless, even in preadolescents, it is important for a patient to have a component of internal motivation. Cooperation is likely to be much better if the patient genuinely wants treatment for himself or herself, rather than just putting up with it to please a parent. Children or adults who feel that the treatment is being done for them will be much more receptive patients than those who view the treatment as something being done to them.
What the patient expects from treatment is very much related to the type of motivation and should be explored carefully with adults, especially those with primarily cosmetic problems. It is one thing to undertake to correct spacing between the maxillary incisors to improve a patient’s appearance and dental function and something else to do this so the patient expects that he or she will now experience greater social or job success. If the social problems continue after treatment, as is quite likely, the orthodontic treatment may become a focus for resentment.
Cooperation is more likely to be a problem with a child than an adult. Two factors are important in determining this: (1) the extent to which the child sees the treatment as a benefit, as opposed to something else he or she is required to undergo; and (2) the degree of parental control. A resentful and rebellious adolescent, particularly one with ineffective parents, is especially likely to become a problem in treatment. It is important to take the time to understand what the patient perceives his or her problems to be and, if necessary, to help the patient appreciate the reality of the situation (see the final section of Chapter 2).
Any patient who is under the legal age (which varies among states and countries but most often is 18) cannot legally consent to treatment. The bioethical standard is that he or she should at least assent to treatment. With child or adolescent patients of any age, ask “If your parents and I think that you would benefit from orthodontic treatment, are you willing to do that?” Treating an unwilling child, even if the parents force an apparent assent, rarely is good professional judgment.
The important points to be evaluated at the interview of a prospective orthodontic patient are summarized in Figure 6-4.

Clinical Evaluation
There are two goals of the orthodontic clinical examination: (1) to evaluate and document oral health, jaw function, facial proportions, and smile characteristics and (2) to decide which diagnostic records are required.
Oral Health
The health of oral hard and soft tissues must be assessed for potential orthodontic patients as for any other. The general guideline is that before orthodontic treatment begins, any disease or pathology must be under control. This includes medical problems, dental caries or pulpal pathology, and periodontal disease.
It sounds trivial to say that the dentist should not overlook the number of teeth that are present or forming, and yet almost every dentist, concentrating on details rather than the big picture, has done just that on some occasion. It is particularly easy to fail to notice a missing or supernumerary lower incisor. At some point in the evaluation, count the teeth to be sure they are all there.
In the periodontal evaluation, there are two major points of interest: indications of active periodontal disease and potential or actual mucogingival problems. Any orthodontic examination should include gentle probing through the gingival sulci, not to establish precise pocket depths but to detect any areas of bleeding. Bleeding on probing indicates inflammation that may extend into the periodontal ligament, and this must be brought under control before orthodontic treatment is undertaken. Fortunately, aggressive juvenile periodontitis (Figure 6-5) occurs rarely, but, if it is present, it is critically important to note this before orthodontic treatment begins. Inadequate attached gingiva around crowded incisors may lead to stripping of the gingiva away from the teeth when the teeth are aligned, especially if the dental arch is expanded (Figure 6-6). The interaction between periodontic and orthodontic treatment for both children and adults is discussed further in Chapter 7.
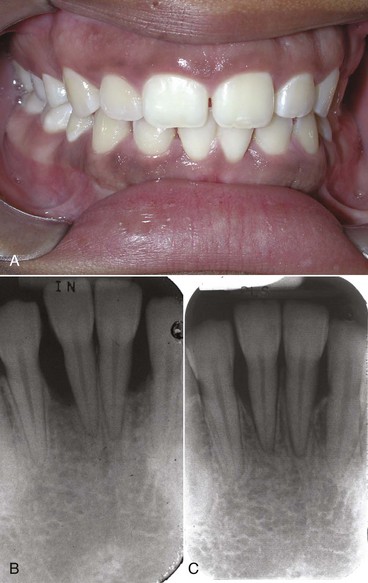
FIGURE 6-5 Aggressive periodontitis in children and adolescents usually starts with an intensive attack on the supporting tissues around central incisors and/or first molars. A, Intraoral appearance of a patient who sought orthodontic consultation because of congenitally missing second premolars. B, Periapical radiograph of the lower central incisor area. C, Follow-up periapical radiograph of the same incisor area, after treatment with antibiotics and curettage, and then comprehensive orthodontics. Unless periodontal probing during the orthodontist’s clinical examination detects inflammation and bone loss of this type and a periapical radiograph is ordered, the severe periodontal disease may be overlooked, and if it progresses, loss of the involved teeth is inevitable. If the periodontal problem is brought under control, orthodontic treatment is feasible.

FIGURE 6-6 In this patient with minimal attached gingiva in the lower incisor region, who has enough crowding that the lower incisors will have to be advanced at least somewhat to align them, further recession of the gingiva is almost certain to occur during orthodontic treatment unless a gingival graft is placed. It is much easier to prevent stripping of tissue away from the teeth than to correct it later.
Jaw and Occlusal Function
In the evaluation of function, it is important to note in the beginning whether the patient has normal coordination and movements. If not, as in an individual with cerebral palsy or other types of severe neuromuscular disease, normal adaptation to the changes in tooth position produced by orthodontics may not occur, and the equilibrium effects discussed in Chapter 5 may lead to posttreatment relapse. Four aspects of oral function require evaluation: mastication (including but not limited to swallowing), speech, the possibility of sleep apnea related to mandibular deficiency, and the presence or absence of temporomandibular (TM) joint problems.
Patients with severe malocclusion often have difficulty in normal mastication, not so much in being able to chew their food (though this may take extra effort) but in being able to do so in a socially acceptable manner. These individuals often have learned to avoid certain foods that are hard to incise and chew and may have problems with cheek and lip biting during mastication. If asked, patients report such problems and usually indicate that after orthodontic treatment they can chew better. Unfortunately, there are almost no reasonable diagnostic tests to evaluate masticatory efficiency, so it is difficult to quantify the degree of masticatory handicap and difficult to document functional improvement. Swallowing is almost never affected by malocclusion. It has been suggested that lip and tongue weakness may indicate problems in normal swallowing, but there is no evidence to support this contention (see Chapter 5). Oral gymnastic tests (such as measuring lip strength or how hard the patient can push with the tongue) therefore add little or nothing to the diagnostic evaluation.
Speech problems can be related to malocclusion, but normal speech is possible in the presence of severe anatomic distortions. Speech difficulties in a child therefore are unlikely to be solved by orthodontic treatment. Specific relationships are outlined in Table 6-1. If a child has a speech problem and the type of malocclusion related to it, a combination of speech therapy and orthodontics may help. If the speech problem is not listed as related to malocclusion, orthodontic treatment may be valuable in its own right but is unlikely to have any impact on speech.
TABLE 6-1
Speech Difficulties Related to Malocclusion
| Speech sound | Problem | Related malocclusion |
| /s/, /z/ (sibilants) | Lisp | Anterior open bite, large gap between incisors |
| /t/, /d/ (lingua-alveolar stops) | Difficulty in production | Irregular incisors, especially lingual position of maxillary incisors |
| /f/, /v/ (labiodental fricatives) | Distortion | Skeletal Class III |
| th, sh, ch (linguodental fricatives [voiced or voiceless]) | Distortion | Anterior open bite |
Sleep apnea may be related to mandibular deficiency, and occasionally this functional problem is the reason for seeking orthodontic consultation. Both the diagnosis and management of sleep disorders requires an interdisciplinary team and should not be attempted without assessment, documentation, and referral from a qualified physician. Recent research suggests that oral appliances to advance the mandible can be effective, but only in patients with mild forms of sleep apnea, which must be established by polysomnography in a sleep laboratory before treatment in the orthodontic office begins2 (see further discussion in Chapter 7).
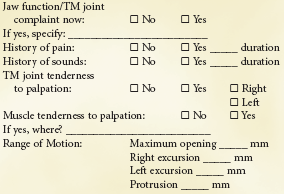
Jaw function is more than TM joint function, but evaluation of the TM joints is an important aspect of the diagnostic workup. A form for recording routine clinical examination of TM joint function is shown in Box 6-1. As a general guideline, if the mandible moves normally, its function is not severely impaired, and by the same token, restricted movement usually indicates a functional problem.3 For that reason, the most important single indicator of joint function is the amount of maximum opening. Palpating the muscles of mastication and TM joints should be a routine part of any dental examination, and it is important to note any signs of TM joint problems such as joint pain, noise, or limitation of opening.
Because the articular eminence is not well developed in children, it can be quite difficult to find the sort of positive “centric relation” position that can be determined in adults. Nevertheless, it is important to note whether the mandible shifts laterally or anteriorly when a child closes. A child with an apparent unilateral crossbite often has a bilateral narrowing of the maxillary arch, with a shift to the unilateral crossbite position. This is the most common cause of apparent but not true facial asymmetry. It is vitally important to verify this during the clinical examination or to rule out a shift and confirm a true unilateral crossbite. Similarly, many children and adults with a skeletal Class II relationship and an underlying skeletal Class II jaw relationship will position the mandible forward in a “Sunday bite,” making the occlusion look better than it really is. Sometimes an apparent Class III relationship results from a forward shift to escape incisor interferences in what is really an end-to-end relationship (Figure 6-7). These patients are said to have pseudo–Class III malocclusion.
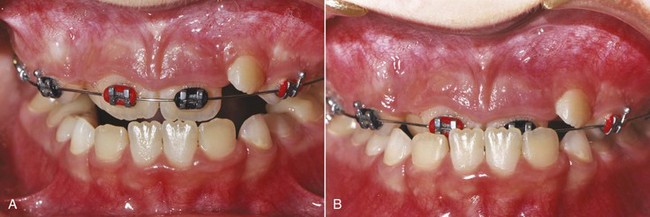
FIGURE 6-7 In a child with lingually erupting maxillary central incisors, incisor interferences (A) may lead to a forward shift to bring posterior teeth into occlusion (B). As in this patient, advancing the maxillary incisors may be needed to eliminate the shift.
Other occlusal interferences with functional mandibular movements, though of interest, are less important than they would be if treatment to alter the occlusion were not being contemplated. Balancing interferences, presence or absence of canine protection in lateral excursions, and other such factors take on greater significance if they are still present when the occlusal changes produced by orthodontic treatment are nearing completion.
Facial and Dental Appearance
A systematic examination of facial and dental appearance should be done in the following three steps:
1. Facial proportions in all three planes of space (macro-esthetics). Examples of problems that would be noted in that first step would be asymmetry, excessive or deficient face height, mandibular or maxillary deficiency or excess, and so on. In doing this, keep in mind that both the evolutionary and prenatal development of the face can provide additional insight into the origin and significance of unusual facial morphology.
2. The dentition in relation to the face (mini-esthetics). This includes the display of the teeth at rest, during speech, and on smiling. It includes such assessments as excessive gingival display, inadequate anterior tooth display, inappropriate gingival heights, and excessive or deficient buccal corridors.
3. The teeth in relation to each other (micro-esthetics). This includes assessment of tooth proportions in height and width, gingival shape and contour, connectors and embrasures, black triangular holes, and tooth shade.
Facial Proportions: Macro-Esthetics
The first step in evaluating facial proportions is to take a good look at the patient, examining him or her for developmental characteristics and a general impression. Humans are very adept at evaluating faces and in fact have a dedicated neural system for that purpose.4 Even so, with faces as with everything else, looking too quickly at the details carries the risk of missing the big picture. It is a mistake for any dentist to focus just on the teeth after a cursory look at the face. It is a disastrous mistake for an orthodontist not to evaluate the face carefully.
Assessment of Developmental Age: In a step particularly important for children around the age of puberty when most orthodontic treatment is carried out, the patient’s developmental age should be assessed. Everyone becomes a more or less accurate judge of other people’s ages—we expect to come within a year or two simply by observing the other person’s facial appearance. Occasionally, we are fooled, as when we say that a 12-year-old girl looks 15 or that a 15-year-old boy looks 12. With adolescents, the judgment is of physical maturity.
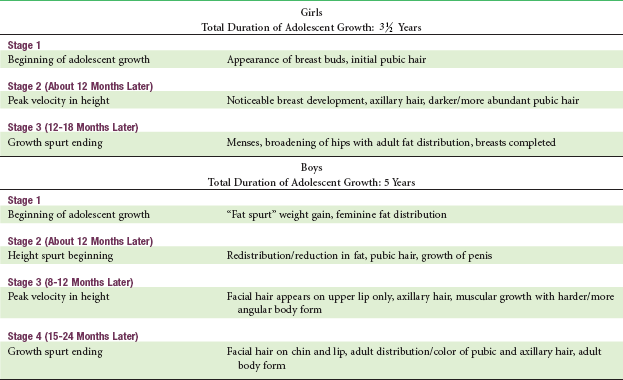
The attainment of recognizable secondary sexual characteristics for girls and boys and the correlation between stages of sexual maturation and facial growth are discussed in Chapter 4 and are summarized in Table 6-2. The degree of physical development is much more important than chronologic age in determining how much growth remains.
Facial Esthetics Versus Facial Proportions: Because a major reason for orthodontic treatment is to overcome psychosocial difficulties related to facial and dental appearance and enhance social well-being and QOL in doing so, evaluating dental and facial esthetics is an important part of the clinical examination. Whether a face is considered beautiful is greatly affected by cultural and ethnic factors, but whatever the culture, a severely disproportionate face becomes a psychosocial problem. For that reason, it helps to recast the purpose of this part of the clinical evaluation as an evaluation of facial proportions not esthetics per se. Distorted and asymmetric facial features are a major contributor to facial esthetic problems, whereas proportionate features are generally acceptable even if not beautiful. An appropriate goal for the facial examination therefore is to detect disproportions.
Frontal Examination: The first step in analyzing facial proportions is to examine the face in frontal view. Low-set ears or eyes that are unusually far apart (hypertelorism) may indicate either the presence of a syndrome or a microform of a craniofacial anomaly. If a syndrome is suspected, the patient’s hands should be examined for syndactyly, since there are a number of dental-digital syndromes.
In the frontal view, one looks for bilateral symmetry in the fifths of the face and for proportionality of the widths of the eyes/nose/mouth (Figure 6-8). A small degree of bilateral facial asymmetry exists in essentially all normal individuals. This can be appreciated most readily by comparing the real full-face photograph with composites consisting of two right or two left sides (Figure 6-9). This “normal asymmetry,” which usually results from a small size difference between the two sides, should be distinguished from a chin or nose that deviates to one side, which can produce severe disproportion and esthetic problems (see Figure 6-3).
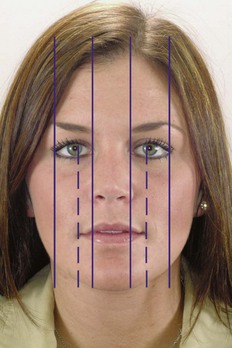
FIGURE 6-8 Facial proportions and symmetry in the frontal plane. An ideally proportional face can be divided into central, medial, and lateral equal fifths. The separation of the eyes and the width of the eyes, which should be equal, determine the central and medial fifths. The nose and chin should be centered within the central fifth, with the width of the nose the same as or slightly wider than the central fifth. The interpupillary distance (dotted line) should equal the width of the mouth.
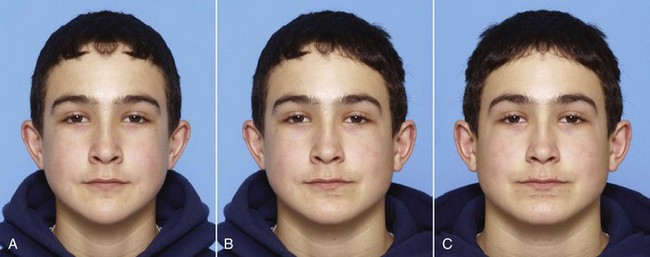
FIGURE 6-9 Composite photographs are the best way to illustrate normal facial asymmetry. For this boy, whose mild asymmetry rarely would be noticed and is not a problem, the true photograph is in the center (B). On the patient’s right (A) is a composite of the two right sides, while on the left (C) is a composite of the two left sides. This technique dramatically illustrates the difference in the two sides of a normal face, in which mild asymmetry is the rule rather than the exception. Usually, the right side of the face is a little larger than the left, rather than the reverse as in this individual.
Prior to the advent of cephalometric radiography, dentists and orthodontists often used anthropometric measurements (i.e., measurements made directly during the clinical examination) to help establish facial proportions (Figure 6-10). Although this was largely replaced by cephalometric analysis for many years, the recent emphasis on soft tissue proportions has brought soft tissue evaluation back into prominence. Farkas’ modern studies of Canadians of northern European origin provided the data for Tables 6-3 and 6-4.5
TABLE 6-3
Facial Anthropometric Measurements (Young Adults)
| Parameter | Male | Female |
| 1. Zygomatic width (zy-zy) (mm) | 137 (4.3) | 130 (5.3) |
| 2. Gonial width (go-go) | 97 (5.8) | 91 (5.9) |
| 3. Intercanthal distance | 33 (2.7) | 32 (2.4) |
| 4. Pupil-midfacial distance | 33 (2.0) | 31 (1.8) |
| 5. Nasal base width | 35 (2.6) | 31 (1.9) |
| 6. Mouth width | 53 (3.3) | 50 (3.2) |
| 7. Face height (N-gn) | 121 (6.8) | 112 (5.2) |
| 8. Lower face height (subnasale-gn) | 72 (6.0) | 66 (4.5) |
| 9. Upper lip vermilion | 8.9 (1.5) | 8.4 (1.3) |
| 10. Lower lip vermilion | 10.4 (1.9) | 9.7 (1.6) |
| 11. Nasolabial angle (degrees) | 99 (8.0) | 99 (8.7) |
| 12. Nasofrontal angle (degrees) | 131 (8.1) | 134 (1.8) |
Measurements are illustrated in Figure 6-10.
Standard deviation is in parentheses.
Data from Farkas LG. Anthropometry of the Head and Face in Medicine. New York: Elsevier Science; 1991.
TABLE 6-4
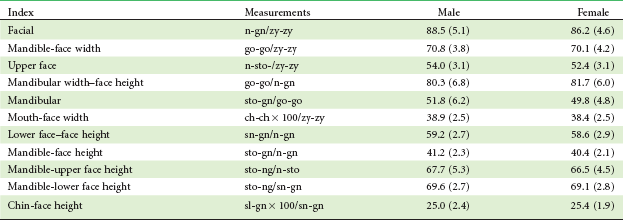
Standard deviation is in parentheses.
From Farkas LG, Munro JR. Anthropometric Facial Proportions in Medicine. Springfield, Ill.: Charles C Thomas; 1987.
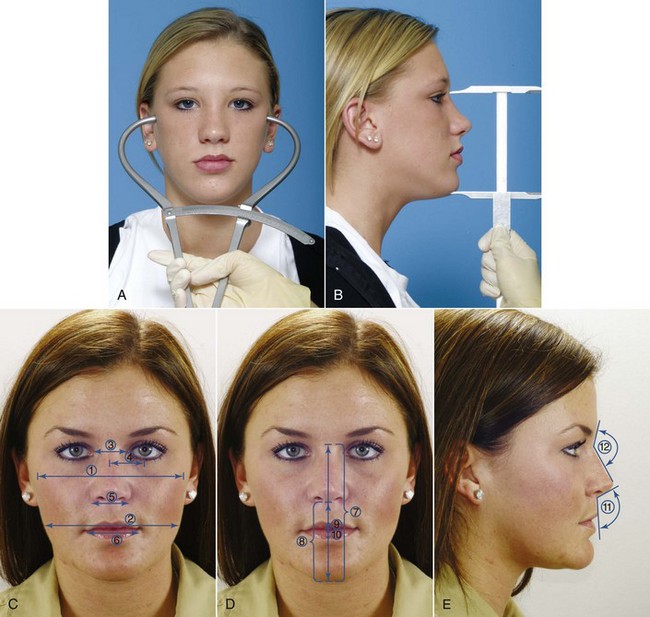
FIGURE 6-10 Facial measurements for anthropometric analysis are made with either bow calipers (A) or straight calipers (B). C to E, Frequently used facial anthropometric measurements (numbers are keyed to Table 6-3).
Note that some of the measurements in Table 6-3 could be made on a cephalometric radiograph, but many could not. When there are questions about facial proportions, it is much better to make the measurements clinically because soft-tissue proportions as seen clinically determine facial appearance. During the clinical examination, one can record measurements and literally digitize the face rather than later digitizing a cephalometric radiograph.
The proportional relationship of facial height to width (the facial index) establishes the overall facial type and the basic proportions of the face. It is important to remember that face height cannot be evaluated unless face width is known, and face width is not taken into account when a lateral cephalometric radiograph is analyzed.
The normal values for the facial index and other proportions that may be clinically useful are shown in Table 6-4. Differences in facial types and body types obviously must be taken into account when facial proportions are assessed, and variations from the average ratios can be compatible with good facial esthetics. An important point, however, is to avoid treatment that would change the ratios in the wrong direction, for example, treatment with interarch elastics that could rotate the mandible downward in a patient whose face already is too long for its width.
Finally, the face in frontal view should be examined from the perspective of the vertical facial thirds. The artists of the Renaissance period, primarily da Vinci and Durer, established the proportions for drawing anatomically correct human faces (Figure 6-11). They concluded that the distance from the hairline to the base of the nose, base of nose to bottom of nose, and bottom of nose to chin should be the same. Farkas’ studies show that in modern Caucasians of European descent, the lower third is very slightly longer. The artists also saw that the lower third has a proportion of one-third above the mouth to two-thirds below, and the Farkas data show that this is still true.
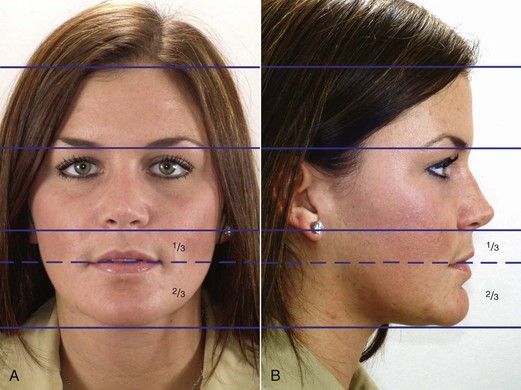
FIGURE 6-11 Vertical facial proportions in the frontal and lateral views are best evaluated in the context of the facial thirds, which the Renaissance artists noted were equal in height in well-proportioned faces. In modern Caucasians, the lower facial third often is slightly longer than the central third. The lower third has thirds: the mouth should be one-third of the way between the base of the nose and the chin.
It is important to note the cause of vertical problems such as excessive display of the maxillary gingiva, which is done best by examining the position of lips and teeth relative to the vertical thirds of the face (Figure 6-12). It also is important to keep in mind that different ethnic and national groups view facial esthetics somewhat differently (there are differences even in countries as closely matched as the United States and Canada) and that both gender and overall facial attractiveness influence how people are perceived. As the examining doctor, you need to notice and evaluate disproportions, even though you know that as treatment is planned, aspects of facial appearance that would be a problem for some individuals are not a problem for others with a different ethnic background.
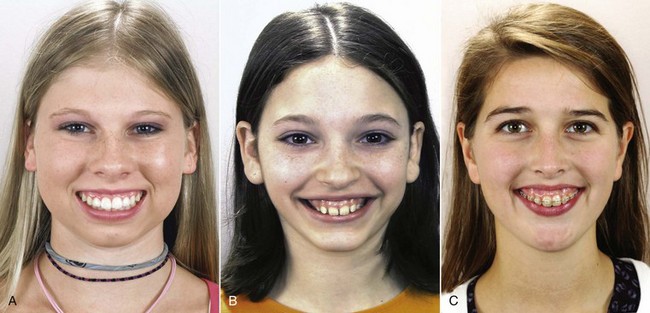
FIGURE 6-12 The usual cause of excessive display of maxillary gingiva is a long face due to excessive downward growth of the maxilla (A), which moves the maxilla down below the upper lip and results in a disproportionately long lower third of the face. This should not be confused with display of gingiva in childhood because the gingival recession that accompanies eruption is incomplete (B), or with gingival display due to a combination of incomplete eruption and a short upper lip (C). Note that for the patients in A and C, the lower third of the face is long, while for B, the lower third is about the same length as the middle third.
Dentofacial characteristics that should be noted as part of the facial examination are shown in Box 6-2. This checklist is just that: a list of things that should be noted systematically during the clinical examination. As in many other things, if you do not look for it, you will not see it. Precise measurements are not necessary, but deviations from the normal should be taken into account when the problem list is developed. Current computer programs already make it possible for an assistant to quickly enter positive findings as the doctor reviews them and have them “flow through” to the preliminary problem list.
Profile Analysis: A careful examination of the facial profile yields the same information, though in less detail for the underlying skeletal relationships, as that obtained from analysis of lateral cephalometric radiographs. For diagnostic purposes, particularly to identify patients with severe disproportions, careful clinical evaluation is adequate. For this reason, the technique of facial profile analysis has sometimes been called the “poor man’s cephalometric analysis.” This is a vital diagnostic technique for all dentists. It must be mastered by all those who will see patients for primary care in dentistry, not just by orthodontists.
The three goals of facial profile analysis are approached in three clear and distinct steps. These goals are as follows:
1. Establishing whether the jaws are proportionately positioned in the anteroposterior plane of space. This step requires placing the patient in the physiologic natural head position, which is the head position the individual adopts in the absence of other cues. This can be done with the patient either sitting upright or standing but not reclining in a dental chair and looking at the horizon or a distant object. With the head in this position, note the relationship between two lines, one dropped from the bridge of the nose to the base of the upper lip, and a second one extending from that point downward to the chin (Figure 6-13). These line segments ideally should form a nearly straight line, with only a slight inclination in either direction. A large angle between them (>10 degrees or so) indicates either profile convexity (upper jaw prominent relative to chin) or profile concavity (upper jaw behind chin). A convex profile therefore indicates a skeletal Class II jaw relationship, whereas a concave profile indicates a skeletal Class III jaw relationship.
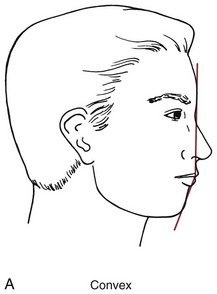
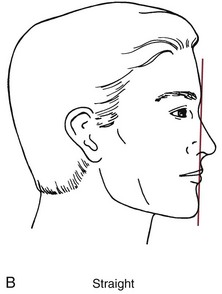
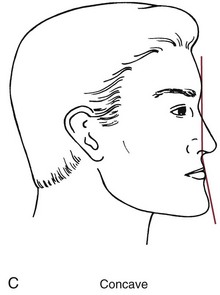
FIGURE 6-13 Profile convexity or concavity results from a disproportion in the size of the jaws but does not by itself indicate which jaw is at fault. A convex facial profile (A) indicates a Class II jaw relationship, which can result from either a maxilla that projects too far forward or a mandible too far back. A concave profile (C) indicates a Class III relationship, which can result from either a maxilla that is too far back or a mandible that protrudes forward.
2. Evaluation of lip posture and incisor prominence. Detecting excessive incisor protrusion (which is relatively common) or retrusion (which is rare) is important because of the effect on space within the dental arches. If the incisors protrude, they align themselves on the arc of a larger circle as they lean forward, whereas if the incisors are upright or retrusive, less space is available (Figure 6-14). In the extreme case, incisor protrusion can produce ideal alignment of the teeth instead of severely crowded incisors, at the expense of lips that protrude and are difficult to bring into function over the protruding teeth. This is bimaxillary dentoalveolar protrusion, meaning simply that in both jaws the teeth protrude (Figure 6-15). Dentists often refer to the condition as just bimaxillary protrusion, a simpler term but a misnomer since it is not the jaws but the teeth that protrude. Physical anthropologists use bimaxillary protrusion to describe faces in which both jaws are prominent relative to the cranium, and the different terminology must be kept in mind when faces are described in the anthropology literature.
FIGURE 6-14 If the incisors flare forward, they can align themselves along the arc of a larger circle, which provides more space to accommodate the teeth and alleviates crowding. Conversely, if the incisors move lingually, there is less space and crowding becomes worse. For this reason, crowding and protrusion of incisors must be considered two aspects of the same thing: how crowded and irregular the incisors are reflects both how much room is available and where the incisors are positioned relative to supporting bone.
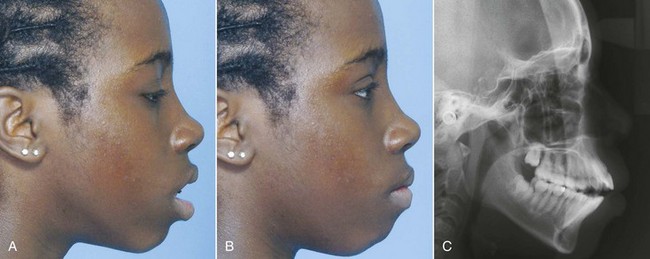
FIGURE 6-15 Bimaxillary dentoalveolar protrusion is seen in the facial appearance in three ways. A, Excessive separation of the lips at rest (lip incompetence). The general guideline (which holds for all racial groups) is that lip separation at rest should be not more than 4 mm. B, Excessive effort to bring the lips into closure (lip strain) and prominence of lips in the profile view (as in both A and B). Remember that all three soft tissue characteristics must be present to make the diagnosis of dental protrusion, not just protruding teeth as seen in a ceph of the same girl (C). Different racial groups and individuals within those groups have different degrees of lip prominence that are independent of tooth position. As a result, excessive dental protrusion must be a clinical diagnosis. It cannot be made accurately from cephalometric radiographs.
Determining how much incisor prominence is too much can be difficult, especially when changes over time in public preference for both lip and chin prominence are taken into account6 and ethnic differences are considered. This is simplified by understanding the relationship between lip posture and the position of the incisors. The teeth protrude excessively if (and only if) two conditions are met: (1) the lips are prominent and everted and (2) the lips are separated at rest by more than 3 to 4 mm (which is sometimes termed lip incompetence). In other words, excessive protrusion of the incisors is revealed by prominent lips that are separated when they are relaxed, so that the patient must strain to bring the lips together over the protruding teeth (see Figure 6-15). For such a patient, retracting the teeth tends to improve both lip function and facial esthetics. On the other hand, if the lips are prominent but close over the teeth without strain, the lip posture is largely independent of tooth position. For that individual, retracting the incisor teeth would have little effect on lip function or prominence.
Lip prominence is strongly influenced by racial and ethnic characteristics and to a considerable extent also is age-dependent (see Chapter 2). Whites of northern European backgrounds often have relatively thin lips, with minimal lip and incisor prominence. Whites of southern European and middle eastern origin normally have more lip and incisor prominence than their northern cousins. Greater degrees of lip and incisor prominence normally occur in individuals of Asian and African descent, so a lip and tooth position normal for Asians or blacks would be excessively protrusive for most whites.
Lip posture and incisor prominence should be evaluated by viewing the profile with the patient’s lips relaxed. This is done by relating the upper lip to a true vertical line passing through the concavity at the base of the upper lip (soft tissue point A) and by relating the lower lip to a similar true vertical line through the concavity between the lower lip and chin (soft tissue point B; Figure 6-16). If the lip is significantly forward from this line, it can be judged to be prominent; if the lip falls behind the line, it is retrusive. If the lips are both prominent and incompetent (separated by more than 3 to 4 mm), the guideline is that the anterior teeth are excessively protrusive. Is that a problem? It depends on both the patient’s perception and the cultural setting, not just on the objective evaluation.
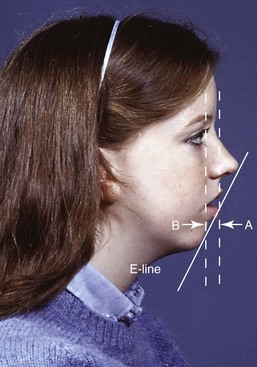
FIGURE 6-16 Lip prominence is evaluated by observing the distance that each lip projects forward from a true vertical line through the depth of the concavity at its base (soft tissue points A and B) (i.e., a different reference line is used for each lip, as shown here). Lip prominence of more than 2 to 3 mm in the presence of lip incompetence (excessive separation of the lips at rest, as in this girl) indicates dentoalveolar protrusion. Because observers perceive lip prominence in the context of the relationship of the lips to the nose and chin, it can be helpful to draw the E-line (esthetic line) from the nose to the chin, and look at how the lips relate to this line. The guideline is that they should be on or slightly in front of the E-line, which does not change the general rule that lip separation at rest and lip strain on closure are the major indicators of excessive lip support by the dentition.
In evaluating lip protrusion, it is important to keep in mind that everything is relative, and in this case the lip relationships with the nose and chin affect the perception of lip fullness. The larger the nose, the more prominent the chin must be to balance it, and the greater the amount of lip prominence that will be esthetically acceptable. It can be helpful to look at lip prominence relative to a line from the tip of the nose to the chin (the E-line of cephalometric analysis, which can be visualized easily on clinical examination; Figure 6-17). Vertical facial and dental relationships also play a role here. Some patients with short lower face height have everted and protrusive lips because they are overclosed and the upper lip presses against the lower lip, not because the teeth protrude.
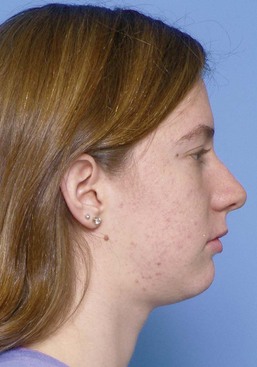
FIGURE 6-17 For this girl with Class II malocclusion, retraction of the maxillary incisors would damage facial appearance by decreasing support for the upper lip, making the relatively large nose look even bigger. The size of the nose and chin must be considered when the position of the incisors and amount of lip support are evaluated.
Not only the prominence of the chin but also the submental soft tissue contours should be evaluated. Throat form is an important factor in establishing optimal facial esthetics, and poor throat form is a major contributor to esthetic impairment in patients with mandibular deficiency (Figure 6-18).
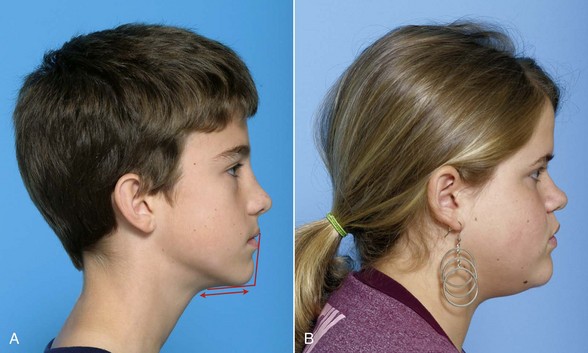
FIGURE 6-18 Throat form is evaluated in terms of the contour of the submental tissues (straight is better), chin-throat angle (closer to 90 degrees is better), and throat length (longer is better, up to a point). Both submental fat deposition and a low tongue posture contribute to a stepped throat contour, which becomes a “double chin” when extreme. A, For this boy who has a mild mandibular deficiency, throat contour and the chin-throat angle are good, but throat length is short (as usually is the case when the mandible is short). B, For this girl with more chin projection, throat contour is affected by submental fat and the chin-throat angle is somewhat obtuse, but throat length is good.
3. Reevaluation of vertical facial proportions and evaluation of mandibular plane angle. Vertical proportions can be observed during the full-face examination (see previous section) but sometimes can be seen more clearly in profile. In the clinical examination, the inclination of the mandibular plane to the true horizontal should be noted. The mandibular plane is visualized readily by placing a finger or mirror handle along the lower border (Figure 6-19). A steep mandibular plane angle usually accompanies long anterior facial vertical dimensions and a skeletal open bite tendency, while a flat mandibular plane angle often correlates with short anterior facial height and deep bite malocclusion.
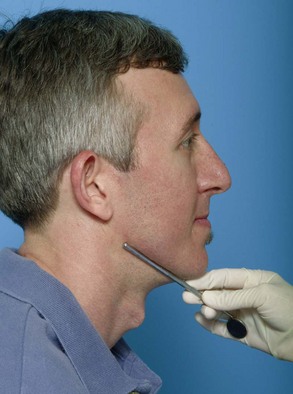
FIGURE 6-19 The mandibular plane angle can be visualized clinically by placing a mirror handle or other instrument along the border of the mandible. For this patient, the mandibular plane angle is normal, neither too steep nor too flat.
Facial form analysis carried out this way takes only a couple of minutes but provides information that simply is not present from dental radiographs and casts. Such an evaluation by the primary care practitioner is an essential part of the evaluation of every prospective orthodontic patient.
Tooth–Lip Relationships: Mini-Esthetics
Tooth–Lip Relationships: Evaluation of tooth–lip relationships begins with an examination of symmetry, in which it is particularly important to note the relationship of the dental midline of each arch to the skeletal midline of that jaw (i.e., the lower incisor midline relative to the midline of the mandible, and the upper incisor midline relative to the midline of the maxilla). Dental casts, even if mounted on an articulator, will show the relationship of the midlines to each other but provide no information about the dental-skeletal midlines. This must be recorded during the clinical examination.
A second aspect of dental to soft tissue relationships is the vertical relationship of the teeth to the lips at rest and on smile. During the clinical examination, it is important to note the amount of incisor display. For patients with excessive incisor display, the usual cause is a long lower third of the face, but that is not the only possibility—a short upper lip could produce the same thing (see Figure 6-12). Recording lip height at the philtrum and the commissures can clarify the source of the problem.
A third important relationship to note is whether an up-down transverse rotation of the dentition is revealed when the patient smiles or the lips are separated at rest (Figure 6-20). This often is called a transverse cant of the occlusal plane but is better described as a transverse roll of the esthetic line of the dentition (see the section in this chapter on classification by dentofacial traits). Neither dental casts nor a photograph with lip retractors will reveal this. Dentists detect a transverse roll at 1 mm from side to side, whereas laypersons are more forgiving and see it at 2 to 3 mm—but at that point, it is a problem.7
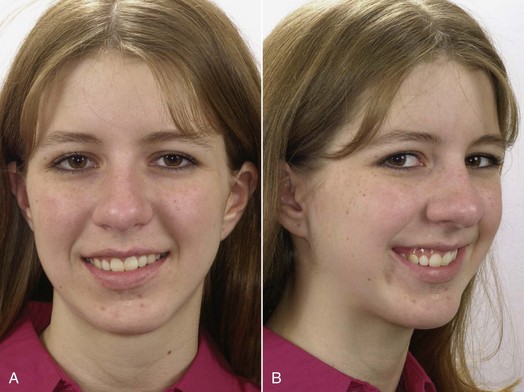
FIGURE 6-20 A cant to the occlusal plane can be seen in both frontal (A) and oblique (B) views. This is a “roll deformity” that results from the orientation of the jaws and teeth rather than their position (discussed further in the classification section of this chapter). It becomes an esthetic problem if it is noticeable, and lay observers do notice a cant of this degree of severity.
Smile Analysis: Facial attractiveness is defined more by the smile than by soft tissue relationships at rest. For this reason, it is important to analyze the characteristics of the smile and to think about how the dentition relates to the facial soft tissues dynamically, as well as statically. There are two types of smiles: the posed or social smile and the enjoyment smile (also called the Duchenne smile in the research literature). The social smile is reasonably reproducible and is the one that is presented to the world routinely. The enjoyment smile varies with the emotion being displayed (for instance, the smile when you are introduced to a new colleague differs from the smile when your team just won the year’s most important game). The social smile is the focus of orthodontic diagnosis.
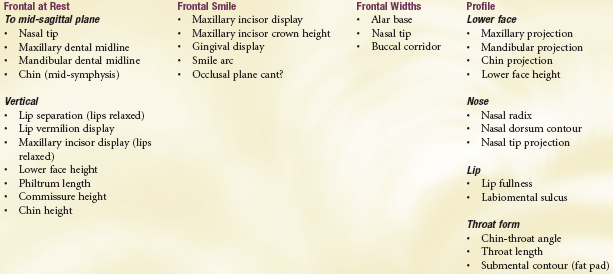
In smile analysis, the oblique view and the frontal and profile views are important. The following variables need to be considered along with the viewing perspective (Box 6-3).
Box 6-3 Smile Variables
Data from Ker AJ, Chan R, Fields HW, et al. Esthetic and smile characteristics from the layperson’s perspective: a computer-based survey study. J Am Dent Assoc 139:1318-1327, 2008; and Springer NC, Chang C, Fields HW, et al. Smile esthetics from the patients’ perspective. Am J Orthod Dentofac Orthop 140:e171-e180, 2011.
Amount of Incisor and Gingival Display: Using computer-altered photographs, recent research has established a range of acceptability for incisor and gingival display (Figure 6-21).8 Although some display of gingiva is acceptable and can be both esthetic and youthful appearing, the ideal elevation of the lip on smile for adolescents is slightly below the gingival margin, so that most of the upper incisor can be seen. More importantly, up to 4 mm display of gingiva in addition to the crown of the tooth, or up to 4 mm lip coverage of the incisor crown, is acceptable. Beyond that, the smile appearance is less attractive.
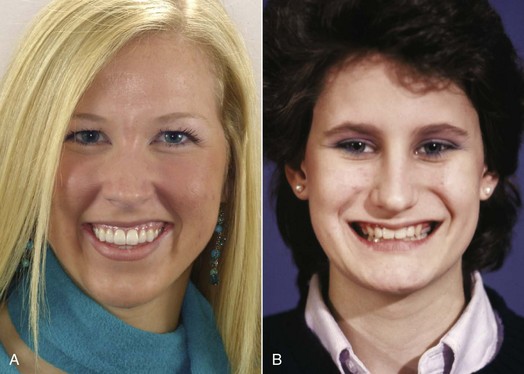
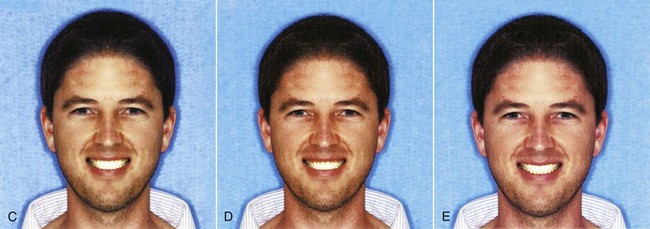
FIGURE 6-21 A, Display of all the maxillary incisors and some gingiva on smiling is a youthful and appealing characteristic. B, Less display is less attractive, although it is not considered objectionable by lay observers. C to E, There is a considerable range of maxillary incisor display that observers consider acceptable, shown in these images created with computer alteration. Maximum acceptable display is shown in C, midrange (ideal) in D, and minimum acceptable display in E.
It also is important to remember that the vertical relationship of the lip to the incisors will change over time, with the amount of incisor exposure decreasing (see Chapter 4).9 This makes it even more important to note the vertical tooth–lip relationships during the diagnostic evaluation and to keep it in mind during treatment.
Transverse Dimensions of the Smile Relative to the Upper Arch: Depending on the facial index (i.e., the width of the face relative to its height), a broad smile may be more attractive than a narrow one—but what does that mean exactly? A dimension of interest to prosthodontists, and more recently to orthodontists, is the amount of buccal corridor that is displayed on smile, that is, the distance between the maxillary posterior teeth (especially the premolars) and the inside of the cheek (Figure 6-22). Prosthodontists consider excessively wide buccal corridors (sometimes called “negative space”) to be unesthetic, and orthodontists have noted that widening the maxillary arch can improve the appearance of the smile if cheek drape is significantly wider than the dental arch. Although minimal buccal corridors are favored by most observers, especially in females,10 the transverse width of the dental arches can and should be related to the width of the face (Figure 6-23). Too broad an upper arch, so that there is no buccal corridor, is unesthetic. The relationship of the cheeks to the posterior teeth on smile is just another way of evaluating the width of the dental arches.
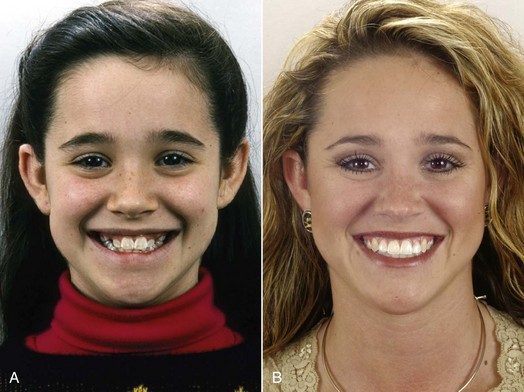
FIGURE 6-22 A, Prior to treatment, this girl had a narrow maxillary arch with wide buccal corridors. She was treated with arch expansion. B, On 5-year recall, the broader smile (with narrow but not obliterated buccal corridors) is part of the esthetic improvement created by orthodontic treatment.
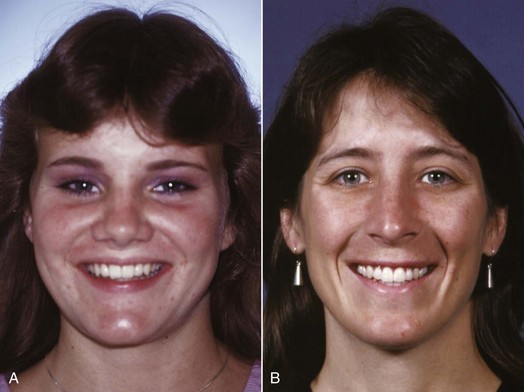
FIGURE 6-23 The width of the maxillary dental arch, as seen on smile, should be proportional to the width of the midface. A, A broad smile is appropriate for a face with relatively large width across the zygomatic arches, but a narrower smile (B) is preferred when the face width is narrow. The patient in B was appropriately treated with maxillary premolar extraction to prevent overexpansion during treatment.
The Smile Arc: The smile arc is defined as the contour of the incisal edges of the maxillary anterior teeth relative to the curvature of the lower lip during a social smile (Figure 6-24). For best appearance, the contour of these teeth should match that of the lower lip. If the lip and dental contours match, they are said to be consonant.
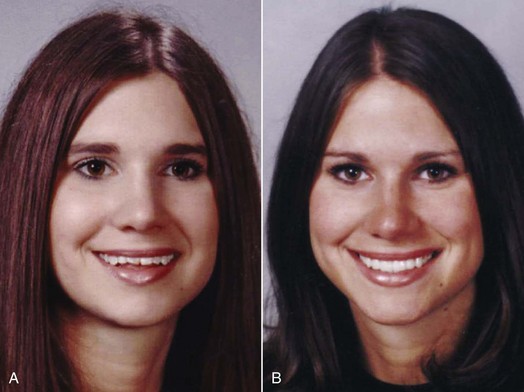
FIGURE 6-24 The smile arc is the relationship of the curvature of the lower lip to the curvature of the maxillary incisors. The appearance of the smile is best when the curvatures match. A, A flat smile arc, which is less attractive in both males and females, prior to treatment. B, The same girl after treatment. The improvement in her smile was created solely by lengthening her maxillary incisors—in her case, with dental laminates rather than orthodontics.
A flattened (nonconsonant) smile arc can pose either or both of two problems: it is less attractive and tends to make you look older (because older individuals often have wear of the incisors that tends to flatten the arc of the teeth). The characteristics of the smile arc must be monitored during orthodontic treatment because it is surprisingly easy to flatten it in the pursuit of other treatment objectives. The data indicate that the most important factor in smile esthetics, the only one that by itself can change the rating of a smile from acceptable to unesthetic, is the smile arc.8
It is important to keep in mind that these features of the smile are viewed differently by patients when the full face is the context (i.e., they are looking into a large mirror mounted so that they can see their whole face) instead of just seeing their lips and teeth (in a hand-held mirror that shows only part of the face). With the full-face view, the smile arc is judged most attractive when the upper incisal edges and canines parallel the curvature of the lower lip. The preferred buccal corridors are small, significantly smaller than when judged using the smaller mirror. A transverse cant of the occlusal plane is less tolerated in the full-face view, but more upper to lower midline discrepancy is acceptable.11,12 When patients have complaints about these specific smile components, it is best to have them point out what concerns them while they are looking into a large mirror that lets them see their entire face—just as others will view them in real life encounters.
Because facial attractiveness and gender do make a difference for some of these features, Box 6-4 shows a range of acceptability for characteristics in which this is important. Although there are modest differences between ethnic groups13 and nationalities (even Canadians and Americans)14 in their judgment of smile esthetics, the safe ranges had some commonality for groups that were predominantly of European descent. Similar data for Asian and African groups do not exist at present.
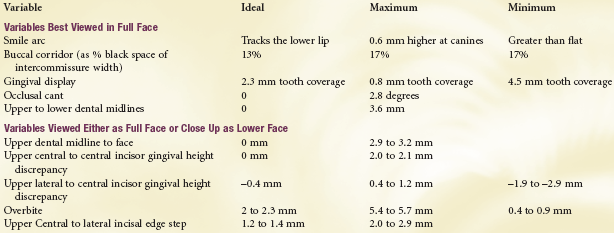
Box 6-4 Esthetic Variables
Maximum and Minimum for Esthetic Acceptability Considering Facial Attractivenss and Gender
Some smile variables are influenced by facial attractiveness and gender. This can be difficult to manage given the need to determine the patient’s facial attractiveness. To simplify application of the information, the range of acceptability or “common ground” for all levels of facial attractiveness is noted below for each gender.
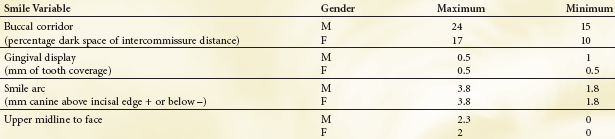
From Chang C, Springer NC, Fields HW, et al. Smile esthetics from patients’ perspective for faces of varying attractiveness. Am J Orthod Dentofac Orthop 140:e171-e180, 2011.
Although smile arc, gingival display, buccal corridor, and upper midline to the face all are viewed significantly differently against a full-face background, the features described below that constitute micro-esthetics are unaffected by the size of the view. Patients can view these characteristics close-up in a hand mirror or in a full-face view and make similar judgments. The facial context and attractiveness make little difference, and there is no gender difference.
Dental Appearance: Micro-Esthetics
Subtleties in the proportions and shape of the teeth and associated gingival contours have been emphasized in the burgeoning literature on “cosmetic dentistry” in recent years. A similar evaluation is necessary in the development of an orthodontic problem list if an optimal esthetic result is to be obtained. Treatment planning to correct problems of this type is discussed in Chapter 7.
Tooth Proportions: The smile, of course, reveals the maxillary anterior teeth, and two aspects of proportional relationships are important components of their appearance: the tooth widths in relation to each other and the height–width proportions of the individual teeth.
Width Relationships and the “Golden Proportion.”: The apparent widths of the maxillary anterior teeth on smile, and their actual mesiodistal width, differ because of the curvature of the dental arch. In particular, only a portion of the canine crown can be seen in a frontal view. For best appearance, the apparent width of the lateral incisor (as one would perceive it from a direct frontal examination) should be 62% of the width of the central incisor, the apparent width of the canine should be 62% of that of the lateral incisor, and the apparent width of the first premolar should be 62% of that of the canine (Figure 6-25). This ratio of recurring 62% proportions appears in a number of other relationships in human anatomy and sometimes is referred to as the “golden proportion.” Whether it has any mystical significance or not, it is an excellent guideline when lateral incisors are disproportionately small or (less frequently) large, and the width ratios of the central and lateral are the best way to determine what the posttreatment size of the lateral incisor should be. The same judgment is used when canines are narrowed to replace missing lateral incisors.
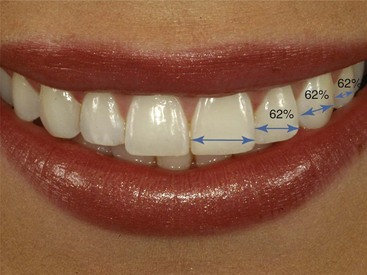
FIGURE 6-25 Ideal tooth width proportions when viewed from the front are one of many illustrations of the “golden proportion,” 1.0:0.62:0.38:0.24, etc. In this close-up view of attractive teeth on smile, it can be seen that the width of the lateral incisor is 62% of the width of the central incisor; the (apparent) width of the canine is 62% of the width of the lateral incisor; and the (apparent) width of the first premolar is 62% of the width of the canine.
Height–Width Relationships: The range in height–width relationships for maxillary central incisors is shown in Figure 6-26. Note that the width of the tooth should be about 80% of its height. In examining an orthodontic patient, it is important to note both height and width because if disproportions are noted, this allows a determination of which is at fault. The central incisor seen in Figure 6-26, B, looks almost square. Its width measures 8.7 mm and its height 8.5 mm. From the table, the 8 mm width is in the middle of the normal range, and the height is short. There are several possible causes: incomplete eruption in a child, which may correct itself with further development; loss of crown height from attrition in an older patient, which may indicate restoration of the missing part of the crown; excessive gingival height, which is best treated with crown lengthening; or perhaps an inherent distortion in crown form, which suggests a more extensive restoration with facial laminates or a complete crown (see Chapter 18). The disproportion and its probable cause should be included in the patient’s problem list to focus attention on doing something about it before orthodontic treatment is completed.
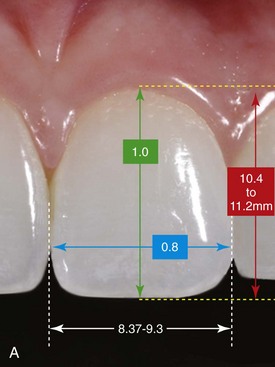
FIGURE 6-26 A, Height–width proportions for maxillary central incisors, with the normal range of widths and heights. The width of the tooth should be about 80% of its height. B, This patient’s central incisors look almost square, because their width is normal but their height is not. Increasing crown height would be a goal of comprehensive orthodontic treatment. How to do that would depend on mini- and macro-esthetic considerations.
Gingival Heights, Shape, and Contour: Proportional gingival heights are needed to produce a normal and attractive dental appearance (see Figure 6-24). Generally, the central incisor has the highest gingival level, the lateral incisor is approximately 1.5 mm lower, and the canine gingival margin again is at the level of the central incisor. Maintaining these gingival relationships becomes particularly important when canines are used to replace missing lateral incisors or when other tooth substitutions are planned. Both laypersons and dentists readily recognize differences of more than 2 mm.
Gingival shape refers to the curvature of the gingiva at the margin of the tooth. For best appearance, the gingival shape of the maxillary lateral incisors should be a symmetric half-oval or half-circle. The maxillary centrals and canines should exhibit a gingival shape that is more elliptical and oriented distally to the long axis of the tooth (Figure 6-27). The gingival zenith (the most apical point of the gingival tissue) should be located distal to the longitudinal axis of the maxillary centrals and canines, while the gingival zenith of the maxillary laterals should coincide with their longitudinal axis.
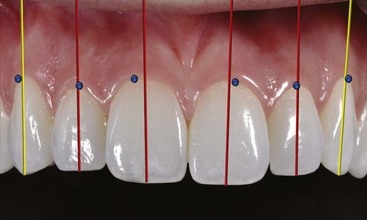
FIGURE 6-27 For ideal appearance, the contour of the gingiva over the maxillary central incisors and canines is a horizontal half-ellipse (i.e., flattened horizontally), with the zenith (the height of contour) distal to the midline of the tooth. The maxillary lateral incisor, in contrast, has a gingival contour of a half-circle, with the zenith at the midline of the tooth. The canine gingival contour is a vertical half-ellipse, with the zenith just distal to the mid-line.
Connectors and Embrasures: These elements, illustrated in Figure 6-28, also can be of real significance in the appearance of the smile and should be noted as problems if they are incorrect. The connector (also referred to as the interdental contact area) is where adjacent teeth appear to touch and may extend apically or occlusally from the actual contact point. In other words, the actual contact point is likely to be a very small area, and the connector includes both the contact point and the areas above and below that are so close together they look as if they are touching. The normal connector height is greatest between the central incisors and diminishes from the centrals to the posterior teeth, moving apically in a progression from the central incisors to the premolars and molars. The embrasures (the triangular spaces incisal and gingival to the contact) ideally are larger in size than the connectors, and the gingival embrasures are filled by the interdental papillae.
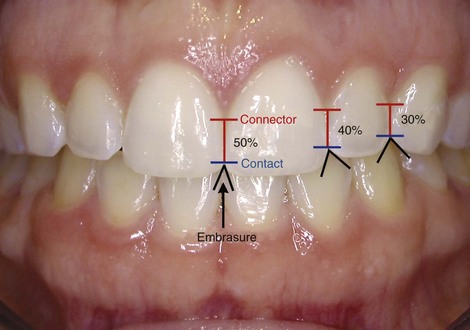
FIGURE 6-28 The contact points of the maxillary teeth move progressively gingivally from the central incisors to the premolars, so that there is a progressively larger incisal embrasure. The connector is the area that looks to be in contact in an unmagnified frontal view. Note that this decreases in size from the centrals posteriorly. Connectors that are too short often are part of the problem when “black triangles” appear between the teeth because the gingival embrasures are not filled with gingival papillae.
Embrasures: Black Triangles: Short interdental papillae leave an open gingival embrasure above the connectors, and these “black triangles” can detract significantly from the appearance of the teeth on smile. Black triangles in adults usually arise from loss of gingival tissue related to periodontal disease, but when crowded and rotated maxillary incisors are corrected orthodontically in adults, the connector moves incisally and black triangles may appear, especially if severe crowding was present (Figure 6-29). For that reason, both actual and potential black triangles should be noted during the orthodontic examination, and the patient should be prepared for reshaping of the teeth to minimize this esthetic problem.
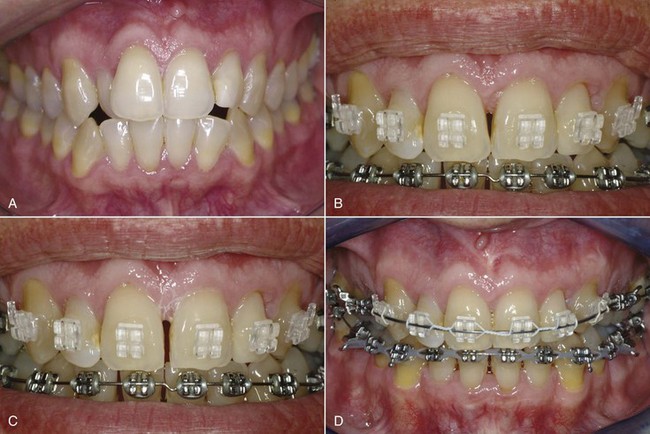
FIGURE 6-29 A, Crowded and rotated maxillary incisors at the beginning of orthodontic treatment for an adult. B, After alignment of the incisors, a black triangle was present between the central incisors. C, With the orthodontic appliance still in place, the incisors were reshaped so that when the contact point would be moved apically the midline connector would be lengthened. D, After the space was closed the black triangle was no longer apparent.
Tooth Shade and Color: The color and shade of the teeth changes with increasing age, and many patients perceive this as a problem. The teeth appear lighter and brighter at a younger age and darker and duller as aging progresses. This is related to the formation of secondary dentin as pulp chambers decrease in size and to thinning of the facial enamel, which results in a decrease in its translucency and a greater contribution of the darker underlying dentin to the shade of the tooth. A normal progression of shade change from the midline posteriorly is an important contributor to an attractive and natural appearing smile. The maxillary central incisors tend to be the brightest in the smile, the lateral incisors less so, and the canines the least bright. The first and second premolars are more closely matched to the lateral incisors. They are lighter and brighter than the canines.
At present, even young patients are quite likely to be aware of the possibility of bleaching their teeth to provide a more youthful appearance and may benefit from having this done at the end of orthodontic treatment. If color and shade of the teeth are a potential problem, this should be on the orthodontic problem list so that it is included in the final treatment plan if the patient desires it.
Which Diagnostic Records Are Needed?
Orthodontic diagnostic records are taken for two purposes: to document the starting point for treatment (after all, if you do not know where you started, it is hard to tell where you are going), and to add to the information gathered on clinical examination. It is important to remember that the records are supplements to, not replacements for, the clinical examination.
Orthodontic records fall into the same three major categories used for development of the diagnostic database: those for evaluation of the (1) health of the teeth and oral structures, (2) alignment and occlusal relationships of the teeth, and (3) facial and jaw proportions, which includes both facial photographs, cephalometric radiographs, and computed tomography (CT) images. Digital photography now has replaced film, and digital images are doing the same for radiographs.
Health of Teeth and Oral Structures
A major purpose of intraoral photographs, which should be obtained routinely for patients receiving complex orthodontic treatment, is to document the initial condition of the hard and soft tissues. Five standard intraoral photographs are suggested: right, center, and left views with the teeth in occlusion, and maxillary and mandibular occlusal views (see Figure 6-77). Maximum retraction of the cheeks and lips is needed. If there is a special soft-tissue problem (for instance, no attached gingiva in the lower anterior), an additional photograph of that area is needed.
A panoramic radiograph is valuable for orthodontic evaluation at most ages beyond the early mixed dentition years. The panoramic image has two significant advantages over a series of intraoral radiographs: it yields a broader view and thus is more likely to show any pathologic lesions and supernumerary or impacted teeth, and the radiation exposure is much lower. It also gives a view of the mandibular condyles, which can be helpful, both in its own right and as a screening image to determine if tomography (CBCT) or magnetic resonance imaging (MRI) of the joint is needed. TM joint symptoms often are due to problems with the intraarticular disc or the ligaments that suspend it, which cannot be seen in radiographs but can be seen with MRI. Imaging of the TM joint and recommendations for current practice are covered in detail in a recent paper from a multisite study.15
The panoramic radiograph should be supplemented with periapical and bitewing radiographs only when greater detail is required. Current American recommendations for dental radiographic screening for pathology are shown in Table 6-5. In addition, for children and adolescents, periapical views of incisors are indicated if there is evidence or suspicion of root resorption or aggressive periodontal disease. The principle is that periapical or other radiographs to supplement the panoramic radiograph are ordered only if there is a specific indication for doing so in order to keep the amount of radiation to a minimum that is consistent with obtaining the necessary diagnostic information. Radiation doses for modern dental radiography are shown in Table 6-6.
TABLE 6-5
U.S. Public Health Service Guidelines: Dental Radiographic Examination for Pathology
| Condition | Recommended radiographs |
| Regular dental care | |
| No previous caries | Panoramic radiograph only |
| No obvious pathology | |
| History of fluoridation | |
| Previous caries | Add bitewings |
| Obvious caries | |
| Deep caries | Add periapicals, affected area only |
| Periodontal disease | Add bitewings or periapicals, affected areas only |
From the American Dental Association/U.S. Food and Drug Administration. Guidelines for Prescribing Dental Radiographs, revised 2009.
TABLE 6-6
Doses and Risk Associated with Modern Radiographic Equipment
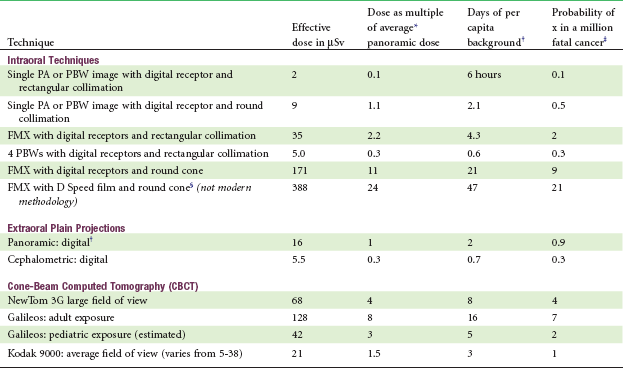
PA, Periapical; PBW, bitewing; FMX, full-mouth series.
*Average of 5 units: Sirona: Orthophos XG; Planmeca: ProMax; Kodak 9000; SOREDEX: SCANORA 3D; Instrumentarium Dental: OP200 D with VT.
†3000 µSv ubiquitous background radiation, NCRP Report No. 145, 2003.
‡Dose in µSv × 5.5 × 10⁻².
§Calculated as F-speed film value × 2.3.
Courtesy Dr. John Ludlow; revised November 23, 2010.
A common problem that deserves radiographic follow-up is localization of an unerupted maxillary canine that cannot be palpated in the buccal vestibule at dental age 10. Now that CBCT has become widely available, it is the preferred method for localizing canines (Figure 6-30). Both the position of the impacted tooth and the extent of damage to the roots of other teeth can be evaluated better with true three-dimensional (3-D) images. The use of 3-D imaging, including its use to replace panoramic and cephalometric radiographs, is discussed further in the section of this chapter on analysis of these images.
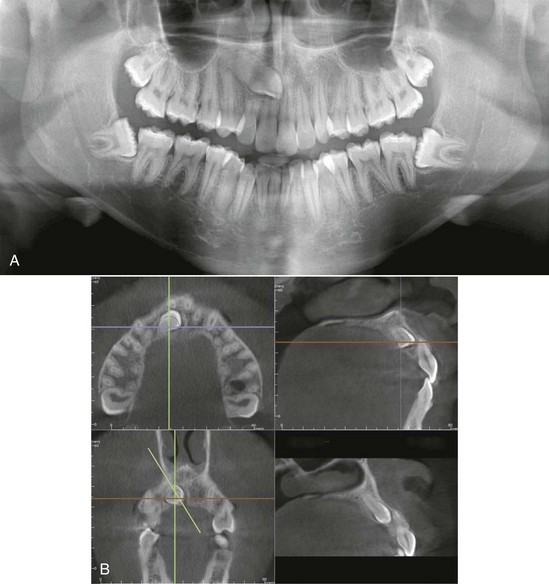
FIGURE 6-30 An impacted maxillary canine, seen in a panoramic radiograph (A) and in CBCT sections in various planes of space (B). (For an overall 3-D view of a similar case, see Figure 6-57). Note that it is impossible to evaluate the extent of root resorption of the lateral and central incisors from the panoramic radiograph and is difficult to determine whether the canine is facial or lingual to the incisors. From the CBCT slices, it is apparent that the lateral incisor root has been damaged, but the central incisor root is intact, although very close to the crown of the canine, and the canine is on the palatal side. This information changes the treatment plan from what it would have been if the panoramic radiograph were supplemented with periapicals that determined the palatal canine position but not the details of its relationship to the other teeth: it will be important for the orthodontist to first move the canine palatally, away from the incisors, before beginning to bring it down toward the occlusal plane. Otherwise, the central incisor root is almost sure to be damaged during the movement of the canine.
Dental Alignment and Occlusion
Evaluation of the occlusion requires impressions for dental casts or for scanning into computer memory and a record of the occlusion so that the casts or images can be related to each other. For some but not all, a facebow transfer to an articulator may be needed. These are considered in the following sections.
Physical versus Virtual Casts: Whether physical or virtual orthodontic diagnostic casts are to be produced, an impression of the teeth that also gives maximum displacement of the lips and cheeks is desired. Being able to visualize the inclination of the teeth, not just the location of the crown, is important. If the impression is not well extended, important diagnostic information may be missing. If the impressions are to be poured in dental stone without great delay, alginate impressions are satisfactory; if virtual models will be produced, a more accurate and stable impression material (such as modified alginate or polysiloxane) should be used.
At the minimum, a wax bite or polysiloxane record of the patient’s usual interdigitation (maximum intercuspation) should be made, and a check should be made to be sure that this does not differ significantly from the initial contact position. An anterior shift of 1 to 2 mm from the retruded position is of little consequence unless it creates a pseudo–Class III relationship, but lateral shifts or anterior shifts of greater magnitude should be noted carefully and a bite registration in an approximate centric relation position should be made.
Dental casts for orthodontic purposes are usually trimmed so that the bases are symmetric (Figure 6-31) and then are polished (or, if electronic records are used, the images are prepared to look like trimmed and polished casts). There are two reasons for doing this: (1) if the casts are viewed with a symmetric base that is oriented to the midline of the palate, it is much easier to analyze arch form and detect asymmetry within the dental arches; and (2) neatly trimmed and polished casts are more acceptable for presentation to the patient, as will be necessary during any consultation about orthodontic treatment. By convention, these trimmed and polished casts are then referred to as models. In specialty practice, virtual models are rapidly replacing physical models because they eliminate the need for storage space and can be used for computer-assisted fabrication of appliances.
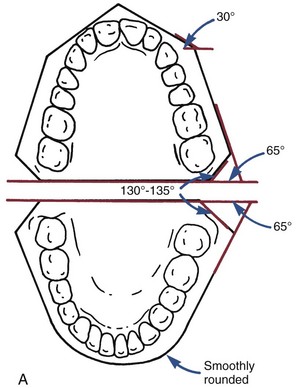
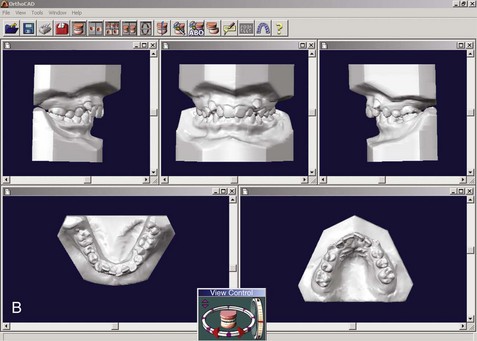
FIGURE 6-31 A, Orthodontic casts have traditionally been trimmed with symmetric bases. The backs are trimmed perpendicular to the midsagittal line, most easily visualized as the midpalatal raphe for most patients. The angles shown for the casts are suggested values; symmetry is more important than the precise angulation. B, Digital casts, produced from laser scans of impressions or intermediate casts, are displayed with symmetric bases—partly to emphasize that they are equivalent to physical casts and partly because the symmetric base helps the observer detect asymmetries within the dental arches.
There are two ways at present to generate digital casts: from laser scans of impressions or from scans of casts poured up from impressions. Despite repeated efforts over the last decade, a way to visualize the undercuts within impressions with laser beams still has not been worked out. Creating temporary casts and then scanning the casts works efficiently enough that several commercial companies now offer satisfactory digital models produced in this way.
The ideal way to generate digital casts would be from an intraoral laser scan, eliminating impressions that are unpleasant for patients, as well as requiring additional processing to obtain a physical or virtual model. As with scanning impressions, undercuts would create a problem if the scan were only from the occlusal so that a model created directly from an intraoral scan of the occlusal surface would only show the teeth down to their height of contour. Although that would not be acceptable as a diagnostic record, it is enough for fabrication of archwires by a computer-controlled wire-bending robot. This technology now is commercially available and is discussed in Chapter 10. An alternative would be the use of a wand for intraoral scanning to generate data of the undercut areas, and this probably will become the standard method as costs decrease.
Articulator Mounting: Whether it is desirable to mount casts on an adjustable articulator as part of an orthodontic diagnostic evaluation is a matter of continuing debate. There are three reasons for mounting casts on articulators. The first is to record and document any discrepancy between the occlusal relations at the initial contact of the teeth and the relations at the patient’s full or habitual occlusion. The second is to record the lateral and excursive paths of the mandible, documenting these and making the tooth relationships during excursions more accessible for study. A third, which increasingly is superseded by posteroanterior (P-A) cephalograms or CBCT images, is to display the orientation of the occlusal plane to the face.
Knowing the centric occlusal relationship when the condyles are positioned “correctly” obviously is important for orthodontic diagnostic purposes if there is a significant difference between it and the usual intercuspation. Unfortunately, there is no current agreement as to what the “correct” centric position is, though the “muscle-guided” position (the most superior position to which a patient can bring the mandible using his or her own musculature), seems most appropriate for orthodontic purposes. It is now generally accepted that in normal individuals this neuromuscular position is anterior to the most retruded condylar position. Lateral shifts or large anterior shifts are not normal and should be recorded. Articulator-mounted casts are one way, but not the only way, to do that.
The second reason for mounting casts—to record the excursive paths—is important when restorative dentistry is being planned because the contours of the replacement or restored teeth must accommodate the path of movement. This is much less important when tooth positions and jaw relationships will change during treatment.
The current consensus is that for preadolescent and early adolescent orthodontic patients (i.e., those who have not completed their adolescent growth spurt), there is little point in an articulator mounting. In these young patients, the contours of the TM joint are not fully developed, so that condylar guidance is much less prominent than in adults. The shape of the temporal fossa in an adult reflects function during growth. Thus, until mature canine function is reached and the chewing pattern changes from that of the child to the normal adult (see Chapter 3), completion of the articular eminence and the medial contours of the joint should not be expected. In addition, the relationships between the dentition and the joint that are recorded in articulator mountings change rapidly while skeletal growth is continuing and tend to be only of historic interest after orthodontic treatment.
The situation is different when growth is complete or largely complete. In adults with symptoms of TM dysfunction (clicking, limitation of motion, pain), articulator-mounted casts may be useful to document significant discrepancies between habitual and relaxed mandibular positions. These patients often need therapy to reduce muscle spasm and splinting before the articulator mounting is done. An articulator mounting may also be needed to plan orthodontic or surgical treatment of adults with significant cants of the occlusal plane or asymmetries.
Virtual Articulators: A virtual articulator certainly is a possibility. Although software used for surgical treatment planning already has produced something like it, the virtual articulator still is some distance from reality as this is written because it requires not only accurate dental casts but also an accurate way to relate them to each other and to the jaws.
To relate the virtual casts to each other, two approaches have been evaluated. The first is using the palatal rugae as a stable structure to which the casts can be related. This has the advantage of creating a landmark independent of the teeth that is quite close to them, and the disadvantage that the accuracy is questionable because the rugae are far from ideal as a stable reference. The second is to use three scans: the maxillary and mandibular casts separately and then a scan with the casts in occlusion, which shows only the facial surfaces (Figure 6-32). Although this method has been validated and can be considered as potentially better than using the rugae,16 its accuracy also is somewhat questionable because there is no external point as a reference for the articulated casts.
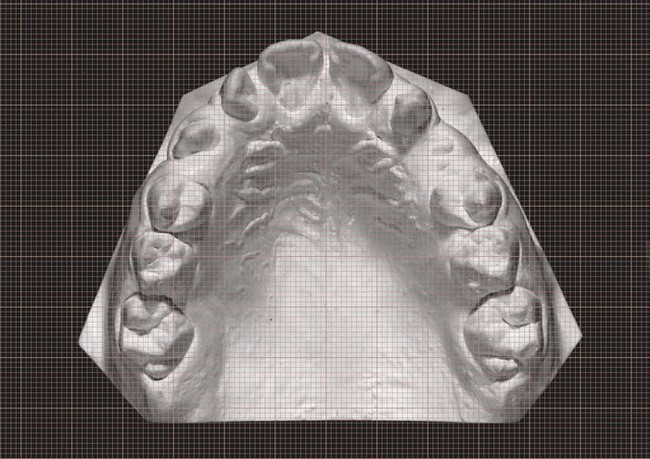
FIGURE 6-32 Placing a transparent ruled grid over the dental cast so that the grid axis is in the midline makes it easier to spot asymmetries in arch form (wider on the patient’s left than right, in this example) and in tooth position (molars drifted forward on the right). This can be done equally well with actual or virtual casts.
A more difficult task is to develop a way to relate the virtual casts to the facial skeleton. In theory one could use 3-D radiographs to develop a virtual facebow transfer that would provide a better relationship to the face than can be obtained with a physical facebow. In fact, this simply has not been developed yet but almost surely will be.
Facial and Dental Appearance
For any orthodontic patient, facial and jaw proportions not just dental occlusal relationships must be evaluated. This is done best by a careful clinical evaluation of the patient’s face (as described previously), but both a cephalometric radiograph and facial photographs, and sometimes CT images, are needed as records to support the clinical findings.
Like all radiographic records, cephalograms should be taken only when they are indicated. Comprehensive orthodontic treatment almost always requires a lateral cephalometric radiograph because it is rare that jaw relationships and incisor positions would not be altered during the treatment, and the changes cannot be understood without cephalometric superimpositions. It is irresponsible to undertake growth modification treatment in a child without a pretreatment lateral cephalometric radiograph. For treatment of minor problems in children or for adjunctive treatment procedures in adults, cephalometric radiographs usually are not required, simply because jaw relationships and incisor positions would not be changed significantly. The major indication for a frontal (P-A, not A-P) cephalometric radiograph was facial asymmetry, and this now is an indication for 3-D imaging instead (see the section on analysis of 3-D images below).
A series of facial photographs has been a standard part of orthodontic diagnostic records for many years. The minimum set is three photographs, frontal at rest, frontal smile, and profile at rest, but it can be valuable to have a record of tooth–lip relationships in other views (see Figure 6-75). The oblique smiling photo, for instance, provides an excellent view of both vertical tooth–lip relationships and the smile arc. Although 3-D photography now is available and is a valuable research tool (see Figure 2-11), it has little to add to an orthodontic diagnostic evaluation and, despite the trend toward 3-D imaging, is unlikely to become widely used for that purpose.
With the advent of digital records, it is easy now to obtain a short segment of digital video as the patient smiles and turns from a frontal to a profile view. The resulting set of images allows a detailed analysis of facial relationships at rest and in function and provides the preferred photographic record set. If still images are to be derived from the video, however, a high-quality video camera is required because with typical cameras the individual frames are low-resolution and frame-by-frame analysis might be desired. It is important to keep in mind that even the best photographs are never a substitute for careful clinical evaluation—they are just a record of what was observed clinically, or what should have been observed and recorded.
In summary, minimal diagnostic records for any orthodontic patient consist of dental casts trimmed to represent the occlusal relationship (or their electronic equivalent), a panoramic radiograph supplemented with appropriate bitewing and periapical radiographs, and data from facial form analysis. A lateral cephalometric radiograph and facial/intraoral photographs are needed for all patients except those with minor or adjunctive treatment needs, and 3-D imaging (discussed in more detail below) is needed for those with impacted teeth, skeletal asymmetry, and other special problems.
Analysis of Diagnostic Records
Comments on the analysis of intraoral radiographs appear in the previous section on clinical evaluation, as does information about intraoral and facial clinical findings that were recorded photographically. In this section, the focus is on four things: (1) dental cast analysis to evaluate space excess or deficiency and symmetry within the dental arches, (2) cephalometric analysis of dentofacial relationships, (3) analysis of 3-D CBCT images, and (4) integration of information from all sources into the problem-oriented format that facilitates treatment planning.
Cast Analysis: Symmetry, Space, and Tooth Size
An asymmetric position of an entire arch should have been detected already in the facial/esthetic examination. An asymmetry of arch form also may be present even if the face looks symmetric. A transparent ruled grid placed over the upper dental arch and oriented to the midpalatal raphe can make it easier to see a distortion of arch form in either physical (Figure 6-33) or virtual casts.
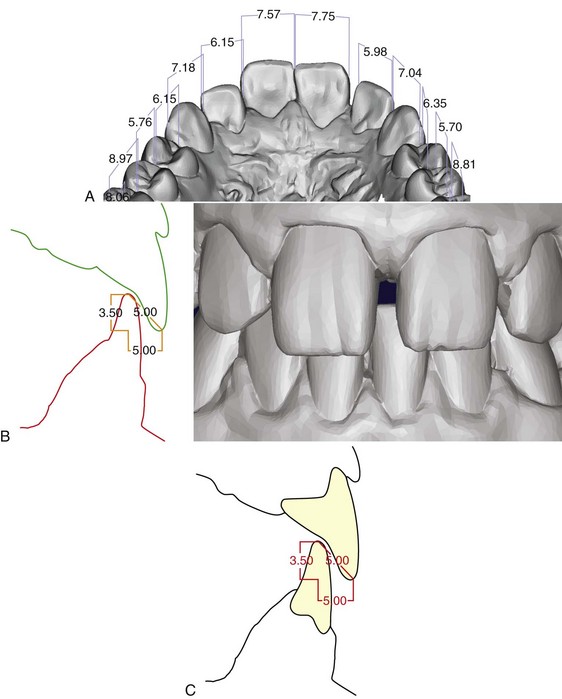
FIGURE 6-33 A, Accurate measurements can be done on a virtual dental cast like this one, produced from a laser scan of an impression rather than pouring the impression in stone. One method of relating virtual casts to each other is to use the palatal rugae, which are well visualized in an occlusal view like this one, as a reference area. This works reasonably well for transverse and anteroposterior dimensions, not so well for the vertical dimension. B, Close-up of virtual casts in occlusion. An additional laser scan of actual casts from this perspective is an alternative way to relate the virtual casts in occlusion. C, Using 3-D virtual casts in occlusion, both overjet and overbite can be visualized and measured precisely.
Asymmetry within the dental arch but with symmetric arch form also can occur. This usually results either from lateral drift of incisors, which is particularly likely when severe crowding leads to premature loss of a primary canine on one side, or from drift of posterior teeth on one side when early loss of a primary molar has occurred. The ruled grid also helps in seeing where drift of teeth has occurred.
Alignment (Crowding): Space Analysis
It is important to quantify the amount of crowding within the arches because treatment varies, depending on the severity of the crowding. Space analysis, using the dental casts to measure the size of the teeth versus the space available for them, is required for this purpose.
Such an analysis is particularly valuable in evaluating the likely degree of crowding for a child in the mixed dentition, and in that case it must include prediction of the size of unerupted permanent teeth. Mixed dentition space analysis is covered in Chapter 11.
Tooth Size Analysis
For good occlusion, the upper and lower teeth must be proportional in size. If large upper teeth are combined with small lower teeth, as in a denture setup with mismatched sizes, there is no way to achieve ideal occlusion. Although the natural teeth match very well in most individuals, approximately 5% of the population have some degree of disproportion among the sizes of individual teeth. This is termed tooth size discrepancy. Variation in the width of the upper lateral incisors or an anomaly of their size (enlarged, diminutive, or peg-shaped) is the most common cause, but variations in the size of premolars or other teeth may be present. Occasionally, all the upper teeth will be too large or too small to fit properly with the lower teeth.
Tooth size analysis, often called Bolton analysis after its developer, is carried out by measuring the mesiodistal width of each permanent tooth. A standard table (Table 6-7) is then used to compare the summed widths of the maxillary to the mandibular anterior teeth and the total width of all upper to lower teeth (excluding second and third molars). One advantage of measuring individual tooth widths into a computer template during space analysis is that the computer then can quickly provide a tooth size analysis (Figure 6-34).
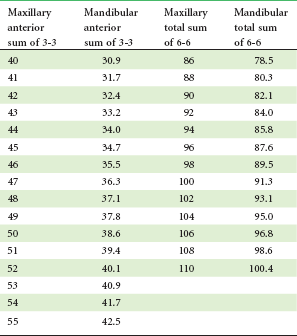
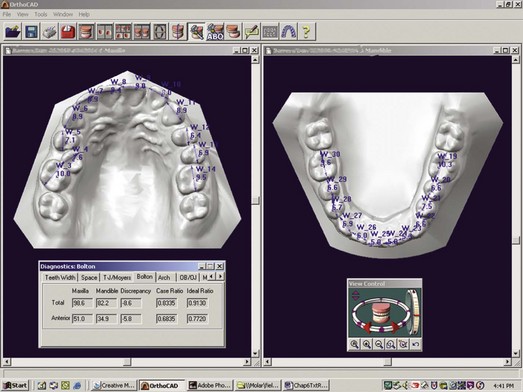
FIGURE 6-34 Tooth-size analysis (Bolton analysis) also is readily available from digital casts. This requires accurate measurement of the width of each of the teeth, so that the sum of the incisor widths in each arch, and the sum of the widths of all the teeth, can be compared with these sums for the other arch (see Table 6-7). When comparing the dental arches in this way, keep in mind that the analysis assumes comparable inclinations of the incisors in both arches, so it can be misleading in patients with jaw discrepancies who have upright incisors in one arch and proclined incisors in the other.
A quick check for anterior tooth size discrepancy can be done by comparing the size of upper and lower lateral incisors. Unless the upper laterals are wider, a discrepancy almost surely exists. A quick check for posterior tooth size discrepancy is to compare the size of upper and lower second premolars, which should be about equal size. A tooth size discrepancy of less than 1.5 mm is rarely significant, but larger discrepancies create treatment problems in achieving ideal occlusal relationships and must be included in the orthodontic problem list.
Cephalometric Analysis
The introduction of radiographic cephalometrics in 1934 by Hofrath in Germany and Broadbent in the United States provided both a research and a clinical tool for the study of malocclusion and underlying skeletal disproportions (Figure 6-35). The original purpose of cephalometrics was research on growth patterns in the craniofacial complex. The concepts of normal development presented in Chapters 2 and 3 were largely derived from such cephalometric studies.
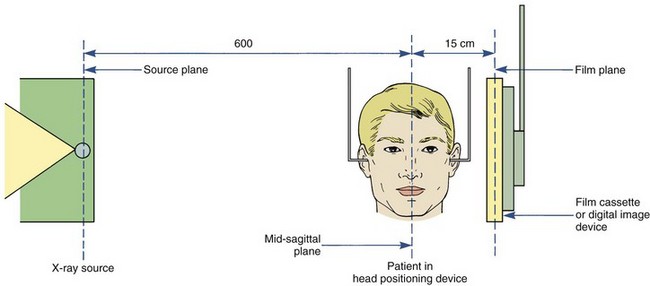
FIGURE 6-35 Diagrammatic representation of the American standard cephalometric arrangement. By convention, the distance from the x-ray source to the subject’s midsagittal plane is 5 feet. The distance from the midsagittal plane to the cassette can vary but must be the same for any one patient every time.
It soon became clear, however, that cephalometric radiographs could be used to evaluate dentofacial proportions and clarify the anatomic basis for a malocclusion. The orthodontist needs to know how the major functional components of the face (cranial base, jaws, teeth) are related to each other (Figure 6-36). Any malocclusion is the result of an interaction between jaw position and the position the teeth assume as they erupt, which is affected by the jaw relationships (see Chapter 4 for a discussion of dental compensation or adaptation). For this reason, apparently similar malocclusions as evaluated from the dental occlusions may turn out to be quite different when evaluated more completely (Figure 6-37). Although careful observation of the face can provide this information, cephalometric analysis allows greater precision.
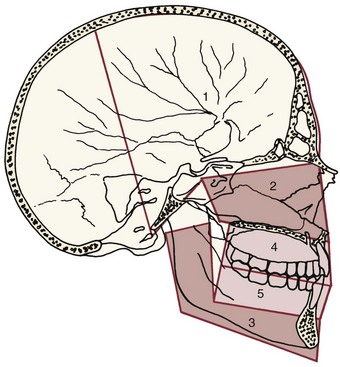
FIGURE 6-36 The structural components of the face, shown superimposed on the anatomic drawing. The cranium and cranial base (1), the skeletal maxilla and nasomaxillary complex (2), and the skeletal mandible (3) are parts of the face that exist whether there is or is not a dentition. The maxillary teeth and alveolar process (4) and the mandibular teeth and alveolar process (5) are independent functional units, which can be displaced relative to the supporting bone of the maxilla and mandible, respectively. The major goal of cephalometric analysis is to establish the relationship of these components in both the anteroposterior and vertical planes of space.
FIGURE 6-37 The ideal relationships of the facial and dental components can be represented as shown in A. Cephalometric analysis can distinguish and clarify the differing dental and skeletal contributions to malocclusions that present identical dental relationships. A Class II division 1 malocclusion, for example, could be produced by (B) protrusion of the maxillary teeth although the jaw relationship was normal, (C) mandibular deficiency with the teeth of both arches normally related to the jaw, (D) downward-backward rotation of the mandible produced by excessive vertical growth of the maxilla, or a number of other possibilities. The objective of cephalometric analysis is to visualize the contribution of skeletal and dental relationships to the malocclusion in this way, not to generate a table of numbers that are estimators of relationships. Measurements and other analytic procedures are a means to the end of understanding dental and skeletal relationships for an individual patient, not ends in themselves.
Cephalometric radiographs are not taken as a screen for pathology, but the possibility of observing pathologic changes on these radiographs should not be overlooked. Occasionally, previously unsuspected anomalies in the cervical spine (Figure 6-38) or degenerative changes in the vertebrae are revealed in a cephalometric radiograph, and sometimes other pathologic changes in the skull, jaws, or cranial base can be observed.17 This becomes particularly important when 3-D images of the head are obtained (see below), and examination of such images by a radiologist is needed to be sure nothing is overlooked in the orthodontist’s efforts to evaluate dental and facial proportions.
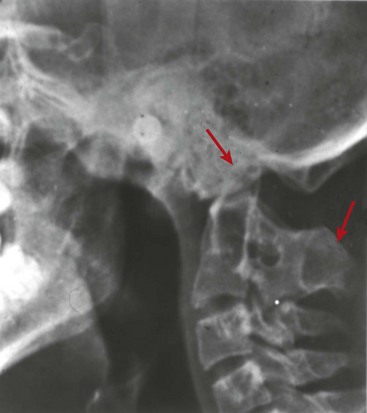
FIGURE 6-38 Vertebral pathology can be observed in cephalometric radiographs and sometimes is discovered by the orthodontist. This patient has fusion of the first and second cervical vertebrae, with the odontoid process extending into the margin of foramen magnum. This is a potentially life-threatening situation because a blow to the head or extreme positioning of the head could lead to damage to the spinal cord at the foramen level.
Perhaps the most important clinical use of radiographic cephalometrics is in recognizing and evaluating changes brought about by orthodontic treatment. Superimpositions taken from serial cephalometric radiographs before, during, and after treatment can be superimposed to study changes in jaw and tooth positions retrospectively (Figure 6-39). The observed changes result from a combination of growth and treatment (except in nongrowing adults). It is all but impossible to know what is really occurring during treatment of a growing patient without reviewing cephalometric superimpositions, which is the reason that cephalometric radiographs are required for comprehensive orthodontic treatment of children and adolescents.
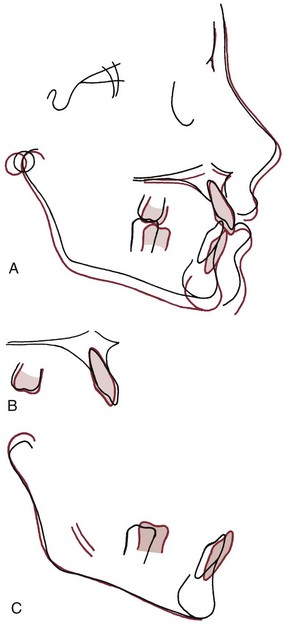
FIGURE 6-39 The three major cephalometric superimpositions showing tracings of the same individual at an earlier (black) and later (red) time. A, Superimposition on the anterior cranial base along the SN line. This superimposition shows the overall pattern of changes in the face, which result from a combination of growth and treatment in children receiving orthodontic therapy. Note in this patient that the lower jaw grew downward and forward, while the upper jaw moved straight down. This allowed the correction of the patient’s Class II malocclusion. B, Superimposition on the maxilla, specifically on the contour of the palate behind the incisors and along the palatal plane. This view shows changes of the maxillary teeth relative to the maxilla. In this patient’s case, minimal changes occurred, the most notable being a forward movement of the upper first molar when the second primary molar was lost. C, Superimposition on the mandible, specifically on the inner surface of the mandibular symphysis and the outline of the mandibular canal and unerupted third molar crypts. This superimposition shows both changes in the mandibular ramus and condylar process (due to growth or treatment) and changes in the position of the mandibular teeth relative to the mandible. Note that the mandibular ramus increased in length posteriorly, while the condyle grew upward and backward. As would be expected, the mandibular molar teeth moved forward as the transition from the mixed to the early permanent dentition occurred.
For diagnostic purposes, the major use of radiographic cephalometrics is in characterizing the patient’s dental and skeletal relationships. In this section, we focus on the use of cephalometric analysis to compare a patient to his or her peers, using population standards. The use of cephalometric predictions to estimate orthodontic and surgical treatment effects is covered in Chapters 18 and 19, respectively.
Development of Cephalometric Analysis
Cephalometric analysis is commonly carried out, not on the radiograph itself, but on a tracing or digital model that emphasizes the relationship of selected points. In essence, the tracing or model is used to reduce the amount of information on the radiograph to a manageable level. The common cephalometric landmarks and a typical tracing are shown in Figures 6-40 and 6-41.
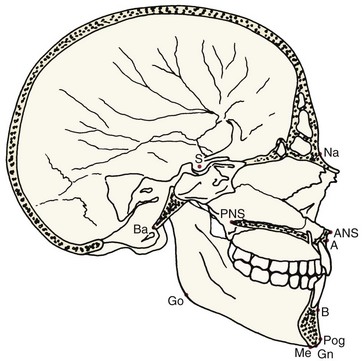
FIGURE 6-40 Definitions of cephalometric landmarks (as they would be seen in a dissected skull). Point A, the innermost point on the contour of the premaxilla between anterior nasal spine and the incisor tooth. ANS (anterior nasal spine), the tip of the anterior nasal spine (sometimes modified as the point on the upper or lower contour of the spine where it is 3 mm thick: see Harvold analysis). Point B, the innermost point on the contour of the mandible between the incisor tooth and the bony chin; Ba (basion), the lowest point on the anterior margin of foramen magnum, at the base of the clivus; Gn (gnathion), the center of the inferior point on the mandibular symphysis (i.e., the bottom of the chin); Na (nasion), the anterior point of the intersection between the nasal and frontal bones; PNS (posterior nasal spine), the tip of the posterior spine of the palatine bone, at the junction of the hard and soft palates; Pog (Pogonion), the most anterior point on the contour of the chin.
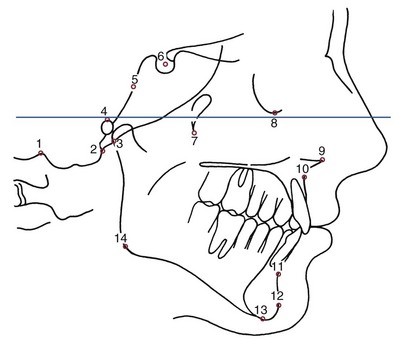
FIGURE 6-41 Definitions of cephalometric landmarks (as seen in a lateral cephalometric tracing): 1. Bo (Bolton point), the highest point in the upward curvature of the retrocondylar fossa of the occipital bone; 2. Ba (basion), the lowest point on the anterior margin of the foramen magnum, at the base of the clivus; 3. Ar (articulare), the point of intersection between the shadow of the zygomatic arch and the posterior border of the mandibular ramus; 4. Po (porion), the midpoint of the upper contour of the external auditory canal (anatomic porion); or the midpoint of the upper contour of the metal ear rod of the cephalometer (machine porion); 5. SO (spheno-occipital synchondrosis), the junction between the occipital and basisphenoid bones (if wide, the upper margin); 6. S (sella), the midpoint of the cavity of sella turcica; 7. Ptm (pterygomaxillary fissure), the point at the base of the fissure where the anterior and posterior walls meet; 8. Or (orbitale), the lowest point on the inferior margin of the orbit; 9. ANS (anterior nasal spine), the tip of the anterior nasal spine (sometimes modified as the point on the upper or lower contour of the spine where it is 3 mm thick; see Harvold analysis); 10. Point A, the innermost point on the contour of the premaxilla between anterior nasal spine and the incisor tooth; 11. Point B, the innermost point on the contour of the mandible between the incisor tooth and the bony chin; 12. Pog (pogonion), the most anterior point on the contour of the chin; 13. Me (menton), the most inferior point on the mandibular symphysis (i.e., the bottom of the chin); 14. Go (gonion), the midpoint of the contour connecting the ramus and body of the mandible.
Cephalometric landmarks are represented as a series of points, which are usually defined as locations on a physical structure (for example, the most anterior point on the bony chin), or occasionally as constructed points such as the intersection of two planes (for example, the intersection of the mandibular plane and a plane along the posterior margin of the ramus). The x,y coordinates of these points are used to enter cephalometric data in a computer-compatible format. Computer analysis now is the usual method in most private offices. An adequate digital model is required, which means that 50 to 100 landmark locations should be specified (Figure 6-42).
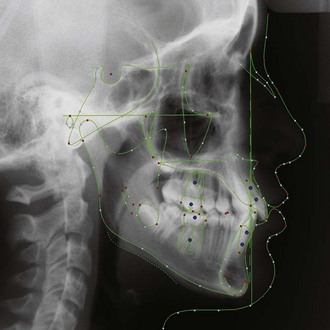
FIGURE 6-42 The standard lateral digitization model for a current cephalometric analysis and prediction program (Dolphin Imaging). Similar digital models, which usually can be customized to provide specific points that the clinician wants, are used in all current programs.
The principle of cephalometric analysis, however, is not different when computers are used. The goal is to determine the skeletal and dental relationships that exist in an individual patient and contribute to his or her malocclusion. How do you do that? One way is to compare the patient with a normal reference group, so that differences between the patient’s actual dentofacial relationships and those expected for his or her age and racial or ethnic group are revealed. This type of cephalometric analysis was first popularized after World War II in the form of the Downs analysis, developed at the University of Illinois and based on skeletal and facial proportions of a reference group of 25 untreated adolescent whites selected because of their ideal dental occlusions.
From the very beginning, the issue of how to establish the normal reference standards was difficult. It seems obvious that patients with severe cranial disproportions should be excluded from a normal sample. Since normal occlusion is not the usual finding in a randomly selected population group, one must make a further choice in establishing the reference group, either excluding only obviously deformed individuals while including most malocclusions, or excluding essentially all those with malocclusion to obtain an ideal sample. In the beginning, the latter approach was chosen. Comparisons were made only with patients with excellent occlusion and facial proportions, as in the 25 individuals chosen for the Downs standards. Perhaps the extreme of selectivity in establishing a reference standard was exemplified by Steiner, whose original ideal measurements were reputedly based on one Hollywood starlet. Although the story is apocryphal, if it is true, Dr. Steiner had a very good eye because recalculation of his original values based on averages from much larger samples produced only minor changes.
The standards developed for the Downs, Steiner, and Wits analyses are still useful but have largely been replaced by newer standards based on less rigidly selected groups. A major database for contemporary analysis is the Michigan growth study, carried out in Ann Arbor and involving a typical group of children, including those with mild and moderate malocclusions.18 Other major sources are the Burlington (Ontario) growth study,19 the Bolton study in Cleveland,20 along with numerous specific samples collected in university projects to develop standards for specific racial and ethnic groups that are included in texts on cephalometrics.21,22
Remember, the goal of cephalometric analysis is to evaluate the relationships, both horizontally and vertically, of the five major functional components of the face (see Figures 6-35 and 6-36): the cranium and cranial base, the skeletal maxilla (described as the portions of the maxilla that would remain if there were no teeth and alveolar processes), the skeletal mandible (similarly defined), the maxillary dentition and alveolar process, and the mandibular dentition and alveolar process. In this sense, any cephalometric analysis is a procedure designed to yield a description of the relationships among these functional units.
There are two basic ways to approach this goal. One is the approach chosen originally in the Downs analysis and followed by most workers in the field since that time. This is the use of selected linear and angular measurements to establish the appropriate comparisons. The other is to express the normative data graphically rather than as a series of measurements and to compare the patient’s dentofacial form directly with the graphic reference (usually called a template). Then any differences can be observed without making measurements.
Both approaches are employed in contemporary cephalometric analysis. In the sections following, contemporary measurement approaches are discussed first, and then cephalometric analysis via direct comparison with a reference template is presented.
Measurement Analysis
Choice of a Horizontal (Cranial) Reference Line: In any technique for cephalometric analysis, it is necessary to establish a reference area or reference line. The same problem was faced in the craniometric studies of the nineteenth century. By the late 1800s, skeletal remains of humans had been found at many locations and were under extensive study. An international congress of anatomists and physical anthropologists was held in Frankfort, Germany, in 1882, with the choice of a horizontal reference line for orientation of skulls an important item for the agenda. At the conference, the Frankfort plane, extending from the upper rim of the external auditory meatus (porion) to the inferior border of the orbital rim (orbitale), was adopted as the best representation of the natural orientation of the skull (Figure 6-43). This Frankfort plane was employed for orientation of the patient from the beginning of cephalometrics and remains commonly used for analysis.
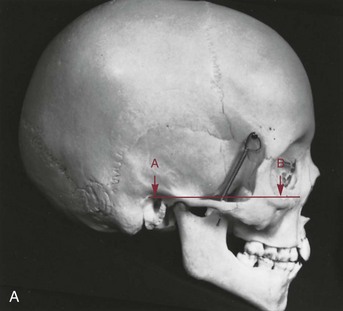
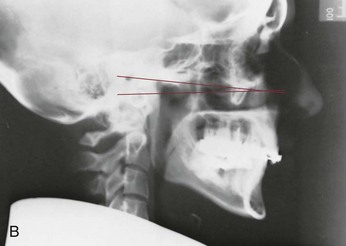
FIGURE 6-43 A, The Frankfort plane as originally described for orientation of dried skulls. This plane extends from the upper border of the external auditory canal (A) (porion) anteriorly to the upper border of the lower orbital rim (orbitale) (B). B, Using “machine porion,” the upper surface of the ear rod of the cephalometric headholder, can give a different Frankfort plane than using “anatomic porion,” the upper surface of the shadow of the auditory canal. Both porion and orbitale, the landmarks for the Frankfort plane, are difficult to locate accurately on cephalometric films, making Frankfort a relatively unreliable reference for cephalometric analysis.
In cephalometric use, however, the Frankfort plane suffers from two difficulties. The first is that both its anterior and posterior landmarks, particularly porion, can be difficult to locate reliably on a cephalometric radiograph. A radiopaque marker is placed on the rod that extends into the external auditory meatus as part of the cephalometric head positioning device, and the location of this marker, referred to as “machine porion” is often used to locate porion. The shadow of the auditory canal can be seen on cephalometric radiographs, usually located slightly above and posterior to machine porion. The upper edge of this canal can also be used to establish “anatomic porion,” which gives a slightly different (occasionally, quite different) Frankfort plane.
An alternative horizontal reference line, easily and reliably detected on cephalometric radiographs, is the line from sella turcica (S) to the junction between the nasal and frontal bones (N). In the average individual, the SN plane is oriented at 6 to 7 degrees upward anteriorly to the Frankfort plane. Another way to obtain a Frankfort line is simply to draw it at a specific inclination to SN, usually 6 degrees. However, although this increases reliability and reproducibility, it decreases accuracy.
The second problem with the Frankfort plane is more fundamental. It was chosen as the best anatomic indicator of the true or physiologic horizontal line. Everyone orients his or her head in a characteristic position, which is established physiologically, not anatomically. As the anatomists of a century ago deduced, for most patients the true horizontal line closely approximates the Frankfort plane. Some individuals, however, show significant differences, up to 10 degrees.
For their long-dead skulls, the anatomists had no choice but to use an anatomic indicator of the true horizontal. For living patients, however, it is possible to use a “true horizontal” line, established physiologically rather than anatomically, as the horizontal reference plane (Figure 6-44). This approach requires taking cephalometric radiographs with the patient in natural head position (i.e., with the patient holding his head level as determined by the internal physiologic mechanism). This position is obtained when relaxed individuals look at a distant object or into their own eyes in a mirror and incline their heads up and down in increasingly smaller movements until they feel comfortably positioned. The natural head position can be reproduced within 1 or 2 degrees.23
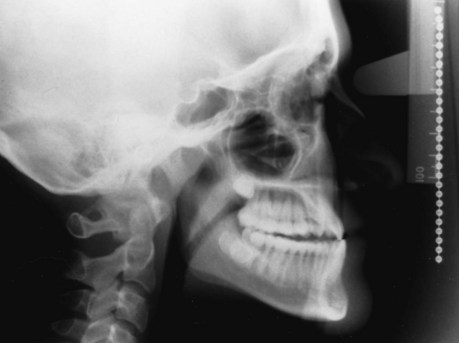
FIGURE 6-44 If the cephalometric radiograph is taken with the patient in natural head position (NHP), a line perpendicular to the true vertical (shown by the image of the freely-suspended chain that is seen on the edge of the film) is the true (physiologic) horizontal line. NHP is preferred in modern cephalometrics to anatomic head positioning.
In contemporary usage, cephalometric radiographs should be taken in the natural head position (NHP), so that the physiologic true horizontal plane is established. Although NHP is not as precisely reproducible as orienting the head to the Frankfort plane, the potential errors from lower reproducibility are smaller than those from inaccurate head orientation.24 The inclination of SN to the true horizontal plane (or to the Frankfort plane if true horizontal plane is not known) should always be noted; if the inclination of SN differs significantly from 6 degrees, any measurements based on SN should be corrected by this difference.
Steiner Analysis: Developed and promoted by Cecil Steiner in the 1950s, Steiner analysis can be considered the first of the modern cephalometric analyses for two reasons: it displayed measurements in a way that emphasized not just the individual measurements but their interrelationship into a pattern, and it offered specific guides for use of cephalometric measurements in treatment planning. Elements of it remain useful today.
In a sense, Steiner analysis was based on evaluating the compensations necessary to compensate for the difference between SNA and SNB, which indicates the magnitude of the skeletal jaw discrepancy (Figure 6-45). To Steiner, this difference (the ANB angle) was the measurement of real interest. One can argue, as he did, that which jaw is at fault is of mostly theoretical interest: what really matters is the magnitude of the discrepancy between the jaws that must be overcome in treatment, and this is what the ANB angle measures.
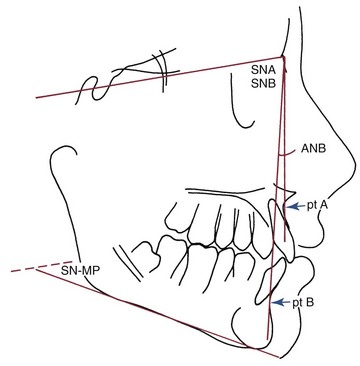
FIGURE 6-45 In the Steiner analysis, the angles SNA and SNB are used to establish the relationship of the maxilla and mandible to the cranial base; the SN-MP (mandibular plane) angle is used to establish the vertical position of the mandible.
Steiner then measured the angular and millimeter relationship of the upper incisor to the NA line and both the lower incisor and the chin to the NB line, thus establishing the relative protrusion of the dentition (Figure 6-46). The millimeter distance establishes how prominent the incisor is relative to its supporting bone, while the inclination indicates whether the tooth has been tipped to its position or has moved there bodily. The prominence of the chin (pogonion) compared with the prominence of the lower incisor establishes the balance between them: the more prominent the chin, the more prominent the incisor can be, and vice versa. This important relationship is often referred to as the Holdaway ratio. The final measurement included in Steiner analysis is the inclination of the mandibular plane to SN, which is its only indicator of the vertical proportions of the face (see Figure 6-45). Tabulated standard values for five racial groups are given in Table 6-8.
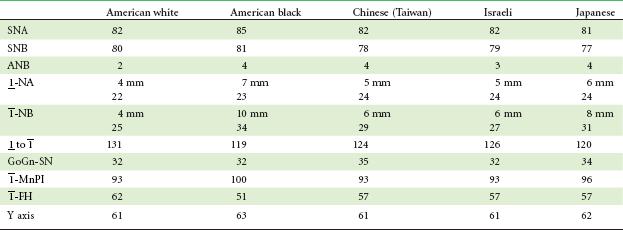
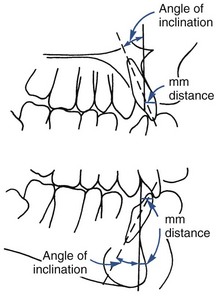
FIGURE 6-46 In the Steiner analysis, the relationship of the upper incisor to the NA line is used to establish the position of the maxillary dentition relative to the maxilla. Both the millimeter distance that the labial surface of the incisor is in front of the line and the inclination of the long axis of the incisor to the line are measured. The position of the lower incisor relative to the mandible is established by similar measurements to the line NB. In addition, the prominence of the chin is established by measuring the millimeter distance from the NB line to pogonion, the most prominent point on the bony chin.
There were significant problems with Steiner analysis, however, that led to its replacement. First, its reliance on ANB is problematic. The ANB angle is influenced by two factors other than the anteroposterior difference in jaw position. One is the vertical height of the face. As the vertical distance between nasion and points A and B increases, the ANB angle will decrease. The second is that if the anteroposterior position of nasion is abnormal, the size of the angle will be affected. In addition, as SNA and SNB become larger and the jaws are more protrusive, even if their horizontal relationship is unchanged, it will be registered as a larger ANB angle. The validity of these criticisms has led to use of different indicators of jaw discrepancy in the later analyses presented in the following sections.
Second, it should not be overlooked that relying on tooth movement alone to correct skeletal malocclusion, particularly as the skeletal discrepancies become large, is not necessarily the best approach to orthodontic treatment. It is usually better to correct skeletal discrepancies at their source than to attempt only to achieve a dental compromise or camouflage. It is fair to say that the Steiner compromises reflect the prevailing attitude of Steiner’s era, that the effects of orthodontic treatment are almost entirely limited to the alveolar process.
Sassouni Analysis: The Sassouni analysis was the first to emphasize vertical, as well as horizontal, relationships and the interaction between vertical and horizontal proportions. Sassouni pointed out that the horizontal anatomic planes—the inclination of the anterior cranial base, Frankfort plane, palatal plane, occlusal plane, and mandibular plane—tend to converge toward a single point in well-proportioned faces. The inclination of these planes to each other reflects the vertical proportionality of the face (Figure 6-47).
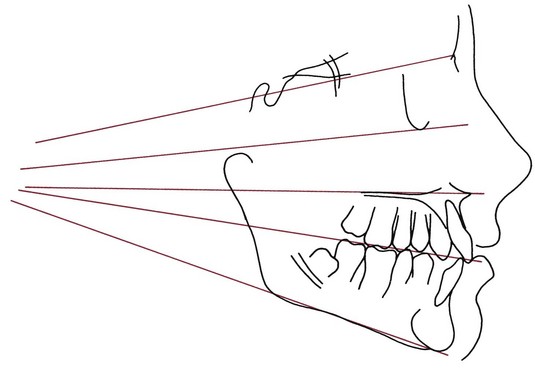
FIGURE 6-47 Sassouni contributed the idea that if a series of horizontal planes are drawn from the SN line at the top to the mandibular plane below, they will project toward a common meeting point in a well-proportioned face.18
If the planes intersect relatively close to the face and diverge quickly as they pass anteriorly, the facial proportions are long anteriorly and short posteriorly, which predisposes the individual to an open bite malocclusion. Sassouni coined the term skeletal open bite for this anatomic relationship. If the planes are nearly parallel so that they converge far behind the face and diverge only slowly as they pass anteriorly, there is a skeletal predisposition toward anterior deep bite, and the condition is termed skeletal deep bite.
In addition, an unusual inclination of one of the planes stands out because it misses the general area of intersection. Rotation of the maxilla down in back and up in front may contribute to skeletal open bite, for instance. The tipped palatal plane reveals this clearly (Figure 6-48).
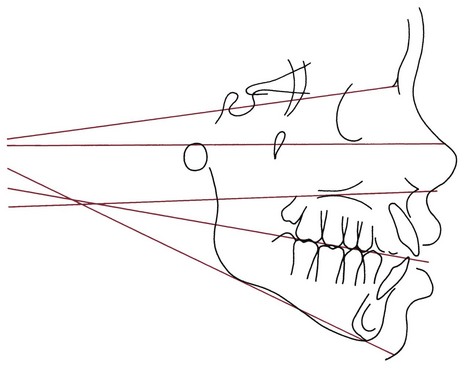
FIGURE 6-48 Inspection of the horizontal planes for this patient makes it clear that the maxilla is rotated downward posteriorly and the mandible rotated downward anteriorly. These rotations of the jaws contribute to an open bite tendency, so the skeletal pattern revealed here is often referred to as “skeletal open bite.”
Sassouni evaluated the anteroposterior position of the face and dentition by noting the relationship of various points to arcs drawn from the area of intersection of the planes. Unfortunately, as a face becomes more disproportionate, it is more and more difficult to establish the center for the arc, and the anteroposterior evaluation becomes more and more arbitrary.
Although the total arcial analysis described by Sassouni is no longer widely used, his analysis of vertical facial proportions has become an integral part of the overall analysis of a patient. In addition to any other measurements that might be made, it is valuable in any patient to analyze the divergence of the horizontal planes and to examine whether one of the planes is clearly disproportionate to the others.
Harvold and Wits Analyses: Both the Harvold and Wits analyses are aimed solely at describing the severity or degree of jaw disharmony. Harvold, using data derived from the Burlington growth study, developed standards for the “unit length” of the maxilla and mandible. The maxillary unit length is measured from the posterior border of the mandibular condyle to the anterior nasal spine, while the mandibular unit length is measured from the same point to the anterior point of the chin (Figure 6-49). The difference between these numbers provides an indication of the size discrepancy between the jaws. In analyzing the difference between maxillary and mandibular unit lengths, it must be kept in mind that the shorter the vertical distance between the maxilla and mandible, the more anteriorly the chin will be placed for any given unit difference, and vice versa. Harvold did quantify the lower face height to account for this factor. The position of the teeth has no influence on the Harvold figures (Table 6-9).
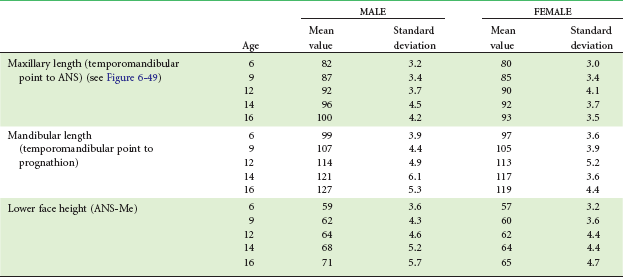
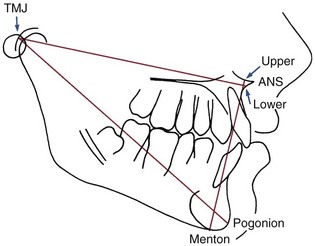
FIGURE 6-49 Measurements used in the Harvold analysis. Maxillary length is measured from TMJ, the posterior wall of the glenoid fossa, to lower ANS, defined as the point on the lower shadow of the anterior nasal spine where the projecting spine is 3 mm thick. Mandibular length is measured from TMJ to prognathion, the point on the bony chin contour giving the maximum length from the temporomandibular joint (close to pogonion), while lower face height is measured from upper ANS, the similar point on the upper contour of the spine where it is 3 mm thick, to menton.
The Wits analysis was conceived primarily as a way to overcome the limitations of ANB as an indicator of jaw discrepancy. It is based on a projection of points A and B to the occlusal plane, along which the linear difference between these points is measured. If the anteroposterior position of the jaws is normal, the projections from points A and B will intersect the occlusal plane at very nearly the same point. The magnitude of a discrepancy in the Class II direction can be estimated by how many millimeters the point A projection is in front of the point B projection, and vice versa for Class III.
The Wits analysis, in contrast to the Harvold analysis, is influenced by the teeth both horizontally and vertically—horizontally because points A and B are somewhat influenced by the dentition and vertically because the occlusal plane is determined by the vertical position of the teeth. It is important for Wits analysis that the functional occlusal plane, drawn along the maximum intercuspation of the posterior teeth, be used rather than an occlusal plane influenced by the vertical position of the incisors. Even so, this approach fails to distinguish skeletal discrepancies from problems caused by displacement of the dentition, and it does not specify which jaw is at fault if there is a skeletal problem. If the Wits analysis is used, these limitations must be kept in mind.
McNamara Analysis: The McNamara analysis, originally published in 1983, combines elements of previous approaches (Ricketts and Harvold) with original measurements to attempt a more precise definition of jaw and tooth positions. In this method, both the anatomic Frankfort plane and the basion–nasion line are used as reference planes. The anteroposterior position of the maxilla and mandible are evaluated with regard to their position relative to the “nasion perpendicular,” a vertical line extending downward from nasion perpendicular to the Frankfort plane (Figure 6-50). The maxilla should be on or slightly ahead of this line, the mandible slightly behind. The second step in the procedure is a comparison of maxillary and mandibular length, using Harvold’s approach. The mandible is positioned in space utilizing the lower anterior face height (ANS-menton). The upper incisor is related to the maxilla using a line through point A perpendicular to the Frankfort plane, similar to but slightly different from Steiner’s relationship of the incisor to the NA line. The lower incisor is related as in the Ricketts analysis, primarily using the A-pogonion line (Figure 6-51).
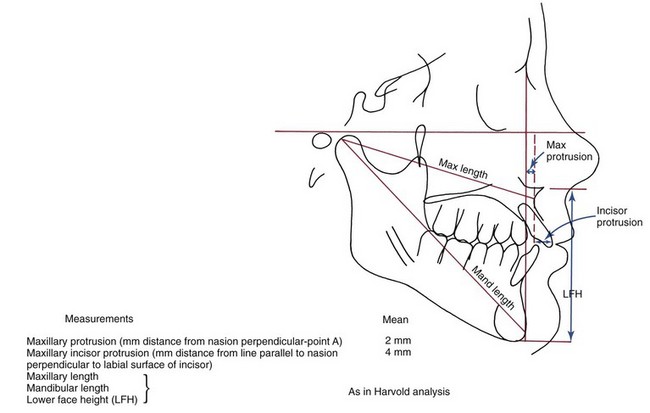
FIGURE 6-50 Measurements used in the McNamara analysis: Maxillary protrusion (millimeter distance from nasion perpendicular-point A), mean is 2 mm; maxillary incisor protrusion (millimeter distance from line parallel to nasion perpendicular to labial surface of incisor), mean is 4 mm; maxillary length, mandibular length, and lower face height (LFH) as in Harvold analysis.
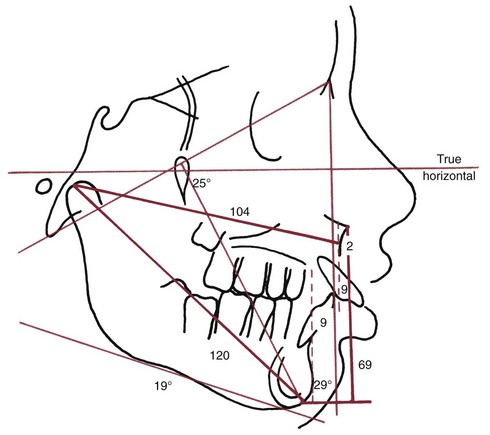
The McNamara analysis has the following two major strengths:
1. It relates the jaws via the nasion perpendicular, in essence projecting the difference in anteroposterior position of the jaws to an approximation of the true vertical line. (Using a true vertical line, perpendicular to the true horizontal rather than anatomic Frankfort, would be better yet; the major reason for not doing so in constructing the analysis is that the cephalometric radiographs from which the normative data were derived were not taken in NHP.) This means that anteroposterior differences in jaw relationships are measured along the dimension (nearly true horizontal) in which they are visualized by both the patient and the diagnostician.
2. The normative data are based on the well-defined Bolton sample, which is also available in template form, meaning that the McNamara measurements are highly compatible with preliminary analysis by comparison with the Bolton templates.
Counterpart Analysis: A major problem with any analysis based on individual measurements is that any one dimension is affected by others within the same face. Not only are the measurements not independent, but also it is quite possible for a deviation in one relationship to be compensated wholly or partially by changes in other relationships. This applies to both skeletal and dental relationships. Compensatory changes in the dentition to make the teeth fit in spite of the fact that the jaws do not are well known and often are the goal of orthodontic treatment. Compensatory changes in skeletal components of the face are less well known but occur frequently and can lead to incorrect conclusions from measurements if not recognized.
The basic idea of interrelated vertical and horizontal dimensions leading to an ultimately balanced or unbalanced facial pattern was first expressed well by Enlow et al in “counterpart analysis.” If anterior face height is long, facial balance and proper proportion are preserved if posterior face height and mandibular ramus height also are relatively large (Figure 6-52). On the other hand, short posterior face height can lead to a skeletal open bite tendency even if anterior face height is normal because the proportionality is disturbed.
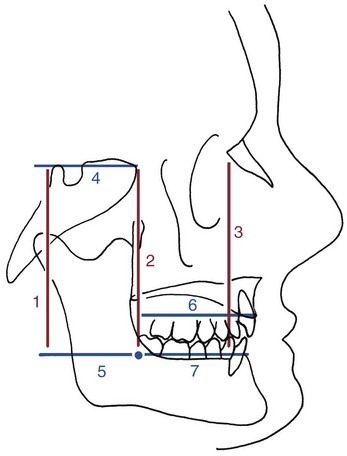
FIGURE 6-52 Enlow’s counterpart analysis emphasizes the way changes in proportions in one part of the head and face can either add to increase a jaw discrepancy or compensate so that the jaws fit correctly even though there are skeletal discrepancies. For example, if the maxilla is long (measurement 6), there is no problem if the mandible (7) also is long, but malocclusion will result if the mandibular body length is merely normal. The same would be true for anterior versus posterior vertical dimensions (1 to 3). If these dimensions match each other, there is no problem, but if they do not, whether short or long, malocclusion will result.
The same is true for anteroposterior dimensions. If both maxillary and mandibular lengths are normal but the cranial base is long, the maxilla will be carried forward relative to the mandible and maxillary protrusion will result. By the same token, a short maxilla could compensate perfectly for a long cranial base.
One way to bring the insights of counterpart analysis into clinical practice is from examination of the patient’s proportions versus those of a “normal” template (as discussed in the next section). Another, increasingly popular in the last few years, is the use of “floating point” norms for measurements.25 The idea is to use standards derived from the individual’s facial type rather than relating individual cephalometric values to population means, taking advantage of the correlations between the individual values. Rather than judging normality or abnormality based on individual values, the judgment then would be based on how the values were related to each other—some combinations would be acceptable as normal even if the individual measurements were outside the normal range. Other combinations could be judged as reflecting an abnormal pattern even though the individual measurements were within the normal range. Assessing skeletal relationships in this way is particularly valuable for patients who are candidates for growth modification therapy or orthognathic surgery.
Template Analysis
In the early years of cephalometric analysis, it was recognized that representing the norm in graphic form might make it easier to recognize a pattern of relationships. The “Moorrees mesh,” which was developed in the 1960s and updated more recently, presents the patient’s disproportions as the distortion of a grid.26 In recent years, direct comparison of patients with templates derived from the various growth studies has become a reliable method of analysis, with two major advantages: compensatory skeletal and dental deviations within an individual can be observed directly, and changes in dimensions and angles with changing ages can be taken into account by using age-appropriate templates.
Any individual cephalometric tracing easily can be represented as a series of coordinate points on an (x,y) grid, which is what is done when a radiograph is digitized for computer analysis. But of course cephalometric data from any group also could be represented graphically by calculating the average coordinates of each landmark point, then connecting the points. The resulting average or composite tracing often is referred to as a template.
Templates of this type have been prepared using the data from the major growth studies, showing changes in the face and jaws with age. At present, templates exist in two forms: schematic (Michigan, Burlington) and anatomically complete (Broadbent-Bolton, Alabama). The schematic templates show the changing position of selected landmarks with age on a single template. The anatomically complete templates, a different one for each age, are particularly convenient for direct visual comparison of a patient with the reference group while accounting for age. The Bolton templates, which are readily available (Dept. of Orthodontics, Case-Western Reserve School of Dentistry, Cleveland, Ohio 44106), are most often used for template analysis.
The first step in template analysis, obviously, is to pick the correct template from the set of age-different ones that represent the reference data. Two things must be kept in mind: (1) the patient’s physical size and (2) his or her developmental age. The best plan usually is to select the reference template initially so that the length of the anterior cranial base (of which the SN distance is a good approximation) is approximately the same for the patient and the template, and then to consider developmental age, moving forward or backward in the template age if the patient is developmentally quite advanced or retarded. In almost all instances, correcting for differences between developmental and chronologic age also leads to the selection of a template that more nearly approximates the anterior cranial base length.
Analysis using a template is based on a series of superimpositions of the template over a tracing of the patient being analyzed. The sequence of superimpositions follows:
1. Cranial base superimposition, which allows the relationship of the maxilla and mandible to the cranium to be evaluated (Figure 6-53). In general, the most useful approach is to superimpose on the SN line, registering the template over the patient’s tracing at nasion rather than sella if there is a difference in cranial base length. (For growth prediction with templates, it is important to use the posterior superimposition points described with the prediction method. For analysis, registering SN at N is usually preferable.)
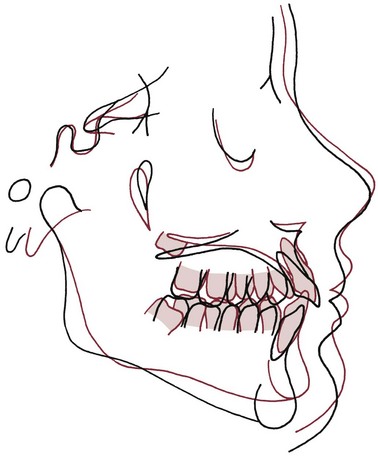
FIGURE 6-53 Cranial base superimposition of the standard Bolton template for age 14 (red) on the tracing of a 13-year-old boy. The age 14 template was chosen because it matches cranial base length. Note that from a comparison of the template with this patient, the considerable increase in the lower face height and downward rotation of the mandible can be seen clearly. It also is apparent that the patient’s maxilla is rotated down posteriorly. This comparison of a patient’s tracing to a template is a direct approach toward describing the relationship of functional facial units.
With the cranial base registered, the anteroposterior and vertical position of maxilla and mandible can be observed and described. It is important at this stage to look, not at the position of the teeth, but at the position of the landmarks that indicate the skeletal units (i.e., anterior nasal spine and point A for the anterior maxilla, posterior nasal spine for the posterior maxilla; point B, pogonion and gnathion for the anterior mandible, and gonion for the posterior mandible). The object is to evaluate the position of the skeletal units. The template is being used to see directly how the patient’s jaw positions differ from the norm. Compensations within the individual’s skeletal pattern are observed directly.
2. Maxillary superimposition. The second superimposition is on the maximum contour of the maxilla to evaluate the relationship of the maxillary dentition to the maxilla (Figure 6-54). Again, it is important to evaluate the position of the teeth both vertically and anteroposteriorly. The template makes it easy to see whether the teeth are displaced vertically, which is information often not obtained in measurement analysis techniques.
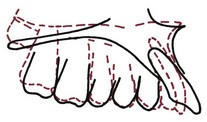
FIGURE 6-54 Superimposition of the Bolton template on the maxilla (primarily, the anterior palatal contour) of the patient shown in Figure 6-53. This superimposition clearly reveals the forward protrusion of the maxillary incisors but shows that the vertical relationship of the maxillary teeth to the maxilla for this patient is nearly ideal.
3. Mandibular superimposition. The third superimposition is on the symphysis of the mandible along the lower border, to evaluate the relationship of the mandibular dentition to the mandible (Figure 6-55). If the shadow of the mandibular canal is shown on the templates, a more accurate orientation can be obtained by registering along this rather than the lower border posteriorly. Both the vertical and the anteroposterior positions of the anterior and posterior teeth should be noted.
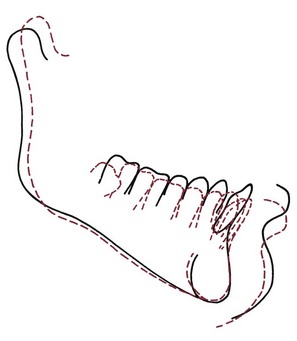
FIGURE 6-55 Superimposition of the Bolton template on the mandible of the patient in Figure 6-53. This superimposition indicates that the patient’s mandible is longer than the ideal, but the ramus is shorter and inclined posteriorly. All the mandibular teeth have erupted more than normal, especially the incisors.
Template analysis in this fashion quickly provides an overall impression of the way in which the patient’s dentofacial structures are related. Sometimes, the reason for making measurements, which is to gain an overall understanding of the pattern of the patient’s facial relationships, is overlooked in a focus on acquiring the numbers themselves. Comparing the patient to a template is an excellent way to overcome this hazard and be sure that one does not miss the forest while observing the trees.
Template analysis often is thought of as somehow less scientific than making a series of measurements, but really that is not so. Remember that the template contains exactly the same information as a table of measurements from the same data base (for the anatomic templates, very extensive tables). The information is just expressed in a different way. The difference is that with the template method, there is greater emphasis on the clinician’s individual assessment of whatever about the patient may be abnormal, and a corresponding de-emphasis of specific criteria.
Templates easily can be used with computer analysis as well. The technique would be to store the templates in computer memory, then pull up the appropriate template for comparison to the patient’s digitized tracing, and use the computer to make the series of superimpositions. The clinician, looking at the superimpositions, should be stimulated to make his own assessment of interactions among the various components of the face, incorporating the insights of counterpart analysis and floating norms at that point.
Summary of Contemporary Cephalometric Methodology
In its early years, cephalometric analysis was correctly criticized as being just a “numbers game,” leading to orthodontic treatment aimed at producing certain numbers on a cephalometric radiograph. That might or might not represent the best treatment result for that patient. Accepting the Steiner compromises and setting treatment goals solely in terms of producing these numbers could certainly be criticized on that basis. At present, competent clinicians use cephalometric analysis to better understand the underlying basis for a malocclusion. To do this, they look not just at individual measurements compared with a norm but at the pattern of relationships, including soft tissue relationships. Any measurements are a means to this end, not the end in itself.
Whatever the later steps (measurement or template superimposition), the place to begin cephalometric analysis is by drawing the Sassouni horizontal planes and examining their interrelationships. This simple step highlights rotations of the jaws (remember that both the maxilla and mandible can be rotated) and makes vertical proportions more apparent.
At that point, the analysis should turn to the anteroposterior relationships of the jaws and the dentition of each jaw. Superimposition of Bolton (or other) templates is one way to do that. The same information can be obtained by using a true vertical line across the front of the face as a reference, as in McNamara analysis, which is a straightforward way to establish skeletal relationships without having the measurements affected by tooth position. Moving the true vertical line so that it passes through point A and then through point B reveals the amount of dental protrusion or retrusion of the maxillary and mandibular teeth, respectively.
Finally, any other measurements needed to clarify relationships that are not clear should be made. Often, this includes measurements of face height, maxillary and mandibular unit lengths, or other components of the various analyses that have been discussed. The goal of modern cephalometrics is to evaluate the relationship of the functional units shown in Figure 6-35 and to do whatever is necessary to establish the position, horizontally and vertically, of each of those units. Because what is required amounts to pattern analysis, almost never can any single measurement be viewed in isolation. Instead, the interrelationship among various measurements and observed relationships must be taken into account. In a measurement analysis system, the appropriate floating norms always should be employed.
Although other diagnostic images are increasingly important in orthodontics, we hope that this section documents how valuable the principles of cephalometric analysis can be as a clinical tool. Particularly in complex orthodontic cases, a practitioner does both himself and the patient a disservice by failing to use these principles.
Analysis of Three-Dimensional Images from Cone-Beam Computed Tomography
Axial (spiral) CT has been available for over 40 years now and quickly came to be widely used in medical applications. It was not used to generate typical orthodontic diagnostic records because of its considerable cost and the relatively large radiation dose, which is quite acceptable for major medical problems but not for most elective treatment, including orthodontics.
The advent of CBCT for views of the head and face in the early twenty-first century changed this because both the cost of the equipment (and therefore the cost of obtaining the images) decreased significantly, and the radiation dose also was greatly reduced compared to axial CT. At this point, CBCT is being widely used in orthodontics. There is a consensus that it provides new information that could improve the treatment plan in certain situations, and enough enthusiasm to lead some orthodontists to advocate using CBCT on all orthodontic patients, replacing panoramic, cephalometric, and occlusal radiographs, as well as tomograms of the TM joint. There is a significant radiation dose increase in doing this, however (see Table 6-6).
Does the additional information from CBCT translate into better treatment plans and improvement of treatment outcomes? Answering that question requires replacing opinion with evidence, which remains in short supply. Three situations in which enough data now exist to support use of CBCT for orthodontic patients are as follows:
• Ectopically erupting or impacted teeth (especially maxillary canines, but other teeth as well) requiring surgical exposure and orthodontic tooth movement to bring them into the mouth
• Severe facial asymmetry, especially asymmetries involving roll and yaw (see later section)
Ectopically Erupting or Impacted Teeth
In evaluating impacted teeth, CBCT provides two types of information that can significantly change the treatment plan that would have resulted from two-dimensional (2-D) radiographs: (1) the extent of damage to the roots of adjacent permanent teeth can be seen clearly, and (2) the path can be defined along which it should be moved to bring it into the mouth most efficiently and with the least further damage to adjacent teeth.27 This allows adjustments such as bringing an impacted canine facially before beginning to bring it toward the occlusal plane, in order to avoid the remaining root of a damaged lateral incisor (Figure 6-56), and makes it possible for the surgeon to place an attachment on the tooth at the most favorable location for biomechanical advantage in moving it.
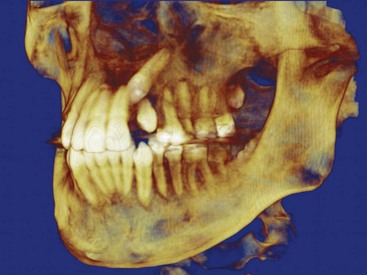
FIGURE 6-56 An impacted canine seen in a large field of view (FOV) CBCT scan. Note that it is mesial and facial to the lateral incisor and that the tip of the crown appears to be behind the root of the central incisor. These relationships could be seen more clearly by rotating the image, which, of course, can be done readily on the computer screen.
With CBCT, the radiation dose can be reduced in either or both of two ways: decreasing the size of the field of view (FOV), and decreasing the scan time to produce the image (and therefore its resolution). If the main reason for a CBCT image is an impacted tooth, a small FOV and relatively low scan time are adequate to allow detailed evaluation of the tooth and the best path for bringing it into the arch. The radiation dose then is relatively close to the dose from two periapical radiographs, which would have been the minimum 2-D radiographs required to localize the tooth, and the machine also is much less expensive than one with a FOV large enough for images of the entire face. For dental family practice, a CBCT machine with a small FOV would be adequate for almost all applications. For orthodontists, a larger FOV would be preferred so that both facial proportions and impacted teeth could be evaluated (Figure 6-57), but it would be desirable for the FOV to be adjustable, so that field size and scan time could be reduced when only an impacted tooth was the target. CBCT machines of this type now are available. For an orthodontic office, the alternative to an adjustable FOV is a “hybrid” machine that also incorporates a conventional cephalometric and panoramic unit. It would be used to reduce the radiation dose when only one of these views is needed.28
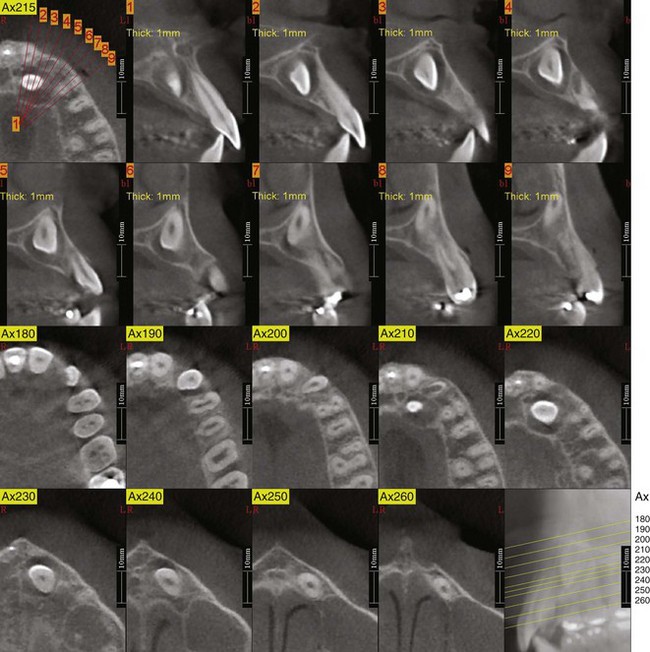
Facial Asymmetry
Until CBCT became readily available, the major indication for a frontal cephalometric radiograph was facial asymmetry. Even with the addition of this image to the standard panoramic and lateral cephalometric views, evaluating asymmetry required extrapolation between the three images and was qualitative, not quantitative. With these three radiographs of a patient with an asymmetric mandible, one could see in the lateral cephalometric view that the ramus and mandibular body are longer on one side, in the panoramic view that the ramus is longer on one side primarily because the condylar neck is longer, and in the frontal cephalometric view that the chin is off to one side—but the magnitude of the difference could be only approximated. With the multiple images and FOVs available from CBCT images (Figure 6-58), the primary source of the asymmetry can be identified in a way that allows treatment to be targeted at it.29
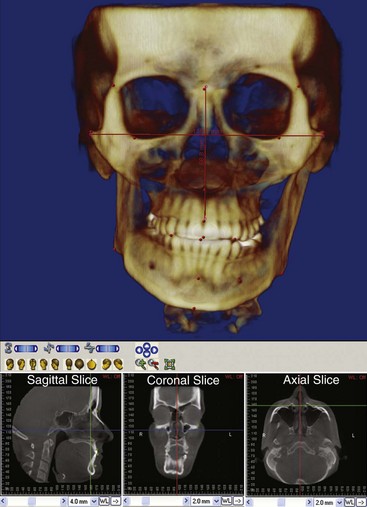
FIGURE 6-58 Large FOV CBCT scan of a patient with a jaw asymmetry. On the left, slices from the same file oriented relative to the midsagittal and Frankfort planes. Distances between any points can be measured accurately (the points are by no means limited to the ones placed on this image for demonstration of measurement possibilities).
It is possible to produce a precisely dimensioned stereolithographic model of an asymmetric facial skeleton from CT data (Figure 6-59), so that the orthodontist and surgeon can see it in the 3-D world rather than as a series of images on a computer screen. For this application axial rather than cone-beam CT may be advantageous. The model allows more precise surgical planning, including the ability to shape fixation plates in advance and determine exactly how fixation screws are to be placed. This technology is discussed in more detail in Chapter 19.
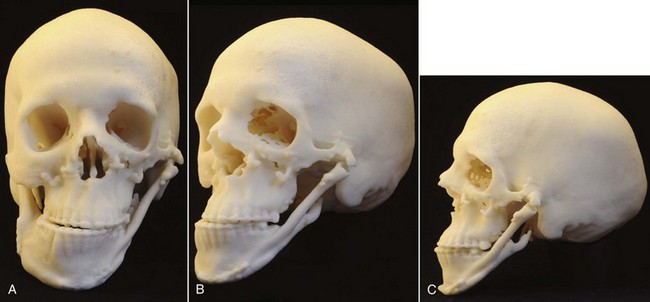
FIGURE 6-59 A to C, Stereolithographic model of the head of a patient with grade 3 (severe) hemifacial microsomia, in which the ramus of the mandible is completely missing on the affected (left) side. She had had previous surgery in which a rib graft was placed to connect the body of the mandible on the left side to a point of articulation with the skull, now required additional surgery to improve function and gain better symmetry. A model like this is an essential part of planning complex surgical treatment. (Courtesy Dr. T. Turvey.)
Syndromes, Congenital Deformities, and Facial Trauma
In a sense, syndromic and trauma patients present the same diagnostic problems created by less severe asymmetry—quantitative measurements rather than qualitative approximations are required. A major difference is that treatment at younger ages is likely to be required, and this increases the relative value of 3-D versus 2-D images. Although orthodontists are needed as part of the team who manage such patients, their diagnostic evaluation and treatment is largely beyond the scope of this book, and the reader is referred to texts that focus on management of these cases.30,31
Diagnostic Scope of Cone-Beam Computed Tomography Images
Just as an orthodontist should pick up pathology on cephalometric and panoramic radiographs (which he or she has been taught to do in typical specialty training), pathologic changes on CBCT images also should be detected. Is the orthodontist responsible for doing so? Should a maxillofacial radiologist with training in evaluation of CBCT images review the images created at the orthodontist’s request? The answer to both questions is yes—either the orthodontist develops the expertise needed to detect unexpected pathology, or he or she must get an expert evaluation for that purpose. As routine use of CBCT in orthodontics increases, as it seems clear that it will, orthodontic specialty training will need an increased focus on a broader evaluation of these images, but routine review of these records by a radiologist will be needed (and required for malpractice insurance) in a way that has not been necessary with 2-D radiographs.
Evaluation of Growth and Treatment Changes
A major use of lateral cephalometrics, in many ways its most important use, is evaluating the changes produced by growth and/or treatment. This was the purpose for which cephalometrics was developed originally. Careful clinical examination usually can produce a comprehensive problem list that cephalometric radiographs confirm, but the most skilled clinicians cannot evaluate changes over time without superimposed cephalometric tracings. In essence, we have used tracings to discard much of the information on a cephalometric radiograph so that when we superimpose the tracings, we can see more clearly the changes in which we are really interested.
Extending this method to sequential 3-D images is problematic. One possibility is to create a “synthetic ceph” from the CBCT images (Figure 6-60), which is comparable enough to conventional cephalograms to be used clinically,32 and use it to evaluate changes as it has been done for the last 50 years, but the major reason for CBCT imaging in the first place was to go beyond such a limited view. The landmarks that are used with lateral cephalograms are not reliable as the field of view is rotated away from the A-P plane of space. Efforts to define landmarks for 3-D superimposition are finding some success at present, but at best using them for superimposition provides a rather limited view of the changes occurring in a patient.33
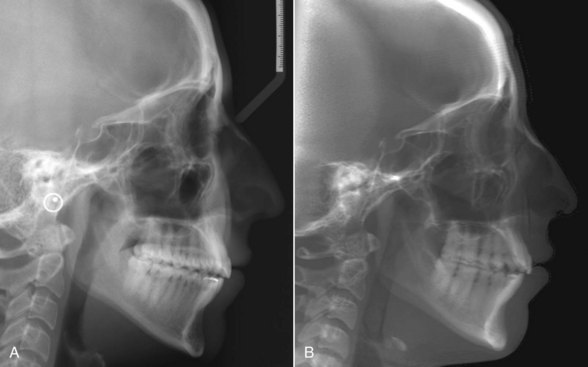
FIGURE 6-60 Comparison of standard cephalometric radiograph (A) and a “synthetic ceph” (B) created from CBCT data for the same individual. Their similarity is apparent; a number of studies have shown that the same measurements used in standard analysis can be used equally well with standard and “synthetic cephs.”
Rather than superimposing on landmarks, a more successful method for 3-D images is to superimpose on the surface of the reference structure instead of the landmarks that are supposed to define it.34 In cephalometric analysis, cranial base superimposition is on sella turcica and the ethmoid triad, usually oriented along the SN line. In 3-D analysis, it is possible to superimpose on the surface of the cranial base (which, like the midline structures, changes very little during the time orthodontic treatment is being done) and view changes in the jaws relative to it. The effect is to superimpose on thousands of points on the surface rather than on a few landmarks.
This magnifies the problem of too much information for easy comprehension. Changes at thousands of points now can be evaluated, but thousands of measurements are orders of magnitude too many. The solution is to display changes as color maps, showing the change at the thousands of points by the intensity of color and the direction of change by the color itself (Figure 6-61).35
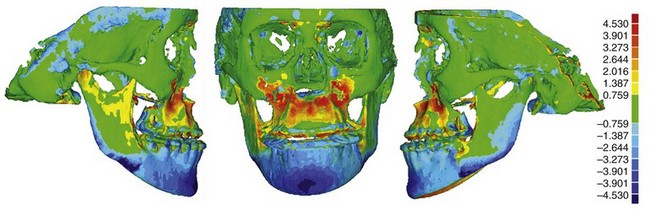
FIGURE 6-61 Color map representing changes between presurgery and postsurgery in a patient who had both maxillary advancement and asymmetric mandibular setback to correct Class III malocclusion. The green color is little or no change; the gradient of red and blue colors displays the amount and direction of change. Red indicates forward movement (toward the viewer in the center image); the more intense the red, the greater the movement, with 4.5 mm the maximum on the scale (displayed on the right side). Blue indicates backward movement (away from the viewer in the center image), with the darkest blue indicating 4.5 mm.
In the earlier growth and development chapters, the use of color maps generated from 3-D superimpositions to show growth changes already has been introduced. Now you are seeing color maps showing changes produced by treatment and will encounter more of these later in this book and in the future orthodontic literature. Using color maps to evaluate change, of course, forces the orthodontist away from the old cephalometric “numbers game” of decisions based on specific measurements, and toward looking at the overall pattern of change. As we have already pointed out, the human brain is an analogue computer, and to really understand digital information, you have to do a mental digital-to-analogue conversion. Color maps make that much easier.
Orthodontic Classification
Classification has traditionally been an important tool in diagnosis and treatment planning. An ideal classification of orthodontic conditions would summarize the diagnostic data and imply the treatment plan. In our concept of diagnosis, classification can be viewed as the (orderly) reduction of the database to a list of the patient’s problems (Figure 6-62).
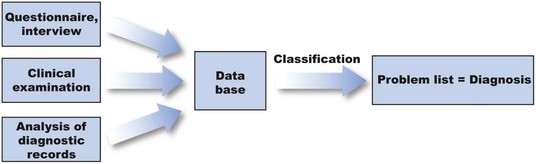
FIGURE 6-62 Conceptually, classification can be viewed as an orderly way to derive a list of the patient’s problems from the database.
Development of Classification Systems
The first useful orthodontic classification, still important now, was Angle’s classification of malocclusion into Classes I, II, and III. The basis of the Angle classification was the relationship of the first molar teeth and the alignment (or lack of it) of the teeth relative to the line of occlusion. Angle’s classification thus created the following four groups:
| Normal occlusion | Normal (Class I) molar relationship, teeth on line of occlusion |
| Class I malocclusion | Normal (Class I) molar relationship, teeth crowded, rotated, etc. |
| Class II malocclusion | Lower molar distal to upper molar, relationship of other teeth to line of occlusion not specified |
| Class III malocclusion | Lower molar mesial to upper molar, relationship of other teeth to line of occlusion not specified |
The Angle system was a tremendous step forward, not only because it provided an orderly way to classify malocclusion but also because for the first time it provided a simple definition of normal occlusion and thereby a way to distinguish normal occlusion from malocclusion.
Almost immediately, it was recognized that the Angle classification was not complete because it did not include important characteristics of the patient’s problem. The deficiencies in the original Angle system led to a series of informal additions at an early stage. A series of subdivisions of Class I were proposed by Martin Dewey, initially Angle’s protégé but later his rival. Gradually, Angle’s classification numbers were extended to refer to four distinct but related characteristics: the classification of malocclusion, as in the original plan; the molar relationship; the skeletal jaw relationship; and the pattern of growth (Figure 6-63). Thus a Class II jaw relationship meant the mandible was positioned distally relative to the maxilla. This was usually found in connection with a Class II molar relationship but occasionally could be present despite a Class I molar relationship. Similarly, a Class II growth pattern was defined as a downward and backward growth direction of the mandible, which would tend to create and maintain Class II jaw and molar relationships. Class I and Class III growth patterns show balanced and disproportionate forward mandibular growth, respectively.
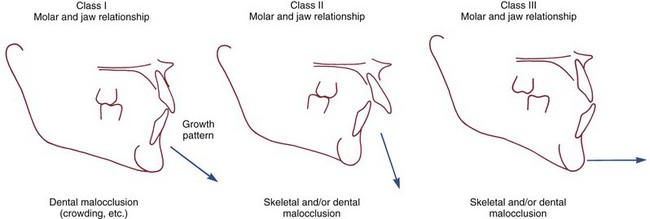
FIGURE 6-63 The Angle classification has come to describe four different things that can be seen on clinical examination, dental casts, and/or cephalograms: the type of malocclusion, the molar relationship, the jaw relationship, and the pattern of growth, as shown here diagrammatically. Although the jaw relationship and growth pattern correlate with the molar relationship, the correlations are far from perfect. It is not unusual to observe a Class I molar relationship in a patient with a Class II jaw relationship or to find that an individual with a Class I molar and jaw relationship grows in a Class III pattern, which ultimately will produce a Class III malocclusion.
In the 1960s, Ackerman and Proffit formalized the system of informal additions to the Angle method by identifying five major characteristics of malocclusion to be considered and systematically described in classification (Figure 6-64). The approach overcame the major weaknesses of the Angle scheme. Specifically, it (1) incorporated an evaluation of crowding and asymmetry within the dental arches and included an evaluation of incisor protrusion, (2) recognized the relationship between protrusion and crowding, (3) included the transverse and vertical, as well as the anteroposterior, planes of space, and (4) incorporated information about skeletal jaw proportions at the appropriate point, that is, in the description of relationships in each of the planes of space. Experience has confirmed that a minimum of five characteristics must be considered in a complete diagnostic evaluation.
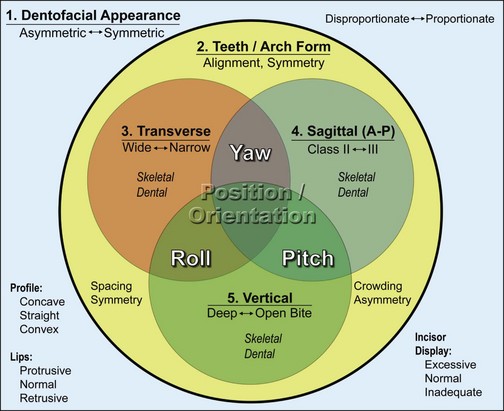
FIGURE 6-64 Ackerman and Proffit represented the five major characteristics of malocclusion via a Venn diagram. The sequential description of the major characteristics, not their graphic representation, is the key to this classification system, but the interaction of the tooth and jaw relationships with facial appearance must be kept in mind. Note that for each characteristic, the items to be evaluated are listed within the box or circle, with a spectrum of potential problems within that area represented by opposing terms (spacing ←→ crowding, symmetry ←→ asymmetry) and items to be evaluated for dentofacial appearance appear separately in the lower part of that field. The circle for each plane of space represents not only the position but also the orientation of jaws and teeth in that plane of space, and the overlaps between the circles representing the three planes of space are labeled for the orientation problem that this interaction could represent.
Although the elements of the Ackerman-Proffit scheme are often not combined exactly as originally proposed, classification by five major characteristics is now widely used. Like other aspects of orthodontic diagnosis, classification is affected by the major changes that have occurred recently such as the development of 3-D imaging and other advances in orthodontic technology. The most important change, however, is the greater emphasis now on evaluating facial soft tissue proportions and the relationship of the dentition to the lips and cheeks, on smile and at rest.
Recent revision of the classification scheme has focused on broadening it to incorporate these new aspects of orthodontic diagnosis. Forty years ago, most orthodontists viewed their role as correcting malocclusion by straightening teeth. At present, the goal of treatment takes into account facial and dental appearance, as well as the relationships of the teeth. Today, evaluation of dentofacial appearance includes full-face evaluation, consideration of anterior tooth display at rest and during smile, and assessment of soft tissues in oblique (three-quarters), as well as frontal and profile, views. Little has changed regarding the description of crowding or spacing within the dental arches, but a clearer understanding of the line of occlusion in relationship to the goals of treatment now is required. The goal of treatment no longer is to just correct malocclusion but to correct it while also bringing the dentition and facial skeleton into normal relationships with the facial and intraoral soft tissues, which means that a more thorough analysis of dentofacial traits is required.
Additions to the Five-Characteristics Classification System
Two things particularly help this more thorough analysis: (1) evaluating the orientation of the esthetic line of the dentition, which is related to but different from Angle’s functional line of occlusion, and (2) supplementing the traditional three-dimensional description of facial and dental relationships with rotational characteristics around each plane of space. Considering these in turn:
1. Esthetic line of the dentition. For over a century, Angle’s line of occlusion has been used to characterize the positions of the teeth within the dental arch and as a reference for assessing arch form and arch symmetry. Angle’s concept was that if the buccal occlusal line of the mandibular dental arch was coincident with the central fossae line of the maxillary dental arch and the teeth were well-aligned, ideal occlusion would result. The line of occlusion is hidden from view when the maxillary and mandibular teeth are in contact.
In modern analysis, another curved line characterizing the appearance of the dentition is important, the one that is seen when evaluating anterior tooth display (Figure 6-65). This line, the esthetic line of the dentition, follows the facial edges of the maxillary anterior and posterior teeth. The orientation of this line, like the orientation of the head and jaws, is best described when the rotational axes of pitch, roll, and yaw are considered in addition to transverse, anteroposterior, and vertical planes of space.
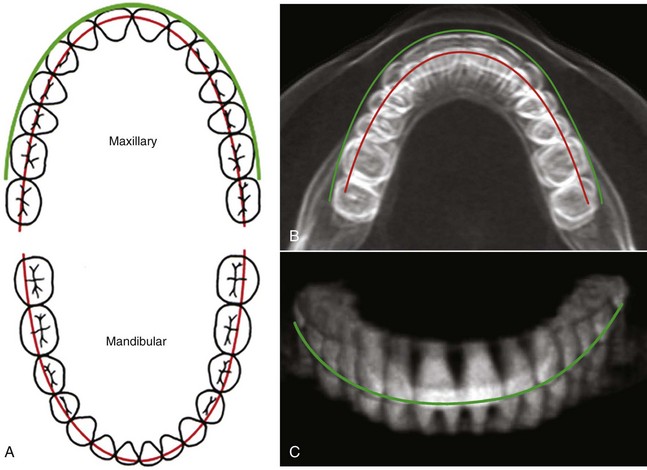
FIGURE 6-65 A, The relationship of the teeth to Angle’s line of occlusion (red) has long been the basis for analysis of dental arch symmetry and crowding. A curved (green) line along the incisal edges and cusp tips of the maxillary teeth, the esthetic line of the dentition, now is used to incorporate tooth-lip relationships into the diagnostic evaluation of tooth positions. B, In vivo submental-vertex CBCT view of an individual with normal occlusion showing the maxillary dentition superimposed on the mandibular dentition as it is in life. For this individual, the teeth are aligned and positioned so that the line of occlusion is almost ideally placed for both arches. If a patient has an asymmetry characterized by rotation of the maxilla, mandible, dentition (or any or all of the above) around the vertical axis, it can be detected in this radiographic projection. The esthetic line of the dentition (green) also can be seen in this projection, drawn as it was in A. C, A cross-sectional “block” of a CBCT image can be manipulated on the computer screen around all three rotational axes. This is simply a different perspective of the image shown in B, on which the esthetic line of the dentition is shown in its relationship to the incisal edges and cusp tips of the upper teeth.
2. Pitch, roll, and yaw in systematic description. A key aspect of our previous classification system was its incorporation of systematic analysis of skeletal and dental relationships in all three planes of space, so that deviations in any direction would be incorporated into the patient’s problem list. A complete description, however, requires consideration of both translation (forward/backward, up/down, right/left) in 3-D space and rotation about three perpendicular axes (pitch, roll, and yaw) (Figure 6-66).36 This is exactly analogous to what would be necessary to describe the position of an airplane in space. The introduction of rotational axes into systematic description of dentofacial traits significantly improves the precision of the description and thereby facilitates development of the problem list.
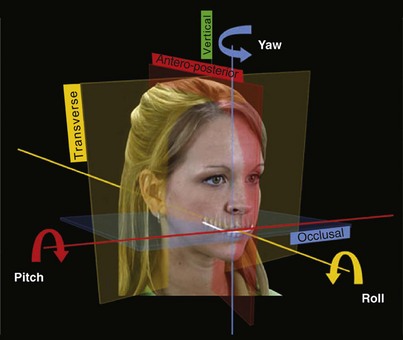
FIGURE 6-66 In addition to relationships in the transverse, anteroposterior, and vertical planes of space used in traditional three-dimensional (3-D) analysis, rotations around axes perpendicular to these planes also must be evaluated. These rotations are pitch, viewed as up-down deviations around the anteroposterior axis; roll, viewed as up-down deviations around the transverse axis; and yaw, viewed as left-right deviations around the vertical axis. The rotations should be evaluated for the jaws and for the esthetic line of the dentition.
Pitch, roll, and yaw of the esthetic line of the dentition is a particularly useful way to evaluate the relationship of the teeth to the soft tissues that frame their display. From this perspective, an excessive upward/downward rotation of the dentition relative to the lips and cheeks would be noted as pitch (up or down, in front or back) (Figure 6-67). Pitch of the dentition relative to the facial soft tissues must be evaluated on clinical examination. Pitch of the jaws and teeth relative to each other and to the facial skeleton also can and should be noted clinically, but this can be confirmed from the cephalometric radiograph in the final classification step, where pitch is revealed as the orientation of the palatal, occlusal, and mandibular planes relative to the true horizontal (see Figure 6-47).
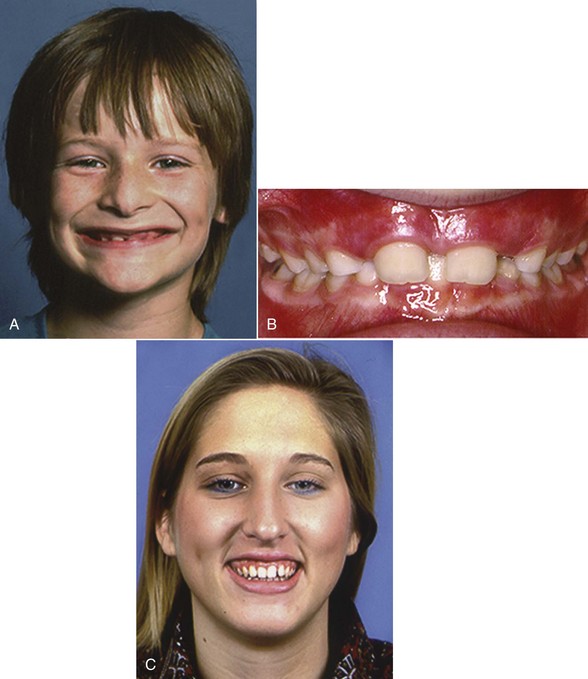
FIGURE 6-67 The vertical relationship of the teeth to the lips and cheeks can be conveniently described as downward or upward translation with no pitch deviation (which is rare), as pitch upward or downward anteriorly and upward or downward posteriorly. The comparison is of the esthetic line of the dentition to the intercommissure line. A and B, Downward pitch of the anterior teeth, so that the lower lip almost completely covers the esthetic line of the dentition on smile. Anterior deep bite usually accompanies a pitch of this type. C, For this girl, who does not have anterior open bite despite her long-face skeletal pattern, the entire dentition is translated down, but a downward pitch posteriorly can be observed clinically. Note that the esthetic line of the dentition tilts down posteriorly relative to the intercommissure line and that there is greater exposure of gingiva posteriorly than anteriorly.
Roll, which is analogous to the banking of an airplane, is described as rotation up or down on one side or the other. On clinical examination, it is important to relate the transverse orientation of the dentition (the esthetic line) to both the facial soft tissues and the facial skeleton. The relationship to the facial soft tissues is evaluated clinically with the intercommissure line as a reference. Neither dental casts nor a photograph using an occlusal plane marker (Fox plane) will reveal this. It is seen with the lips relaxed and more clearly on smile, in both frontal and oblique views (Figure 6-68; also see Figure 6-20). The relationship to the facial skeleton is viewed relative to the interocular line. The use of a Fox plane to mark a cant of the occlusal plane may make it easier to visualize how the dentition relates to the interocular line, but with this device in place it is impossible to see how the teeth relate to the intercommissure line.
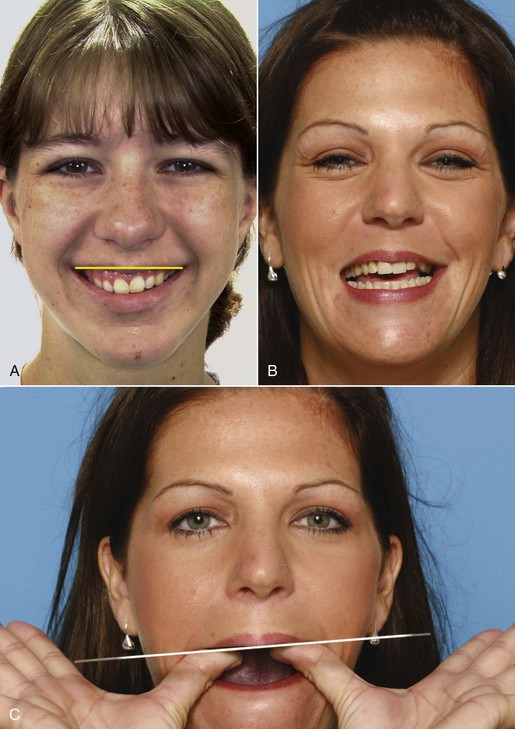
FIGURE 6-68 Roll describes the vertical position of the teeth when this is different on the right and left sides. A, A downward roll of the dentition on the right side, relative to the intercommissure line (yellow). Note that the maxillary incisors tilt to the left. The chin deviates to the left, reflecting asymmetric mandibular growth with lengthening of the mandibular body and ramus on the right side. The vertical position of the gonial angles can be confirmed by palpation. In this case there is a skeletal component to the roll. B, Roll of the dentition down on the right side and slightly up on the left, relative to the intercommissure line. There is no transverse displacement of the chin, but the entire right side of the face is larger—note that the interocular line rolls opposite to the esthetic line of the dentition. C, A Fox plane demonstrates the orientation of the occlusal plane relative to the inter-ocular line, but the relationship of the teeth to the intercommissure line cannot be observed while using it.
Rotation of the jaw or dentition to one side or the other, around a vertical axis, produces a skeletal or dental midline discrepancy that is best described as yaw (Figure 6-69). Yaw of the dentition relative to the jaw, or yaw of the mandible or maxilla that takes the dentition with it, may be present. The effect of yaw, in addition to dental and/or skeletal midline deviations, typically is a unilateral Class II or Class III molar relationship. Extreme yaw is associated with asymmetric posterior crossbites, buccal on one side and lingual on the other. Yaw has been left out of all previous classifications, but characterizing transverse asymmetries in this way makes it easier to accurately describe the relationships.
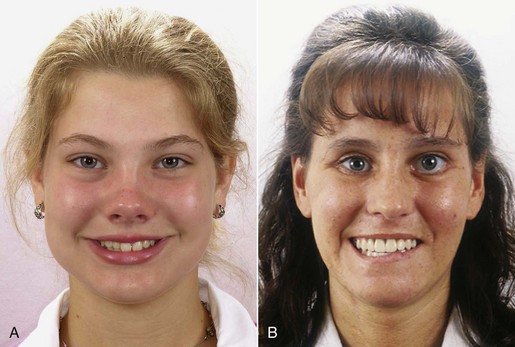
FIGURE 6-69 A, Yaw of the maxillary dentition to the left side is apparent in this girl, who also has slight yaw of the mandible in the same direction. Note that the yaw of the esthetic line of the dentition is greater than the yaw of the chin. In her clinical examination, it will be important to evaluate the relationship of the midline of the mandibular dentition to the chin. A compensatory yaw of the mandibular teeth back toward the skeletal midline often is present in patients with this type of asymmetry. B, Severe yaw of the maxillary dentition to the right in this woman, who has almost no yaw of the mandible. Note that she also has more elevation of the right commissure on smile, so relative to the intercommissure line, she has a downward roll of the dentition on the right. This should be noted in the clinical examination because it will be important to determine whether she considers it a problem.
Dental midline deviations can be just a reflection of displaced incisors because of crowding. This should be differentiated from a yaw discrepancy in which the whole dental arch is rotated off to one side. If a true yaw discrepancy is present, the next question is whether the jaw itself is deviated, or whether the dentition deviates relative to the jaw. A yaw deviation of the maxilla is possible but rare; an asymmetry of the mandible that often includes yaw is present in 40% of patients with deficient or excessive mandibular growth,37 and in these patients the dentition is likely to be deviated in a compensatory direction relative to the jaw. All of this can be detected with a careful clinical examination—and must be because it may not be seen clearly in typical diagnostic records.
Despite these additions to the diagnostic evaluation, dentofacial traits still can be adequately delineated by five major characteristics. The additional items that now must be included in diagnostic evaluation and classification are shown in Box 6-5. Examining the five major characteristics in sequence provides a convenient way of organizing the diagnostic information to be sure that no important points are overlooked.
Classification by the Characteristics of Malocclusion
Step 1: Evaluation of Facial Proportions and Esthetics
Step 1 is carried out during the initial clinical examination, while facial asymmetry, anteroposterior and vertical facial proportions, and lip–tooth relationships (at rest and on smile) are evaluated. The evaluation has been covered earlier in this chapter in the context of macro-, mini- and micro-esthetic considerations. Incorporation of the data into the classification scheme, using axes of rotation in addition to the traditional three planes of space, is described in the previous section. The results are summarized as the positive findings (problems) from this part of the examination. The clinical findings can be checked against the facial photographs and lateral cephalometric radiograph, which should confirm the clinical judgment.
Step 2: Evaluation of Alignment and Symmetry Within the Dental Arches
Step 2 is carried out by examining the dental arches from the occlusal view, evaluating first the symmetry within each dental arch and second the amount of crowding or spacing present. Space analysis quantifies crowding or spacing, but these figures must be interpreted in the light of other findings in the total evaluation of the patient. A major point is the presence or absence of excessive incisor protrusion, which cannot be evaluated without knowledge of lip separation at rest. For that reason, the dentofacial relationships noted in the initial clinical examination must be considered immediately along with the relationship of the teeth to the line of occlusion.
Step 3: Evaluation of the Transverse Plane of Space
At this stage, the casts are brought into occlusion and the occlusal relationships are examined, beginning with the transverse (posterior crossbite) plane of space. The objectives are to accurately describe the occlusion and to distinguish between skeletal and dental contributions to malocclusion. Now the evaluation is primarily of the dental casts and radiographs, but it must be kept in mind that both roll and yaw of the jaws and dentition affect dentofacial transverse relationships. These factors should have been noted in Step 1 of classification and can be confirmed in this step.
Posterior crossbite is described in terms of the position of the upper molars (Figure 6-70). Thus a bilateral maxillary lingual (or palatal) crossbite means that the upper molars are lingual to their normal position on both sides, whereas a unilateral mandibular buccal crossbite would mean that the mandibular molars were buccally positioned on one side. This terminology specifies which teeth (maxillary or mandibular) are displaced from their normal position.
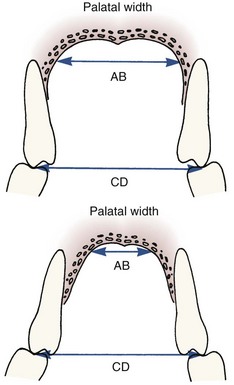
FIGURE 6-70 Posterior crossbite can be either dental, as in a patient with adequate palatal width (i.e., distance AB approximately equals distance CD), or skeletal because of inadequate palatal width (i.e., distance CD is considerably larger than distance AB). Because it shows the palate, you can see both dental and skeletal width on a maxillary cast.
It is also important to evaluate the underlying skeletal relationships to answer the question, “Why does this crossbite exist?” in the sense of the location of the anatomic abnormality. If a bilateral maxillary palatal crossbite exists, for instance, is the basic problem that the maxilla itself is narrow, thus providing a skeletal basis for the crossbite, or is it that the dental arch has been narrowed although the skeletal width is correct?
The width of the maxillary skeletal base can be seen by the width of the palatal vault on the casts. If the base of the palatal vault is wide, but the dentoalveolar processes lean inward, the crossbite is dental in the sense that it is caused by a distortion of the dental arch. If the palatal vault is narrow and the maxillary teeth lean outward but nevertheless are in crossbite, the problem is skeletal in that it basically results from the narrow width of the maxilla. Just as there are dental compensations for skeletal deformity in the anteroposterior and vertical planes of space, the teeth can compensate for transverse skeletal problems, tipping facially or lingually if the skeletal base is narrow or wide respectively.
Transverse displacement of the lower molars on the mandible is rare, so the question of whether the mandibular arch is too wide can be used both to answer the question of whether the mandible or maxilla is at fault in a posterior crossbite and to implicate skeletal mandibular development if the answer is positive. Tabulated data for normal molar and canine widths are shown in Table 6-10. If there is a crossbite and measurements across the arch show that the mandible is wide while the maxillary arch is normal, a skeletal mandibular discrepancy probably is present.
TABLE 6-10
Arch Width Measurements*
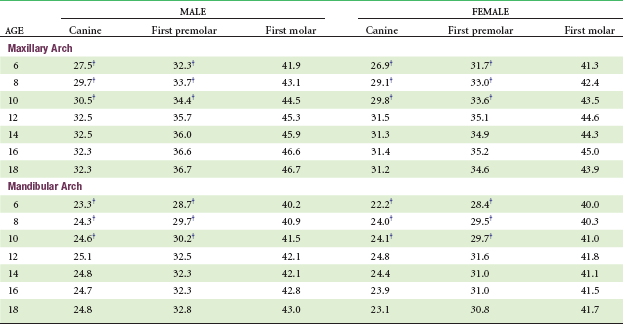
*Millimeter distance between centers of teeth.
†Primary predecessor.
Data from Moyers RE, et al: Standards of Human Occlusal Development. Monograph 5, Craniofacial Growth Series. Ann Arbor, Mich: University of Michigan, Center for Human Growth and Development; 1976.
Step 4: Evaluation of the Anteroposterior Plane of Space
Examining the dental casts in occlusion will reveal any anteroposterior problems in the buccal occlusion or in the anterior relationships. The Angle classification, in its extended form, describes this well.
It is important to ask whether an end-to-end, Class II or Class III buccal segment relationship, or excessive overjet or reverse overjet of the incisors, is caused by a jaw (skeletal) discrepancy, displaced teeth on well-proportioned jaws (dental Class II or III), or a combination of skeletal and dental displacement. Deficient or excessive jaw growth almost always produces an occlusal discrepancy as well, but if the jaw discrepancy is the cause, the problem should be described as a skeletal Class II or Class III. The terminology simply means that the skeletal or jaw relationship is the cause of the Class II dental occlusion. The distinction between dental and skeletal is important because the treatment for a skeletal Class II relationship in a child or adult will be different from treatment for a dental Class II problem. Cephalometric analysis is needed to be precise about the nature of the problem. The object is to accurately evaluate the underlying anatomic basis of the malocclusion (Figure 6-71).
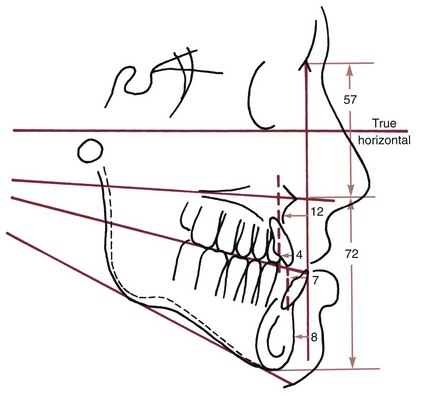
FIGURE 6-71 Cephalometric analysis combining elements of the measurement approaches presented earlier. A description in words of this patient’s problems would be that the maxilla is quite deficient relative to the mandible and the cranial base, but the maxillary teeth are reasonably well related to the maxilla. The mandible is fairly well related in the anteroposterior plane of space to the cranial base, but the mandibular teeth protrude relative to the mandible. Vertical proportions are good. A summary of this type, not a table of measurements, is needed for adequate diagnosis.
Occasionally, the molar occlusion is Class II on one side and Class I on the other. Angle called this a Class II subdivision right or left, depending on which was the Class II side. In modern classification, the subdivision label rarely is useful because it does not describe the real problem. The asymmetric molar relationship reflects either an asymmetry within one or both the dental arches (typically due to loss of space when one primary second molar was lost prematurely) or a yaw discrepancy of the jaw or dentition. These must be distinguished and should already have been addressed in the first or second steps in the classification procedure.
Step 5: Evaluation of the Vertical Plane of Space
With the casts in occlusion, vertical problems can be described as anterior open bite (failure of the incisor teeth to overlap), anterior deep bite (excessive overlap of the anterior teeth), or posterior open bite (failure of the posterior teeth to occlude, unilaterally or bilaterally). As with all aspects of malocclusion, it is important to ask, “Why does the open bite (or other problem) exist?” Since vertical problems, particularly anterior open bite, can result from environmental causes or habits, the “why” in this instance has two important components: at what anatomic location is the discrepancy and can a cause be identified?
It is obvious that if the posterior teeth erupt a normal amount but the anterior teeth do not, there will be a pitch discrepancy of the line of occlusion and the esthetic line of the dentition. This would result in two related problems: an anterior open bite and less than the normal display of the maxillary anterior teeth. Upward pitch anteriorly of the maxillary dentition is possible but rarely is the major reason for an anterior open bite. Instead, anterior open bite patients usually have at least some excessive eruption of maxillary posterior teeth. If the anterior teeth erupt a normal amount but the posterior teeth erupt too much, anterior open bite is inevitable. In this case, the relationship of the anterior teeth to the lips would be normal, and there would be excessive display of the posterior teeth. The line of occlusion and the esthetic line of the dentition then would be pitched down posteriorly.
This leads to an important but sometimes difficult concept: a patient with a skeletal open bite will usually have an anterior bite malocclusion that is characterized by excessive eruption of posterior teeth, downward rotation of the mandible and maxilla, and normal (or even excessive) eruption of anterior teeth (Figure 6-72). This facial and dental pattern often is referred to as the “long-face syndrome,” and some patients with this problem do not have an anterior open bite.
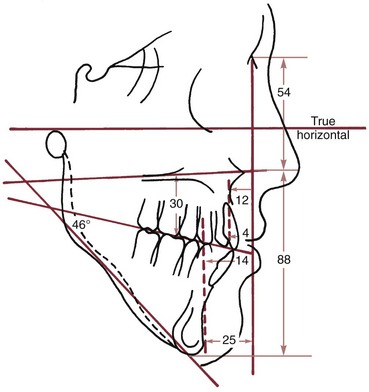
FIGURE 6-72 Cephalometric analysis for a patient with severe vertical problems. Note that the Sassouni lines clearly indicate the skeletal open bite pattern and that the measurements confirm both long anterior facial dimensions and severe mandibular deficiency related to downward and backward rotation of the mandible. Measurement of the distance from the upper first molar mesial cusp to the palatal plane confirms that excessive eruption of the upper molar has occurred.
The reverse is true in a short-face, skeletal deep bite relationship (Figure 6-73). In that circumstance, one would expect to see a normal amount of eruption of incisor teeth but rotation of both jaws in the opposite direction and insufficient eruption of the posterior teeth. The skeletal component is revealed by the rotation of the jaws, reflected in the palatal and mandibular plane angles. If the angle between the mandibular and palatal planes is low, there is a skeletal deep bite tendency (i.e., a jaw relationship that predisposes to an anterior deep bite, regardless of whether one is present). Similarly, if the mandibular-palatal angle is high, there is a skeletal open bite tendency.
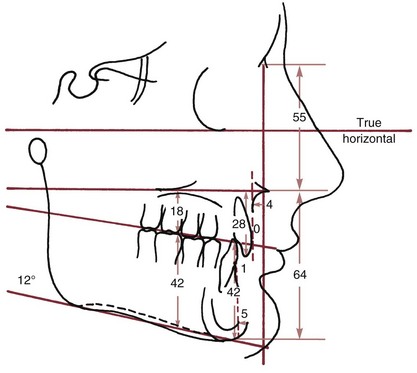
FIGURE 6-73 Cephalometric analysis of a patient with short anterior vertical dimensions. The measurements show excessive eruption of the lower molar compared with the upper molar and document the distal displacement of the lower incisor relative to the mandible. Note that the Sassouni planes are almost parallel, confirming the skeletal deep bite tendency.
It is important to remember that if the mandibular plane angle is unusually flat or steep, correcting an accompanying deep bite or open bite may require an alteration in the vertical position of posterior teeth so that the mandible can rotate to a more normal inclination. Cephalometric analysis is required for evaluation of patients with skeletal vertical problems, again with the goal of accurately describing skeletal and dental relationships. As the tracings in this chapter illustrate, most measurement analyses do a much better job of identifying anteroposterior than vertical problems.
A careful clinical evaluation of the relationship of the dentition to the soft tissues also is critically important. Open bites and deep bites can result from almost any combination of skeletal and dental components, and the problem is likely to include improper tooth–lip relationships. Careful analysis is required if the approach to treatment is to be esthetic and stable.
Development of a Problem List
If positive findings from a systematic description of the patient are recorded (i.e., if the procedure previously described is used), the automatic and important result is a list of the patient’s problems. The step-by-step procedure is designed to ensure that the important distinctions have been made and that nothing has been overlooked.
The problem list often includes two types of problems: (1) those relating to disease or pathologic processes and (2) those relating to disturbances of development that have created the patient’s malocclusion (Figure 6-74). The set of developmental abnormalities related to malocclusion is the orthodontic problem list. A developmental problem is just that (e.g., mandibular deficiency), not the findings that indicate its presence (e.g., weak chin, increased facial convexity, and increased ANB angle all are findings, not problems).
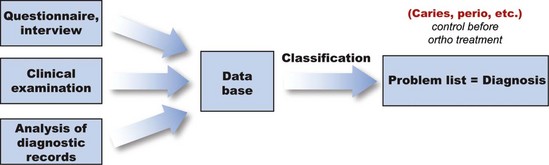
FIGURE 6-74 As a final step in diagnosis, the patient’s problems related to pathology should be separated from the developmental problems, so that the pathology can be brought under control before orthodontic treatment begins.
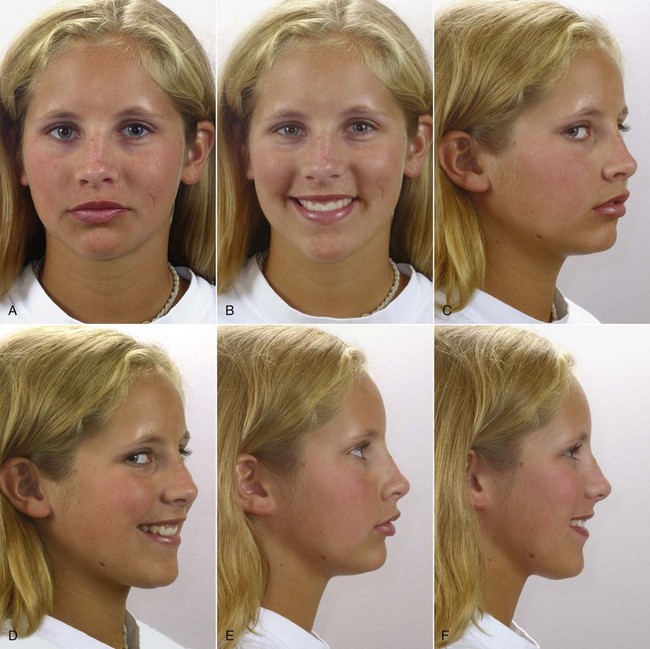
FIGURE 6-75 A to F, Patient F.P., age 12-3, facial views prior to treatment. Note the mildly short anterior face height, lack of mandibular projection, and the appearance of the maxillary incisors on smile (very upright with short clinical crowns but minimal gingival display).
For efficient clinical application of the method, it is important to group different aspects of the same thing into a single major problem area related to the Ackerman-Proffit classification. This means that it would be impossible for a patient to have more than five major developmental problems, though several subproblems within a major category would be quite possible. For instance, lingual position of the lateral incisors, labial position of the canines, and rotation of the central incisors all are problems, but they can and should be lumped under the general problem of incisor crowding/malalignment. Similarly, anterior open bite, rotation of the maxilla down posteriorly and rotation of the mandible down anteriorly, and extreme lip incompetence are all aspects of skeletal open bite. Where possible, the problems should be indicated quantitatively or at least classified as mild, moderate, or severe (e.g., 5 mm mandibular incisor crowding, severe mandibular deficiency).
The initial diagnostic records for a patient with moderately severe orthodontic problems, whose primary reason for treatment was improvement of her dental and facial appearance, are shown in Figures 6-75 to 6-78 and the steps in developing a problem list are illustrated in Boxes 6-6 to 6-9. Similar diagnostic workups for patients with more severe problems are briefly reviewed in Chapters 18 and 19.
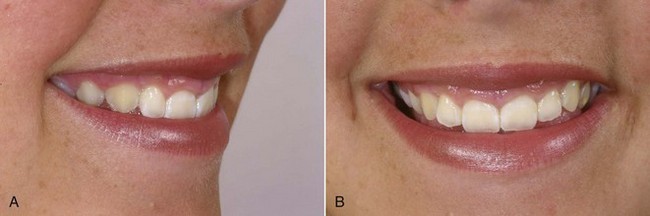
FIGURE 6-76 A and B, Patient F.P., age 12-3. Close-up views of the smile can be a valuable part of the diagnostic records when dental and facial appearance is an important consideration in developing a treatment plan. For this patient, the short clinical crowns coupled with almost no display of the gingiva should be noted in the problem list. Note that the oblique smile view allows an excellent view of these characteristics.
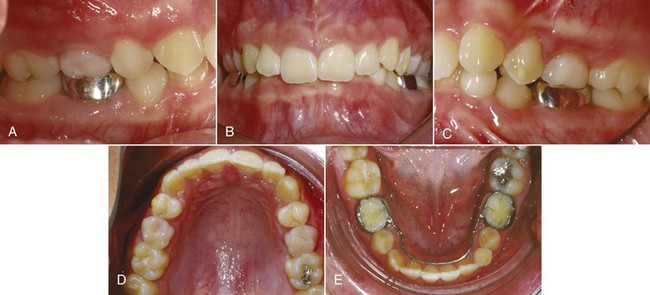
FIGURE 6-77 A to E, Patient F.P., age 12-3, intraoral views prior to treatment. There is moderate maxillary incisor crowding, with the midline off due to displacement of the maxillary incisors. The maxillary incisors are tipped lingually, there is minimal overjet despite Class II buccal segments, and overbite is excessive. A pediatric dentist had placed a lingual arch to maintain alignment of the lower incisors.
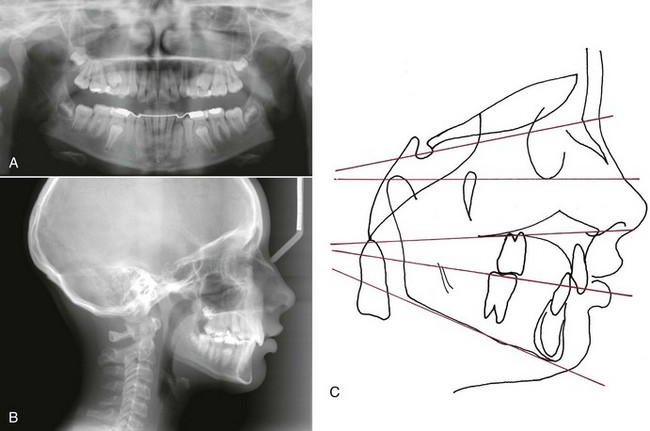
FIGURE 6-78 Patient F.P., age 12-3, panoramic (A) and cephalometric (B) radiographs prior to treatment. C, Cephalometric tracing prior to treatment. To assist in visualization of skeletal and dental relationships, drawing this set of horizontal and vertical reference lines and evaluating relationships relative to the true horizontal line and perpendiculars to it is recommended. Note that mandibular deficiency is the major contributor to her Class II malocclusion, and that the deep overbite is primarily due to excessive eruption of the lower incisors. The maxillary incisors are tipped lingually, which is the reason that overjet is not excessive despite the skeletal Class II relationship and the Class II molar relationship.
With the completion of a problem list, the diagnostic phase of diagnosis and treatment planning is completed, and the more subjective process of treatment planning begins. Thorough diagnostic evaluation means that all problems have been identified and characterized at this stage, omitting nothing of significance. The steps in treatment planning and the outcome of treatment for the patient above are presented at the end of Chapter 7 in Boxes 7-1 to 7-7 and Figures 7-41 to 7-44.
References
1. Deicke, M, Pancherz, H. Is radius-union an indicator for completed facial growth? Angle Orthod. 2005;75:295–299.
2. Hoekema, A, Stegnenga, B, Wiljkstra, PJ, et al. Obstructive sleep apnea therapy. J Dent Res. 2008;87:882–887.
3. Okeson, JP. Management of Temporomandibular Disorders and Occlusion, 6th ed. St. Louis: Mosby-Elsevier; 2008.
4. Tsao, D. A dedicated system for processing faces. Science. 2006;314:72–73.
5. Farkas, LG. Anthropometry of the Head and Face in Medicine, 2nd ed. New York: Raven Press; 1994.
6. Berneburg, M, Dietz, K, Niederle, C, et al. Changes in esthetic standards since 1940. Am J Orthod Dentofac Orthop. 2010;137:450.e1–450.e9. [discussion 450-451].
7. Kokich, VO, Jr., Kiyak, HA, Shapiro, PA. Comparing the perception of dentists and lay people to altered dental esthetics. J Esthet Dent. 1999;11:311–324.
8. Ker, AJ, Chan, R, Fields, HW, et al. Esthetic and smile characteristics from the layperson’s perspective: a computer-based survey study. J Am Dent Assoc. 2008;139:1318–1327.
9. Dickens, ST, Sarver, DM, Proffit, WR. Changes in frontal soft tissue dimensions of the lower face by age and gender. World J Orthod. 2002;3:313–320.
10. Parekh, S, Fields, HJW, Rosenstiel, S, et al. Attractiveness of variations in the smile arc and buccal corridor space as judged by orthodontists and laymen. Angle Orthod. 2006;76:612–618.
11. Springer, NC, Chang, C, Fields, HW, et al. Smile esthetics from the patients’ perspective. Am J Orthod Dentofac Orthop. 2011;139:e91–e101.
12. Chang, C, Springer, NC, Fields, HW, et al. Smile esthetics from patients’ perspective for faces of varying attractiveness. Am J Orthod Dentofac Orthop. 2011;140:e171–e180.
13. Sharma N, Rosenstiel SR, Fields HW, et al. Layperson’s esthetics and smile characterization between Caucasian and Indian populations. J Prosthetic Dent (in press).
14. McLeod, C, Fields, HW, Hechter, F, et al. Esthetics and smile characteristics evaluated by laypersons: a comparison of Canadian and US data. Angle Orthod. 2011;81:198–205.
15. Hollender, AM, Anderson, Q, Kartha, K, et al. Research diagnostic criteria for temporomandibular disorders (RDC/TMD): development of image analysis criteria and examiner reliability for image analysis. Oral Surg Oral Med Oral Pathol Oral Radiol Endod. 2009;107:844–860.
16. Grauer, D, Cevidanes, LH, Tyndall, D, et al. Registration of orthodontic digital models. In: McNamara JA, Jr., Hatch N, Kapila SD, eds. Effective and Efficient Orthodontic Tooth Movement. Monograph 48, Craniofacial Growth Series. Ann Arbor, Mich: University of Michigan, Department of Orthodontics and Pediatric Dentistry and Center for Human Growth and Development, 2011.
17. Kantor, ML, Norton, LA. Normal radiographic anatomy and common anomalies seen in cephalometric films. Am J Orthod Dentofac Orthop. 1987;91:414–426.
18. Riolo, ML, et al. An Atlas of Craniofacial Growth, Monograph 2, Craniofacial Growth Series. Ann Arbor, Mich: University of Michigan, Center for Human Growth and Development; 1974.
19. Popovich, F, Thompson, GW. Craniofacial templates for orthodontic case analysis. Am J Orthod. 1977;71:406–420.
20. Broadbent, BH, Sr., Broadbent, BH, Jr., Golden, WH. Bolton Standards of Dentofacial Developmental Growth. St. Louis: Mosby; 1975.
21. Jacobson, A. Radiographic Cephalometry: From Basics to Videoimaging. Chicago: Quintessence; 1995.
22. Athanasiou, AE. Orthodontic Cephalometry. Chicago: Mosby; 1995.
23. Cooke, MS. Five-year reproducibility of natural head posture: a longitudinal study. Am J Orthod Dentofac Orthop. 1990;97:487–494.
24. Lundstrom, A, Lundstrom, F, Lebret, LM, et al. Natural head position and natural head orientation: basic considerations in cephalometric analysis. Eur J Orthod. 1995;17:111–120.
25. Anderson, G, Fields, HW, Beck, FM, et al. Development of cephalometric norms using a unified facial and dental approach. Angle Orthod. 2006;76:612–618.
26. Faustini, MM, Hale, C, Cisneros, GJ. Mesh diagram analysis: developing a norm for African Americans. Angle Orthod. 1997;67:121–128.
27. Haney, E, Gansky, SA, Lee, JS, et al. Comparative analysis of traditional radiographs and cone-beam computed tomography volumetric images in the diagnosis and treatment planning of maxillary impacted canines. Am J Orthod Dentofac Orthop. 2010;137:590–597.
28. Molen, AD. Comparing cone-beam computed tomography systems from an orthodontic perspective. Sem Orthod. 2011;17:34–38.
29. Cevidanes, LH, Alhadidi, A, Paniagua, B, et al. 3D quantification of mandibular asymmetry. Oral Surg Oral Med Oral Pathol Oral Radiol Endod. 2011;111:757–770.
30. Proffit, WR, White, RP, Jr., Sarver, DM. Contemporary Treatment of Dentofacial Deformity. St Louis: Mosby; 2003.
31. Hennekam, RCM, Krantz, ID, Allanson, JE. Gorlin’s Syndromes of the Head and Neck, 5th ed. New York: Oxford University Press; 2010.
32. Grauer, D, Cevidanes, LS, Styner, MA, et al. Accuracy and landmark error calculation using CBCT-generated cephalograms. Angle Orthod. 2010;80:286–294.
33. Grauer, D, Cevidanes, LH, Proffit, WR. Working with DICOM craniofacial images. Am J Orthod Dentofac Orthop. 2009;136:460–470.
34. Cevidanes, LH, Styner, MA, Proffit, WR. Image analysis and superimposition of 3-D cone-beam CT models. Am J Orthod Dentofac Orthop. 2006;129:611–618.
35. Cevidanes, LH, Bailey, LJ, Tucker, SF, et al. Three-dimensional cone-beam computed tomography for assessment of mandibular changes after orthognathic surgery. Am J Orthod Dentofac Orthop. 2007;131:44–50.
36. Ackerman, J, Proffit, WR, Sarver, DM, et al. Pitch, roll and yaw: describing the spatial orientation of dentofacial traits. Am J Orthod Dentofac Orthop. 2007;131:305–310.
37. Severt, TR, Proffit, WR. The prevalence of facial asymmetry in the dentofacial deformities population at the University of North Carolina. Int J Adult Orthod Orthogn Surg. 1997;12:171–176.