Chapter 9 Diffusion of respiratory gases
 For gas to transfer between the alveolus and the haemoglobin in the red blood cell it must diffuse across the alveolar and capillary walls, through the plasma and across the red cell membrane. The reaction rate for oxygen with haemoglobin also affects the rate at which red blood cells become saturated with oxygen on passing through the pulmonary capillary.
The previous chapters have described in detail how alveolar gases and pulmonary capillary blood are delivered to their respective sides of the alveolar wall. This chapter deals with the final step of lung function by discussing the transfer of respiratory gases between the alveolus and blood.
Nomenclature in this field is confusing. In Europe, measurement of the passage of gases between the alveoli and pulmonary capillaries is referred to as lung ‘transfer factor’ (e.g. Tlco represents lung transfer factor for carbon monoxide). However, the older term ‘diffusing capacity’ (e.g. Dlco for lung diffusing capacity for carbon monoxide) which has been used for many years in the USA is now the recommended term1 despite the fact that some of the barrier to oxygen transfer is unrelated to diffusion (see below).
Fundamentals of the Diffusion Process
Diffusion of a gas is a process by which a net transfer of molecules takes place from a zone in which the gas exerts a high partial pressure to a zone in which it exerts a lower partial pressure. The mechanism of transfer is the random movement of molecules and the term excludes both active biological transport and transfer by mass movement of gas in response to a total pressure difference (i.e. gas flow as occurs during tidal ventilation). The partial pressure (or tension) of a gas in a gas mixture is the pressure which it would exert if it occupied the space alone (equal to total pressure multiplied by fractional concentration). Gas molecules pass in each direction but at a rate proportional to the partial pressure of the gas in the zone from which they are leaving. The net transfer of the gas is the difference in the number of molecules passing in each direction, and is thus proportional to the difference in partial pressure between the two zones. Typical examples of diffusion are shown in Figure 9.1.
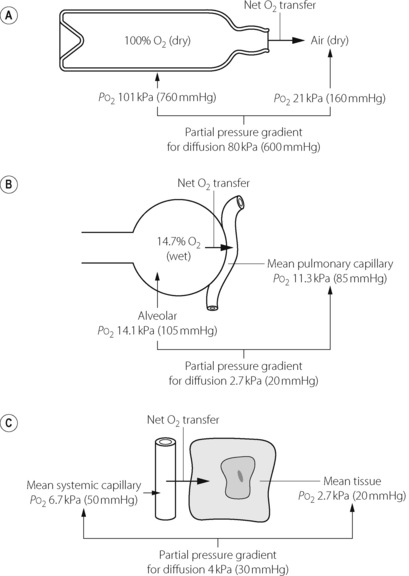
Fig. 9.1 Three examples of diffusion of oxygen. In each case there is a net transfer of oxygen from left to right in accord with the partial pressure gradient. (A) Oxygen passes from one gaseous phase to another. (B) Oxygen passes from a gaseous phase to a liquid phase. (C) Oxygen passes from one liquid to another.
In each of the examples shown in Figure 9.1, there is a finite resistance to the transfer of the gas molecules. In Figure 9.1A, the resistance is concentrated at the restriction in the neck of the bottle. Clearly, the narrower the neck, the slower will be the process of equilibration with the outside air. In Figure 9.1B, the site of the resistance to diffusion is less circumscribed but includes gas diffusion within the alveolus, the alveolar/capillary membrane, the diffusion path through the plasma, and the delay in combination of oxygen with the reduced haemoglobin in the red blood cell (RBC). In Figure 9.1C, the resistance commences with the delay in the release of oxygen by haemoglobin, and includes all the interfaces between the RBC membrane and the site of oxygen consumption in the mitochondria. There may then be an additional component in the rate at which oxygen enters into chemical reactions.
In the living body oxygen is constantly being consumed, while carbon dioxide is being produced, so equilibrium cannot be attained as in the case of the open bottle of oxygen in Figure 9.1A. Instead, a dynamic equilibrium is attained with diffusion down a gradient between the alveolus and the mitochondria for oxygen and the reverse for carbon dioxide. The maintenance of these partial pressure gradients is, in fact, a characteristic of life.
In the case of gases that are not metabolised to any great extent, such as nitrogen and most inhalational anaesthetic agents, there is always a tendency towards a static equilibrium at which all tissue partial pressures become equal to the partial pressure of the particular gas in the inspired air. This occurs with nitrogen and would also be attained with an inhalational anaesthetic agent if it were administered for a very long time.
Quantification of Resistance to Diffusion
The propensity of a gas to diffuse as a result of a given pressure gradient is known as its diffusing capacity according to the equation:
The usual biological unit of diffusing capacity is ml.min−1.mmHg−1 or, in SI units, ml.min−1.kPa−1.
Small molecules diffuse more easily than large molecules. Graham’s law states that the rate of diffusion of a gas is inversely proportional to the square root of its density. In addition, gases also diffuse more readily at higher temperatures. Apart from these factors, inherent in the gas, the resistance to diffusion is related directly to the length of the diffusion path and inversely to the area of interface that is available for diffusion.
Diffusion of Gases in Solution
The partial pressure of a gas in solution in a liquid is defined as being equal to the partial pressure of the same gas in a gas mixture that is in equilibrium with the liquid. When a gas is diffusing into or through an aqueous phase, the solubility of the gas in water becomes an important factor, and the diffusing capacity under these circumstances is considered to be directly proportional to the solubility. Nitrous oxide would thus be expected to have about 20 times the diffusing capacity of oxygen in crossing a gas–water interface. High solubility does not confer an increased ‘agility’ of the gas in its negotiation of an aqueous barrier, but simply means that, for a given partial pressure, more molecules of the gas are present in the liquid.
Partial pressure versus concentration gradients. Non-gaseous substances in solution diffuse in response to concentration gradients. This is also true for gas mixtures at the same total pressure, when the partial pressure of any component gas is directly proportional to its concentration. This is not the case when a gas in solution in one liquid diffuses into a different liquid in which it has a different solubility coefficient. When gases are in solution, the partial pressure they exert is directly proportional to their concentration in the solvent but inversely to the solubility of the gas in the solvent. Thus, if water and oil have the same concentration of nitrous oxide dissolved in each, the partial pressure of nitrous oxide in the oil will be only one-third of the partial pressure in the water since the oil/water solubility ratio is about 3:1. If the two liquids are shaken up together, there will be a net transfer of nitrous oxide from the water to the oil until the tension in each phase is the same. At that time the concentration of nitrous oxide in the oil will be about three times the concentration in the water. There is thus a net transfer of nitrous oxide against the concentration gradient, but always with the partial pressure gradient. It is therefore useful to consider partial pressure rather than concentrations in relation to movement of gases and vapours from one compartment of the body to another. The same units of pressure may be used in gas, aqueous and lipid phases.
Diffusion of Oxygen in the Lungs
It is now widely accepted that oxygen passes from the alveoli into the pulmonary capillary blood by a passive process of diffusion according to physical laws, though for a while it was believed that oxygen was actively secreted into the blood (page 242). It is believed that diffusion equilibrium is very nearly achieved for oxygen during the normal pulmonary capillary transit time in the resting subject. Therefore, in these circumstances, the uptake of oxygen is limited by pulmonary blood flow and not by diffusing capacity. However, when exercising, while breathing gas mixtures deficient in oxygen or at reduced barometric pressure, the diffusing capacity becomes important and may limit oxygen uptake.
Components of the Alveolar/Capillary Diffusion Pathway
The gas space within the alveolus. At functional residual capacity, the diameter of the average human alveolus is of the order of 200 μm (page 20), and it is likely that mixing of normal alveolar gas is almost instantaneous over the small distance from the centre to the periphery. Precise calculations are impossible on account of the complex geometry of the alveolus, but the overall efficiency of gas exchange within the lungs suggests that mixing must be complete within less than 10 ms. Therefore, in practice it is usual to consider alveolar gas of normal composition as uniformly mixed.
This generalisation does not seem to hold when subjects inhale gases of widely different molecular weights. This was first demonstrated in normal subjects inhaling mixtures of sulphur hexafluoride (SF6) and helium when the SF6 concentration was found to be higher (relative to helium) earlier in the breath.2 According to Graham’s law SF6 (molecular weight 146), would diffuse six times less readily than helium (molecular weight 4) and would therefore tend to remain concentrated at the core of the alveolus. A similar problem is seen with inhaled anaesthetic agents, for example a large proportion of the end expiratory/arterial partial pressure gradient for the anaesthetic isoflurane (molecular weight 184.5) cannot be explained by alveolar dead space or shunt and may be due to failure to achieve uniformity within the alveolus.3 Nevertheless, it seems unlikely that non-uniformity within a single alveolus is an important factor limiting diffusing capacity under normal conditions with gases such as oxygen, nitrogen and carbon dioxide, which have molecular weights that are not greatly different.
Alveolar lining fluid. Alveoli contain a thin layer of surfactant rich fluid (page 218) through which respiratory gases must diffuse.4 The depth of this fluid layer, and therefore its impediment to diffusion, is very variable. There are ‘pools’ of fluid in alveolar corners (see Figure 2.8) and in the depressions between where the capillaries bulge into the alveolus, with only a very thin layer on the surface of the capillary bulges, thus providing the minimal diffusion barrier in the most vital area.
Tissue barrier. Electron microscopy reveals details of the actual path between alveolar gas and pulmonary capillary blood, shown in Figure 2.7. Each alveolus is lined with epithelium which, with its basement membrane, is about 0.2 μm thick, except where epithelial cell nuclei bulge into the alveolar lumen. Beyond the basement membrane is the interstitial space, which is very thin where it overlies the capillaries, particularly on the active side; elsewhere it is thicker and contains collagen and elastic fibres. The pulmonary capillaries are lined with endothelium, also with its own basement membrane, which is approximately the same thickness as the alveolar epithelium, except where it is expanded to enclose the endothelial cell nuclei. The total thickness of the active part of the tissue barrier is thus about 0.5 μm, containing two pairs of lipid bilayers separated by the interstitial space.
Plasma layer. Human pulmonary capillaries are estimated to have a mean diameter of 7 μm, similar to the diameter of a RBC, part of which is therefore forced into contact with the endothelial cell surface (see Figure 2.7). The diffusion path through plasma may therefore be very short indeed, but only a small proportion of the RBC surface will be in such close proximity with the endothelium, much of the RBC passing through the middle of the capillary, up to 3.5 μm from the endothelial cell. Furthermore, since the diameter of the capillary is about 14 times the thickness of the tissue barrier, it is clear that the diffusion path within the capillary is likely to be much longer than the path through the alveolar/capillary membrane. A complex pattern of diffusion gradients is therefore established within the plasma depending on the oxygen tension in the alveolus and the number of RBCs present.5 This is discussed in more detail below with respect to carbon monoxide.
Diffusion into and within the RBC.6 Confining haemoglobin within the RBC reduces the oxygen diffusing capacity by 40% in comparison with free haemoglobin solution.7 There are three possible explanations for this observation. First, there is evidence that the rapid uptake of O2 and CO by RBCs causes depletion of gas in the plasma layer immediately surrounding the RBC.8 Referred to as the ‘unstirred layer’, this phenomenon is most likely to occur at low packed cell volume (PCV) when adjacent RBCs in the pulmonary capillary have more plasma between them.9 Secondly, oxygen must diffuse across the RBC membrane, though this is not normally believed to be a significant diffusion barrier. Thirdly, once in the cell, oxygen must diffuse through a varying amount of intracellular fluid before combining with haemoglobin, a process that is aided by mass movement of the haemoglobin molecules caused by the deformation of the RBC as it passes through the capillary bed, in effect ‘mixing’ the oxygen with the haemoglobin.
RBCs change shape as they pass through capillaries (both pulmonary and systemic) and this plays an important role in the uptake and release of oxygen.6 The dependence of diffusing capacity on RBC shape changes may result from reducing the unstirred layer by ‘mixing’ the plasma around the RBC, from changes in the cell membrane surface area to RBC volume ratio or from assisting the mass movement of haemoglobin within the cell. This has led to further studies in which the deformability of RBCs is reduced (using chlorpromazine) or increased (using sodium salicylate), which have demonstrated that diffusing capacity is increased with greater RBC deformability.9 Of more clinical significance is the effect of plasma cholesterol on RBC function.10 Elevated cholesterol concentration in the plasma causes increased cholesterol in the RBC membrane, a change that is known to make the membrane thicker and less deformable, both of which lead to reduced efficiency of diffusion across the membrane. Oxygen uptake by RBCs in the lung, and its release in the tissues, are both believed to be significantly impaired by hypercholesterolaemia, particularly in tissues with high oxygen extraction ratios such as the heart.
Uptake of oxygen by haemoglobin. The greater part of the oxygen that is taken up in the lungs enters into chemical combination with haemoglobin. This chemical reaction takes a finite time and forms an appreciable part of the total resistance to the transfer of oxygen.11 This important discovery resulted in an extensive reappraisal of the whole concept of diffusing capacity. In particular, it became clear that measurements of ‘diffusing capacity’ did not necessarily give an indication of the degree of permeability of the alveolar/capillary membrane.
Quantification of the Diffusing Capacity for Oxygen
The diffusing capacity of oxygen is simply the oxygen uptake divided by the partial pressure gradient from alveolar gas to pulmonary capillary blood where the relevant tension is the mean pulmonary capillary Po2:
The alveolar Po2 can be derived with some degree of accuracy (page 140) but there are very serious problems in estimating the mean pulmonary capillary Po2.
The mean pulmonary capillary Po2. It is clearly impossible to make a direct measurement of the mean Po2 of the pulmonary capillary blood, and therefore attempts have been made to derive this quantity indirectly from the presumed changes of Po2 that occur as blood passes through the pulmonary capillaries.
The earliest analysis of the problem was made by Bohr in 1909.12 He made the assumption that, at any point along the pulmonary capillary, the rate of diffusion of oxygen was proportional to the Po2 difference between the alveolar gas and the pulmonary capillary blood at that point. Using this approach, and assuming a value for the alveolar/pulmonary end-capillary Po2 gradient, it seemed possible to construct a graph of capillary Po2, plotted against the time the blood had been in the pulmonary capillary. A typical curve drawn on this basis is shown as the broken line in Figure 9.2A. Once the curve has been drawn, it is relatively easy to derive the mean pulmonary capillary Po2, which then permits calculation of the oxygen diffusing capacity. The validity of the assumption of the alveolar/pulmonary end-capillary Po2 gradient is considered below.
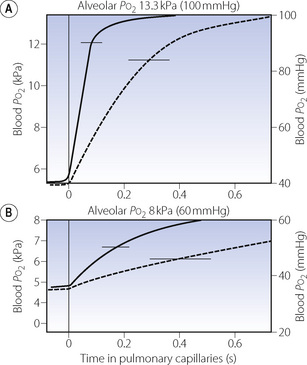
Fig. 9.2 Each graph shows the rise in blood Po2 as blood passes along the pulmonary capillaries. The horizontal line at the top of the graph indicates the alveolar Po2 that the blood Po2 is approaching. In (A) the subject is breathing air, while in (B) the subject is breathing about 14% oxygen. The broken curve shows the rise in Po2 calculated according to the Bohr procedure on an assumed value for the alveolar/end-capillary Po2 gradient. The continuous curve shows the values obtained by forward integration.13 Horizontal bars indicate mean pulmonary capillary Po2 calculated from each curve.
Unfortunately this approach, known as the Bohr integration procedure, was shown to be invalid when it was found that the fundamental assumption was untrue. The rate of transfer of oxygen is not proportional to the alveolar/capillary Po2 gradient at any point along the capillary. It would no doubt be true if the transfer of oxygen were a purely physical process but the rate of transfer is actually limited by the chemical combination of oxygen with haemoglobin, which is sufficiently slow to comprise a major part of the total resistance to transfer of oxygen.
Studies in vitro of the rate of combination of oxygen with haemoglobin have shown that this is not directly proportional to the Po2 gradient, for two distinct reasons:
 Hb4(O2)4) has a much higher velocity constant than that of the combination of the other three molecules. This is discussed further on page 190.
When these two factors are combined it is found that the resistance to ‘diffusion’ due to chemical combination of oxygen within the RBC is fairly constant up to a saturation of about 80% (Po2 = 6 kPa or 45 mmHg). Thereafter, it falls very rapidly to become zero at full saturation. In view of these findings the Bohr integration procedure was elaborated to allow for changes in the rate of combination of haemoglobin with oxygen.13 Assuming traditional values for the alveolar/end-capillary Po2 difference, the resulting curve lies well to the left of the original Bohr curve as shown by the continuous curve in Figure 9.2A. This indicated a mean pulmonary capillary Po2 greater than had previously been believed, and therefore an oxygen diffusing capacity that was substantially greater than the accepted value. The situation is actually more complicated still, as quick-frozen sections of lung show that the colour of haemoglobin begins to alter to the red colour of oxyhaemoglobin within the pulmonary arterioles before the blood has even entered the pulmonary capillaries. Furthermore, pulmonary capillaries do not cross a single alveolus but may pass over three or more.
Both the classic and the modified Bohr integration procedures for calculation of mean capillary Po2 depended critically on the precise value of the pulmonary end-capillary Po2. The constructed curve (Figure 9.2A) and therefore the derived mean capillary Po2 were considerably influenced by very small variations in the value that was assumed. The ‘ideal’ alveolar/arterial Po2 difference could be measured, but the problem was to separate this into its two components, the ‘ideal’ alveolar/pulmonary end-capillary Po2 difference (due to diffusion block) and the pulmonary end-capillary/arterial Po2 difference (due to venous admixture). Figure 8.8 will make this clear. Ingenious attempts were made to resolve the alveolar/arterial Po2 gradient into its two components,14 but these failed to produce results that were compatible with observed diffusing capacity, mainly because of the lack of appreciation of the part played by the reaction times of oxygen with haemoglobin.
Forward integration.15 This involved a new and entirely opposite approach based on the new understanding of the kinetics of the combination of oxygen with haemoglobin (see above) and the pattern of blood flow through the pulmonary capillaries. Starting at the arterial end of the pulmonary capillaries, the Po2 of the capillary blood is calculated progressively along the capillary until an estimate is obtained of the remaining alveolar/capillary Po2 gradient at the end of the capillary. This procedure of forward integration was thus the reverse of the classic approach which, starting from the alveolar/end capillary Po2 gradient, worked backwards to see what was happening along the capillary.
Forward integrations gave important results suggesting that alveolar/end capillary Po2 gradients were very much smaller than had previously been thought. For example when breathing air, the gradient was always less than 0.0001 kPa, and only when exercising and breathing low inspired oxygen concentrations did the gradient become significant.
Capillary Transit Time16
Capillary transit time is a most important factor determining both the pulmonary end-capillary Po2 and the diffusing capacity. It will be seen from Figure 9.2A that, if the capillary transit time is reduced below 0.25 s, there will be an appreciable gradient between the alveolar and end-capillary Po2. Because the diffusion gradient from alveolar gas to mean pulmonary capillary blood will be increased, the oxygen diffusing capacity must be decreased.
The mean pulmonary capillary transit time equals the pulmonary capillary blood volume divided by the pulmonary blood flow (approximately equal to cardiac output). This gives a normal time of the order of 0.8 s with a subject at rest. However, because of difficulties measuring pulmonary capillary blood volume and many other methodological problems, there appears to be a wide range of values on either side of the mean with estimates varying from 0.1 s to 3 s. It is therefore likely that, in a similar fashion to ventilation and perfusion, there is a wide range of normal capillary transit times affected by many factors such as posture, lung volume, cardiac output etc. Blood from capillaries with the shortest time will yield desaturated blood and this will not be compensated by blood from capillaries with longer than average transit times, for the reason shown in Figure 8.13.
Diffusion of Carbon Dioxide in the Lungs
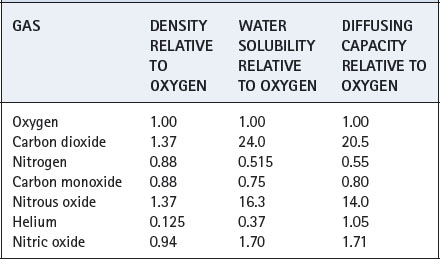
Carbon dioxide has a much higher water solubility than oxygen and, although its vapour density is greater, it may be calculated to penetrate an aqueous membrane about 20 times as rapidly as oxygen (Table 9.1). Therefore it was formerly believed that diffusion problems could not exist for carbon dioxide because the patient would have succumbed from hypoxia before hypercapnia could attain measurable proportions. All of this ignored the fact that chemical reactions of the respiratory gases were sufficiently slow to affect the measured ‘diffusing capacity’, and in fact were generally the limiting factor in gas transfer. The carriage of carbon dioxide in the blood is discussed in Chapter 10, but for the moment it is sufficient to note the essential reactions in the release of chemically combined carbon dioxide:
Table 9.1 The influence of physical properties on the diffusion of gases through a gas-liquid interface
The latter reaction involves the movement of bicarbonate ions across the RBC membrane, but its rate is probably limited by the dehydration of carbonic acid. This reaction would be very slow indeed if it were not catalysed by carbonic anhydrase, which is present in abundance in the RBC and also on the endothelium. The important limiting role of the rate of this reaction was elegantly shown in a study of the effect of inhibition of carbonic anhydrase on carbon dioxide transport. This resulted in a large increase in the arterial/alveolar Pco2 gradient, corresponding to a gross decrease in the apparent ‘diffusing capacity’ of carbon dioxide.17
Equilibrium of carbon dioxide is probably very nearly complete within the normal pulmonary capillary transit time. However, even if it were not so, it would be of little significance since the mixed venous/alveolar Pco2 difference is itself quite small (about 0.8 kPa or 6 mmHg). Therefore an end-capillary gradient as large as 20% of the initial difference would still be too small to be of any importance and, indeed, could hardly be measured by modern analytical methods.
Hypercapnia is, in fact, never caused by decreased ‘diffusing capacity’, except when carbonic anhydrase is completely inhibited by drugs such as acetazolamide (page 161). Pathological hypercapnia may always be explained by other causes, usually alveolar ventilation that is inadequate for the metabolic rate of the patient.
The assumption that there is no measurable difference between the Pco2 of the alveolar gas and the pulmonary end-capillary blood is used when the alveolar Pco2 is assumed equal to the arterial Pco2 for the purpose of derivation of the ‘ideal’ alveolar Po2 (page 139). The assumption is also made that there is no measurable difference between end-capillary and arterial Pco2. We have seen in the previous chapter (Table 8.2) that this is not strictly true and a large shunt of 50% will cause an arterial/end-capillary Pco2 gradient of about 0.4 kPa.
Diffusion of Carbon Monoxide in the Lungs
Diffusing capacity is usually measured for carbon monoxide, for the very practical reason that affinity of carbon monoxide for haemoglobin is so high that the partial pressure of the gas in the pulmonary capillary blood remains effectively zero. The formula for calculation of this quantity then simplifies to the following:
(compare with corresponding equation for oxygen, page 149).
There are no insuperable difficulties in the measurement of either of the remaining quantities on the right-hand side of the equation, and the methods are outlined at the end of the chapter. Traditional units for CO diffusing capacity are ml.min−1.mmHg−1, though in SI units the volume of CO is usually described in molar terms, i.e. mmol.min−1.kPa−1.
Measurement of the carbon monoxide diffusing capacity is firmly established as a valuable routine pulmonary function test, which may show changes in a range of conditions in which other pulmonary function tests yield normal values. It provides an index that shows that something is wrong, and changes in the index provide a useful indication of progress of the disease. It is also used as an epidemiological tool for assessing lung function in seemingly healthy subjects.18 However, it is much more difficult to explain a reduced diffusing capacity for carbon monoxide in terms of the underlying pathophysiology (see below).
The Diffusion Path for Carbon Monoxide
Diffusion of carbon monoxide within the alveolus, through the alveolar/capillary membrane and through the plasma into the RBC is governed by the same factors that apply to oxygen and these have been outlined above. The quantitative difference is due to the different vapour density and water solubility of the two gases (Table 9.1). These factors indicate that the rate of diffusion of oxygen up to the point of entry into the RBC is 1.25 times the corresponding rate for carbon monoxide.
Diffusion of CO in plasma. The frequent use of carbon monoxide for measurement of lung diffusing capacity has focused attention on the diffusion pathway for CO, which, in spite of the slight differences in the physical properties of CO and oxygen, are likely to be very similar in vivo. Clearly, direct measurement of diffusion gradients in a pulmonary capillary is not possible, so attempts to elucidate the diffusion pattern of gases in capillary plasma are based on mathematical models. The most recent analysis assumed that there is a gradient of CO concentration within the capillary, with minimal CO in the centre, and used a ‘finite element analysis’ to show that diffusion paths for CO are likely to be non-linear.5 Figure 9.3 shows a theoretical drawing of the CO flux in the capillary at both high and low haematocrit, showing clearly that except in severe anaemia CO uptake is achieved long before diffusion to the centre of the capillary is able to take place. In spite of these detailed models, agreement with observed CO diffusion remains poor under most situations.5
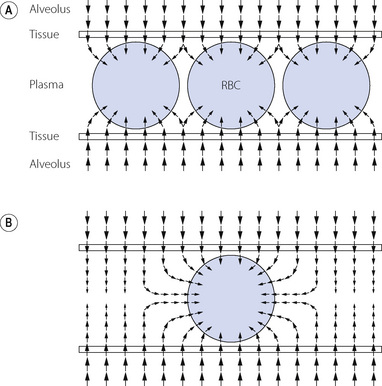
Fig. 9.3 Mathematical model of diffusion paths for CO between the alveolus and the red blood cell (RBC). The size and direction of the arrows indicates the magnitude and direction of the CO flux respectively. The RBC is assumed to be an infinite ‘sink’ for CO. (A) Normal. Packed cell volume 66%, under which conditions CO is absorbed by the RBC mainly at the periphery of the capillary. (B) Severe anaemia. Packed cell volume 12%. Diffusion occurs into the centre of the plasma and follows a non-linear path into the RBC. The thickness of the tissue barrier relative to capillary diameter is drawn to scale, showing the relatively small contribution that the alveolar capillary membrane makes to the diffusion barrier in total.
(After reference 5.)
Uptake of Carbon Monoxide by Haemoglobin19
The affinity of haemoglobin for carbon monoxide is about 250 times as great as for oxygen. Nevertheless, it does not follow that the rate of combination of carbon monoxide with haemoglobin is faster than the rate of combination of oxygen with haemoglobin: it is, in fact, rather slower. The reaction is slower still when oxygen must first be displaced from haemoglobin according to the equation:

Therefore the reaction rate of carbon monoxide with haemoglobin is reduced when the oxygen saturation of the haemoglobin is high. The inhalation of different concentrations of oxygen thus causes changes in the reaction rate of carbon monoxide with the haemoglobin of a patient, an observation that has been utilised to study different components of the resistance to diffusion of carbon monoxide in humans.
Quantification of the Components of the Resistance to Diffusion of Carbon Monoxide
When two resistances are arranged in series, the total resistance of the pair is equal to the sum of the two individual resistances. Diffusing capacity is analogous to conductance, which is the reciprocal of resistance. Therefore, the reciprocal of the diffusing capacity of the total system equals the sum of the reciprocals of the diffusing capacities of the two components.
In theory, diffusing capacity of carbon monoxide in the blood includes diffusion across the plasma, red cell membrane, diffusion within the red cell, and the chemical combination of CO with haemoglobin. However in vivo, as in the case of oxygen, the reaction rate of CO with haemoglobin is a significant factor. This ‘diffusing capacity’ for blood is equal to the product of the pulmonary capillary blood volume (Vc) and the rate of reaction of carbon monoxide with haemoglobin (θco), a parameter which varies with the oxygen saturation of the haemoglobin. The equation may now be rewritten:
The usual symbols for representation of this equation are as follows:
The term Dm is often described simply as membrane diffusing capacity. Dmco equals 0.8 Dmo2under similar conditions (see Table 9.1).
The total diffusing capacity for carbon monoxide is a routine clinical measurement and is described at the end of this chapter: θco may be determined, at different values of oxygen saturation, by studies in vitro. This leaves two unknowns –the diffusing capacity through the alveolar/capillary membrane and the pulmonary capillary blood volume. By repeating the measurement of total diffusing capacity at different arterial oxygen saturations (obtained by inhaling different concentrations of oxygen) it is possible to obtain two simultaneous equations with two unknowns which may then be solved to obtain values for Dmco and pulmonary capillary blood volume. Measurement of pulmonary capillary blood volume by this technique yields normal values between 60–110 ml (depending on subject height),20 which agrees well with a morphometric estimate of about 100 ml.
Factors Affecting ‘Diffusing Capacity’
The basic principles of pulmonary diffusion described so far indicate that there are three major mechanisms by which diffusing capacity may alter: changes in the effective surface area of the gas exchange membrane, a change in the physical properties of the membrane, or changes related to the uptake of gases by the RBC. Each of these mechanisms will be discussed individually, and then other factors that affect diffusion capacity by either multiple or unknown mechanisms will be described.
Most of the factors outlined in this section will apply equally to oxygen and CO diffusion, though the majority have been studied using CO for the reasons described in the previous section.
Factors Influencing Diffusing Capacity by Changes in Membrane Surface Area
Total lung volume, and therefore the number of alveoli available for gas exchange, will clearly affect diffusing capacity. However, only those alveoli that are adequately ventilated and perfused will contribute to gas exchange, and the scatter of ventilation/perfusion therefore has an important influence on the diffusing capacity.
Body size. Stature influences diffusing capacity directly due to the relationship between height and lung volume. Normal values for total diffusing capacity may be calculated from the formulae:20


A healthy 30-year-old male 1.78 m tall would therefore have a CO diffusing capacity of 11.5 mmol.min−1.kPa−1 (34.4 ml.min.−1mmHg−1).
Lung volume. Diffusing capacity is directly related to lung volume and so maximal at total lung capacity.21 Different techniques for the measurement of diffusing capacity use different lung volumes, so it is now standard practice to simultaneously measure ‘alveolar volume’ (lung volume at which diffusing capacity was measured) by inert gas dilution, usually with helium or methane. Diffusing capacity can then be measured as diffusing capacity per litre alveolar volume, referred to as the diffusion constant (Kco), with units of mmol.min−1.kPa−1.l−1 (ml.min.−1mmHg−1.l−1).
Ventilation/perfusion mismatch results in a physiological dysfunction that presents many of the features of a reduction in diffusing capacity. If, for example, most of the ventilation is distributed to the left lung and most of the pulmonary blood flow to the right lung, then the effective interface must be reduced. Minor degrees of maldistribution greatly complicate the interpretation of a reduced diffusing capacity. Both maldistribution and impaired diffusing capacity have a similar effect on the alveolar/arterial Po2 gradient in relation to inspired oxygen concentration (Figure 8.14), and a distinction cannot be made by simple means.
Posture. Diffusing capacity is substantially increased when the subject is supine rather than standing or sitting, in spite of the fact that lung volume is reduced.20 This change is probably explained by the increase in pulmonary blood volume, and the more uniform distribution of perfusion of the lungs in the supine position.
Pathology. The total area of the alveolar/capillary membrane may be reduced by any disease process or surgery that removes a substantial number of alveoli. For example emphysema reduces the diffusing capacity mainly by destruction of alveolar septa such that DLco correlates with the anatomical degree of emphysematous changes in the lung.22
Factors Influencing the Membrane Diffusion Barrier
‘Alveolar/capillary block’ is a term used in the past to describe a syndrome characterised by reduced lung volume, reasonably normal ventilatory capacity, hyperventilation and normal arterial Po2 at rest, but with desaturation on exercise. These patients had reduced diffusing capacity that was believed to be due to an impediment at the alveolar/capillary membrane itself, which might either be thickened or have its permeability to gas transfer reduced by some chemical abnormality. Evidence for such a mechanism was never found, and it now seems likely that most of the patients thought to have alveolar/capillary block actually had hypoxaemia as a result of disturbances in distribution of ventilation and/or perfusion.
It will be clear that the oxygen diffusing capacity may be influenced by many factors that are really nothing at all to do with diffusion per se. In fact, there is considerable doubt as to whether a true defect of alveolar/capillary membrane diffusion is ever the limiting factor in transfer of oxygen from the inspired gas to the arterial blood.
Chronic heart failure and pulmonary oedema remain the only likely causes of a membrane diffusion barrier. This may occur either via pulmonary capillary congestion increasing the length of the diffusion pathway for oxygen through plasma, by interstitial oedema increasing the thickness of the membrane, or by raised capillary pressure damaging the endothelial and epithelial cells leading to proliferation of type II alveolar cells and thickening of the membrane. The membrane component of diffusing capacity (Dm) is reduced in heart failure, and the reduction correlates with symptom severity, whilst capillary volume increases only in severe heart failure.23 It is therefore possible that with heart failure of a suitable severity over a prolonged period a form of ‘alveolar/capillary block’ can occur.
Factors Related to Uptake of Gases by Haemoglobin
Haemoglobin concentration affects diffusing capacity by influencing the rate and amount of oxygen or CO uptake by blood flowing through the pulmonary capillary. Measurements of diffusing capacity are therefore usually mathematically corrected to account for abnormalities in the patient’s haemoglobin concentration.20
Decreased capillary transit time. In the section above, it has been explained how a reduction in capillary transit time may reduce the diffusing capacity. The mean transit time is reduced when cardiac output is raised and this may increase diffusing capacity substantially, for example during exercise (see below).
Other Determinants of Diffusing Capacity
Age. Even when corrected for changes in lung volume, Dlco declines in a linear fashion with increasing age (see above).21
Sex. Women have a reduced total pulmonary diffusing capacity in comparison with men. This difference is almost totally explained by differences in stature and haemoglobin concentration.18 Dlco in women varies throughout the menstrual cycle reaching a peak prior to menstruation, and seems to result from changes in θ, the reaction rate of CO with blood. The finding may however represent a technical problem with measuring Dlco in that the low value during menstruation could result from a high endogenous production of carboxyhaemoglobin during the catabolism of haem compounds.24
Exercise. During exercise diffusing capacity may be double the value obtained at rest, as a result of increased cardiac output causing a reduction in capillary transit time and pulmonary capillary recruitment in non-dependent lung zones (page 103). Because of this large effect of cardiac output on the measurement of diffusing capacity, some groups advocate using simultaneous non-invasive measures of cardiac output to aid interpretation of the diffusing capacity result.25 Paradoxically, hypoxaemia from diffusion limitation during exercise is more common among elite, trained athletes than the average individual.16 Physiological changes in exercise are discussed in Chapter 15.
Racial origin. In a study in the US of over 4000 healthy individuals, Dlco was significantly lower in black subjects compared with white.18 The reasons for this are not clear.
Smoking history affects diffusing capacity even when most of the other determinants listed in this section are taken into account. Dlco is reduced in proportion to the number of cigarettes per day currently smoked, and the total lifetime number of cigarettes ever smoked.18 The causes of this decline in lung function with smoking are discussed in Chapter 21.
Diffusion of Gases in the Tissues
Oxygen26,27
Oxygen leaves the systemic capillaries by the reverse of the process by which it entered the pulmonary capillaries. Chemical release from haemoglobin is followed by diffusion through the capillary wall and thence through the tissues to its site of utilisation in the mitochondria.
Krogh, in 1919, was the first to describe the factors that influence the diffusion of oxygen through tissues,28 and his ideas developed into the first mathematical model to quantify the transfer of oxygen from the capillaries into the tissues (Figure 9.4).29 In Krogh’s model, an individual capillary is assumed to be surrounded by a cylindrical area of tissue that derives its oxygen from the single capillary under consideration. There is a non-linear gradient in Po2 along the length of the capillary, referred to as the axial or longitudinal gradient, from a maximum at the arteriolar end of the capillary to a minimum at the venule. This curve is an inverted form of the oxy-haemoglobin dissociation curve (see Figure 11.9) between oxygen saturation values of 100% and 75%. At each point along the capillary there is a further non-linear radial Po2 gradient where the oxygen diffuses across the capillary wall and surrounding tissues to its site of use in the mitochondria of the cells in the tissue cylinder. Using this model, a theoretical value for the Po2 at any point in the tissue cylinder can be calculated using the Krogh–Erlang equation.29 Although Krogh’s model did not include axial diffusion within the tissues, this is also believed to occur.29 With axial gradients along the capillary and in the tissue, and radial gradients throughout, Po2 is always minimal at the outer edge of the tissue cylinder at the venous end of the capillary, a region referred to as the ‘lethal corner’. The concept of the Krogh cylinder makes no pretence to histological accuracy but it does illustrate the difficulty of talking about the ‘mean tissue Po2’, which is not an entity like the arterial or mixed venous Po2.
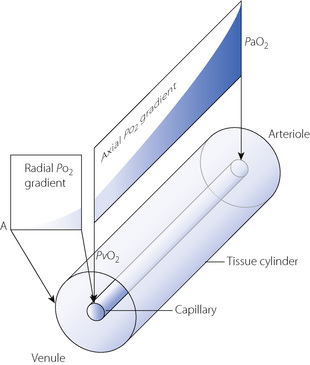
Fig. 9.4 Schematic representation of the Krogh model of tissue oxygenation. See text for details. Point A is the ‘lethal corner’, or tissue region where Po2 will always be the lowest, i.e. at the point furthest away from the venular end of the capillary.
The Krogh model has numerous unrealistic assumptions,29 for example that capillaries are all straight, parallel, of constant length and radius, with no connections between them. Values obtained for tissue Po2 from the Krogh–Erlang equation are therefore only theoretical, and measurement of tissue Po2 on a small enough scale to confirm Krogh’s cylinder model remains impossible. Even so, studies of tissue Po2 have provided some support for Krogh’s model. For example, heterogeneity of tissue Po2 is considerable, with measurements in the kidney cortex showing Po2 values ranging from 0.7 to 11.3 kPa (5.3–85 mmHg).27 Studies of Po2 along the length of individual pial capillaries has demonstrated a non-linear decline in Po2 along the capillary that closely matches the Krogh model.30
Diffusion paths are much longer in tissues than in the lung. In well-vascularised tissue, such as brain, each capillary serves a zone of radius about 20 μm, but the corresponding distance is about 200 μm in skeletal muscle and greater still in fat and cartilage, though in muscle tissue, myoglobin accelerates the rate of transfer of oxygen within the cell.
It is also impracticable to talk about mean tissue Po2 since this varies from one organ to another and must also depend on perfusion in relation to metabolic activity. Furthermore, within a tissue there must be some cells occupying more favourable sites towards the arterial ends of capillaries, while others must accept oxygen from the venous ends of the capillaries, where the Po2 is lower. This is well demonstrated in the liver where the centrilobular cells must exist at a lower Po2 than those at the periphery of the lobule. Even within a single cell, there can be no uniformity of Po2. Not only are there ‘low spots’ around the mitochondria, but those mitochondria in regions of the cell nearest to the capillary presumably enjoy a higher Po2 than those lying further away.
Carbon Dioxide
Little is known about the magnitude of carbon dioxide gradients between the mitochondria and the tissue capillaries. It is, however, thought that the tissue/venous Pco2 gradient can be increased by two methods. The first is by inhibition of carbonic anhydrase, which impairs the uptake of carbon dioxide by the blood. The second is by hyperoxygenation of the arterial blood caused by breathing 100% oxygen at high pressures. If the Po2 of the arterial blood exceeds about 300 kPa (2250 mmHg), the dissolved oxygen will be sufficient for the usual tissue requirements. Therefore there will be no significant amount of reduced haemoglobin, which is more effective than oxyhaemoglobin for carbamino carriage of carbon dioxide. The effect of this on tissue Pco2 is likely to be too small to be clinically significant, and the alternative method of carbon dioxide carriage as bicarbonate seems to be adequate.
Principles of Measurement of Carbon Monoxide Diffusing Capacity20
All the methods are based on the general equation:
In each case it is usual to assume that the mean partial pressure of carbon monoxide in the pulmonary capillary blood ( ) is effectively zero. It is, therefore, only necessary to measure the carbon monoxide uptake (
 ), and the alveolar carbon monoxide tension (Paco). The diffusing capacity so measured (Dco) is the total diffusing capacity including that of the alveolar capillary membrane, plasma and the component due to the reaction time of carbon monoxide with haemoglobin.
The Steady State Method
The subject breathes a gas mixture containing about 0.3% carbon monoxide for about a minute. After this time, expired gas is collected when the alveolar Pco is steady but the mixed venous Pco has not yet reached a level high enough to require consideration in the calculation.
Carbon monoxide uptake (()) is measured in exactly the same way as oxygen consumption by the open method (page 211): the amount of carbon monoxide expired (expired minute volume × mixed expired CO concentration) is subtracted from the amount of carbon monoxide inspired (inspired minute volume × inspired CO concentration). The alveolar Pco is calculated from the Filley version of the alveolar air equation (page 140) using carbon monoxide in place of oxygen.
The steady state method requires no special respiratory manoeuvre and is therefore particularly suitable for use in children.20
The Single-Breath Method1
This method is the most frequently used in clinical practice and has a long history of progressive refinement. There are many variations on the exact method used, which yield broadly similar results,31 but the multitude of techniques and factors affecting the results have led to attempts to standardise the method between centres.1
The patient is first required to exhale maximally. He then draws in a vital-capacity breath of a gas mixture containing about 0.3% carbon monoxide and about 10% helium. The breath is held for 10 s and a gas sample is then taken after the exhalation of the first 0.75 litre, which is sufficient to wash out the patient’s dead space. The breath-holding time is sufficient to overcome maldistribution of the inspired gas.
It is assumed that no significant amount of helium has passed into the blood and, therefore, the ratio of the concentration of helium in the inspired gas to the concentration in the end-expiratory gas, multiplied by the volume of gas drawn into the alveoli during the maximal inspiration, will indicate the total alveolar volume during the period of breath holding. The alveolar Pco at the commencement of breath holding is equal to the same ratio multiplied by the Pco of the inspired gas mixture. The end-expiratory Pco is measured directly.
From these data, together with the time of breath holding, it is possible to calculate the carbon monoxide uptake and the mean alveolar Pco. Lung diffusing capacity for carbon monoxide can then be calculated and normalised for lung volume using the alveolar volume measured at the same time with helium.
The Rebreathing Method
Somewhat similar to the single-breath method is the rebreathing method by which gas mixture containing about 0.3% carbon monoxide and 10% helium is rebreathed rapidly from a bag. The bag and the patient’s lungs are considered as a single system, with gas exchange occurring in very much the same way as during breath holding. The calculation proceeds in a similar way to that for the single-breath method.
References
1. MacIntyre N, Crapo RO, Viegi G, et al. Standardisation of the single-breath determination of carbon monoxide uptake in the lung. Eur Respir J. 2005;26:720-735.
2. Georg G, Lassen NA, Mellemgaard K, Vinther A. Diffusion in the gas phase of the lungs in normal and emphysematous subjects. Clin Sci. 1965;29:525-532.
3. Landon MJ, Matson AM, Royston BD, Hewlett AM, White DC, Nunn JF. Components of the inspiratory-arterial isoflurane partial pressure difference. Br J Anaesth. 1993;70:605-611.
4. Weibel ER, Federspiel WJ, Fryder-Doffey F, et al. Morphometric model for pulmonary diffusing capacity I. Membrane diffusing capacity. Respir Physiol. 1993;93:125-149.
5. Hsia CCW, Chuong CJC, Johnson RL. Critique of conceptual basis of diffusing capacity estimates: a finite element analysis. J Appl Physiol. 1995;79:1039-1047.
6. Sarelius I. Invited editorial on ‘Effect of RBC shape and deformability on pulmonary O2 diffusing capacity and resistance to flow in rabbit lungs’. J Appl Physiol. 1995;78:763-764.
7. Geiser J, Betticher DC. Gas transfer in isolated lungs perfused with red cell suspension or haemoglobin solution. Respir Physiol. 1989;77:31-40.
8. Yamaguchi K, Nguyen-Phu D, Scheid P, Piiper J. Kinetics of O2 uptake and release by human erythrocyte studied by a stopped-flow technique. J Appl Physiol. 1985;58:1215-1224.
9. Betticher DC, Reinhart WH, Geiser J. Effect of RBC shape and deformability on pulmonary O2 diffusing capacity and resistance to flow in rabbit lungs. J Appl Physiol. 1995;78:778-783.
*10. Buchwald H, O’Dea TJ, Menchaca HJ, Michalek VN, Rohde TD. Effect of plasma cholesterol on red blood cell oxygen transport. Clin Exp Pharmacol Physiol. 2000;27:951-955.
11. Staub NC, Bishop JM, Forster RE. Velocity of O2 uptake by human red blood cells. J Appl Physiol. 1961;16:511-516.
12. Bohr C. Über die spezifische Tätigkeit der Lungen bei der respiratorischen Gasaufnahme. Skand Arch Physiol. 1909;22:221.
13. Staub NC, Bishop JM, Forster RE. Importance of diffusion and chemical reaction rates in O2 uptake in the lung. J Appl Physiol. 1962;17:21-27.
14. Riley RL, Lilienthal JL, Proemmel DD, Franke RE. On the determination of the physiologically effective pressures of oxygen and carbon dioxide in alveolar air. Am J Physiol. 1946;147:191-198.
15. Staub NC. Alveolar-arterial oxygen tension gradient due to diffusion. J Appl Physiol. 1963;18:673-680.
16. Wagner PD. Vascular transit times in the lung. J Appl Physiol. 1995;79:380-381.
17. Cain SM, Otis AB. Carbon dioxide transport in anaesthetised dogs during inhibition of carbonic anhydrase. J Appl Physiol. 1961;16:1023-1028.
18. Neas LM, Schwartz J. The determinants of pulmonary diffusing capacity in a national sample of US adults. Am J Respir Crit Care Med. 1996;153:656-664.
19. Reeves RB, Park HK. CO uptake kinetics of red cells and CO diffusing capacity. Respir Physiol. 1992;88:1-21.
20. Cotes JE, Chinn DJ, Miller MR. Lung function. Physiology, measurement and application in medicine. Oxford: Blackwell Publishing; 2006.
21. Stam H, Hrachovina V, Stijnen T, Versprille A. Diffusing capacity dependent on lung volume and age in normal subjects. J Appl Physiol. 1994;76:2356-2363.
22. Cotton DJ, Sparkar GR, Graham BL. Diffusing capacity in the clinical assessment of chronic airflow limitation. Med Clin North Am. 1996;80:549-564.
23. Puri S, Baker BL, Dutka DP, Oakley CM, Hughes JMB, Cleland JGF. Reduced alveolar-capillary membrane diffusing capacity in chronic heart failure. Circulation. 1995;91:2769-2774.
24. Sansores RH, Abboud RT, Kennell C, Haynes N. The effect of menstruation on the pulmonary carbon monoxide diffusing capacity. Am J Respir Crit Care Med. 1995;152:381-384.
25. Hsia CCW. Recruitment of lung diffusing capacity. Update of concept and application. Chest. 2002;122:1774-1783.
*26. Tsai AG, Johnson PC, Intaglietta M. Oxygen gradients in the microcirculation. Physiol Rev. 2003;83:933-963.
27. Lübbers DW, Baumgärtl H. Heterogeneities and profiles of oxygen pressure in brain and kidney as examples of the pO2 distribution in living tissue. Kidney Int. 1997;51:372-380.
28. Krogh A. The rate of diffusion of gases through animal tissues, with some remarks on the coefficient of invasion. J Physiol (Lond). 1919;52:391-408.
29. Kreuzer F. Oxygen supply to the tissues: the Krogh model and its assumptions. Experientia. 1982;38:1415-1426.
30. Ivanov KP, Sokolova IB, Vovenko EP. Oxygen transport in the rat brain cortex at normobaric hyperoxia. Eur J Appl Physiol. 1999;80:582-587.
31. Beck KC, Offord KP, Scanlon PD. Comparison of four methods for calculating diffusing capacity by the single breath method. Chest. 1994;105:594-600.