Chapter 7 The pulmonary circulation
 Pulmonary blood flow approximates to cardiac output, and can increase several-fold with little change in pulmonary arterial pressure. Passive distension and recruitment of closed pulmonary capillaries, particularly in the upper zones of the lung, allow pulmonary vascular resistance to fall as blood flow increases.
Evolution first led to the development of a separate pulmonary circulation in amphibians, though in this case both systemic and pulmonary circulations are supplied by a single ventricle and there is therefore a great deal of mixing of blood between the two. The occurrence of warm-blooded animals led to a 10-fold increase in oxygen requirements, which may only be achieved through having a pulmonary circulation almost completely separate from the systemic circulation.1
Pulmonary Blood Flow
The flow of blood through the pulmonary circulation is approximately equal to the flow through the whole of the systemic circulation. It therefore varies from about 6 l.min−1 under resting conditions, to as much as 25 l.min−1 in severe exercise. It is remarkable that such an increase can normally be achieved with minimal increase in pressure. Pulmonary vascular pressures and vascular resistance are much less than those of the systemic circulation. Consequently the pulmonary circulation has only limited ability to control the regional distribution of blood flow within the lungs and is markedly affected by gravity, which results in overperfusion of the dependent parts of the lung fields. Maldistribution of the pulmonary blood flow has important consequences for gaseous exchange, and these are considered in Chapter 8.
In fact, the relationship between the inflow and outflow of the pulmonary circulation is much more complicated (Figure 7.1). The lungs receive a significant quantity of blood from the bronchial arteries, which usually arise from the arch of the aorta. Blood from the bronchial circulation returns to the heart in two ways. From a plexus around the hilum, blood from the pleurohilar part of the bronchial circulation returns to the superior vena cava via the azygos veins, and this fraction may thus be regarded as normal systemic flow, neither arising from nor returning to the pulmonary circulation. However, another fraction of the bronchial circulation, distributed more peripherally in the lung, passes through postcapillary anastomoses to join the pulmonary veins, constituting an admixture of venous blood with the arterialised blood from the alveolar capillary networks.
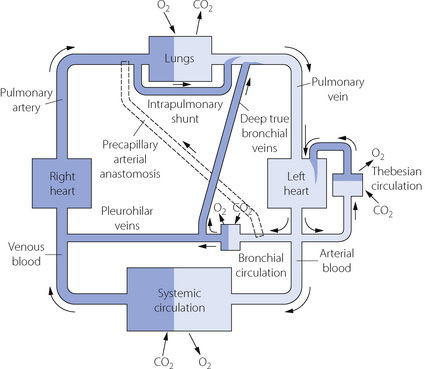
Fig. 7.1 Schema of bronchopulmonary anastomoses and other forms of venous admixture in the normal subject. Part of the bronchial circulation returns venous blood to the systemic venous system while another part returns venous blood to the pulmonary veins and so constitutes venous admixture. Other forms of venous admixture are the Thebesian circulation of the left heart and flow through atelectatic parts of the lungs. It will be clear from this diagram why the output of the left heart must be slightly greater than that of the right heart.
The situation may be further complicated by blood flow through precapillary anastomoses from the bronchial arteries to the pulmonary arteries. These communications (so-called ‘sperr arteries’) have muscular walls and are thought to act as sluice gates, opening when increased pulmonary blood flow is required. Their functional significance in normal subjects is unknown, but in diseased lungs flow through these anastomoses may be crucial. For example, in situations involving pulmonary oligaemia (e.g. pulmonary artery stenosis, pulmonary embolism) blood from the bronchial arteries will flow through the anastomoses to supplement pulmonary arterial flow.2 It should be noted that a Blalock–Taussig shunt operation achieves the same purpose for palliation of patients with cynanotic congenital heart disease.
Pulmonary Blood Volume
As a first approximation the right heart pumps blood into the pulmonary circulation, while the left heart pumps away the blood that returns from the lungs. Therefore, provided that the output of the two sides is the same, the pulmonary blood volume will remain constant. However, very small differences in the outputs of the two sides must result in large changes in pulmonary blood volume if they are maintained for more than a few beats.
Factors Influencing Pulmonary Blood Volume
Posture. Change from the supine to the erect position decreases the pulmonary blood volume by almost one-third, which is about the same as the corresponding change in cardiac output. Both changes result from pooling of blood in dependent parts of the systemic circulation.
Systemic vascular tone. Because the systemic circulation has much greater vasomotor activity than the pulmonary circulation, an overall increase in vascular tone will tend to squeeze blood from the systemic into the pulmonary circulation. This may result from the release of endogenous catecholamines, administration of vasoconstrictor drugs, or from passive compression of the body in a G-suit. The magnitude of the resulting volume shift will depend on many factors such as position, overall blood volume and activity of the numerous humoral and nervous mechanisms controlling pulmonary vascular tone at the time (see below). Conversely, it seems likely that pulmonary blood volume would be diminished when systemic tone is diminished, as for example during sepsis or with regional anaesthesia when systemic vascular resistance is decreased with no effect on the autonomic supply to the pulmonary vasculature.
Pulmonary Vascular Pressures
Pulmonary arterial pressure is only about one-sixth of systemic arterial pressure, although the capillary and venous pressures are not greatly different for the two circulations (Figure 7.2). There is thus only a small pressure drop along the pulmonary arterioles and therefore a reduced potential for active regulation of the distribution of the pulmonary blood flow. This also explains why there is little damping of the arterial pressure wave, and the pulmonary capillary blood flow is markedly pulsatile.
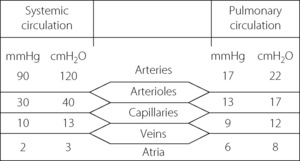
Fig. 7.2 Comparison of typical mean pressure gradients along the systemic and pulmonary circulations. (Mean pressures relative to atmosphere.)
Consideration of pulmonary vascular pressures carries a special difficulty in the selection of the reference pressure. Systemic pressures are customarily measured with reference to ambient atmospheric pressure, but this is not always appropriate when considering the pulmonary arterial pressure, which is relatively small in comparison with the intrathoracic and pulmonary venous pressures. This may be important in two circumstances. First, the extravascular (intrathoracic) pressure may have a major influence on the intravascular pressure and should be taken into account. Secondly, the driving pressure through the pulmonary circulation may be markedly influenced by the pulmonary venous pressure, which must be taken into account when measuring pulmonary vascular resistance. We must therefore distinguish between pressures within the pulmonary circulation expressed in the three different forms listed below. Measurement techniques may be adapted to indicate these pressures directly (Figure 7.3).
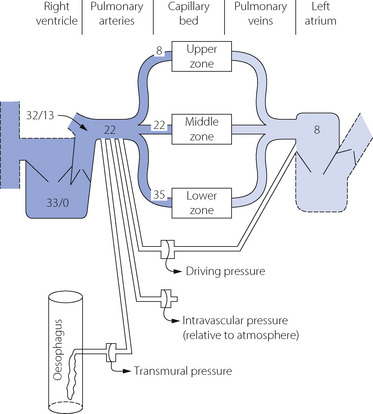
Fig. 7.3 Normal values for pressures in the pulmonary circulation relative to atmospheric (cmH2O). Systolic and diastolic pressures are shown for the right ventricle and pulmonary trunk, and mean pressures elsewhere. Note the effect of gravity on pressures at different levels in the lung fields. Three different manometers are shown connected to indicate driving pressure, intravascular pressure and transmural pressure.
Intravascular pressure is the pressure at any point in the circulation relative to atmosphere. This is the customary way of expressing pressures in the systemic circulation, and is also the commonest method of indicating pulmonary vascular pressures.
Transmural pressure is the difference in pressure between the inside of a vessel and the tissue surrounding the vessel. In the case of the larger pulmonary vessels, the outside pressure is the intrathoracic pressure (commonly measured as the oesophageal pressure, as shown in Figure 7.3). This method should be used to exclude the physical effect of major changes in intrathoracic pressure.
Driving pressure is the difference in pressure between one point in the circulation and another point downstream. The driving pressure of the pulmonary circulation as a whole is the pressure difference between pulmonary artery and left atrium. This is the pressure that overcomes the flow resistance and should be used for determination of vascular resistance.
These differences are far from being solely academic. For example, an increase in intrathoracic pressure due to positive pressure ventilation will increase the pulmonary arterial intravascular pressure, but will also similarly increase pulmonary venous intravascular pressure and therefore driving pressure (and therefore flow) remains unchanged. Similarly, if the primary problem is a raised left atrial pressure, blood will ‘back-up’ through the pulmonary circulation and pulmonary arterial intravascular pressure will also be raised but the driving pressure will again not be increased. Therefore for assessing pulmonary blood flow (and so resistance) driving pressure is the correct measurement, but this requires pulmonary venous (left atrial) pressure to be recorded, which is difficult to achieve continuously (page 113). Pulmonary arterial intravascular pressure is usually measured and the value must therefore be interpreted with caution.
Typical normal values for pressures within the pulmonary circulation are shown in Figure 7.3. The effect of gravity on the pulmonary vascular pressure may be seen, and it will be clear why pulmonary oedema is most likely to occur in the lower zones of the lungs where the intravascular pressures and the transmural pressure gradients are highest.
Effect of Intra-Alveolar Pressure
Alteration of intra-alveolar pressure causes changes in intrathoracic pressure according to the following relationship:
Alveolar transmural pressure is a function of lung volume (Figure 3.8) and, when the lungs are passively inflated, the intrathoracic pressure will normally increase by rather less than half the inflation pressure. The increase will be even less if the lungs are stiff, and thus a low compliance protects the circulation from inflation pressure (page 480). Intravascular pressures are normally increased directly and instantaneously by the effects of changes in intrathoracic pressure, and this explains the initial rise in systemic arterial pressure during a Valsalva manoeuvre (page 478). It also explains the cyclical changes in pulmonary arterial pressure during spontaneous respiration, with pressures greater during expiration than during inspiration. Such changes would not be seen if transmural pressure were measured (Figure 7.3).
In addition to the immediate physical effect of an increase in intrathoracic pressure on intravascular pressures, there is a secondary physiological effect due to interference with venous return. This accounts for the secondary decline in systemic pressure seen in the Valsalva manoeuvre.
Pulmonary Vascular Resistance
Vascular resistance is an expression of the relationship between driving pressure and flow, as in the case of resistance to gas flow. It may be expressed in similar terms as follows:
There are, however, important caveats and the concept of pulmonary vascular resistance is not a simple parallel to Ohm’s law, appropriate to laminar flow (page 43). First, the tubes through which the blood flows are not rigid but tend to expand as flow is increased, particularly in the pulmonary circulation with its low vasomotor tone. Consequently the resistance tends to fall as flow increases and the plot of pressure against flow rate is neither linear (see Figure 4.2) nor curved with the concavity upwards (see Figure 4.3) but curved with the concavity downwards. The second complication is that blood is a non-Newtonian fluid (due to the presence of the corpuscles) and its viscosity varies with the shear rate, which is a function of its linear velocity.
Vascular resistance in the lung. Although the relationship between flow and pressure in blood vessels is far removed from simple linearity, there is a widespread convention that pulmonary vascular resistance should be expressed in a form of the equation above. This is directly analogous to electrical resistance, as though there were laminar flow of a Newtonian fluid though rigid pipes. It would, of course, be quite impractical in the clinical situation to measure pulmonary driving pressure at different values of cardiac output to determine the true nature of their relationship.
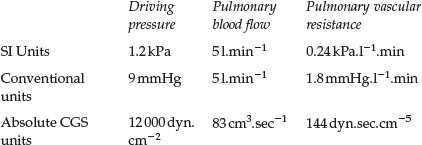
Vascular resistance is expressed in units derived from those used for expression of pressure and flow rate. Using conventional units, vascular resistance is usually expressed in units of mmHg per litre per minute. In absolute CGS units, vascular resistance is usually expressed in units of dynes/square centimetre per cubic centimetre/second (i.e. dyn.sec.cm−5). The appropriate SI units will probably be kPa.l−1.minute. Normal values for the pulmonary circulation in the various units are as follows:
Localisation of the pulmonary vascular resistance. In the systemic circulation the greatest part of resistance is in the arterioles, along which the pressure falls from a mean value of about 12 kPa (90 mmHg) down to about 4 kPa (30 mmHg) (see Figure 7.2). This pressure drop largely obliterates the pulse pressure wave, and the systemic capillary flow is not pulsatile to any great extent. In the pulmonary circulation, the pressure drop along the arterioles is very much smaller than in the systemic circulation and, as an approximation, the pulmonary vascular resistance is equally divided between arteries, capillaries and veins. Pulmonary arteries and arterioles, with muscular vessel walls, are mostly extra-alveolar and involved in active control of pulmonary vascular resistance by mechanisms such as nervous, humoral or gaseous control. In contrast, pulmonary capillaries are intimately associated with the alveolus (see Figure 2.7) so resistance of these vessels is therefore greatly influenced by alveolar pressure and volume. Thus in the pulmonary circulation, vessels without the power of active vasoconstriction play a major role in governing total vascular resistance and the distribution of the pulmonary blood flow.
Passive Changes in Pulmonary Vascular Resistance
Effect of Pulmonary Blood Flow (Cardiac Output)
The pulmonary circulation can adapt to large changes in cardiac output with only small increases in pulmonary arterial pressure. Thus pulmonary vascular resistance must decrease as flow increases. Reduced resistance implies an increase in the total cross-sectional area of the pulmonary vascular bed and particularly the capillaries. These adaptations to increased flow occur partly by passive distension of vessels and partly by recruitment of collapsed vessels, the former being the most important factor.
Recruitment of previously unperfused pulmonary vessels occurs in response to increased pulmonary flow. This is particularly true of the capillary bed, which is devoid of any vasomotor control, so allowing the opening of new passages in the network of capillaries lying in the alveolar septa, and is most likely to occur in the upper part of the lung where capillary pressure is lowest (zone 1, see below). Capillary recruitment was first described in histological studies involving sections cut in lungs rapidly frozen while perfused with blood, which showed that the number of open capillaries increased with rising pulmonary arterial pressure, particularly in the mid-zone of the lung.3 Recruitment of capillaries in the intact lung remains poorly understood. Studies using colloidal gold particles in the circulation demonstrate that there is perfusion in all pulmonary capillaries, including in zone 1, during normal ventilation.4 A similar study, this time with airway pressure increased above pulmonary capillary pressure, showed no flow in almost two-thirds of capillaries in zone 1.5 It therefore seems that with increased alveolar pressure unperfused capillaries are available for recruitment but that under normal circumstances, with low airway pressures, there is flow in all capillaries. However, these studies using colloidal particles cannot discriminate between plasma or blood flow and have led to speculation that some, almost collapsed, capillaries may contain only plasma (‘plasma skimming’) or even blood flow from the bronchial circulation.6
Distension in the entire pulmonary vasculature occurs in response to increased transmural pressure gradient, and is again most likely to occur in capillaries devoid of muscular control. In one study, capillary diameter increased from 5 to 10 μm as the transmural pressure increased from 0.5 to 2.5 kPa (5 to 25 cmH2O).7 As described in the previous section it now seems likely that capillaries never collapse completely and therefore passive distension is clearly the more important adaptation to increased flow.
A striking example of the ability of the pulmonary vasculature to adapt to changing flow occurs after pneumonectomy (page 494), when the remaining lung will normally take the entire resting pulmonary blood flow without a rise in pulmonary arterial pressure. There is, inevitably, a limit to the flow that can be accommodated without an increase in pressure, and this will be less if the pulmonary vascular bed is affected by disease or surgery. The most important pathological cause of increased pulmonary blood flow is left-to-right shunting through a patent ductus arteriosus or through atrial or ventricular septal defects. Under these circumstances the pulmonary blood flow may be several-fold greater than the systemic flow before pulmonary hypertension develops. Despite this, remodelling of the pulmonary vessels commonly results in an increase in vascular resistance, causing an earlier and more severe rise in pulmonary arterial pressure.
Effect of Lung Inflation
Reference has been made above to the effect of alveolar pressure on pulmonary vascular pressures. The effect on pulmonary vascular resistance is complex. Confusion has arisen in the past because of failure to appreciate that pulmonary vascular resistance must be derived from driving pressure and not from pulmonary arterial or transmural pressure (Figure 7.3). This is important because inflation of the lungs normally influences the pressure in the oesophagus, pulmonary artery and left atrium and so can easily conceal the true effect on vascular resistance.
When pulmonary vascular resistance is correctly calculated from the driving pressure, there is reasonable agreement that the pulmonary vascular resistance is minimal at FRC and that changes in lung volume in either direction cause a small increase in resistance, particularly at high lung volumes (Figure 7.4). These observations may be explained by considering pulmonary capillaries as belonging to three distinct groups:8
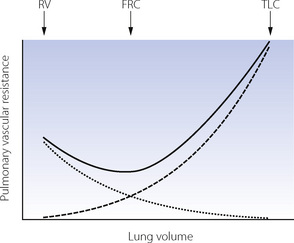
Fig. 7.4 Relationship between pulmonary vascular resistance (PVR) and lung volume. The solid line represents total PVR and is minimal at the functional residual capacity (FRC). Compression of alveolar capillaries (dashed line) is responsible for the increased PVR as lung volume approaches total lung capacity (TLC). Increasing PVR as lung volume approaches residual volume (RV) may result from either compression of corner capillaries (dotted line) or extra-alveolar vessels, or hypoxia-induced vasoconstriction in collapsed lung units. It should be noted that this graph is derived from studies mainly involving isolated animal lungs and may not be applicable to the intact subject.
Alveolar capillaries are sandwiched between two adjacent alveolar walls, usually bulging into one alveolus (see Figure 2.7), and supported from collapse only by the pressure in the capillary and flimsy septal fibrous tissue. Expansion of the alveolus will therefore compress these capillaries and increase their contribution to pulmonary vascular resistance. If the lung consisted entirely of alveolar capillaries then pulmonary vascular resistance would be directly related to lung volume.
Corner capillaries lie within the junction between three or more alveoli, and are not therefore sandwiched between alveolar walls. In this area, the alveolar wall is believed to form ‘pleats’ during lung deflation, which are then stretched out longitudinally (rather than expanded outwards) during inspiration and so have little effect on the blood vessels nearby. Indeed, blood vessels in this area are generally uninfluenced by alveolar pressure but may expand at high lung volume and constrict at very small lung volumes, possibly secondary to local hypoxia surrounding the collapsed alveoli.
Extra-alveolar vessels provide an additional explanation for the increased pulmonary vascular resistance at small lung volumes. Compression of larger pulmonary vessels at low lung volumes may result in reduced flow in dependent parts of the lung (page 123), and this is likely to contribute to the overall change in pulmonary vascular resistance.
The anatomical difference between these capillaries is undoubted, whilst the effect of the anatomical features on physiology are unproven. Much of the work has involved mathematical modelling based on animal studies in the open-chested or isolated preparation, and the relevance of these to the intact human remains uncertain.
Effect of Gravity on Alveolar and Vascular Pressures
The vascular weir. The interplay of alveolar pressure, flow rate and vascular resistance is best considered by dividing the lung field into three zones.9Figure 7.5 shows behaviour as a Starling resistor and also the analogy of a weir. A Starling, or threshold, resistor can be visualised as a length of compressible tubing within a rigid chamber, such that flow occurs only when the upstream pressure (left gauges in Figure 7.5) exceeds the pressure within the chamber (middle gauges) and a reduction in the downstream pressure (right gauges) cannot initiate flow. In zone 1 of Figure 7.5, the pressure within the arterial end of the collapsible vessels is less than the alveolar pressure, and therefore insufficient to open the vessels that remain collapsed as in a Starling resistor. The upstream water is below the top of the weir and so there can be no flow. The downstream (venous) pressure is irrelevant. Zone 1 corresponds to conditions that may apply in the uppermost parts of the lungs.
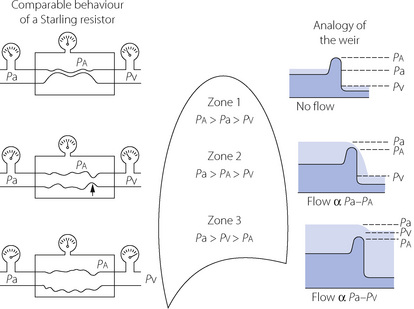
Fig. 7.5 The effect of gravity on pulmonary vascular resistance is shown by comparison with a Starling resistor (left) and with a weir (right). Pa, pulmonary artery pressure; Pa, alveolar pressure; Pv, pulmonary venous pressure (all pressures relative to atmosphere). See text for full discussion.
In the mid-zone of the lungs (zone 2 of Figure 7.5), the pressure at the arterial end of the collapsible vessels exceeds the alveolar pressure and, under these conditions, a collapsible vessel, behaving like a Starling resistor, permits flow in such a way that the flow rate depends on the arterial/alveolar pressure difference. Resistance in the Starling resistor is concentrated at the point marked with the arrow in Figure 7.5. The greater the difference between arterial and alveolar pressure, the more widely the collapsible vessels will open and the greater will be the flow. Note that the venous pressure is still not a factor that affects flow or vascular resistance. This condition is still analogous to a weir, the upstream depth (head of pressure) corresponding to the arterial pressure, and the height of the weir corresponding to alveolar pressure. Flow depends solely on the difference in height between the upstream water level and the top of the weir. The depth of water below the weir (analogous to venous pressure) cannot influence the flow of water over the weir unless it rises above the height of the weir.
In the lower zone of the lungs (zone 3 of Figure 7.5), the pressure in the venous end of the capillaries is above the alveolar pressure, and under these conditions a collapsible vessel behaving like a Starling resistor will be held wide open and the flow rate will, as a first approximation, be governed by the arterial/venous pressure difference (the driving pressure) in the normal manner for the systemic circulation. However, as the intravascular pressure increases in relation to the alveolar pressure, the collapsible vessels will be further distended and their resistance will be correspondingly reduced. Returning to the analogy of the weir, the situation is now one in which the downstream water level has risen until the weir is completely submerged and offers little resistance to the flow of water, which is largely governed by the difference in the water level above and below the weir. However, as the levels rise further, the weir is progressively more and more submerged and what little resistance it offers to water flow is diminished still further.
Active Control of Pulmonary Vascular Resistance
In addition to the passive mechanisms described, pulmonary blood vessels are also able to control vascular resistance by active vasoconstriction and vasodilatation, and there is now evidence that the pulmonary vasculature is normally kept in a state of active vasodilatation.10
Cellular Mechanisms Controlling Pulmonary Vascular Tone11,12,13
There are many mechanisms by which pulmonary vascular tone may be controlled (Table 7.1), but the role of many of these in the human lung is uncertain. Some of the receptor-agonist systems in Table 7.1 have only been demonstrated in vitro using animal tissue, but may eventually emerge as important in humans either for normal maintenance of pulmonary vascular tone or during lung injury (Chapter 31). Activity of some, though not all, of the mechanisms listed in Table 7.1 are dependent on the endothelial lining of the pulmonary blood vessels. It seems likely that many basic control mechanisms occur within the smooth muscle cell whilst the endothelium acts as a modulator of the response. Some control mechanisms such as the autonomic nervous system and hypoxic pulmonary vasoconstriction have been extensively investigated in humans and are described separately below.
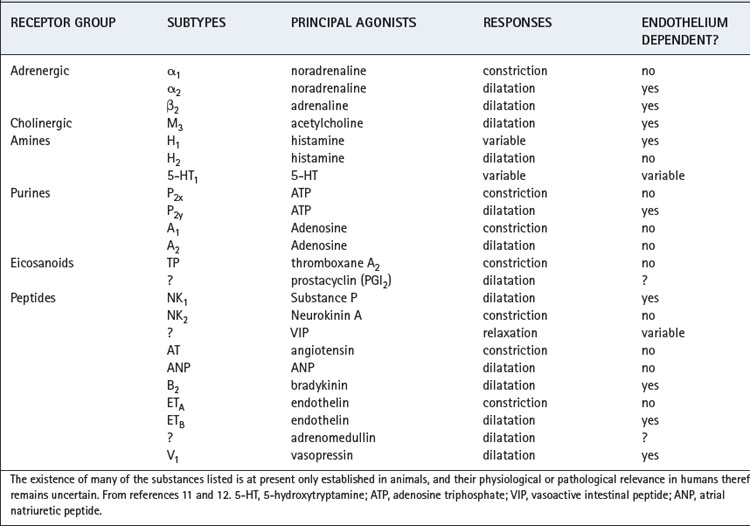
Receptors. Endothelial and smooth muscle cells of the pulmonary vasculature each have numerous receptor types, and the agonists for these receptors may originate from nerve endings (e.g. acetylcholine, noradrenaline), be produced locally (e.g. eicosanoids, endothelin), or arrive via the blood (e.g. peptides). In addition, many similar or identical compounds produce opposing effects by their actions on differing sub-groups of receptors for example α1 (vasoconstrictor) and β2 (vasodilator) adrenergic receptors. There remains therefore a large number of poorly understood systems acting together to bring about control of pulmonary vascular smooth muscle.
Second messengers. Pulmonary vasodilators that act directly on the smooth muscle such as prostaglandins, vasoactive intestinal peptide and under some circumstances β2 agonists, mostly activate adenyl cyclase to produce cyclic adenosine 3′,5′ monophosphate (cAMP) as a second messenger. In turn, cAMP causes a host of intracellular activity via activation of protein kinase enzymes that reduce both the phosphorylation of myosin and intracellular calcium levels to bring about relaxation of the muscle cell.
Receptors that cause contraction of pulmonary vascular smooth muscle are usually G-protein coupled. Activation produces a second messenger, inositol 1,4,5-triphosphate (IP3), which releases calcium from intracellular stores and activates myosin phophorylation to produce contraction.
Role of the endothelium and nitric oxide.11 Furchgott& Zawadzki in 1980 were the first to demonstrate that endothelial cells were required for acetylcholine (ACh) induced relaxation in isolated aortic tissue, the messenger passing between the endothelium and smooth muscle cells being termed endothelium-derived relaxing factor,14 the major part of which was subsequently shown to be nitric oxide (NO). Many pulmonary vasodilator mechanisms have been shown to be endothelium dependent (Table 7.1) and it is likely that NO is a common pathway for producing relaxation of vascular smooth muscle from a variety of stimuli.
Nitric oxide synthase (NOS) produces NO by the conversion of l-arginine to l-citrulline, via a highly reactive hydroxy-arginine intermediate (Figure 7.6). NOS is involved in both stages, and requires many cofactors including calmodulin and NADPH, and probably other flavine derived factors such as flavine adenine dinucleotide. Control of NOS activity depends on the availability of the substrate, arginine, and the concentrations of the various cofactors. Citrulline produced by NOS enters the urea cycle and is converted back into arginine (Figure 7.6). This pathway utilises ammonia derived from the conversion of amino acids into energy-producing substrates such as pyruvate, and provides a mechanism by which ammonium ions may be converted into relatively harmless nitrates (via NO). The biological disposal of nitric oxide is described on page 194.
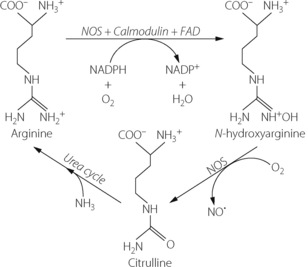
Fig. 7.6 Biochemical production of nitric oxide (NO). Nitric oxide synthase (NOS) acts as a catalyst for a two stage reaction to convert arginine to citrulline. Oxygen is required at both stages, and NADPH, calmodulin and flavine adenine dinucleotide (FAD) are required as cofactors for the first stage and are believed to control the rate of NO production. Citrulline produced in this reaction may then enter the urea cycle, and using ammonia derived from amino acid metabolism, is converted back into arginine.
Nitric oxide synthase exists in two forms known as constitutive and inducible. Inducible NO synthase (iNOS) is produced in many cells but only in response to activation by inflammatory mediators and other cytokines, and once activated can produce large amounts of NO for long periods. Constitutive NO synthase (cNOS) is permanently present in some cells, including pulmonary endothelium, and produces short bursts of low levels of NO in response to changes in calcium and calmodulin levels. In systemic vessels, sheer stress of the blood vessel wall may directly activate calcium-dependent potassium channels to activate cNOS, but in the pulmonary circulation receptor stimulation is the usual source of altered calcium levels and cNOS activation.
The mechanism by which receptor activation leads to muscle relaxation is illustrated in Figure 7.7. Nitric oxide diffuses from the site of production to the smooth muscle cell where it activates guanylate cyclase to produce cyclic guanosine 3′,5′ monophosphate (cGMP), which in turn activates a protein kinase enzyme. This system is similar to the cAMP pathway described above and causes relaxation by a combination of effects on cytosolic calcium levels and the activity of enzymes controlling myosin activity.
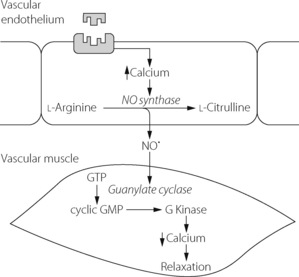
Fig. 7.7 Schematic pathway for the activation of constitutive nitric oxide synthase and the action of nitric oxide in the pulmonary vasculature. There are many different receptors thought to act via this mechanism to bring about vasodilatation. See text for details.
There is now good evidence that basal production of NO occurs in normal human lungs and contributes to the maintenance of low pulmonary vascular resistance.10,15 Both of these studies have used NG-monomethyl-l-arginine (l-NMMA), a NOS inhibitor, to demonstrate reduced global or regional pulmonary blood flow.
Hypoxic Pulmonary Vasoconstriction
When vasoconstriction occurs in response to hypoxia, pulmonary blood vessels are displaying their fundamental difference from systemic vessels. Hypoxic pulmonary vasoconstriction (HPV) is mediated both by mixed venous (pulmonary arterial) Po2 and alveolar Po2 (Figure 7.8), the greater influence being from the alveolus. The overall response to Po2 is non-linear. This may be deduced from Figure 7.8 by noting the pressure response for different values of the isobaric Po2 (the broken line), and it will be seen that the general shape of the response curve resembles an oxyhaemoglobin dissociation curve with a P50 of about 4 kPa (30 mmHg). The combined effect of hypoxia in alveolar gas and mixed venous blood may be considered as acting at a single point,16 which exerts a ‘stimulus’Po2 as follows:
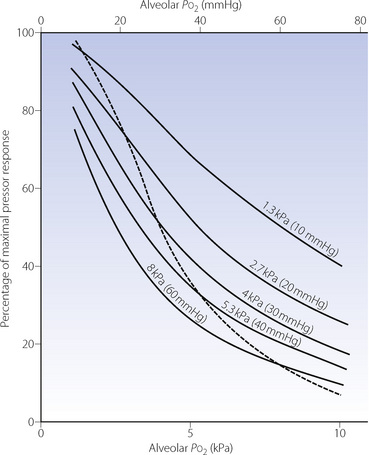
Fig. 7.8 Pulmonary vasoconstriction (ordinate) as a function of alveolar Po2 (abscissa) for different values of mixed venous Po2 (indicated for each curve). The broken line shows the response when the alveolar and mixed venous Po2 are identical.
(Data from reference 18.)

In addition to the effect of mixed venous and alveolar Po2, the bronchial arterial Po2 influences tone in the larger pulmonary arteries via the vasa vasorum.17
Regional hypoxic pulmonary vasoconstriction is beneficial as a means of diverting the pulmonary blood flow away from regions in which the oxygen tension is low and is an important factor in the optimisation of ventilation/perfusion relationships (Chapter 8). It is also important in the fetus to minimise perfusion of the unventilated lung. However, long term continuous or intermittent HPV leads to remodelling of the pulmonary vasculature and pulmonary hypertension, and this response is disadvantageous in a range of clinical conditions (see Chapter 29).
The pressor response to hypoxia results from constriction of small arterioles of 30–200 μm in diameter and begins within a few seconds of the Po2 decreasing. In humans, hypoxia in a single lobe of the lung results in a rapid decline in perfusion of the lobe such that after 5 minutes regional blood flow is half that during normoxia.19 With prolonged hypoxia HPV is biphasic: the initial rapid response reaches a plateau after about 5 minutes, with the second phase occurring around 40 minutes later20 (Figure 7.9) and reaching a maximal response 2–4 hours after the onset of hypoxia.21
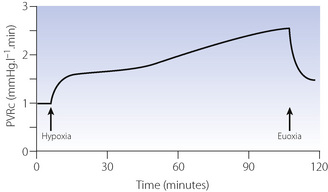
Fig. 7.9 Time course of the hypoxic pulmonary vasoconstriction response to prolonged isocapnic hypoxia in humans (end-tidal Po2 6.7 kPa, 50 mmHg). Phase 1 of the response is complete within a few minutes, then the phase 2 response occurs around 40 minutes later PVRc, pulmonary vascular resistance corrected for cardiac output. Note that after prolonged hypoxia PVRc does not return to baseline immediately.
(After reference 20.)
Mechanism of HPV22-26
Neural connections to the lung are not required as HPV occurs in isolated lung preparations and in humans following lung transplantation.27 Attempts to elucidate the mechanism of HPV have been hampered by species differences, the multitude of systems affecting pulmonary vascular tone and a lack of appreciation of the biphasic nature of the response. Uncertainties remain on the cellular mechanism of HPV, but there is now agreement that contraction of pulmonary artery smooth muscle cells (PASMC) in response to hypoxia is an inherent property of these cells, and that pulmonary endothelial cells only act to modulate the PASMC response.23
Oxygen sensing in PASMC is similar to that already described for glomus cells in the carotid body (page 71). Hypoxia leads to a small increase in intracellular calcium concentration, and also a rho kinase-mediated increase in the calcium sensitivity of the contractile proteins of the cell.26 These changes in calcium activity result from opening of voltage-dependent L-type calcium channels, stimulated in turn by hypoxia-induced inhibition of voltage gated potassium (Kv) channels. As in the carotid body, the molecular oxygen sensor that affects the Kv channel remains controversial. This may be an inherent property of the Kv channel itself28 though mitochondria, nicotinamide adenine dinucleotide phosphate oxidases and reactive oxygen species (Chapter 26) are also involved.24,29
Modulation by the endothelial cell of the PASMC response to hypoxia may either enhance or inhibit HPV.23 Inhibitors of HPV include prostacyclin (PGI2) and nitric oxide (NO), both of which may exist to maintain some perfusion of hypoxic lung regions,22 though their role in normal lung is uncertain. For example, prostacyclin is a potent pulmonary vasodilator but cyclo-oxygenase, which is required for its production, is inhibited by hypoxia – which may therefore diminish the vasodilator effects.22 Similarly, basal NO secretion by endothelial cells may act to moderate HPV, but hypoxia also inhibits endothelial NO production and so enhances HPV. Molecules that enhance HPV include thromboxane A2 (see below) and endothelin. Endothelin is a 21 amino acid peptide released by endothelial cells in response to hypoxia.30 It is a potent vasoconstrictor peptide which has a prolonged effect on pulmonary vascular tone such that this mechanism is probably involved in the second slow phase of HPV (Figure 7.9). Endothelin is believed to be involved in producing the pulmonary hypertension associated with altitude hypoxia (see Chapter 17), though attempts to enhance HPV with endothelin infusions have not been successful.21 Two groups of endothelin receptors are described, ETA and ETB, and the ratio of these two receptors varies between the central and peripheral vasculature of the lung. Apart from its vasoconstrictor effects, endothelin can also stimulate cellular proliferation of either vascular endothelial cells or pulmonary fibroblasts, and so has an important role in the pulmonary vascular remodelling that accompanies long-term hypoxia.
HPV is therefore a complex and poorly elucidated system. In normal subjects HPV within the lung is inhomogenous,31 with intense vasoconstriction in some areas and relative overperfusion elsewhere, the degree to which this occurs varying between individuals which has important implications when travelling to high altitude (page 286). Another fascinating recent finding relates to iron metabolism and HPV. Increased iron availability (achieved by intravenous infusion) attenuates HPV, while reducing iron availability by administration of desferrioxamine enhances the response.32 These observations may be highly significant for patients given that normal subjects have widely varying iron status, depending on such factors as sex, diet and chronic illness.33
Effects of Pco2 and pH on Pulmonary Vascular Resistance
ElevatedPco2 has a slight pressor effect, for example, hypoventilation of one lobe of a dog’s lung reduces perfusion of that lobe, although its ventilation/perfusion ratio is still reduced.34 Both respiratory and metabolic acidosis augment HPV.8,35 Alkalosis, whether respiratory (hypocapnia) or metabolic in origin, causes pulmonary vasodilatation8 and attenuates HPV.36
Neural Control
There are three systems involved in autonomic control of the pulmonary circulation,11,12 which are similar to those controlling airway tone (page 50).
Adrenergic sympathetic nerves originate from the first five thoracic nerves and travel to the pulmonary vessels via the cervical ganglia and a plexus of nerves around the trachea and smaller airways. They act mainly on the smooth muscle of arteries and arterioles down to a diameter of less than 60 μm.8,11 There are both α1 receptors which mediate vasoconstriction, usually in response to noradrenaline release, and β2 receptors which produce vasodilatation mainly in response to circulating adrenaline. Overall, α1 effects predominate and sympathetic stimulation increases pulmonary vascular resistance.11 The influence of the sympathetic system is not as strong as in the systemic circulation and seems to have little influence under resting conditions. There is no obvious disadvantage in this respect in patients with lung transplant (see Chapter 33).
Cholinergic nerves of the parasympathetic system travel in the vagus nerve and cause pulmonary vasodilatation by release of ACh and stimulation of M3 muscarinic receptors.11 Acetylcholine-mediated vasodilatation is accepted as being endothelium and NO dependent,10 and in the absence of endothelium, ACh is a vasoconstrictor. The significance of cholinergic nerves in humans is less clear than that of adrenergic systems. Infusion of ACh into the pulmonary artery in normal subjects results in vasodilatation,10 so ACh receptors clearly exist, but cholinergic nerve fibres have not been demonstrated histologically around human pulmonary vessels.11
Non-adrenergic, non-cholinergic (NANC)11 nerves are closely related anatomically to the other autonomic mechanisms but with different neurotransmitters and are similar to the NANC nerves controlling airway smooth muscle (page 51). In the lung, most NANC nerves are inhibitory, causing vasodilatation via release of NO, possibly in conjunction with peptides (Table 7.1). The functional significance of this system is unknown.
Humoral Control
Pulmonary vascular endothelium is involved in the metabolism of many circulating substances (Chapter 12), some of which cause changes in vascular tone (Table 7.1). Which of these are involved in the control of normal pulmonary vascular resistance is unclear, and it is quite possible that very few are, but some are undoubtedly involved in pulmonary vascular disease (Chapter 29).
Catecholamines. Circulating adrenaline following sympathetic stimulation acts on both α and β receptors and results in a predominantly vasoconstrictor response. Exogenous adrenaline and related inotropes such as dopamine have a similar effect.
Eicosanoids. Arachidonic acid metabolism via the cyclo-oxygenase pathway (to prostaglandins and thromboxane) and lipoxygenase pathway (to leukotrienes) has been demonstrated in pulmonary vessels in animals. The products of arachidonic acid metabolism have diverse biological effects in many physiological systems and the pulmonary vasculature is no exception. Arachidonic acid itself, thromboxane A2, PGF2α, PGD2, PGE2 and LTB4 are all vasoconstrictors whilst PGI2 (prostacyclin) is usually a vasodilator. These pathways are believed to be involved in pathological pulmonary hypertension resulting from sepsis, reperfusion injury or congenital heart disease.11
Amines. Histamine relaxes pulmonary vascular smooth muscle during adrenaline-induced constriction but constricts resting smooth muscle. Constriction is in response to H1 stimulation on smooth muscle cells whilst relaxation occurs either via H1 receptors on endothelium (NO dependent) or H2 receptors on smooth muscle cells. 5-hydroxy-tryptamine (serotonin) is liberated from activated platelets and is a potent vasoconstrictor. It may be involved in pulmonary hypertension secondary to emboli (page 426).
Peptides. Numerous peptides that are vasoactive in the pulmonary circulation are shown in Table 7.1. Responses are again diverse, many systems producing vasodilatation via endothelium receptors and vasoconstriction via direct effects on smooth muscle (e.g. substance P and neurokinin A).11
Purine nucleosides such as adenosine and ATP are highly vasoactive, again with variable responses according to the amount of tone in the pulmonary blood vessel.11 Adenosine is a pulmonary vasodilator in normal subjects.37
Drug Effects on the Pulmonary Circulation
A higher than normal pulmonary arterial pressure occurs rarely as a primary disease but commonly develops as a secondary consequence of chronic hypoxia from a variety of lung diseases (Chapter 29). Considering the wide range of receptor–agonist systems present in the pulmonary vasculature (Table 7.1) it is surprising that there are only a few effective drugs available. One reason for this is the non-specific nature of many of the receptors found in the pulmonary vasculature, such that drugs acting on these receptors have widespread effects elsewhere in the body that make them therapeutically unacceptable. Another problem with pulmonary vasodilators in respiratory disease is that abolishing HPV removes the body’s main mechanisms for compensating for poor respiratory function. For example, nifedipine administered sublingually in patients with severe airways disease causes a significant reduction in pulmonary hypertension, but this is associated with a worsening of arterial hypoxaemia.38 As a way of avoiding both these problems, delivering drugs by inhalation has had some success,39 particularly if the drug is inactivated before reaching the systemic circulation.
Inhaled Drugs
Nitric oxide. Inhaled NO (iNO) in patients with severe lung disease is a selective pulmonary vasodilator, with the systemic circulation being unaffected due to its rapid inactivation by haemoglobin (page 194). Nitric oxide therefore increases blood flow to well ventilated areas of the lung and so diverts blood flow away from poorly ventilated areas,40 thereby decreasing ventilation–perfusion mismatch and improving arterial oxygenation. In addition to its role in modulating vascular tone and oxygenation NO may play a significant role as an immunomodulator, for example by reducing leukocyte adhesion and activation41 it may attenuate lung inflammation (Chapter 31).
Inhaled NO in the presence of oxygen is rapidly oxidised to NO2, the rate of oxidation being directly related to oxygen concentration and the square of NO concentration. NO2 can react with water to form highly injurious nitric and nitrous acids that can cause severe pneumonitis and pulmonary oedema. Hence to minimise the production of NO2 both the concentration of oxygen and NO, and the contact time between the two, should be minimised. Some of the beneficial effects of iNO may be short lived, whilst rapid discontinuation of iNO leads to a rebound phenomenon, probably due to inhibition of endogenous NO, with decreased oxygenation and increased pulmonary artery pressures. Hence iNO should be withdrawn in a slow stepwise fashion. Despite these numerous drawbacks, therapeutic iNO in some groups of patients with acute lung injury does seem to produce improved clinical outcomes.42
Prostacyclin.39,43 Intravenous prostacyclin (PGI2) has been used for some time for treatment of pulmonary hypertension and to reduce PA pressure in critically ill patients, but its lack of selectivity for the pulmonary vasculature causes significant adverse effects. When delivered by inhalation, metabolism of PGI2 by the lung is negligible, so systemic absorption occurs. However, the dose required by inhalation is very small, so despite its systemic absorption clinically significant adverse effects are minimal.
Systemic Drugs44
Prostacyclin and its analogues may be administered continuously by the intravenous or subcutaneous routes.43 Prostacyclin has a half-life of less than 5 minutes, so a variety of synthetic analogues have been developed such as iloprost (half life ∼30 min) and more recently treprostinil (half life ∼4.5 h).
Angiotensin-converting enzyme inhibitors reduce pulmonary vascular resistance in patients with pulmonary hypertension secondary to lung disease, but only with long term treatment. These drugs are also believed to reduce pulmonary vascular remodelling (page 428). Losartan, an angiotensin II receptor antagonist, reduces pulmonary artery pressure within hours of administration, without detriment to the patient’s oxygen saturation.45
Phosphodiesterase (PDE) inhibitors can inhibit the breakdown of both cAMP and cGMP, and so enhance the activity of these cellular messengers that bring about vascular smooth muscle cell relaxation from a variety of pathways (see above), including all those mediated by NO. These drugs have been used to reduce pulmonary hypertension by both the intravenous and inhaled routes. Of particular interest for the pulmonary circulation are selective inhibitors of type 5 PDE which is specific for pulmonary cGMP breakdown. Sildenafil, more well known for its use as a treatment for impotence, is an oral inhibitor of PDE5 with few side effects that acts as a pulmonary vasodilator by enhancing the effects of endogenous NO.46
Calcium antagonists such as nifedipine reduce secondary pulmonary hypertension in a dose dependent fashion by inhibition of the L-type calcium channels on PASMCs described above. However, as already described, in some patient groups hypoxaemia may worsen, and at the large doses often needed to reduce pulmonary hypertension, the negative inotropic effects of calcium antagonists become significant and right heart failure caused by the pulmonary hypertension can deteriorate.
Endothelin receptor antagonists competitively antagonise both ETA and ETB receptors, though in the clinical situation ETB effects seem to predominate and reduce PA pressure. Endothelin has been implicated in vascular remodelling of pulmonary vessels with chronic hypoxia, so these drugs may also slow this process. Bosentan, a non-selective oral endothelin antagonist, is now approved for the treatment of patients with pulmonary hypertension, and more selective ET antagonists such as sitaxsentan continue to be evaluated though currently do not seem to offer any particular advantage over non-selective drugs.30
Principles of Measurement of the Pulmonary Circulation
Detailed consideration of haemodynamic measurement techniques lie outside the scope of this book. The following section presents only the broad principles of measurement such as may be required in relation to respiratory physiology.
Pulmonary Blood Volume
Available methods are based on the technique used for measurement of cardiac output by dye dilution (see below). The flow rate so obtained is multiplied by the interval between the time of the injection of the dye and the mean arrival time of the dye at the sampling point. This product indicates the amount of blood lying between injection and sampling sites and the volume result obtained therefore depends very much on exactly where sampling occurs. Total pulmonary blood volume may be measured by sampling from the proximal pulmonary artery and the pulmonary vein (or left atrium). Typical values are of the order of 0.5–1.0 litres or 10–20% of total blood volume in an adult.
Table 2.2 shows the anatomical distribution of the pulmonary blood volume within the pulmonary arterial tree which has a volume of the order of 150 ml. Pulmonary capillary volume may be calculated from measurements of diffusing capacity (see Chapter 9), and this technique yields values of the order of 80 ml. The pulmonary veins therefore contain over half of the pulmonary blood volume as they possess much less vasomotor tone than the pulmonary arteries.
Pulmonary Vascular Pressures
Pressure measurements within the pulmonary circulation are almost always made with electronic pressure transducers, which measure instantaneous pressure against time (Figure 7.10). Systolic and diastolic pressures are measured from the peaks and troughs of this trace, and the mean pressure is derived electronically.
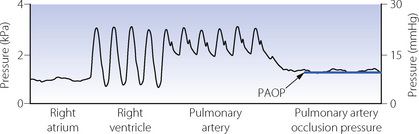
Fig. 7.10 Pressure traces obtained when inserting a balloon flotation catheter in a patient receiving intermittent positive pressure ventilation. With the balloon inflated, the catheter tip follows blood flow through the right atrium, right ventricle, and pulmonary artery until it occludes a branch of the pulmonary artery. The pulmonary artery occlusion pressure (PAOP) is the pressure measured distal to the balloon and equates to pulmonary venous and left atrial pressures. Note the respiratory swings in the trace caused by positive pressure ventilation. PAOP is measured as the mean pressure at end-expiration.
Figure 7.3 shows the sites at which pressure must be measured to obtain the various forms of pulmonary vascular pressure (page 101). Driving pressure, the most useful of these, requires measurement of pulmonary arterial and pulmonary venous (left atrial) pressures.
Pulmonary arterial pressure may be measured using a balloon flotation catheter. Following insertion into the right atrium via a central vein, a balloon of <1 ml volume is inflated to encourage the catheter tip to follow the flow of blood through the right ventricle and pulmonary valve into the pulmonary artery (Figure 7.10). The most commonly used catheter is the Swan–Ganz, named after the two cardiologists who devised the catheter after Dr Swan watched sailboats being propelled by the wind in 1967.47
Left atrial pressure represents pulmonary venous pressure and is measured in humans by one of three possible techniques, of which only the first is used commonly in clinical practice.
 Pulmonary artery occlusion pressure (PAOP).48 Occlusion pressures are obtained by advancing the Swan–Ganz catheter into a branch of the pulmonary artery, with the balloon inflated, until the arterial pulsation disappears (Figure 7.10). There should then be no flow in the column of blood between the tip of the catheter and the left atrium, and the manometer will indicate left atrial pressure.
Pulmonary Blood Flow
The method used for measurement of pulmonary blood flow will affect whether or not the result includes venous admixture such as the bronchial circulation and intrapulmonary shunts shown in Figure 7.1. Though of minimal relevance in normal subjects, in patients with lung disease venous admixture may be highly significant. In general, methods involving uptake of an inert gas from the alveoli will exclude venous admixture, and all other methods include it.
The Fick principle states that the amount of oxygen extracted from the respired gases equals the amount added to the blood which flows through the lungs. Thus the oxygen uptake of the subject must equal the product of pulmonary blood flow and arteriovenous oxygen content difference:
therefore:
All the quantities on the right-hand side can be measured, although determination of the oxygen content of the mixed venous blood requires catheterisation of the right ventricle or, preferably, the pulmonary artery as described above. Interpretation of the result is less easy. The calculated value includes the intrapulmonary arteriovenous shunt, but the situation is complicated beyond the possibility of easy solution if there is appreciable extrapulmonary admixture of venous blood (see Figure 7.1). The second major problem is that spirometry measures the total oxygen consumption including that of the lung. The Fick equation excludes the lung (see page 212) but the difference is negligible with healthy lungs. There is evidence that the oxygen consumption of infected lungs may be very large (page 212) and therefore the Fick method of measurement of cardiac output would appear to be invalid under such circumstances.
Methods based on uptake of inert tracer gases. A modified Fick method of measurement of cardiac output may be employed with any fairly soluble inert gas. The tracer gas is inhaled either continually or for a single breath and the end-tidal partial pressure of tracer gas then measured. Analysis of volume and composition of expired tracer gas permits measurement of gas uptake. Since the duration of the procedure is short and does not permit recirculation, it may be assumed that the mixed venous concentration of the tracer gas is zero. The Fick equation then simplifies to the following:
The arterial tracer gas concentration equals the product of the arterial gas tension (assumed equal to the alveolar [end-tidal] gas tension) and the solubility coefficient of the tracer gas in blood. Thus arterial blood sampling may be avoided so the method is relatively non-invasive.
All the methods based on the uptake of inert tracer gases have the following characteristics:
They measure pulmonary capillary blood flow, excluding any flow through shunts. This is in contrast to the Fick and dye methods. The assumption that the tension of the tracer gas is the same in end-expiratory gas and arterial blood is invalid in the presence of either alveolar dead space or shunt (see Chapter 8). Some of the tracer gas dissolves in the tissues lining the respiratory tract and is carried away by blood perfusing these tissues. The indicated blood flow is therefore greater than the actual pulmonary capillary blood flow.The tracer gas used has varied through the years with nitrous oxide and acetylene being used early this century. In the most recent version of the technique, freon is the tracer gas used. In this case, argon (highly insoluble gas) is added to the gas mixture to ensure complete mixing of the freon with alveolar gas, and also to detect subjects with a large respiratory dead space (see Chapter 8) in whom the method is invalid.49
Dye or thermal dilution. Currently the most popular technique for measurement of cardiac output is by dye dilution. An indicator substance is introduced as a bolus into a large vein and its concentration is measured continuously at a sampling site in the systemic arterial tree. Figure 7.11A shows the method as it is applied to continuous non-circulating flow as, for example, of fluids through a pipeline. The downstream concentration of dye is displayed on the y axis of the graph against time on the x axis. The dye is injected at time t1 and is first detected at the sampling point at time t2. The uppermost curve shows the form of a typical curve. There is a rapid rise to maximum concentration followed by a decay that is an exponential wash-out in form (see Appendix E), reaching insignificant levels at time t3. The second graph shows the concentration (y axis) on a logarithmic scale when the exponential part of the decay curve becomes a straight line (see Figure E.5). Between times t2 and t3, the mean concentration of dye equals the amount of dye injected, divided by the volume of fluid flowing past the sampling point during the interval t2 – t3, which is the product of the fluid flow rate and the time interval t2 – t3. The equation may now be rearranged to indicate the flow rate of the fluid as the following expression:
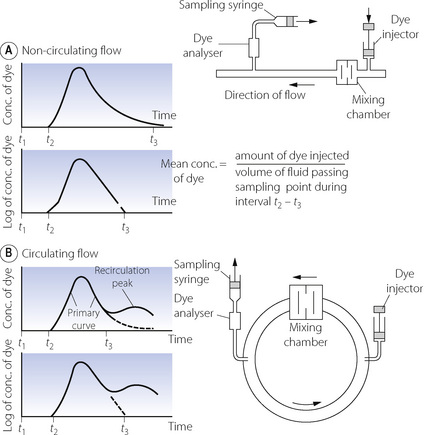
Fig. 7.11 Measurement of flow by dye dilution. (A) The measurement of continuous non-circulating flow rate of fluid in a pipeline. The bolus of dye is injected upstream and its concentration is continuously monitored downstream. The relationship of the relevant quantities is shown in the equation. Mean concentration of dye is determined from the area under the curve. (B) The more complicated situation when recirculation occurs and the front of the circulating dye laps its own tail, giving a recirculation peak. Reconstruction of the primary curve is based on extrapolation of the primary curve before recirculation occurs. This is facilitated by the fact that the down curve is exponential and therefore a straight line on a logarithmic plot.
The amount of dye injected is known and the denominator is the area under the curve.
Figure 7.11B shows the more complicated situation when fluid is flowing round a circuit. Under these conditions, the front of the dye-laden fluid may lap its own tail so that a recirculation peak appears on the graph before the primary peak has decayed to insignificant levels. This commonly occurs when cardiac output is determined in humans, and steps must be taken to reconstruct the tail of the primary curve as it would have been had recirculation not taken place. This is done by extrapolating the exponential wash-out which is usually established before the recirculation peak appears. This is shown as the broken lines in the graphs of Figure 7.11B. The calculation of cardiac output then proceeds as described above for non-recirculating flow. This previously laborious procedure is now performed electronically as an integral part of the apparatus for measuring cardiac output.
Many different indicators have been used for the dye dilution technique, but currently the most satisfactory appears to be ‘coolth’. A bolus of cold saline is injected and the dip in temperature is recorded downstream with the temperature record corresponding to the dye curve. No blood sampling is required and temperature is measured directly with a thermometer mounted on the catheter. The ‘coolth’ is dispersed in the systemic circulation and therefore there is no recirculation peak to complicate the calculation. The thermal method is particularly suitable for repeated measurements.
References
1. Harris P. The evolution of the pulmonary circulation. Thorax. 1995;49:S5-S8.
2. Hasegawa I, Kobayashi K, Kohda E, Hiramatsu K. Bronchopulmonary arterial anastomosis at the precapillary level in human lung. Acta Radiol. 1999;39:578-584.
3. Warrell DA, Evans JW, Clarke RO, Kingaby GP, West JB. Pattern of filling in the pulmonary capillary bed. J Appl Physiol. 1972;32:346-356.
4. König MF, Lucocq JM, Weibel ER. Demonstration of pulmonary vascular perfusion by electron and light microscopy. J Appl Physiol. 1993;75:1877-1883.
5. Conhaim RL, Harms BA. Perfusion of alveolar septa in isolated rat lungs in zone 1. J Appl Physiol. 1993;75:704-711.
6. Johnson RL, Hsai CCW. Functional recruitment of pulmonary capillaries. J Appl Physiol. 1994;76:1405-1407.
7. Sobin SS, Fung YC, Tremer HM, Rosenquist TH. Elasticity of the pulmonary alveolar microvascular sheet in the cat. Circ Res. 1972;30:440-450.
8. Fishman AP. Pulmonary circulation. In: Fishman AP, Fisher AB, Geiger SR, editors. Handbook of Physiology, Section 3 – The respiratory system. Bethesda MD: American Physiological Society; 1987:93-97.
9. West JB, Dollery CT. Distribution of blood flow and the pressure–flow relations of the whole lung. J Appl Physiol. 1965;20:175-183.
*10. Cooper CJ, Landzberg MJ, Anderson TJ, et al. Role of nitric oxide in the local regulation of pulmonary vascular resistance in humans. Circulation. 1996;93:266-271.
11. Barnes PJ, Liu SF. Regulation of pulmonary vascular tone. Pharmacol Rev. 1995;47:87-131.
12. Kobayashi Y, Amenta F. Neurotransmitter receptors in the pulmonary circulation with particular emphasis on pulmonary endothelium. J Auton Pharmacol. 1994;14:137-164.
13. Wilkins MR, Zhao L, Al-Tubuly R. The regulation of pulmonary vascular tone. Br J Clin Pharmacol. 1996;42:127-131.
14. Cherry PD, Furchgott RF, Zawadzki JV, Jothianandan D. Role of endothelial cells in relaxation of isolated arteries by bradykinin. Proc Natl Acad Sci USA. 1982;79:2106-2110.
15. Stamler JS, Loh E, Roddy M-A, Currie KE, Craeger MA. Nitric oxide regulated basal systemic and pulmonary vascular resistance in healthy humans. Circulation. 1994;89:2035-2040.
16. Marshall BE, Marshall C, Frasch HF. Control of the pulmonary circulation. In: Stanley TH, Sperry RJ, editors. Anesthesia and the Lung. Dordrecht: Kluwer; 1992:9-18.
17. Marshall BE, Marshall C, Magno M, Lilagan P, Pietra GG. Influence of bronchial artery Po2 on pulmonary vascular resistance. J Appl Physiol. 1991;70:405-415.
18. Marshall BE, Marshall C. Anesthesia and the pulmonary circulation. In: Covino BG, Fozzard HA, Rehder K, Strichartz G, editors. Effects of Anesthesia. Bethesda, MD: American Physiological Society, 1983.
19. Morrell NW, Nijran KS, Biggs T, Seed WA. Magnitude and time course of acute hypoxic pulmonary vasoconstriction in man. Respir Physiol. 1995;100:271-281.
20. Talbot NP, Balanos GM, Dorrington KL, Robbins PA. Two temporal components within the human pulmonary vascular response to ∼2 h of isocapnic hypoxia. J Appl Physiol. 2005;98:1125-1139.
21. Talbot NP, Balanos GM, Robbins PA, Dorrington KL. Can intravenous endothelin-1 be used to enhance hypoxic pulmonary vasoconstriction in healthy humans? Br J Anaesth. 2008;101:466-472.
22. Aaronson PI, Robertson TP, Ward JPT. Endothelium-derived mediators and hypoxic pulmonary vasoconstriction. Respir Physiol Neurobiol. 2002;132:107-120.
23. Weir K, López-Barneo J, Buckler KJ, Archer SL. Acute oxygen-sensing mechanisms. N Engl J Med. 2005;353:2042-2055.
*24. Sommer N, Dietrich A, Schermuly RT, et al. Regulation of hypoxic pulmonary vasoconstriction: basic mechanisms. Eur Respir J. 2008;32:1639-1651.
25. Moudgil R, Michelakis ED, Archer SL. Hypoxic pulmonary vasoconstriction. J Appl Physiol. 2005;98:390-403.
26. Aaronson PI, Robertson TP, Knock GA, et al. Hypoxic pulmonary vasoconstriction: mechanisms and controversies. J Physiol. 2006;570:53-58.
27. Robin ED, Theodore J, Burke CM, et al. Hypoxic pulmonary vasoconstriction persists in the human transplanted lung. Clin Sci. 1987;72:283-287.
*28. Coppock EA, Martens JR, Tamkun MM. Molecular basis of hypoxia-induced pulmonary vasoconstriction: role of voltage-gated K+ channels. Am J Physiol. 2001;281:L1-L12.
29. Waypa GB, Schumacker PT. Hypoxic pulmonary vasoconstriction: redox events in oxygen sensing. J Appl Physiol. 2005;98:404-414.
30. Dupuis J, Hoeper MM. Endothelin receptor antagonists in pulmonary arterial hypertension. Eur Respir J. 2008;31:407-415.
31. Dehnert C, Risse F, Ley S, et al. Magnetic resonance imaging of uneven pulmonary perfusion in hypoxia in humans. Am J Respir Crit Care Med. 2006;174:1132-1138.
32. Smith TG, Balanos GM, Croft QP, et al. The increase in pulmonary arterial pressure caused by hypoxia depends on iron status. J Physiol. 2008;586:5999-6005.
33. Joyner MJ, Johnson BD. Iron lung? New ideas about hypoxic pulmonary vasoconstriction. J Physiol. 2008;586:5837-5838.
34. Suggett AJ, Barer GR, Mohammed FH, Gill GW. The effects of localised hyperventilation on ventilation/perfusion (V./Q. ) ratios and gas exchange in the dog lung. Clin Sci. 1982;63:497-503.
35. Rudolph AM, Yuan S. Response of the pulmonary vasculature to hypoxia and H+ ion concentration changes. J Clin Invest. 1966;45:399-411.
36. Benumof JL, Wahrenbrock EA. Blunted hypoxic pulmonary vasoconstriction by increased lung vascular pressures. J Appl Physiol. 1975;38:846-850.
37. Reid PG, Fraser A, Watt A, Henderson A, Routledge P. Acute haemodynamic effects of adenosine in conscious man. Eur Heart J. 1990;11:1018-1028.
38. Kalra L, Bone MF. Effect of nifedipine on physiologic shunting and oxygenation in chronic obstructive pulmonary disease. Am J Med. 1993;94:419-423.
39. Lowson SM. Inhaled alternatives to nitric oxide. Anesthesiology. 2002;96:1504-1513.
40. Bigatello LM, Hurford WE, Hess D. Use of inhaled nitric oxide for ARDS. Respir Care Clin N Am. 1997;3:437-458.
41. Kavanah BP, Mouchawar A, Goldsmith J, et al. Effects of inhaled NO and inhibition of endogenous NO synthesis in oxidant-induced acute lung injury. J Appl Physiol. 1994;76:1324-1329.
42. Malarkkan N, Snook NJ, Lumb AB. New aspects of ventilation in acute lung injury. Anaesthesia. 2003;58:647-667.
43. Gomberg-Maitland M, Olschewski H. Prostacyclin therapies for the treatment of pulmonary arterial hypertension. Eur Respir J. 2008;31:891-901.
44. Fischer LG, Van Aken H, Bürkle H. Management of pulmonary hypertension: physiological and pharmacological considerations for anesthesiologists. Anesth Analg. 2003;96:1603-1616.
45. Kiely DG, Cargill RI, Wheeldon NM, Coutie WJ, Lipworth BJ. Haemodynamic and endocrine effects of type 1 angiotensin II receptor blockade in patients with hypoxaemic cor pulmonale. Cardiovasc Res. 1997;33:201-208.
46. Galiè N, Ghofrani HA, Torbicki A, et al. Sildenafil citrate therapy for pulmonary arterial hypertension. N Engl J Med. 2005;353:2148-2157.
47. Swan HJC, Ganz W. Hemodynamic monitoring: a personal and historical perspective. Can Med Assoc J. 1979;121:868-871.
*48. Pinsky MR. Pulmonary artery occlusion pressure. Intensive Care Med. 2003;29:19-22.
49. Winter SM. Clinical non-invasive measurement of effective pulmonary blood flow. Int J Clin Monit Comput. 1995;12:121-140.