Chapter 10 Carbon dioxide
 Most of the carbon dioxide carried in blood is in the form of bicarbonate, production and breakdown of which is catalysed by the enzyme carbonic anhydrase. Formation of bicarbonate is enhanced by the buffering of hydrogen ions by haemoglobin, and by active removal of bicarbonate ions from the red blood cell by Band 3 protein.
Carbon dioxide is the end-product of aerobic metabolism and is produced almost entirely in the mitochondria where the Pco2 is highest. From its point of origin, there are a series of partial pressure gradients as carbon dioxide passes through the cytoplasm and the extracellular fluid into the blood. In the lungs, the Pco2 of the blood entering the pulmonary capillaries is normally higher than the alveolar Pco2, and therefore carbon dioxide diffuses from the blood into the alveolar gas, where a dynamic equilibrium is established. The equilibrium concentration equals the ratio between carbon dioxide output and alveolar ventilation (page 139). Blood leaving the alveoli has, for practical purposes, the same Pco2 as alveolar gas, and arterial blood Pco2 is usually very close to ‘ideal’ alveolar Pco2.
Abnormal levels of arterial Pco2 occur in a number of pathological states and have many important physiological effects throughout the body, some as a result of changes in pH, and these are discussed in Chapter 23. Fundamental to all problems relating to Pco2 is the mechanism by which carbon dioxide is carried in the blood.1
Carriage of Carbon Dioxide in Blood
In Physical Solution
Carbon dioxide is moderately soluble in water. According to Henry’s law of solubility:
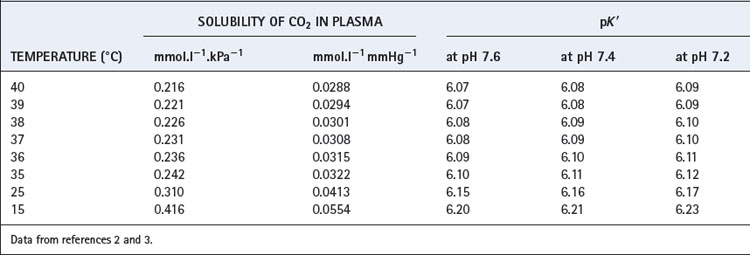
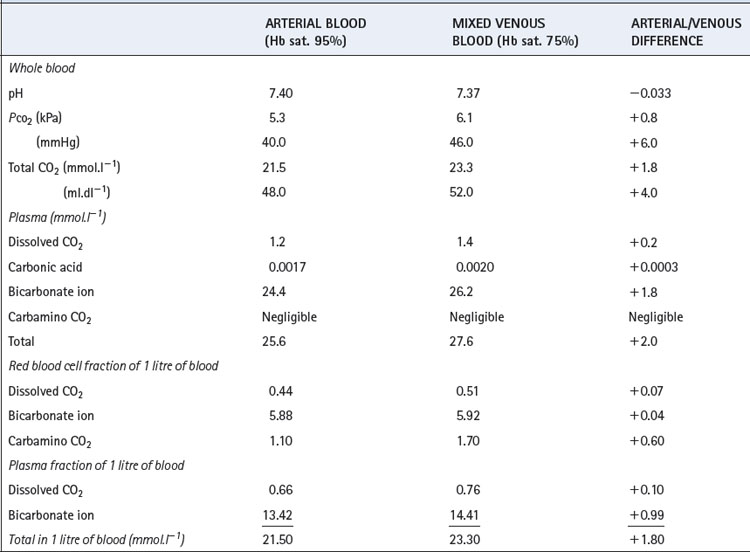
The solubility coefficient of carbon dioxide (α) is expressed in units of mmol.l−1 kPa−1 (or mmol.l−1.mmHg−1). The value depends on temperature, and examples are listed in Table 10.1. The contribution of dissolved carbon dioxide to the total carriage of the gas in blood is shown in Table 10.2.
As Carbonic Acid
In solution, carbon dioxide hydrates to form carbonic acid:

The equilibrium of this reaction is far to the left under physiological conditions. Published work shows some disagreement on the value of the equilibrium constant, but it seems likely that less than 1% of the molecules of carbon dioxide are in the form of carbonic acid. There is a very misleading medical convention by which both forms of carbon dioxide in equation (2) are sometimes shown as carbonic acid. Thus the term H2CO3 may, in some situations, mean the total concentrations of dissolved CO2 and H2CO3; to avoid confusion it is preferable to use αPco2 as in equation (7) below. This does not apply to equations (4) and (5) below, where H2CO3 has its correct meaning.
Carbonic anhydrase.4,5 The reaction of carbon dioxide with water (equation 2) is non-ionic and slow, requiring a period of minutes for equilibrium to be attained. This would be far too slow for the time available for gas exchange in pulmonary and systemic capillaries if the reaction were not catalysed in both directions by the enzyme carbonic anhydrase (CA). In addition to its role in the respiratory transport of carbon dioxide, CA plays a fundamental role in many body tissues, for example the generation of hydrogen and bicarbonate ions in secretory organs including the stomach and kidney, and the intracellular transfer of carbon dioxide within both skeletal and cardiac muscle. In mammals there are now 16 isozymes of CA identified, of which two are involved in blood carbon dioxide transport.
Red blood cells (RBCs) contain large amounts of CA II, one of the fastest enzymes known, whilst CA IV is a membrane bound isozyme present in pulmonary capillaries. There is no CA activity in plasma. Carbonic anhydrase is a zinc-containing enzyme of low molecular weight, and there is now extensive knowledge of the molecular mechanisms of CA.5,6 First, the zinc atom hydrolyses water to a reactive Zn–OH− species, whilst a nearby histidine residue acts as a ‘proton shuttle’, removing the H+ from the metal-ion centre and transferring it to any buffer molecules near the enzyme. Carbon dioxide then combines with the Zn–OH− species and the  formed rapidly dissociates from the zinc atom. The maximal rate of catalysis is determined by the buffering power in the vicinity of the enzyme, as the speed of the enzyme reactions are so fast that its kinetics are determined mostly by the ability of the surrounding buffers to provide/remove H+ ions to/from the enzyme.
Carbonic anhydrase is inhibited by a large number of compounds, including some drugs such as thiazide diuretics and various heterocyclic sulphonamides, of which acetazolamide is the most important. Acetazolamide is non-specific for the different CA isozymes and so inhibits CA in all organs at a dose of 5–20 mg.kg−1 and has no other pharmacological effects of importance. Acetazolamide has been used extensively in the study of carbonic anhydrase and has revealed the surprising fact that it is not essential to life. The quantity and efficiency of RBC CA is such that more than 98% of activity must be blocked before there is any discernible change in carbon dioxide transport, though when total inhibition is achieved, Pco2 gradients between tissues and alveolar gas are increased, pulmonary ventilation is increased and alveolar Pco2 is decreased.
As Bicarbonate Ion
The largest fraction of carbon dioxide in the blood is in the form of bicarbonate ion, which is formed by ionisation of carbonic acid thus:

The second dissociation occurs only at high pH (above 9) and is not a factor in the carriage of carbon dioxide by the blood. The first dissociation is, however, of the greatest importance within the physiological range. The pK1′ is about 6.1 and carbonic acid is about 96% dissociated under physiological conditions.
According to the law of mass action:
where K1′ is the equilibrium constant of the first dissociation. The subscript 1 indicates that it is the first dissociation, and the prime indicates that we are dealing with concentrations rather than the more correct thermodynamic activities.
Rearrangement of equation (4) gives the following:
The left-hand side is the hydrogen ion concentration, and this equation is the non-logarithmic form of the Henderson–Hasselbalch equation.7 The concentration of carbonic acid cannot be measured and the equation may be modified by replacing this term with the total concentration of dissolved CO2 and H2CO3, most conveniently quantified as αPco2 as described above. The equation now takes the form:
The new constant K′ is the apparent first dissociation constant of carbonic acid, and includes a factor that allows for the substitution of total dissolved carbon dioxide concentration for carbonic acid.
The equation is now in a useful form and permits the direct relation of plasma hydrogen ion concentration, Pco2 and bicarbonate concentration, all quantities that can be measured. The value of K′ cannot be derived theoretically and is determined experimentally by simultaneous measurements of the three variables. Under normal physiological conditions, if [H+] is in nmol.l−1, Pco2 in kPa, and [] in mmol.l−1, the value of the combined parameter (αK′) is about 180. If Pco2 is in mmHg, the value of the parameter is 24.
Most people prefer to use the pH scale and so follow the approach described by Hasselbalch in 1916 and take logarithms of the reciprocal of each term in equation (6) with the following familiar result:8
where pK′ has an experimentally derived value of the order of 6.1, but varies with temperature and pH (see Table 10.1). ‘[CO2]’ refers to the total concentration of carbon dioxide in all forms (dissolved CO2, H2CO3 and bicarbonate) in plasma and not in whole blood.
Carbamino Carriage
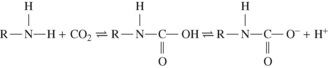
Amino groups in the uncharged R–NH2 form have the ability to combine directly with carbon dioxide to form a carbamic acid. At body pH, the carbamic acid then dissociates almost completely to carbamate:
In a protein, the amino groups involved in the peptide linkages between amino acid residues cannot combine with carbon dioxide. The potential for carbamino carriage is therefore restricted to the one terminal amino group in each protein chain and to the side chain amino groups that are found in lysine and arginine. Since both hydrogen ions and carbon dioxide compete to react with uncharged amino groups, the ability to combine with carbon dioxide is markedly pH dependent. The terminal α-amino groups are the most effective at physiological pH, and one binding site per protein monomer is more than sufficient to account for the quantity of carbon dioxide carried as carbamino compounds.
Carbamino carriage and haemoglobin. Only very small quantities of carbon dioxide are carried in carbamino compounds with plasma proteins. Almost all is carried by haemoglobin, and reduced haemoglobin is about 3.5 times as effective as oxyhaemoglobin (Figure 10.1), this being a major component of the Haldane effect (see below). Carbon dioxide binds to α-amino groups at the ends of both the α- and β-chains of haemoglobin. Earlier studies of CO2-haemoglobin reactions using free haemoglobin solution overestimated the magnitude of carbamino binding with haemoglobin, as later work showed that 2,3-diphosphoglycerate (2,3-DPG) present in vivo antagonises the binding of CO2 with haemoglobin. This antagonism results from direct competition between CO2 and 2,3-DPG for the end-terminal valine of the β-chain of haemoglobin, an effect that is not observed on the α-chains.
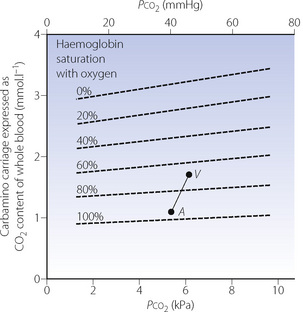
Fig. 10.1 The broken lines on the graph indicate the carbamino carriage of carbon dioxide at different levels of oxygen saturation of haemoglobin. It will be seen that oxygen saturation has a far greater influence on carbamino carriage than the actual Pco2 (abscissa). Points A and V represent the saturation and Pco2 of arterial and venous blood respectively. Note that the arterial/venous difference in carbamino carriage is large in relation to the actual amounts of carbamino carriage.
The Haldane effect. This is the difference in the quantity of carbon dioxide carried, at constant Pco2, in oxygenated and deoxygenated blood (Figure 10.2). Although the amount of carbon dioxide carried in the blood by carbamino carriage is small, the difference between the amount carried in venous and arterial blood is about a third of the total arterial/venous difference (Table 10.2). This therefore accounts for the major part of the Haldane effect, the remainder being due to the increased buffering capacity of reduced haemoglobin, which is discussed below. When the Haldane effect was described by Christiansen, Douglas & Haldane in 1914, they believed that the whole effect was due to altered buffering capacity:9 carbamino carriage was not demonstrated until much later (1934).10
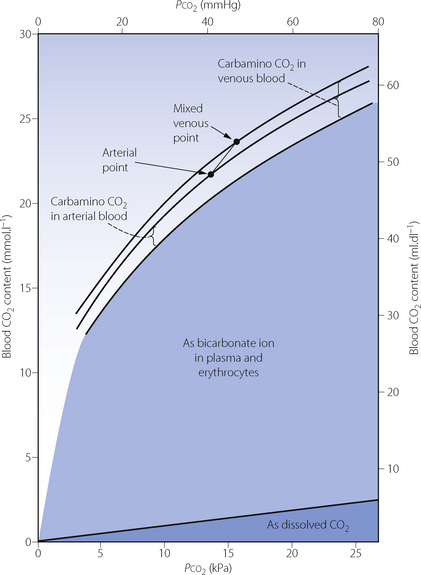
Fig. 10.2 Components of the CO2 dissociation curve for whole blood. Dissolved CO2 and bicarbonate ion vary with Pco2 but are little affected by the state of oxygenation of the haemoglobin. (Increased basic properties of reduced haemoglobin cause a slight increase in formation of bicarbonate ion.) Carbamino carriage of CO2 is strongly influenced by the state of oxygenation of haemoglobin but hardly at all by Pco2.
Formation of carbamino compounds does not require the dissolved carbon dioxide to be hydrated and so is independent of carbonic anhydrase. The reaction is very rapid and would be of particular importance in a subject who had received a carbonic anhydrase inhibitor.
Effect of Buffering Power of Proteins on Carbon Dioxide Carriage
Amino and carboxyl groups concerned in peptide linkages have no buffering power. Neither have most side chain groups (e.g. in lysine and glutamic acid) because their pK values are far removed from the physiological range of pH. In contrast is the imidazole group of the amino acid histidine, which is almost the only amino acid to be an effective buffer in the normal range of pH. Imidazole groups constitute the major part of the considerable buffering power of haemoglobin, each tetramer containing 38 histidine residues. The buffering power of plasma proteins is less and is directly proportional to their histidine content.
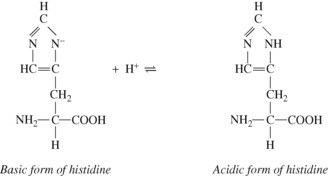
The four haem groups of a molecule of haemoglobin are attached to the corresponding four amino acid chains at one of the histidine residues on each chain (page 188), and the dissociation constant of the imidazole groups of these four histidine residues is strongly influenced by the state of oxygenation of the haem. Reduction causes the corresponding imidazole group to become more basic. The converse is also true: in the acidic form of the imidazole group of the histidine, the strength of the oxygen bond is weakened. Each reaction is of great physiological interest and both effects were noticed many decades before their mechanisms were elucidated.
Total deoxygenation of the haemoglobin in blood would raise the pH by about 0.03 if the Pco2 were held constant at 5.3 kPa (40 mmHg), and this would correspond roughly to the addition of 3 mmol of base to 1 litre of blood. The normal degree of desaturation in the course of the change from arterial to venous blood is about 25%, corresponding to a pH increase of about 0.007 if Pco2 remains constant. In fact, Pco2 rises by about 0.8 kPa (6 mmHg), which would cause a decrease of pH of 0.040 if the oxygen saturation were to remain the same. The combination of an increase of Pco2 of 0.8 kPa and a decrease of saturation of 25% thus results in a fall of pH of 0.033 (Table 10.2).
Distribution of Carbon Dioxide within the Blood
Table 10.2 shows the forms in which carbon dioxide is carried in normal arterial and mixed venous blood. Although the amount carried in solution is small, most of the carbon dioxide enters and leaves the blood as CO2 itself (Figure 10.3). Within the plasma there is little chemical combination of carbon dioxide, for three reasons. First, there is no carbonic anhydrase in plasma and therefore carbonic acid is formed only very slowly. Secondly, there is little buffering power in plasma to promote the dissociation of carbonic acid. Thirdly, the formation of carbamino compounds by plasma proteins is not great, and must be almost identical for arterial and venous blood.
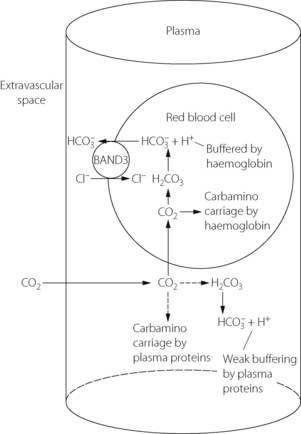
Fig. 10.3 How carbon dioxide enters the blood in molecular form. Within the plasma, there is only negligible carbamino carriage by plasma proteins and a slow rate of hydration to carbonic acid due to the absence of carbonic anhydrase. The greater part of CO2 diffuses into the red blood cell where conditions for carbamino carriage (by haemoglobin) are more favourable. In addition, more rapid formation of carbonic acid is facilitated by carbonic anhydrase, the removal of hydrogen ions by haemoglobin buffering and the transfer of bicarbonate out of the red blood cell in exchange for chloride by the Band 3 ion-exchange protein (Hamburger shift).
Carbon dioxide can, however, diffuse freely into the RBC, where two courses are open. First, increasing intracellular Pco2 will increase carbamino carriage of CO2 by haemoglobin, an effect greatly enhanced by the fall in oxygen saturation which is likely to be occurring at the same time (Figure 10.1). The second course is hydration and dissociation of CO2 to produce hydrogen and bicarbonate ions, facilitated by the presence of carbonic anhydrase in the RBC. However, accumulation of intracellular hydrogen and bicarbonate ions will quickly tip the equilibrium of the reaction against further dissociation of carbonic acid, a situation that is avoided in the RBC by two mechanisms:
 RBC cytoskeleton. The cytoplasmic domain of band 3 acts as an anchoring site for many of the proteins involved in the maintenance of cell shape and membrane stability such as ankyrin and spectrin. A genetically engineered deficiency of band 3 in animals results in small, fragile, spherical RBCs,12 and in humans an inherited defect of band 3 is responsible for hereditary spherocytosis in which RBCs become spheroidal in shape and fragile.15,16 RBC shape and deformability are now known to be important in oxygen transport in the capillaries (page 148) and it is possible that band 3 is involved in bringing about these shape changes. Carbonic anhydrase. Band 3 is also closely associated with carbonic anhydrase, and the protein complex formed is believed to act as a metabolon, a term describing the channelling of a substrate directly between proteins that catalyse sequential reactions in a metabolic pathway.13 In this case the substrate is bicarbonate, which after its formation by CA is transferred directly to band 3, which rapidly exports it from the cell. Haemoglobin. Band 3 is also associated with haemoglobin, with which it is believed to form another metabolon system exporting nitric oxide derived nitrosothiols, possibly to regulate capillary blood flow and oxygen release from haemoglobin (page 195). Glycolytic enzymes. Some of the enzymes involved in glycolysis (page 198), including glyceraldehyde-3-phosphate dehydrogenase, phosphofructokinase and aldolase, are bound to band 3; the functional significance of this is unknown.
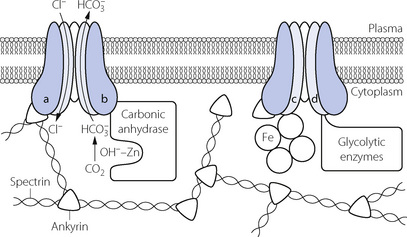
Fig. 10.4 Proteins associated with band 3 in the red blood cell membrane. Band 3 has twelve trans-membrane domains forming the bicarbonate/chloride exchange ion channel, and four globular cytoplasmic domains (a–d), each of which is associated with different groups of intra-cellular proteins. (a) Ankyrin and spectrin, to maintain and possibly alter red cell shape; (b) Carbonic anhydrase, with which band 3 acts as a metabolon to directly export bicarbonate ions from the red cell; (c) Haemoglobin, with which band 3 may act as a metabolon to export nitric oxide; (d) Glycolytic enzymes – the functional significance of this association is unknown.
In the pulmonary capillary, where Pco2 is low, the series of events described above goes into reverse and the CO2 released from the RBC diffuses into the alveolus and is excreted.
Dissociation Curves of Carbon Dioxide
Figure 10.2 shows the classic form of the dissociation curve of carbon dioxide relating blood content to tension. For decades there has been great interest in curves that relate any pair of the following: (1) plasma bicarbonate concentration; (2) Pco2; (3) pH. These three quantities are related by the Henderson–Hasselbalch equation (equation 7) and therefore the third variable can always be derived from the other two. The most famous is the Siggaard-Andersen plot, which relates Pco2 on a logarithmic scale to pH (Figure 10.5). These graphs can be used to explore the effects of changes in respiratory and metabolic acid-base balance, but care must be taken in using these in vitro data in intact subjects. For example, if the Pco2 of an entire patient is altered, the pH changes are not the same as those of a blood sample of which the Pco2 is altered in vitro. This is because the blood of a patient is in continuity with the extracellular fluid (of very low buffering capacity) and also with intracellular fluid (of high buffering capacity). Bicarbonate ions pass rapidly and freely across the various interfaces. As a result, the in vivo change in pH is normally greater than the in vitro change in the patient’s blood when subjected to the same change in Pco2.

Fig. 10.5 The Siggaard-Andersen nomogram. The blue line shows the normal in vitro relationship between pH and log Pco2, and is derived by varying the Pco2 of a blood sample and measuring its pH. The slope is that of a line joining the normal arterial point (shown by a small circle) and the relevant point on the haemoglobin scale. Intersections of this line indicate three other indices of metabolic acid–base state: buffer base, standard bicarbonate and base excess. If both pH and Pco2 are measured in vivo a single point may be plotted on the graph and a line parallel to the in vitro one is drawn that passes through this point. All three acid–base indices can then be read from the nomogram. This process is now routinely performed mathematically by blood-gas analysers.
(Reprinted from reference 17 by permission of Taylor & Francis AS).
Factors Influencing the Carbon Dioxide Tension in the Steady State
In common with other catabolites, the level of carbon dioxide in the body fluids depends on the balance between production and elimination. There is a continuous gradient of Pco2 from the mitochondria to the expired air and thence to ambient air. The Pco2 in all cells is not identical, but is lowest in tissues with the lowest metabolic activity and the highest perfusion (e.g. skin) and highest in tissues with the highest metabolic activity for their perfusion (e.g. the myocardium). Therefore the Pco2 of venous blood differs substantially from one tissue to another.
In the pulmonary capillaries, carbon dioxide passes into the alveolar gas and this causes the alveolar Pco2 to rise steadily during expiration. During inspiration, the inspired gas dilutes the alveolar gas and the Pco2 falls by about 0.4 kPa, imparting a sawtooth curve to the alveolar Pco2 when it is plotted against time (Figure 10.6).
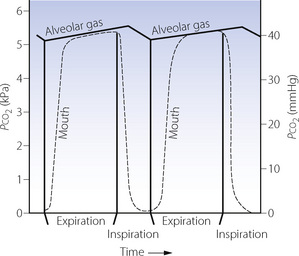
Fig. 10.6 Changes in alveolar and mouth Pco2 during the respiratory cycle. The alveolar Pco2 is shown by a continuous curve, and the mouth Pco2 by the broken curve. The mouth Pco2 falls at the commencement of inspiration but does not rise during expiration until the anatomical dead space gas is washed out. The alveolar Pco2 rises during expiration and also during the early part of inspiration until fresh gas penetrates the alveoli after the anatomical dead space is washed out. The alveolar Pco2 then falls until expiration commences. This imparts a sawtooth curve to the alveolar Pco2.
Blood leaving the pulmonary capillaries has a Pco2 that is very close to that of the alveolar gas and, therefore, varies with time in the same manner as the alveolar Pco2. These oscillations in arterial Pco2 with respiratory rate may be involved in respiratory control, particularly during exercise and at altitude.18 There is also a regional variation, with Pco2 inversely related to the ventilation/perfusion ratio of different parts of the lung (Figure 8.12). The mixed arterial Pco2 is the integrated mean of blood from different parts of the lung, and a sample drawn over several seconds will average out the cyclical variations.
It is more convenient to consider partial pressure than content, because carbon dioxide always moves in accord with partial pressure gradients even if they are in the opposite direction to concentration gradients. Also, the concept of partial pressure may be applied with equal significance to gas and liquid phases, content having a rather different connotation in the two phases. Furthermore, the effects of carbon dioxide (e.g. upon respiration) are a function of partial pressure rather than content. Finally, it is easier to measure blood Pco2 than CO2 content. Normal values for partial pressure and content are shown in Figure 10.7.
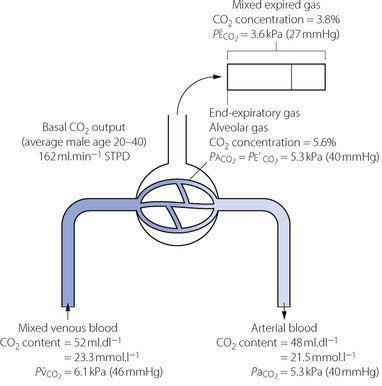
Fig. 10.7 Normal values of CO2 levels. These normal values are rounded off and ignore the small difference in Pco2 between end-expiratory gas, alveolar gas and arterial blood. Actual values of Pco2 depend mainly on alveolar ventilation but the differences depend on maldistribution; the alveolar/end-expiratory Pco2 difference depends on alveolar dead space and the very small arterial/alveolar Pco2 difference on shunt. Scatter of  ratios makes a small contribution to both alveolar/end-expiratory and arterial/alveolar Pco2 gradients. The arterial/mixed venous CO2 content difference is directly proportional to CO2 output and inversely proportional to cardiac output. Secondary symbols: a, alveolar; a, arterial;
  , mixed expired; e′, end-expiratory;
  , mixed venous.
Each factor that influences the Pco2 has already been mentioned in this book and in this chapter they will be drawn together, illustrating their relationship to one another. It is convenient first to summarise the factors influencing the alveolar Pco2, and then to consider the factors that influence the relationship between the alveolar and the arterial Pco2 (Figure 10.8).
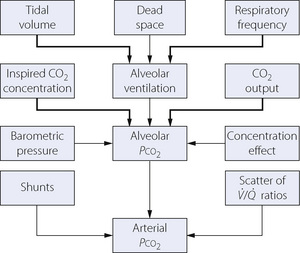
Fig. 10.8 Summary of factors that influence Pco2; the more important ones are indicated with the thicker arrows. In the steady state, the CO2 output of a resting subject usually lies within the range 150–200 ml.min−1 and the alveolar Pco2 is largely governed by the alveolar ventilation, provided that the inspired CO2 concentration is zero. See text for explanation of the concentration effect.
The Alveolar Pco2 (Paco2)
Carbon dioxide is constantly being added to the alveolar gas from the pulmonary arterial blood, and removed from it by the alveolar ventilation. Therefore, ignoring inspired carbon dioxide, it follows that:
This axiomatic relationship is the basis for prediction of the alveolar concentration of any gas that enters or leaves the body. With inclusion of the inspired concentration, it may be written as a form of alveolar air equation (page 139), for which the version for carbon dioxide is as follows:
This equation includes all the more important factors influencing Pco2 (Figure 10.8), and examples of the hyperbolic relationship between Pco2 and alveolar ventilation are shown in Figure 10.9. Individual factors will now be considered.
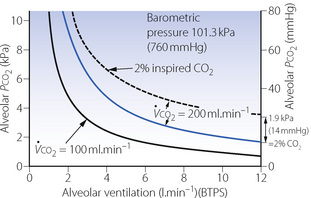
Fig. 10.9 The effect of CO2 output, alveolar ventilation and inspired CO2 concentration on alveolar Pco2. The lowest continuous curve shows the relationship between ventilation and alveolar Pco2 for a CO2 output of 100 ml.min−1 (STPD). The blue curve shows the normal relationship when the CO2 output is 200 ml.min−1. The broken curve represents the relationship when the CO2 output is 200 ml.min−1 and there is an inspired CO2 concentration of 2%. Two per cent CO2 is equivalent to about 1.9 kPa (14 mmHg) and each point on the broken curve is 1.9 kPa above the upper of the two continuous curves.
The dry barometric pressure is not a factor of much importance in the determination of alveolar Pco2, and normal variations of barometric pressure at sea level are unlikely to influence the Pco2 by more than 0.3 kPa (2 mmHg). At high altitude, the hypoxic drive to ventilation lowers the Pco2 (Chapter 17).
The mean inspired CO2 concentration. The effect of inspired carbon dioxide on the alveolar Pco2 is additive. If, for example, a patient breathes gas containing 4.2% carbon dioxide (Pco2 = 4.0 kPa or 30 mmHg), the alveolar Pco2 will be raised 4.0 kPa above the level that it would be if there were no carbon dioxide in the inspired gas, and other factors, including ventilation, remained the same.
Carbon dioxide output. It is carbon dioxide output and not production that directly influences the alveolar Pco2. Output equals production in a steady state, but they may be quite different during unsteady states. During acute hypoventilation, much of the carbon dioxide production is diverted into the body stores, so that the output may temporarily fall to very low figures until the alveolar carbon dioxide concentration has risen to its new level. Conversely, acute hyperventilation results in a transient increase in carbon dioxide output. A sudden fall in cardiac output decreases the carbon dioxide output until the carbon dioxide concentration in the mixed venous blood rises. The unsteady state is considered in more detail later in this chapter.
Alveolar ventilation for present purposes means the product of the respiratory frequency and the difference between the tidal volume and the physiological dead space (page 128). It can change over very wide limits and is the most important factor influencing alveolar Pco2. Factors governing ventilation are considered in Chapter 5, and dead space in Chapter 8.
The concentration effect. Apart from the factors shown in the equation above and in Figure 10.9, the alveolar Pco2 may be temporarily influenced by net transfer of soluble inert gases across the alveolar/capillary membrane. Rapid uptake of an inert gas increases the concentration (and partial pressure) of carbon dioxide (and oxygen) in the alveolar gas. This occurs, for example, at the beginning of an anaesthetic when large quantities of nitrous oxide are passing from the alveolar gas into the body stores, and a much smaller quantity of nitrogen is passing from the body into the alveolar gas. The converse occurs during elimination of the inert gas and results in transient reduction of alveolar Pco2 and Po2.
The End-Expiratory Pco2 
In the normal, healthy, conscious subject, the end-expiratory gas consists almost entirely of alveolar gas. If, however, appreciable parts of the lung are ventilated but not perfused, they will contribute a significant quantity of CO2-free gas from the alveolar dead space to the end-expiratory gas (see Figure 8.9). As a result, the end-expiratory Pco2 will have a lower Pco2 than that of the alveoli which are perfused. Gas cannot be sampled selectively from the perfused alveoli. However, since arterial Pco2 usually approximates closely to Pco2 of the perfused alveoli (see below), it is possible to compare arterial and end-expiratory Pco2 to demonstrate the existence of an appreciable proportion of underperfused alveoli. Studies during anaesthesia have, for example, shown an arterial/end-tidal Pco2 gradient between 0.7 and 1.3 kPa (5–10 mmHg).19,20
The Alveolar/Arterial Pco2 Gradient
For reasons that have been discussed in Chapter 9, we may discount the possibility of any significant gradient between the Pco2 of alveolar gas and that of pulmonary end-capillary blood (page 151). Arterial Pco2 may, however, be slightly greater than the mean alveolar Pco2 because of shunting or scatter of ventilation/perfusion ratios. Factors governing the magnitude of the gradient were considered in Chapter 8, where it was shown that a shunt of 10% will cause an alveolar/arterial Pco2 gradient of only about 0.1 kPa (0.7 mmHg) (Figure 8.10). Because the normal degree of ventilation/perfusion ratio scatter causes a gradient of the same order, neither has much significance for carbon dioxide (in contrast to oxygen), and there is an established convention by which the arterial and ‘ideal’ alveolar Pco2 values are taken to be identical. It is only in exceptional patients with, for example, a shunt in excess of 30% that the gradient is likely to exceed 0.3 kPa (2 mmHg).
The Arterial Pco2 
Pooled results for the normal arterial Pco2 reported by various authors show a mean of 5.1 kPa (38.3 mmHg) with 95% confidence limits of ±1.0 kPa (7.5 mmHg). This means that 5% of normal subjects will lie outside these limits and it is therefore preferable to call it the reference range rather than the normal range. There is no evidence that Pco2 is influenced by age in the healthy subject.
Carbon Dioxide Stores and the Unsteady State
The quantity of carbon dioxide and bicarbonate ion in the body is very large – about 120 litres, which is almost 100 times greater than the volume of oxygen. Therefore, when ventilation is altered out of accord with metabolic activity, carbon dioxide levels change only slowly and new equilibrium levels are only attained after about 20–30 minutes. In contrast, corresponding changes in oxygen levels are very rapid.
Figure 10.10 shows a three-compartment hydraulic model in which depth of water represents Pco2 and the volume in the various compartments corresponds to volume of carbon dioxide. The metabolic production of carbon dioxide is represented by the variable flow of water from the supply tank. The outflow corresponds to alveolar ventilation, and the controller watching the Pco2 represents the central chemoreceptors. The rapid compartment represents circulating blood, brain, kidneys and other well-perfused tissues. The medium compartment represents skeletal muscle (resting) and other tissues with a moderate blood flow. The slow compartment includes bone, fat and other tissues with a large capacity for carbon dioxide. Each compartment has its own time constant (see Appendix E), and the long time constants of the medium and slow compartments buffer changes in the rapid compartment.
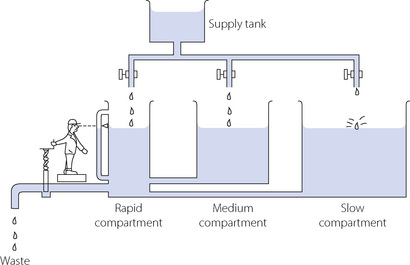
Fig. 10.10 A hydrostatic analogy of the elimination of carbon dioxide. See text for full description.
Hyperventilation is represented by a wide opening of the outflow valve with subsequent exponential decline in the levels in all three compartments, the rapid compartment falling most quickly. The rate of decrease of Pco2 is governed primarily by ventilation and the capacity of the stores. Hypoventilation is fundamentally different. The rate of increase of Pco2 is now limited by the metabolic production of carbon dioxide, which is the only factor directly increasing the quantity of carbon dioxide in the body compartments. Therefore, the time course of the increase of Pco2 following step decrease of ventilation is not the mirror image of the time course of decrease of Pco2 when ventilation is increased. The rate of rise is much slower than the rate of fall, which is fortunate for patients in asphyxial situations.
When all metabolically produced carbon dioxide is retained, the rate of rise of arterial Pco2 is of the order of 0.4–0.8 kPa.min−1 (3–6 mmHg.min−1). This is the resultant of the rate of production of carbon dioxide and the capacity of the body stores for carbon dioxide. During hypoventilation, the rate of increase in Pco2 will be less than this and Figure 10.11 shows typical curves for Pco2 increase and decrease following step changes in ventilation of anaesthetised patients. The time course of rise of Pco2 after step reduction of ventilation is faster when the previous level of ventilation has been of short duration.21
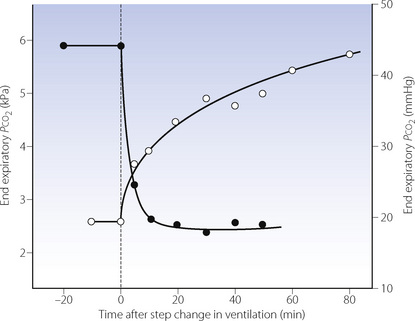
Fig. 10.11 Time course of changes in end-expiratory Pco2 following step changes in ventilation. The solid circles indicate the changes in end-expiratory Pco2 that follow a change in ventilation from 3.3 to 14 l.min−1. The open circles show the change following a reduction in ventilation from 14 to 3.3 l.min−1 in the same patient. During the fall in Pco2, half the total change is completed in about 3 minutes; during the rise in Pco2, half-change takes approximately 16 minutes.
The difference in the rate of change of Pco2 and Po2 after a step change in ventilation (see Figure 11.19) has two important implications for monitoring and measurement. First, changes in Po2 (or oxygen saturation) will often provide an earlier warning of acute hypoventilation than will the capnogram, provided that the alveolar Po2 is not much above the normal range. However, in the steady state Pco2 gives the best indication of the adequacy of ventilation, because oxygenation is so heavily influenced by intra-pulmonary shunting and the inspired oxygen concentration. Secondly, step changes in ventilation are followed by temporary changes in the respiratory exchange ratio because, in the unsteady state, carbon dioxide output changes more than oxygen uptake. However, if the ventilation is held constant at its new level, the respiratory exchange ratio must eventually return to the value determined by the metabolic process of the body.
Cardiac output and CO2 transport. In the normal subject, fluctuations in cardiac output have little effect on arterial, alveolar or end-expiratory Pco2 because of the efficiency of the chemical control of breathing. However, with a constant level of artificial ventilation, for example during anaesthesia or cardiopulmonary resuscitation, the situation is quite different. In the extreme circumstance of a total cessation of cardiac output, then alveolar and end-expiratory Pco2 will fall dramatically as the delivery of blood containing carbon dioxide to the lung also ceases. In a similar fashion, a sudden reduction in cardiac output during anaesthesia causes an abrupt reduction in end-expiratory Pco2.22 This almost certainly results from increased alveolar dead space caused by an increase in the number of non-perfused but ventilated alveoli (Zone 1, page 105). If low cardiac output is sustained for more than a few minutes, blood Pco2 will rise and the expired Pco2 returns towards normal as the blood passing through the still-perfused lung regions releases more carbon dioxide into the expired gas. Apart from being a useful early warning of cardiovascular catastrophe during anaesthesia, the measurement of expired carbon dioxide has also been advocated during cardiopulmonary resuscitation both as a method of monitoring the efficacy of chest compressions and as an indicator of the return of spontaneous cardiac output.23
Apnoea
When a patient becomes apnoeic while breathing air, alveolar gas reaches equilibrium with mixed venous blood within a few minutes. Assuming normal starting conditions and ignoring changes in the composition of the recirculated mixed venous blood, this would entail a rise of alveolar Pco2 from 5.3 to 6.1 kPa (40 to 46 mmHg) and a fall of Po2 from 14 to 5.3 kPa (105 to 40 mmHg). These changes correspond to the uptake of 230 ml of oxygen but the output of only 21 ml of carbon dioxide. Carbon dioxide appears to reach equilibrium within about 10 seconds,24 while oxygen would take about a minute, being limited by the ability of the cardiac output and the arterial/mixed venous oxygen content difference to remove some two thirds of the oxygen in the alveolar gas (normally about 450 ml).
These calculations assume that alveolar gas is not replenished from outside the patient. What actually happens to the arterial blood gases in apnoea depends upon the patency of the airway and the composition of the ambient gas if the airway is patent.
With airway occlusion. As described above, there is rapid attainment of equilibrium between alveolar and mixed venous Pco2. Thereafter, arterial, alveolar and mixed venous Pco2 values remain close, and, with recirculation of the blood, increase together at the rate of about 0.4–0.8 kPa.min−1 (3–6 mmHg.min−1), more than 90% of the metabolically produced carbon dioxide passing into the body stores. Alveolar Po2 decreases close to the mixed venous Po2 within about a minute, and then decreases further as recirculation continues. The lung volume falls by the difference between the oxygen uptake and the carbon dioxide output. Initially the rate would be 230 − 21 = 209 ml.min−1. The change in alveolar Po2 may be calculated, and gross hypoxia supervenes after about 90 seconds if apnoea with airway occlusion follows air breathing at functional residual capacity.
With patent airway and air as ambient gas. The initial changes are as described above. However, instead of the lung volume falling by the net gas exchange rate (initially 209 ml.min−1), this volume of ambient gas is drawn in by mass movement down the trachea. If the ambient gas is air, the oxygen in it will be removed but the nitrogen will accumulate and rise above its normal concentration until gross hypoxia supervenes after about 2 minutes. This is likely to occur when the accumulated nitrogen has reached 90% since the alveolar carbon dioxide concentration will then have reached about 8%. Carbon dioxide elimination cannot occur as there is mass-movement of air down the trachea, preventingloss of carbon dioxide by either convection or diffusion.
With patent airway and oxygen as the ambient gas. Oxygen is continuously removed from the alveolar gas as described above, but is replaced by oxygen drawn in by mass-movement. No nitrogen is added to the alveolar gas, and the alveolar Po2 only falls as fast as the Pco2 rises (about 0.4–0.8 kPa.min−1 or 3–6 mmHg.min−1). Therefore the patient will not become seriously hypoxic for several minutes. If the patient has been breathing 100% oxygen prior to the respiratory arrest, the starting alveolar Po2, would be of the order of 88 kPa (660 mmHg) and therefore the patient could theoretically survive about 100 minutes of apnoea provided that his airway remained clear and he remained connected to a supply of 100% oxygen. This does, in fact, happen and has been demonstrated in both animals and man, and is referred to as apnoeic mass-movement oxygenation or diffusion respiration. The phenomenon enjoyed a brief vogue in anaesthetic practice as a means of maintaining oxygenation during apnoea, particularly for airway surgery or bronchoscopy (page 492), and remains a widely used method for oxygenation of the non-ventilated lung during one-lung ventilation (page 502).
Carbon Dioxide Carriage during Hypothermia
Understanding the carriage of CO2 during hypothermia is of importance both to clinicians involved in the care of hypothermic patients and to the comparative physiologist studying differences between warm-blooded (homeothermic) and cold-blooded (poikilothermic) animals. These two diverse areas of physiology have over recent years converged to produce two alternative theories regarding the optimal system for CO2 carriage at low temperature.
In common with most gases, carbon dioxide becomes more soluble in water as temperature decreases (Table 10.1) such that, in plasma, maintenance of the same Pco2 under hypothermic conditions will require a greater total CO2 content. In addition, decreasing temperature reduces the ionisation of water into H+ and OH− ions, so pH increases by approximately 0.016 per degree Celsius fall in temperature.25 If CO2 production and excretion remain constant, hypothermia would therefore be expected to result in alkalotic conditions in both the intra- and extracellular spaces. Different animals are believed to respond to these changes in two ways, as follows.
The pH-stat hypothesis,26 as the name suggests, involves the animal responding to hypothermia by maintaining the same blood pH regardless of its body temperature. This is achieved by hypoventilation, which increases the Pco2 to maintain pH at close to 7.4, and is seen in hibernating mammals. Indeed it is thought possible that the high Pco2, and the resulting intracellular acidosis, may contribute to the hypothermic ‘sleep’ state.
The alpha-stat hypothesis is more complex.25,27 In this situation, the pH of the animal is allowed to change in keeping with the physical chemistry laws described above. As temperature falls, the blood pH, again measured at the animal’s body temperature, increases. Studies of protein function and acid–base disturbances have revealed the importance of the α-imidazole moiety of histidine in buffering changes in pH, and that the state of dissociation of these α-imidazole groups is crucial to protein function. The pK of α-imidazole is unique among amino acids in that it changes with temperature to a similar degree as the dissociation of water.27 Thus as temperature decreases, blood and tissue pH rise but the dissociative state of α-imidazole, and thus protein function, remains close to normal. Most poikilothermic animals use an alpha-stat system and can function well through a broad range of temperatures. Even hibernators, with their pH stat regulation, maintain an alpha-stat type control of some vital tissues such as heart and brain.28
There is controversy about whether the blood gases of humans undergoing cardiac surgery during hypothermia should be managed by the alpha-stat or pH-stat techniques.26,29 In the former case, arterial blood drawn from the cold patient is warmed to 37°C before measurement of Pco2 and the cardiopulmonary bypass adjusted to achieve normal values. For pH-stat control, Pco2 is again measured at 37°C but mathematically corrected to the patient’s temperature, and then CO2 administered to the patient to achieve a pH of 7.4. Increased arterial Pco2 during pH-stat will in theory improve cerebral perfusion, and possibly thereby improve cerebral function.29 However, there remains little evidence that the two forms of blood gas management result in differences in patient well-being during or after hypothermic surgery except at very low temperatures, when pH-stat may be superior.30
Outline of Methods of Measurement of Carbon Dioxide
Fractional Concentration in Gas Mixtures31
Infrared analysis. This is the most widely used method for rapid breath-to-breath analysis and is also convenient for analysis of discrete gas samples. Most diatomic gases absorb infra-red radiation, and errors may arise due to overlap of absorption bands and collision broadening. Infrared analysers are available with a response time of less than 300 μs and will follow the respiratory cycle provided the respiratory frequency is not too high. Breathe-through cells (placed near the patient’s airway) have a better frequency response than systems which draw gas from the airway for analysis in a distant machine, as mixing of the inspired and expired gases occurs along the sampling tube. Capnography is described in more detail below.
Mass spectrometry. This powerful technique is established as an alternative method for the rapid analysis of carbon dioxide. The cost is much greater than for infrared analysis, but response times tend to be shorter and there is usually provision for analysis of up to four gases at the same time. In spite of this, mass spectrometry for measurement of respiratory gases remains essentially a research tool.
Blood CO2 Partial Pressure
The Pco2-sensitive electrode. This technique was first described by Severinghaus & Bradley in 1958,32 and allows the Pco2 of any gas or liquid to be determined directly. The Pco2 of a film of bicarbonate solution is allowed to come into equilibrium with the Pco2 of a sample on the other side of a membrane permeable to carbon dioxide but not to hydrogen ions. The pH of the bicarbonate solution is constantly monitored by a glass electrode and the log of the Pco2 is inversely proportional to the recorded pH. Analysis may now be satisfactorily performed by untrained staff on a do-it-yourself basis with results available within 2 minutes.
Handling of blood samples.33,34 It is important that samples be preserved from contact with air, including bubbles and froth in the syringe, to which they may lose carbon dioxide, and either lose or gain oxygen depending on the relative Po2 of the sample and the air. Dilution with excessive volumes of heparin or ‘dead space’ fluids from indwelling arterial cannulae should be avoided. At very high Po2 values, oxygen can diffuse across the wall of plastic syringes and glass syringes may therefore be preferable.34 Analysis should be undertaken quickly, as the Pco2 of blood in vitro rises by about 0.013 kPa per min (0.1 mmHg per min) at 37°C, whilst Po2 declines at 0.07–0.3 kPa (0.5–2.3 mmHg) per minute depending on the Po2. If rapid analysis is not possible (within 10 minutes), the specimen should be stored on ice, which reduces this carbon dioxide production and oxygen consumption by about 90%. Modern blood gas analysers invariably work at 37°C, so for patients with abnormal body temperatures a correction factor should be applied. Nomograms allow correction for both pre-analytic metabolism and patient temperature.35
Continuous measurement of arterial Pco2 using indwelling arterial catheters is rapidly becoming a realistic clinical technique.36 The method uses a ‘photochemical optode’, which consists of a small optical fibre (140 μm diameter) along which light of a specific wavelength is passed to impinge on a dye incorporated into the tip of the fibre, which lies within the patient’s artery. The dye may either absorb the light or fluoresce (give off light of a different wavelength) in a pH sensitive fashion, and these changes are transmitted back to the analyser via the same or a second optical fibre. For analysis of Paco2, the pH sensitive optode is again enclosed within a CO2 permeable membrane with a bicarbonate buffer, as for the Pco2-sensitive electrode but on a very small scale. The current generation of intra-arterial sensors are reasonably accurate with a precision of 0.4–0.8 kPa (3–6 mmHg).
Transcutaneous Pco2 This technique is an indirect measurement of arterial Pco2. A CO2-sensitive electrode is heated to about 44°C to maximise blood flow to the skin but this temperature is, however, close to the temperature that causes burns. Transcutaneous Pco2 should be within about 0.5 kPa (3.8 mmHg) of the simultaneous arterial value, but it is necessary to apply a large correction factor for the difference in temperature between body and electrode.37
Capnography31,38
Capnograms consist of plots of CO2 concentration in airway gas against either time or expired volume. Despite the curves being of similar shape (Figures 8.16 and 10.12) they contain quite different information; for example, time capnography has both inspiratory and expiratory phases whilst CO2 against volume plots only involve expiration. Plots of CO2 and expired volume allow calculation of anatomical dead space (see Figure 8.16), physiological dead space and tidal volume, but this form of capnography is not commonly used clinically. Current generations of capnometer allow the CO2 concentration to be displayed as either volume %, kPa or mmHg. Infrared analysers measure the partial pressure of CO2, while mass spectrometers measure fractional concentration. Conversions between fractional concentration and partial pressure will be affected by the atmospheric pressure, for example by the altitude at which the capnometer is being used. Current technical specifications for capnometers therefore require that the equipment must automatically compensate for barometric pressure when converting the measured units into the displayed units.31
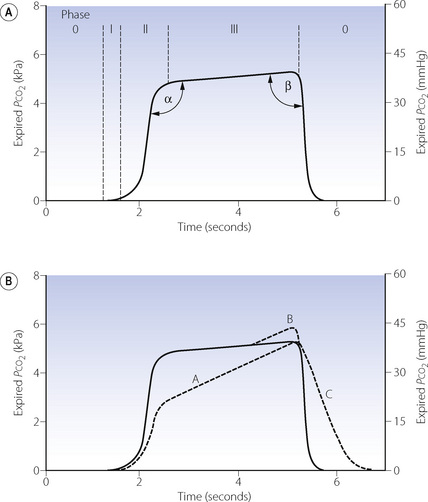
Fig. 10.12 Time capnography. (A) Normal trace showing the phases of the respiratory cycle and the angles used to quantify the shape of the capnogram. See text for details. (B) Dashed lines show abnormalities of the trace, which may occur separately or together. A, varying alveolar time constants (page 123) such as asthma; B, phase IV terminal upswing seen in pregnancy or obesity; C, rebreathing of expired gases.
In the past there has been confusion over the nomenclature of a normal time capnogram, but the most widely accepted terms are shown in Figure 10.12A. There is an inspiratory phase (0), and expiration is divided into three phases: phase I represents CO2-free gas from the apparatus and anatomical dead space; phase II a rapidly changing mixture of alveolar and dead space gas; phase III the alveolar plateau, the peak of which represents end-expiratory Pco2  . The alpha and beta angles allow quantification of abnormalities of the capnogram. Much information may be obtained from a time capnogram:
 is related to arterial P
 at a fixed level of ventilation is a valuable indication of a sudden reduction in cardiac output (page 171) or a pulmonary embolus (Chapter 29).
 to fall to zero.
There are three principle abnormalities of a capnogram,31 which may occur separately or together and are shown in Figure 10.12B. Line A, with an increased alpha angle and phase III slope, results from increased ventilation perfusion mismatch. Almost any lung pathology may result in a slopingphase III, and a common clinical cause is acute asthma: line A is typical of a patient with bronchospasm. The gradient of phase III on a capnogram has been proposed as a non effort-dependent test of the severity of acute asthma.39 Line B, sometimes referred to as phase IV, is occasionally seen in pregnancy or severe obesity,38 but more commonly results from a leak between the sampling tube and analyser in an artificially ventilated patient.31 Line C and an increase in the beta angle occur with rebreathing from either excessive apparatus dead space or a malfunctioning anaesthetic breathing system.
Technical considerations should always be borne in mind when considering abnormalities of a capnogram. The response time of the analyser, excessive lengths of sampling tube and inadequate sampling rates will all tend to ‘blunt’ the normal capnogram trace. This is a particular problem when the tidal volume is low, for example in children or tachypnoeic patients.
Arterial to end-expiratory Pco2 gradient. has already been mentioned above (page 170) and occurs to some extent in almost all subjects, but particularly in elderly patients, smokers, those with lung disease or during anaesthesia.40 The magnitude of the difference is greatest in patients with significant alveolar dead space (page 130) who can be identified from the slope of phase III. Attempts to reduce the gradient by forced or prolonged expiration have generally been unsuccessful.19 Use of  as a monitor of absolute arterial Pco2 is therefore unhelpful, but the assessment remains useful for following changes within a subject.
References
1. Geers C, Gros G. Carbon dioxide transport and carbonic anhydrase in blood and muscle. Physiol Rev. 2000;80:681-715.
2. Severinghaus JW, Stupfel M, Bradley AF. Accuracy of blood pH and Pco2 determinations. J Appl Physiol. 1956;9:189-196.
3. Severinghaus JW, Stupfel M, Bradley AF. Variations in serum carbonic acid pK′ with pH and temperature. J Appl Physiol. 1956;9:197-200.
4. Henry RP. Multiple roles of carbonic anhydrase in cellular transport and metabolism. Annu Rev Physiol. 1996;58:523-538.
*5. Esbaugh AJ, Tufts BL. The structure and function of carbonic anhydrase isozymes in the respiratory system of vertebrates. Respir Physiol Neurobiol. 2006;154:185-198.
6. Chegwidden WR, Carter ND, Edwards YH, editors. The Carbonic Anhydrases. New Horizons. Basel: Birkhäuser Verlag, 2000.
7. Henderson LJ. Das Gleichgewicht zwischen Basen und Säuren im tierischen Organismus. Ergebn Physiol. 1909;8:254.
8. Hasselbalch KA. Die Berechnung der Wasserstoffzahl des Blutes usw. Biochem Z. 1916;78:112-144.
9. Christiansen J, Douglas CG, Haldane JS. The adsorption and dissociation of carbon dioxide by human blood. J Physiol. 1914;48:244-271.
10. Ferguson JKW, Roughton FJW. The direct chemical estimation of carbamino compounds of CO2 with haemoglobin. J Physiol. 1934;83:68-86.
11. Hamburger HJ. Anionenwander-ungen in serum und Blut unter dem Einfluss von CO2. Säure und Alkali. Biochem Z. 1918;86:309.
*12. Jay DG. Role of band 3 in homeostasis and cell shape. Cell. 1996;86:853-854.
13. Tanner MJA. Band 3 anion exchanger and its involvement in erythrocyte and kidney disorders. Curr Opin Hematol. 2002;9:133-139.
14. Zhang D, Kiyatkin A, Bolin JT, Low PS. Crystallographic structure and functional interpretation of the cytoplasmic domain of erythrocyte membrane band 3. Blood. 2000;96:2925-2933.
15. Williamson RC, Toye AM, Glycophorin A. Band 3 aid. Blood Cells Mol Diseases. 2008;41:35-43.
16. Perrotta S, Gallagher PG, Mohandas N. Hereditary spherocytosis. Lancet. 2008;372:1411-1426.
17. Siggaard-Andersen O. The pH, log Pco2 blood acid-base nomogram revisited. Scand J Clin Lab Invest. 1962;14:598-604.
18. Collier DJ, Nickol AH, Milledge JS, et al. Alveolar Pco2 oscillations and ventilation at sea level and at high altitude. J Appl Physiol. 2008;104:404-415.
19. Tavernier B, Rey D, Thevenin D, Triboulet J-P, Scherpereel P. Can prolonged expiration manoeuvres improve the prediction of arterial Pco2 from end-tidal Pco2. Br J Anaesth. 1997;78:536-540.
20. Nunn JF, Hill DW. Respiratory dead space and arterial to end tidal CO2 tension difference in anesthetized man. J Appl Physiol. 1960;15:383-389.
21. Ivanov SD, Nunn JF. Influence of the duration of hyperventilation on rise time of Pco2 after step reduction of ventilation. Respir Physiol. 1968;5:243-249.
22. Shibutani K, Muraoka M, Shirasaki S, Kubal K, Sanchala VT, Gupte P. Do changes in end-tidal Pco2 quantitatively reflect changes in cardiac output. Anesth Analg. 1994;79:829-833.
23. Sanders AB. Capnometry in emergency medicine. Ann Emerg Med. 1989;18:1287-1290.
24. Stock MC, Downs JB, McDonald JS, Silver MJ, McSweeney TD, Fairley DS. The carbon dioxide rate of rise in awake apneic humans. J Clin Anesth. 1988;1:96-99.
25. Nattie EE. The alpha-stat hypothesis in respiratory control and acid–base balance. J Appl Physiol. 1990;69:1201-1207.
26. Burrows FA. Con: pH-stat management of blood gases is preferable to alpha-stat in patients undergoing brain cooling for cardiac surgery. J Cardiothorac Vasc Anesth. 1995;9:219-221.
27. Reeves RB. An imidazole alpha-stat hypothesis for vertebrate acid-base regulation: tissue carbon dioxide content and body temperature in bullfrogs. Respir Physiol. 1972;14:219-236.
28. Swain JA, McDonald TJ, Robbins RC, Balaban RS. Relationship of cerebral and myocardial intracellular pH to blood pH during hypothermia. Am J Physiol. 1991;260:H1640-H1644.
29. Kern FH, Greeley WJ. Pro: pH-stat management of blood gases is not preferable to alpha-stat in patients undergoing brain cooling for cardiac surgery. J Cardiothorac Vasc Anesth. 1995;9:215-218.
30. Laussen PC. Optimal blood gas management during deep hypothermic paediatric cardiac surgery: alpha-stat is easier, but pH-stat may be preferable. Paediatr Anaesth. 2002;12:199-204.
*31. Gravenstein JS, Jaffe MB, Paulus DA. Capnography: Clinical Aspects. Cambridge: Cambridge University Press; 2004.
32. Severinghaus JW, Bradley AF. Electrodes for blood Po2 and Pco2 determination. J Appl Physiol. 1958;13:515-520.
33. Szaflarski NL. Preanalytic error associated with blood gas/pH measurement. Crit Care Nurse. 1996;16:89-100.
34. d’Ortho MP, Delclaux C, Zerah F, Herigault R, Adnot S, Harf A. Use of glass capillaries avoids the time changes in high blood Po2 observed with plastic syringes. Chest. 2001;120:1651-1654.
35. Kelman GR, Nunn JF. Nomograms for correction of blood Po2, Pco2, pH and base excess for time and temperature. J Appl Physiol. 1966;21:1484-1490.
36. Ganter M, Zollinger A. Continuous intravascular blood gas monitoring: development, current techniques, and clinical use of a commercial device. Br J Anaesth. 2003;91:397-407.
37. Severinghaus JW. A combined transcutaneous Po2–Pco2 electrode with electrochemical HCO3− stabilization. J Appl Physiol. 1981;51:1027-1032.
38. Bhavani-Shankar K, Kumar AY, Moseley HSL, Ahyee-Hallsworth R. Terminology and the current limitations of time capnography: a brief review. J Clin Monit. 1995;11:175-182.
39. Yaron M, Padyk P, Hutsinpiller M, Cairns CB. Utility of the expiratory capnogram in the assessment of bronchospasm. Ann Emerg Med. 1996;28:403-407.
40. Wahba RWM, Tessler MJ. Misleading end-tidal CO2 tensions. Can J Anaesth. 1996;43:862-866.