Chapter 8 Distribution of pulmonary ventilation and perfusion
 As a result of gravity, both ventilation and perfusion are distributed preferentially to dependent regions of the lung, and so vary with posture. In healthy lungs ventilation and perfusion are closely matched with little variation of the ventilation to perfusion (
 ) ratio in different lung regions.
 ratio of 0 represent intrapulmonary shunting of mixed venous blood, whilst regions with
  ratio of infinity constitute the alveolar dead space.
The lung may be considered as a simple exchanger with a gas inflow and outflow, and a blood inflow and outflow (Figure 8.1). There is near-equilibrium of oxygen and carbon dioxide tensions between the two outflow streams from the exchanger itself. This theoretical model assumes that gas flow in and out of the alveolus and blood flow through the pulmonary capillary are both continuous. This assumption may be true within alveoli where at normal tidal volumes gas movement is by diffusion (page 19) but pulmonary capillary blood flow is pulsatile (page 101). This model has been deliberately drawn without countercurrent flow, which would be far more efficient. Such a system operates in the gills of fishes and the lungs of birds (page 289), and brings the Po2 of arterial blood close to the Po2 of their environment.
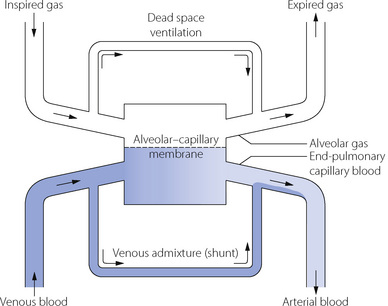
Fig. 8.1 In this functional representation of gas exchange in the lungs, the flow of gas and blood is considered as a continuous process with movement from left to right. Under most circumstances equilibrium is obtained between alveolar gas and end-pulmonary capillary blood, the gas tensions in the two phases being almost identical. However, alveolar gas is mixed with dead space gas to give expired gas, and end-pulmonary capillary blood is mixed with shunted venous blood to give arterial blood. Thus both expired gas and arterial blood have tensions that differ from those in alveolar gas and end-pulmonary capillary blood.
Gas exchange will clearly be optimal if ventilation and perfusion are distributed in the same proportion to one another throughout the lung. Conversely, to take an extreme example, if ventilation were distributed entirely to one lung and perfusion to the other, there could be no gas exchange, although total ventilation and perfusion might each be normal. This chapter begins with consideration of the spatial and temporal distribution of ventilation, followed by similar treatment for the pulmonary circulation. Distribution of ventilation and perfusion are then considered in relation to one another. Finally the concepts of dead space and shunt are presented.
Distribution of Ventilation
Spatial and Anatomical Distribution of Inspired Gas
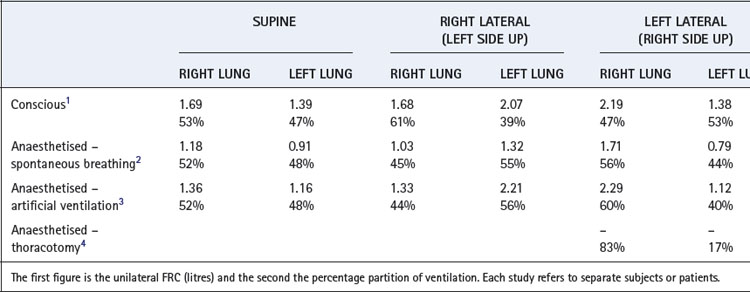
Distribution between the two lungs in the normal subject is influenced by posture and by the manner of ventilation. By virtue of its larger size, the right lung normally enjoys a ventilation slightly greater than the left lung in both the upright and the supine position (Table 8.1). In the lateral position, the lower lung is always better ventilated regardless of the side on which the subject is lying although there still remains a bias in favour of the right side.1 Fortunately, the preferential ventilation of the lower lung accords with increased perfusion of the same lung, so the ventilation/perfusion ratios of the two lungs are not greatly altered on assuming the lateral position. However, the upper lung tends to be better ventilated in the anaesthetised patient in the lateral position, regardless of the mode of ventilation and particularly with an open chest (Table 8.1).
In addition to causing postural differences between ventilation of the left and right lungs, gravity also influences the distribution of ventilation within each lung. Lung tissue may be considered as a semi-fluid or gel-like substance confined within the chest cavity, and the weight of the tissue above compresses the tissue below such that the density of the lung increases as vertical height reduces.5,6 Thus in dependent areas lung tissue is less expanded than in non-dependent areas and so is more compliant and receives more ventilation.
Distribution of ventilation to horizontal slices of lung has been studied for many years by inhalation of radioactive isotopes, this technique having the advantage of being easily performed in a variety of postures and the disadvantage of low spatial resolution. In the upright position, with slow vital capacity inspirations, uppermost slices of the lung have a ventilation of around one-third that of slices at the bases. A slow inspiration from functional residual capacity (FRC), as occurs during normal resting ventilation, results in a smaller vertical gradient down the lung with the ratio of basal to apical ventilation being approximately 1.5:1. In any horizontal position the vertical height of the lung is reduced by about 30% and therefore the gravitational force generating maldistribution is much less. A variety of scanning techniques can now be used to quantifying regional ventilation in the supine position,7,8,9 and have confirmed earlier findings that normal tidal breathing results in preferential ventilation of the posterior slices of the lungs compared with the anterior slices.10
Gravity is not the only factor influencing regional ventilation. Scanning techniques with the ability to measure ventilation in areas of lung only a few cubic millimetres in size have demonstrated increased ventilation in central, compared with peripheral, lung regions.5 This is likely to result from unequal branching patterns of the airways in a similar fashion to that seen in pulmonary blood vessels (see below).5
Distribution of Inspired Gas in Relation to the Rate of Alveolar Filling
Starting from FRC, preferential ventilation of the dependent parts of the lung is only present at inspiratory flow rates below 1.5 l.s−1. At higher flow rates, distribution becomes approximately uniform. Fast inspirations from FRC reverse the distribution of ventilation, with preferential ventilation of the upper parts of the lungs, which is contrary to the distribution of pulmonary blood flow (see below). Normal inspiratory flow rate is however much less than 1.5 l.s−1 (approximately 0.5 l.s−1), so there will be a small vertical gradient of ventilation during normal breathing.
The rate of inflation of the lung as a whole is a function of inflation pressure, compliance and airway resistance. It is convenient to think in terms of the time constant (explained in Appendix E), which is the product of the compliance and resistance and is:
 the time required for inflation to 63% of the final volume attained if inflation is prolonged indefinitely. the time that would be required for inflation of the lungs if the initial gas flow rate were maintained throughout inflation (see Appendix E, Figure E.6).
These considerations apply equally to large and small areas of the lungs; Figure 3.6 shows fast and slow alveoli, the former with a short time constant and the latter with a long time constant. Figure 8.2 shows some of the consequences of different functional units of the lung having different time constants. For simplicity, Figure 8.2 describes the response to passive inflation of the lungs by development of a constant mouth pressure but the considerations are fundamentally similar for both spontaneous respiration and artificial ventilation.
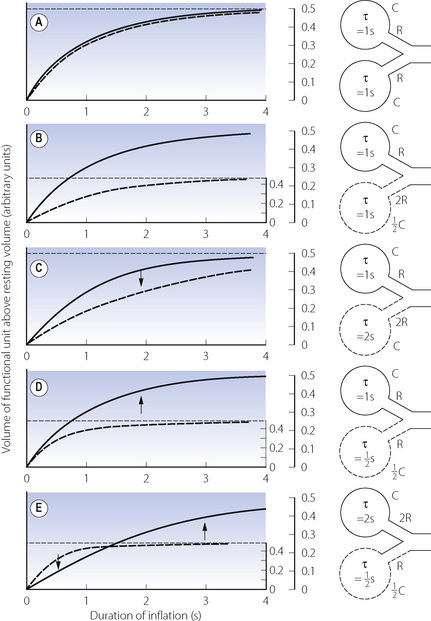
Fig. 8.2 The effect of mechanical characteristics on the time course of inflation of different functional units of the lung when exposed to a sustained constant inflation pressure. The y co-ordinate is volume change, but a scale showing intra-alveolar pressure is shown on the right. Separate pressure scales are necessary when the compliances are different. In each case the continuous curve relates to the upper unit and the broken curve to the lower unit. Arrows show the direction of gas redistribution if inflow is checked by closure of the upper airway at the times indicated. See text for explanation of the changes. τ = time constant.
Figure 8.2A shows two functional units of identical compliance and resistance. If the mouth pressure is increased to a constant level, there will be an increase in volume of each unit equal to the mouth pressure multiplied by the compliance of the unit. The time course of inflation will follow the wash-in type of exponential function (Appendix E), and the time constants will be equal to the product of compliance and resistance of each unit and therefore identical. If the inspiratory phase is terminated at any instant, the pressure and volume of each unit will be identical and no redistribution of gas will occur between the two units.
Figure 8.2B shows two functional units, one of which has half the compliance but twice the resistance of the other. The time constants of the two will thus be equal. If a constant inflation pressure is maintained, the one with the lower compliance will increase in volume by half the volume change of the other. Nevertheless, the pressure build-up within each unit will be identical. Thus, as in the previous example, the relative distribution of gas between the two functional units will be independent of the rate or duration of inflation. If the inspiratory phase is terminated at any point, the pressure in each unit will be identical and no redistribution will occur between the different units.
In Figure 8.2C, the compliances of the two units are identical but the resistance of one is twice that of the other. Therefore, its time constant is double that of its fellow and it will fill more slowly, although the volume increase in both units will be the same if inflation is prolonged indefinitely. Relative distribution between the units is thus dependent on the rate and duration of inflation. If inspiration is checked by closure of the upper airway after 2 seconds (for example), the pressure will be higher in the unit with the lower resistance. Gas will then be redistributed from one unit to the other as shown by the arrow in the diagram.
Figure 8.2D shows a pair of units with identical resistances but the compliance of one being half that of the other. Its time constant is thus half that of its fellow and it has a faster time course of inflation. However, because its compliance is half that of the other, the ultimate volume increase will only be half that of the other unit when inflation is prolonged indefinitely. The relative distribution of gas between the two units is dependent upon the rate and duration of inflation. Pressure rises more rapidly in the unit with the lower compliance, and if inspiration is checked by closure of the upper airway at 2 seconds (for example), gas will be redistributed from one unit to the other as shown by the arrow.
An interesting and complex situation occurs when one unit has an increased resistance and the other a reduced compliance (Figure 8.2E). This combination also features in the presentation of the concept of fast and slow alveoli in Figure 3.6. In the present example the time constant of one unit is four times that of the other, while the ultimate volume changes are determined by the compliance as in Figure 8.2D. When the inflation pressure is sustained, the unit with the lower resistance (the ‘fast alveolus’) shows the greater volume change at first, but rapidly approaches its equilibrium volume. Thereafter the other unit (the ‘slow alveolus’) undergoes the major volume changes, the inflation of the two units being out of phase with one another. Throughout inspiration, the pressure build-up in the unit with the shorter time constant is always greater and, if inspiration is checked by closure of the upper airway, gas will be redistributed from one unit to the other as shown by the arrows in Figure 8.2E.
These complex relationships may be summarised as follows. If the inflation pressure is sustained indefinitely, the volume change in different units of the lungs will depend solely upon their regional compliances. If their time constants are equal, the build-up of pressure in the different units will be identical at all times during inflation and therefore:
Dynamic compliance (so far as it is influenced by considerations discussed in relation to Figure 3.7) will not be affected by changes in frequency and should not differ greatly from static compliance. If inspiration is checked by closure of the upper airway, there will be no redistribution of gas within the lungs.If, however, the time constants of different units are different it follows that:
Effect of Maldistribution on the Alveolar ‘Plateau’
If different functional units of the lung empty synchronously during expiration, the composition of the expired air will be approximately constant after the gas in the airways (anatomical dead space) has been flushed out. However, this will not occur when there is maldistribution with fast and slow units as shown in Figure 3.7. The slow units are slow both to fill and to empty, and thus are hypoventilated for their volume; therefore they tend to have a high Pco2 and low Po2 and are slow to respond to a change in the inspired gas composition. This forms the basis of the single-breath test of maldistribution, in which a single breath of 100% oxygen is used to increase alveolar Po2 and decrease alveolar Pn2. The greatest increase of Po2 will clearly occur in the functional units with the best ventilation per unit volume, which will usually have the shortest time constants. The slow units will make the predominant contribution to the latter part of exhalation, when the mixed exhaled Po2 will decline and the Pn2 will increase. Thus the expired alveolar plateau of nitrogen will be sloping upwards in patients with maldistribution. It should, however, be stressed that this test will only be positive if maldistribution is accompanied by sequential emptying of units due to differing time constants. For example, Figure 8.2B shows definite maldistribution, due to the different regional compliances that directly influence the regional ventilation. However, because time constants are equal, there will be a constant mix of gas from both units during the course of expiration (i.e. no sequential emptying) and therefore the alveolar plateau would remain flat in spite of Po2 and Pn2 being different for the two units. However, maldistribution due to the commoner forms of lung disease is usually associated with different time constants and sequential emptying. Routine continuous monitoring of expired carbon dioxide concentration during anaesthesia allows some assessment of maldistribution of ventilation. As for the single breath nitrogen test, an upward sloping expiratory plateau of carbon dioxide indicates sequential emptying of alveoli with different time constants (page 175), but a level plateau does not indicate normal distribution of ventilation, just equal time constants of lung units.
Distribution of Perfusion
Since the pulmonary circulation operates at low pressure, it is rarely distributed evenly to all parts of the lung and the degree of non-uniformity is usually greater than for gas.
Distribution between the two lungs. Measuring unilateral pulmonary blood flow in humans is difficult, but indirect methods show that unilateral pulmonary blood flow is similar to the distribution of ventilation observed in the supine position (Table 8.1). In the lateral position, the diameter of the thorax is of the order of 30 cm and so the column of blood in the pulmonary circulation exerts a hydrostatic pressure that is high in relation to the mean pulmonary arterial pressure. A fairly gross maldistribution therefore occurs with much of the upper lung comprising zone 2 and much of the lower lung comprising zone 3 (see Figure 7.5).11
Gravitational Effects on Regional Pulmonary Blood Flow
In the previous chapter, it was shown how the pulmonary vascular resistance is mainly in the capillary bed and is governed by the relationship between alveolar, pulmonary arterial and pulmonary venous pressures. Early studies with radioactive tracers in the blood took place at total lung capacity and showed flow increasing progressively down the lung in the upright position. However, Hughes et al. later found that there was a significant reduction of flow in the most dependent parts of the lung, which was termed zone 4, where the reduction in flow appears to be due to compression of larger blood vessels by increased interstitial pressure.12 This effect becomes progressively more important as lung volume was reduced from total lung capacity towards the residual volume. Figure 8.3 is derived from the work of Hughes’ group, and shows that pulmonary perfusion per alveolus is, in fact, reasonably uniform at the lung volumes relevant to normal tidal exchange. However, the dependent parts of the lung contain larger numbers of smaller alveoli than the apices at FRC, and the perfusion per unit lung volume is therefore increased at the bases.11
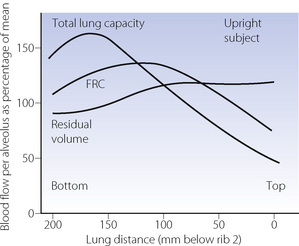
Fig. 8.3 Pulmonary perfusion per alveolus as a percentage of that expected if all alveoli were equally perfused (in the upright position). At total lung capacity, perfusion increases down to 150 mm, below which perfusion is slightly decreased (zone 4). At FRC, zone 4 conditions apply below 100 mm, and at residual volume the perfusion gradient is actually reversed. It should be noted that perfusion has been calculated per alveolus. If shown as perfusion per unit lung volume, the non-uniformity at total lung capacity would be the same because alveoli are all the same size at total lung capacity. At FRC there are more but smaller alveoli at the bases and the non-uniformity would be greater.
(After reference 12.)
In the supine position the differences in blood flow between apices and bases are replaced by differences between anterior and posterior regions. Supine subjects can be studied using the same variety of scanning techniques as used for assessing ventilation (page 138), revealing the same height-dependent gradients in alveolar size and perfusion as seen in earlier observations in upright subjects. Blood flow per unit lung volume increases by 11% per cm of descent through the lung,13 whilst ventilation increases but less dramatically (Figure 8.4),14 resulting in a smaller ventilation to perfusion ratio in dependent areas.13 These studies also showed that the number of alveoli per cubic centimetre of lung was approximately 30% greater in the posterior compared with anterior lung (Figure 8.4).14 Thus the increased perfusion in dependent areas of lung is again mainly caused by an increase in the number of (relatively small) alveoli. Smaller more numerous alveoli in dependent regions result from the weight of lung tissue above, and as blood accounts for two thirds of the weight of lung tissue this provides an automatic matching of ventilation and perfusion.
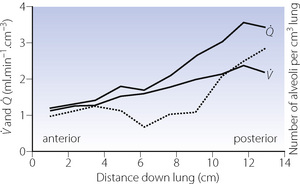
Fig. 8.4 Vertical gradients in ventilation and perfusion in the supine position. Data are mean results from PET scans of 8 subjects during normal breathing, and for each vertical level represent the average value for a horizontal slice of lung. The solid lines relate to the left ordinate and are ventilation ( ) and perfusion (
 ) per cubic centimetre of lung tissue. Ventilation and perfusion both increase on descending through the lung. The dotted line relates to the right ordinate and represents the number of alveoli per unit lung volume, which increases in dependent areas such that the blood flow per alveolus remains fairly constant.
(After references 13 and 14.)
Gravity-Independent Regional Blood Flow5
It is now accepted that gravity is not the only cause of the variability of regional pulmonary blood flow, though its relative contribution remains controversial.15,16 Physiological studies in space some years ago showed that at microgravity regional blood flow becomes more uniform than on Earth, but residual non-uniformity still persists (page 308). A variety of methods have been used to study pulmonary blood flow in the prone position.13,14,17 These studies have consistently found that although blood flow becomes more uniform, the flow distribution when prone is not simply a reversal of the supine position, as may be expected if gravity was the only influence.18
Some groups estimate that gravity is responsible for only 25% of the regional blood flow variability seen.5,17 Pulmonary blood flow may vary in a radial fashion, with greater flow to central, compared to peripheral, lung regions in each horizontal slice of lung.19 Regional flow is believed to be influenced by vascular architecture, with the branching pattern of the pulmonary vasculature being responsible for the observed gravity-independent variation (the fractal hypothesis).20 Two aspects of vascular structure contribute to the variations in flow. First, bifurcations of pulmonary arteries into two slightly different size vessels will have a large effect on the flow rates in each.5 Secondly, pulmonary arteries are more numerous than pulmonary airways as a result of small extra branches, often given off at right angles, throughout the pulmonary arterial tree. Mathematical modelling indicates that these ‘supernumerary’ branches contribute significantly to the heterogeneity of regional perfusion.21
Ventilation in Relation to Perfusion22
It is convenient to consider the relationship between ventilation and perfusion in terms of the ventilation/perfusion ratio (abbreviated to  ). Each quantity is measured in litres per minute and taking the lungs as a whole, typical resting values might be 4 l.min−1 for alveolar ventilation and 5 l.min−1 for pulmonary blood flow. Thus the overall ventilation perfusion ratio would be 0.8. If ventilation and perfusion of all alveoli were uniform then each alveolus would have an individual
  ratio of 0.8. In fact, ventilation and perfusion are not uniformly distributed but may range all the way from unventilated alveoli to unperfused alveoli with every gradation in between. Unventilated alveoli will have a
  ratio of zero and the unperfused alveoli a
  ratio of infinity.
Alveoli with no ventilation ( ratio of zero) will have Po2 and Pco2 values that are the same as those of mixed venous blood, because the trapped air in the unventilated alveoli will equilibrate with mixed venous blood. Alveoli with no perfusion (
 ratio of infinity) will have Po2 and Pco2 values that are the same as those of the inspired gas, because there is no gas exchange to alter the composition of the inspired gas that is drawn into these alveoli. Alveoli with intermediate values of
  ratio will thus have Po2 and Pco2 values that are intermediate between those of mixed venous blood and inspired gas. Figure 8.5 is a Po2/Pco2 plot with the thick line joining the mixed venous point to the inspired gas point. This line covers all possible combinations of alveolar Po2 and Pco2, with an indication of the
  ratios that determine them.
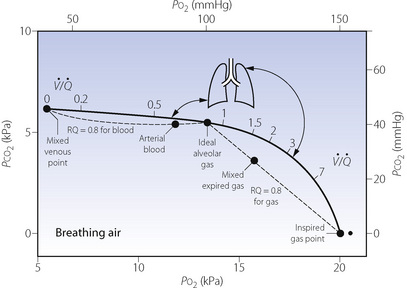
Fig. 8.5 The heavy line indicates all possible values for Po2 and Pco2 of alveoli with ventilation perfusion ( ) ratios ranging from zero to infinity (subject breathing air). Values for normal alveoli are distributed as shown in accord with their vertical distance up the lung field. Mixed expired gas may be considered as a mixture of ‘ideal’ alveolar and inspired gas (dead space). Arterial blood may be considered as a mixture of blood with the same gas tensions as ‘ideal’ alveolar gas and mixed venous blood (shunt).
The inhalation of higher than normal partial pressures of oxygen moves the inspired point of the curve to the right. The mixed venous point also moves to the right but only by a small amount for reasons that are explained on page 377. A new curve must be prepared for each combination of values for mixed venous blood and inspired gas. The curve can then be used to demonstrate the gas tensions in the horizontal strata of the lung according to their different  ratios (Figure 8.5).
All of the techniques described above that measure regional ventilation and perfusion in horizontal strata of the lung only discriminate between functionally large regions of the lung. This limitation was overcome by the multiple inert gas elimination technique (MIGET).23 The methodology, which is outlined on page 138, permits the plotting of the distribution of pulmonary ventilation and perfusion, not in relation to anatomical location, but in a large number of compartments defined by their  ratios, expressed on a logarithmic scale.
Figure 8.6 shows typical plots for healthy subjects.24 For the young adult (Figure 8.6A), both ventilation and perfusion are mainly confined to alveoli with  ratios in the range 0.5–2.0. There is no measurable distribution to areas of infinite
  (i.e. alveolar dead space) or zero
  ratio (i.e. intrapulmonary shunt), but the method does not detect extrapulmonary shunt which must be present to a small extent (page 132). For the older subject (Figure 8.6B), there is a widening of the distribution of
  ratios, with the main part of the curve now in the range of
  ratios 0.3–5.0. In addition, there is the appearance of a ‘shelf’ of distribution of blood flow to areas of low
  ratio in the range 0.01–0.3. This probably represents gross underventilation of dependent areas of the lung due to airway closure when the closing capacity exceeds the functional residual capacity (see Figure 3.11). The effect of increased spread of
  ratios on gas exchange is considered below (page 136).
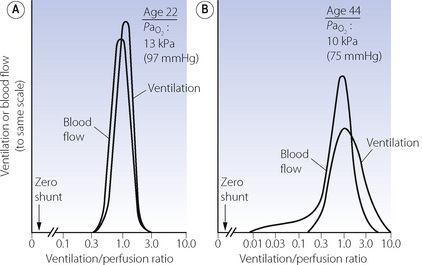
Fig. 8.6 The distribution of ventilation and blood flow in relation to ventilation/perfusion ( ) ratios in two normal subjects. (A) A male aged 22 years with typical narrow spread and no measurable intrapulmonary shunt or alveolar dead space. (B) The wider spread of
  ratios in a male aged 44 years. There is still no measurable intrapulmonary shunt or alveolar dead space, but the appreciable distribution of blood flow to underperfused alveoli is sufficient to reduce the arterial Po2 to 10 kPa (75 mmHg) while breathing air.
(After reference 24 by permission of the authors and copyright permission of the American Society for Clinical Investigation.)
The pattern of distribution of  ratios shows characteristic changes in a number of pathological conditions such as pulmonary oedema and pulmonary embolus.25 Some examples are shown in Figure 8.7.
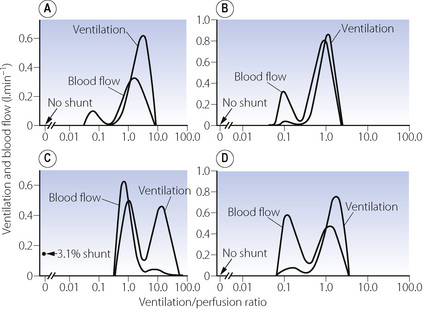
Fig. 8.7 Examples of abnormal patterns of maldistribution of ventilation and perfusion, to be compared with the normal curves in Figure 8.6. (A) Chronic obstructive pulmonary disease. The blood flow to units of very low  ratio would cause arterial hypoxaemia and simulate a shunt. (B) Asthma, with a more pronounced bimodal distribution of blood flow than the patient shown in (A). (C) Bimodal distribution of ventilation in a 60-year-old patient with chronic obstructive pulmonary disease, predominantly emphysema. A similar pattern is seen after pulmonary embolism. (D) Pronounced bimodal distribution of perfusion after a bronchodilator was administered to the patient shown in (B).
(After reference 25 by permission of the author and publishers.)
Quantification of Spread of  Ratios as if it were due to Dead Space and Shunt
The MIGET method of analysis illustrated in Figures 8.6 and 8.7 is technically complex. A less precise but highly practical approach was described in the 1940s by both Fenn et al26 and Riley & Cournard.27 The essence of what has generally become known as the Riley approach is to consider the lung as if it were a three-compartment model (Figure 8.8) comprising:
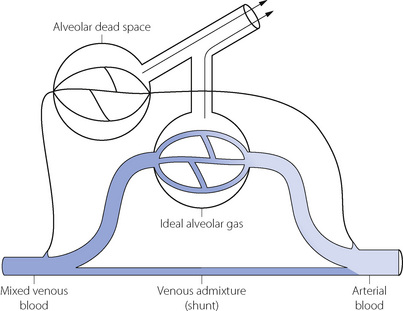
Fig. 8.8 Three-compartment (Riley) model of gas exchange. The lung is imagined to consist of three functional units comprising alveolar dead space, ‘ideal’ alveoli and venous admixture (shunt). Gas exchange occurs only in the ‘ideal’ alveoli. The measured alveolar dead space consists of true alveolar dead space together with a component caused by  scatter. The measured venous admixture consists of true venous admixture (shunt) together with a component caused by
  scatter. Note that ‘ideal’ alveolar gas is exhaled contaminated with alveolar dead space gas, so it is not possible to sample ‘ideal’ alveolar gas.
Gas exchange can only occur in the ‘ideal’ alveolus. There is no suggestion that this is an accurate description of the actual state of affairs, which is better depicted by the type of plot shown in Figure 8.6, where the analysis would comprise some 50 compartments in contrast to the three compartments of the Riley model. However, the parameters of the three-compartment model may be easily determined and the values obtained are of direct relevance to therapy. Thus an increased dead space can usually be offset by an increased minute volume, and arterial Po2 can be restored to normal with shunts up to about 30% by an appropriate increase in the inspired oxygen concentration (see Figure 8.11 below).
Methods for calculating dead space and shunt for the three-compartment model are described at the end of the chapter, but no analytical techniques are required beyond measurement of blood and gas Pco2 and Po2. It is then possible to determine what fraction of the inspired tidal volume does not participate in gas exchange and what fraction of the cardiac output constitutes a shunt. However, it is most important to remember that the measured value for ‘dead space’ will include a fraction representing ventilation of relatively underperfused alveoli, and the measured value for ‘shunt’ will include a fraction representing perfusion of relatively underventilated alveoli. Furthermore, although perfusion of relatively underventilated alveoli will reduce arterial Po2, the pattern of change, in relation to the inspired oxygen concentration, is quite different from that of a true shunt (see Figure 8.12 below).
The concept of ‘ideal’ alveolar gas is considered below (page 139), but it will be clear from Figure 8.8 that ideal alveolar gas cannot be sampled for analysis. There is a convention that ideal alveolar Pco2 is assumed to be equal to the arterial Pco2 and that the respiratory exchange ratio of ideal alveolar gas is the same as that of expired air.
Dead Space
It was realised in the nineteenth century that an appreciable part of each inspiration did not penetrate to those regions of the lungs in which gas exchange occurred and was therefore exhaled unchanged. This fraction of the tidal volume has long been known as the dead space, while the effective part of the minute volume of respiration is known as the alveolar ventilation. The relationship is as follows:

It is often useful to think of two ratios. The first is the dead space/tidal volume ratio (often abbreviated to Vd/Vt and expressed as a percentage). The second useful ratio is the alveolar ventilation/minute volume ratio. The first ratio indicates the wasted part of the breath, while the second gives the utilised portion of the minute volume. The sum of the two ratios is unity and so one may easily be calculated from the other.
Components of the Dead Space
The preceding section considers dead space as though it were a single homogeneous component of expired air. The situation is actually more complicated, and Figure 8.9 shows in diagrammatic form the various components of a single expired breath.
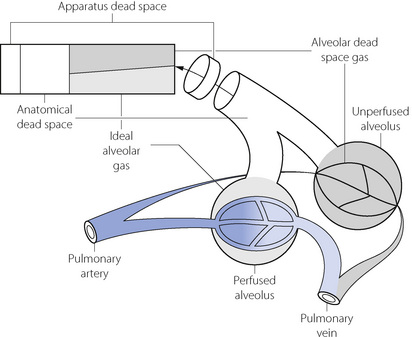
Fig. 8.9 Components of a single breath of expired gas. The rectangle is an idealised representation of a single expired breath. The physiological dead space equals the sum of the anatomical and alveolar dead spaces. The alveolar dead space does not equal the volume of unperfused spaces at alveolar level but only the part of their contents that is exhaled. This varies with tidal volume.
The first part to be exhaled will be the apparatus dead space if the subject is employing any form of external breathing apparatus. The next component will be from the anatomical dead space, which is the volume of the conducting air passages with the qualifications considered below. Thereafter gas is exhaled from the alveolar level and the diagram shows two representative alveoli, corresponding to the two ventilated compartments of the three-compartment lung model shown in Figure 8.8. One alveolus is perfused and, from this, ‘ideal’ alveolar gas is exhaled. The other alveolus is unperfused and so without gas exchange and, from this alveolus, the exhaled gas therefore approximates in composition to inspired gas. This component of the expirate is known as alveolar dead space gas, which is important in many pathological conditions. The physiological dead space is the sum of the anatomical and alveolar dead spaces and is defined as the sum of all parts of the tidal volume that do not participate in gas exchange.
In Figure 8.9, the final part of the expirate is called an end-tidal or, preferably, an end-expiratory sample and consists of a mixture of ideal alveolar gas and alveolar dead space gas. The proportion of alveolar dead space gas in an end-expiratory sample is variable. In a healthy resting subject the composition of such a sample will be close to that of ideal alveolar gas. However, in many pathological states (and during anaesthesia), an end-expiratory sample may contain a substantial proportion of alveolar dead space gas and thus be unrepresentative of the alveolar (and therefore arterial) gas tensions. For symbols, the small capital a relates to ideal alveolar gas as in  , while end-expiratory gas is distinguished by a small capital e, suffixed with a prime (e.g.
  ) and mixed expired gas a small capital e with a bar (
 ). The term ‘alveolar/arterial Po2 difference’ always refers to ideal alveolar gas. Unqualified, the term ‘alveolar’ may mean either end-tidal or ideal alveolar, depending on the context. This is a perennial source of confusion and it is better to specify either ideal alveolar gas or end-expiratory gas.
It must again be stressed that Figure 8.9 is only a model to simplify quantification and there may be an infinite gradation of  ratios between zero and infinity. However, it is often helpful from the quantitative standpoint, particularly in the clinical field, to consider alveoli as if they fell into the three categories shown in Figure 8.8.
Anatomical Dead Space
The anatomical dead space is now generally defined as the volume of gas exhaled before the CO2 concentration rises to its alveolar plateau, according to the technique of Fowler28 outlined at the end of this chapter (see Figure 8.16).
The volume of the anatomical dead space, in spite of its name, is not constant and is influenced by many factors, some of which are of considerable clinical importance. Most of these factors influence the anatomical dead space by changing the volume of the conducting airways, except for changes in tidal volume and respiratory rate, which affect the flow pattern of gas passing along the airways.
Factors Influencing the Anatomical Dead Space
Size of the subject must clearly influence the dimensions of the conducting air passages and anatomical dead space increases with body size.
Age. In early infancy, anatomical dead space is approximately 3.3 ml.kg−1, and by the age of 6 years this has decreased to the adult value of approximately 2 ml.kg−1. Throughout this period of development, intrathoracic anatomical dead space remains constant at 1 ml.kg−1 while the volumes of the nose, mouth and pharynx change relative to body weight.29 From early adulthood, anatomical dead space increases by approximately 1 ml per year.
Posture influences many lung volumes, including the anatomical dead space, with typical values for healthy subjects when supine being a third less than when sitting.
Position of the neck and jaw has a pronounced effect on the anatomical dead space with mean values in conscious subjects of 143 ml with the neck extended and jaw protruded, 119 ml in the normal position, and 73 ml with the neck flexed and chin depressed.30 It is noteworthy that the first position is the one used by resuscitators and anaesthetists to procure the least possible airway resistance. Unfortunately, it also results in the maximum dead space.
Lung volume at the end of inspiration affects the anatomical dead space, since the volume of the air passages changes in proportion to the lung volume. The increase is of the order of 20 ml additional anatomical dead space for each litre increase in lung volume.31
Tracheal intubation, tracheostomy or laryngeal mask airway use will bypass much of the extrathoracic anatomical dead space, which is normally about 70 ml. These methods of airway maintenance bypass approximately half of the total anatomical dead space.30,32,33 Any advantage gained is usually lost by the addition of further apparatus dead space to the breathing system by, for example, the use of a breathing system filter or a heat and moisture exchanging humidifier.
Drugs acting on the bronchiolar musculature will affect the anatomical dead space, with any bronchodilator drug (page 51) causing a small increase in anatomical dead space.
Tidal volume and respiratory rate. A reduction in tidal volume results in a marked reduction of the anatomical dead space as measured by Fowler’s method, and this limits the fall of alveolar ventilation resulting from small tidal volumes. This is important in spontaneously breathing comatose or anaesthetised patients who will often have tidal volumes smaller than the normal anatomical dead space of 150 ml.
Reduced anatomical dead space with small tidal volumes is unlikely to result from changes in the physical dimensions of the airways, and results mostly from changes in the flow patterns and mixing of gases within the airways. First, at low flow rates there is a greater tendency towards laminar flow of gas through the air passages (page 46). Inspired gas advances with a cone front and the tip of the cone penetrates the alveoli before all the gas in the conducting passages has been washed out. Secondly, with a slow respiratory rate and/or a prolonged inspiratory time, there is more time for mixing of gases between the alveoli and the smaller airways. Mixing will occur by simple diffusion, possibly aided by a mixing effect of the heartbeat, which tends to mix all gas lying below the carina. This effect is negligible at normal rates of ventilation, but becomes marked during hypoventilation. For example, in one hypoventilating patient, Nunn and Hill found alveolar gas at the carina at the beginning of expiration.32 A similar effect occurs during breath holding when alveolar gas mixes with dead space gas as far up as the glottis.
Alveolar Dead Space
Alveolar dead space may be defined as the part of the inspired gas that passes through the anatomical dead space to mix with gas at the alveolar level, but which does not take part in gas exchange. The cause of the failure of gas exchange is lack of effective perfusion of the spaces to which the gas is distributed at the alveolar level. Measured alveolar dead space must sometimes contain a component due to the ventilation of relatively underperfused alveoli, which have a very high (but not infinite)  ratio (Figure 8.7). The alveolar dead space is too small to be measured with confidence in healthy supine humans, but becomes appreciable under some circumstances:
Low cardiac output, regardless of the cause, results in pulmonary hypotension and failure of perfusion of the uppermost parts of the lungs (Zone 1, see page 105). During anaesthesia with controlled ventilation, sudden changes in end-expiratory CO2 therefore usually indicate changing alveolar dead space secondary to abrupt variations in cardiac output (page 171).
Pulmonary embolism is considered separately in Chapter 29. Apart from its effect on cardiac output, pulmonary embolism is a direct cause of alveolar dead space that may reach massive proportions.
Posture. Changes in position have a significant effect on the distribution of pulmonary blood flow (page 124). Fortunately, during normal breathing there are similar changes in the distribution of ventilation so that  mismatch is uncommon and there are no significant changes in alveolar dead space. However, if a patient is ventilated artificially in the lateral position, ventilation is distributed in favour of the upper lung (Table 8.1), particularly in the presence of an open chest (page 499),4 and under these conditions, part of the ventilation of the upper lung will constitute alveolar dead space.
Physiological Dead Space
Physiological dead space is the sum of all parts of the tidal volume that do not participate in gaseous exchange. Nowadays it is universally defined by the Bohr mixing equation with substitution of arterial Pco2 for alveolar Pco2 as described below.
Physiological dead space remains a fairly constant fraction of the tidal volume over a wide range of tidal volumes. It is, therefore, generally more useful to use the Vd/Vt ratio: the alveolar ventilation will then be (1−Vd/Vt) × the respiratory minute volume. Thus if the physiological dead space is 30% of the tidal volume (i.e. Vd/Vt = 0.3), then the alveolar ventilation will be 70% of the minute volume. This approach is radically different from the assumption of a constant ‘dead space’ which is subtracted from the tidal volume, the difference then being multiplied by the respiratory frequency to indicate the alveolar ventilation.
The Bohr Equation
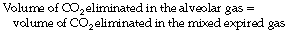
Bohr introduced his equation in 189134 when the dead space was considered simply as gas exhaled from the conducting airways (i.e. anatomical dead space only). It may be simply derived as follows. During expiration, all the CO2 eliminated is contained in the alveolar gas. Therefore:
that is to say:
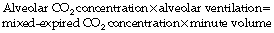
or, for a single breath:
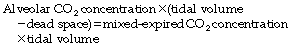
There are four terms in this equation. There is no serious difficulty in measuring two of them, the tidal volume and the mixed-expired CO2 concentration. This leaves the alveolar CO2 concentration and the dead space. Therefore the alveolar CO2 concentration may be derived if the dead space is known or, alternatively, the dead space may be derived if the alveolar CO2 concentration is known.
The use of this equation has been expanded to measure various components of the dead space by varying the interpretation of the term ‘alveolar’. In the equations above, the word ‘alveolar’ may be taken to mean end-expiratory gas, and therefore this use of the Bohr equation indicates the anatomical dead space. If the ‘ideal’ alveolar CO2 concentration were used, then the equation would indicate the physiological dead space comprising the sum of the anatomical and alveolar dead spaces (Figure 8.9). ‘Ideal’ alveolar gas cannot be sampled but arterial Pco2 may be substituted for alveolar Pco2 in the Bohr equation, and the value so derived is now widely accepted as the definition of the physiological dead space:
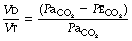
In the healthy conscious resting subject, there is no significant difference between Pco2 of end-expiratory gas and arterial blood. The former may therefore be used as a substitute for the latter, since the anatomical and physiological dead spaces should be the same (the normal alveolar dead space being too small to measure). However, the use of the end-expiratory Pco2 in the Bohr equation may cause difficulties in certain situations. In exercise, in acute hyperventilation, or if there is maldistribution of inspired gas with sequential emptying, the alveolar Pco2 rises, often steeply, during expiration of the alveolar gas, and the end-tidal Pco2 will depend on the duration of expiration. The dead space so derived will not necessarily correspond to any of the compartments of the dead space shown in Figure 8.9.
Factors Influencing the Physiological Dead Space
This section summarises factors that affect physiological dead space in normal subjects, but reasons for the changes have been considered above in the sections on the anatomical and alveolar dead space.
Age and sex. There is a tendency for Vd and also the Vd/Vt ratio to increase with age, as a result of changes in the anatomical component. The volume of Vd in men is around 50 ml greater than in women, but the former group has larger tidal volumes and there is little difference between sexes in the Vd/Vt ratios.
Body size. As described above it is evident that anatomical dead space and therefore Vd, in common with other pulmonary volumes, will be larger in larger people. Physiological dead space correlates with either weight or height, for example, Vd (in millilitres) approximates to the weight of the subject in pounds (1 pound = 0.45 kg),35 or increases by 17 ml for every 10 cm increase in height.36
Posture. The Vd/Vt ratio decreases from a mean value of 34% in the upright position to 30% in the supine position.37 This is largely explained by the change in anatomical dead space described above.
Pathology. Changes in dead space are important features of many causes of lung dysfunction such as pulmonary embolism, smoking, anaesthesia, artificial ventilation etc. These topics are discussed in Part 3 of this book.
Effects of an Increased Physiological Dead Space
Regardless of whether an increase in physiological dead space is in the anatomical or the alveolar component, alveolar ventilation is reduced unless there is a compensatory increase in minute volume. Reduction of alveolar ventilation due to an increase in physiological dead space produces changes in the ‘ideal’ alveolar gas tensions that are identical to those produced when alveolar ventilation is decreased by reduction in respiratory minute volume (see Figure 10.9).
It is usually possible to counteract the effects of an increase in physiological dead space by a corresponding increase in the respiratory minute volume. If, for example, the minute volume is 10 l.min−1 and the Vd/Vt ratio 30%, the alveolar ventilation will be 7 l.min−1. If the patient were then subjected to pulmonary embolism resulting in an increase of the Vd/Vt ratio to 50%, the minute volume would need to be increased to 14 l.min−1 to maintain an alveolar ventilation of 7 l.min−1. However, should the Vd/Vt increase to 80%, the minute volume would need to be increased to 35 l.min−1. Ventilatory capacity may be a limiting factor with massive increases in dead space, and this is a rare cause of ventilatory failure (Chapter 27).
Venous Admixture or Shunt
Admixture of arterial blood with poorly oxygenated or mixed venous blood is an important cause of arterial hypoxaemia.
Nomenclature of Venous Admixture
Venous admixture refers to the degree of admixture of mixed venous blood with pulmonary end-capillary blood that would be required to produce the observed difference between the arterial and the pulmonary end-capillary Po2 (usually taken to equal ideal alveolar Po2), the principles of the calculation being shown in Figure 8.10. Note that the venous admixture is not the actual amount of venous blood that mingles with the arterial blood, but the calculated amount that would be required to produce the observed value for the arterial Po2. Calculated venous admixture and the actual volume of blood mixing differ because of two factors. First, the Thebesian and bronchial venous drainage does not necessarily have the same Po2 as mixed venous blood. Secondly, venous admixture includes the contribution to the arterial blood from alveoli having a  ratio of more than zero but less than the normal value (Figure 8.6), when again, Po2 will differ from that of mixed venous blood. Venous admixture is thus a convenient index but defines neither the precise volume nor the anatomical pathway of the shunt. Nevertheless, it is often loosely termed ‘shunt’.
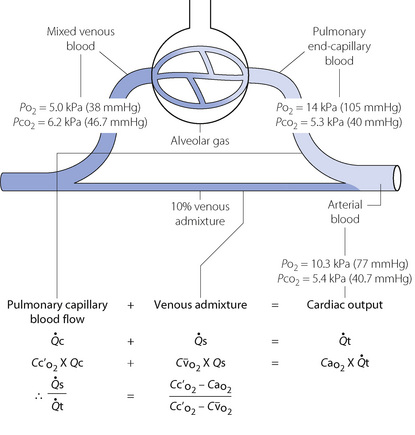
Fig. 8.10 A schematic representation of venous admixture. It makes the assumption that all the arterial blood has come either from alveoli with normal  ratios or from a shunt carrying only mixed venous blood. This is never true, but it forms a convenient method of quantifying venous admixture from whatever cause. The shunt equation is similar to the Bohr equation and is based on the axiomatic relationship that the total amount of oxygen in 1 minute’s flow of arterial blood equals the sum of the amount of oxygen in 1 minute’s flow through both the pulmonary capillaries and the shunt. Amount of oxygen in 1 minute’s flow of blood equals the product of blood flow rate and the oxygen content of the blood.
  , total cardiac output;
  , pulmonary capillary blood flow;
  , blood flow through shunt; Cao2, oxygen content of arterial blood; Cc′o2, oxygen content of pulmonary end-capillary blood;
  , oxygen content of mixed venous blood.
Anatomical (extra-pulmonary) shunt refers to the amount of venous blood that mixes with the pulmonary end-capillary blood on the arterial side of the circulation. The term embraces bronchial and Thebesian venous blood flow and also admixture of mixed venous blood caused by atelectasis, bronchial obstruction, congenital heart disease with right-to-left shunting, etc. Clearly different components may have different oxygen contents, which will not necessarily equal the mixed venous oxygen content. Anatomical shunt excludes blood draining any alveoli with a  ratio of more than zero.
Virtual shunt refers to shunt values derived from calculations in which the arterial to mixed-venous oxygen difference is assumed rather than actually measured (see below).
Pathological shunt is sometimes used to describe the forms of anatomical shunt that do not occur in the normal subject.
Physiological shunt. This term is, unfortunately, used in two senses. In the first sense it is used to describe the degree of venous admixture that occurs in a normal healthy subject. Differences between the actual measured venous admixture and the normal value for the ‘physiological shunt’ thus indicate the amount of venous admixture that results from the disease process. In its alternative sense, physiological shunt is synonymous with venous admixture as derived from the mixing equation (Figure 8.10). The term is probably best avoided.
Forms of Venous Admixture
The contribution of  mismatch to venous admixture is discussed in detail below. Other important sources of venous admixture, both normal and pathological, include:
Venae cordis minimae (Thebesian veins). Some small veins of the left heart drain directly into the chambers of the left heart and so mix with the pulmonary venous blood. The oxygen content of this blood is probably very low, and therefore the flow (believed to be about 0.3% of cardiac output38) causes an appreciable fall in the mixed arterial oxygen tension.
Bronchial veins. Figure 7.1 shows that part of the venous drainage of the bronchial circulation passes by way of the deep true bronchial veins to reach the pulmonary veins. It is uncertain how large this component is in the healthy subject but it is probably less than 1% of cardiac output. In bronchial disease and coarctation of the aorta, the flow through this channel may be greatly increased, and in bronchiectasis and emphysema may be as large as 10% of cardiac output. In these circumstances it becomes a major cause of arterial desaturation.
Congenital heart disease. Right-to-left shunting in congenital heart disease is the cause of the worst examples of venous admixture. When there are abnormal communications between right and left heart, shunting will usually be from left to right unless the pressures in the right heart are raised above those of the left heart. This occurs in conditions involving obstruction to the right ventricular outflow tract (e.g. Fallot’s tetralogy) or in prolonged left-to-right shunt when the increased pulmonary blood flow causes pulmonary hypertension and eventually a reversal of the shunt (Eisenmenger’s syndrome).
Pulmonary pathology often results in increased venous admixture, thus causing hypoxaemia. Venous drainage from lung tumours constitutes a pathological shunt, but more commonly venous admixture results from pulmonary blood flow past non-ventilated alveoli in conditions such as lobar and bronchopneumonia, pulmonary collapse and acute lung injury. The amount of venous admixture that occurs with lung disease is variable, depending on the balance between hypoxic pulmonary vasoconstriction (page 108) and pathological vasodilation of the pulmonary vessels by inflammatory mediators.
Effect of Venous Admixture on Arterial Pco2 and Po2
Qualitatively, it will be clear that venous admixture reduces the overall efficiency of gas exchange and results in arterial blood gas tensions that are closer to those of mixed venous blood than would otherwise be the case. Quantitatively, the effect is simple provided that we consider the contents of gases in blood. In the case of the anatomical shunt in Figure 8.10, conservation of mass (oxygen) is the basis of the equations, which simply state that the amount of oxygen flowing in the arterial system equals the sum of the amount of oxygen leaving the pulmonary capillaries and the amount of oxygen flowing through the shunt. For each term in this equation the amount of oxygen flowing may be expressed as the product of the blood flow rate and the oxygen content of blood flowing in the vessel (the symbols are explained in Figure 8.10 and Appendix D). Figure 8.10 shows how the equation may be cleared and solved for the ratio of the venous admixture to the cardiac output. The final equation has a form that is rather similar to that of the Bohr equation for the physiological dead space.
In terms of content, the shunt equation is very simple to solve for the effect of venous admixture on arterial oxygen content. If, for example, pulmonary end-capillary oxygen content is 20 ml.dl−1 and mixed venous blood oxygen content is 10 ml.dl−1 then a 50% venous admixture will result in an arterial oxygen content of 15 ml.dl−1, a 25% venous admixture will result in an arterial oxygen content of 17.5 ml.dl−1, and so on. It is then necessary to convert arterial oxygen content to Po2 by reference to the haemoglobin dissociation curve (see page 191). Since arterial Po2 is usually on the flat part of the haemoglobin dissociation curve, small changes in content tend to have a very large effect on Po2, though this effect diminishes at lower arterial Po2 when the dissociation curve becomes steeper.
The effect of venous admixture on arterial CO2 content is roughly similar in magnitude to that of oxygen content. However, due to the steepness of the CO2 dissociation curve near the arterial point (see Figure 10.2), the effect on arterial Pco2 is very small and far less than the change in arterial Po2 (Table 8.2).
Table 8.2 Effect of 5% venous admixture on the difference between arterial and pulmonary end-capillary blood levels of carbon dioxide and oxygen
| PULMONARY END-CAPILLARY BLOOD | ARTERIAL BLOOD | |
|---|---|---|
| CO2 content (ml.dl−1) | 49.7 | 50.0 |
| Pco2 (kPa) | 5.29 | 5.33 |
| (mmHg) | 39.7 | 40.0 |
| O2 content (ml.dl−1) | 19.9 | 19.6 |
| O2 saturation (%) | 97.8 | 96.8 |
| Po2 (kPa) | 14.0 | 12.0 |
| (mmHg) | 105 | 90 |
It has been assumed that the arterial/venous oxygen content difference is 4.5 ml.dl−1 and that the haemoglobin concentration is 14.9 g.dl−1.
Venous admixture reduces the arterial Po2 markedly, but has relatively little effect on arterial Pco2 or on the content of either CO2 or O2 unless the venous admixture is large.Elevations of arterial Pco2 are seldom caused by venous admixture and it is customary to ignore the effect of moderate shunts on Pco2. In the clinical situation, it is more usual for venous admixture to lower the Pco2 indirectly, because the decreased Po2 commonly causes hyperventilation, which more than compensates for the very slight elevation of Pco2 that would otherwise result from the venous admixture (see Figure 27.1).
Effect of Cardiac Output on Shunt
Cardiac output influences venous admixture, and its consequences, in two opposing ways. First, a reduction of cardiac output leads to a decrease in mixed venous oxygen content, with the result that a given shunt causes a greater reduction in arterial Po2 provided the shunt fraction is unaltered, a relationship that is illustrated in Figure 11.5. Secondly, it has been observed that, in a range of pathological and physiological circumstances, a reduction in cardiac output causes an approximately proportional reduction in the shunt fraction.39,40 One possible explanation for the reduced shunt fraction is activation of hypoxic pulmonary vasoconstriction as a result of the reduction in Po2 of the mixed venous blood flowing through the shunt (page 108). It is remarkable that these two effects tend to have approximately equal and opposite effects on arterial Po2. Thus with a decreased cardiac output there is usually a reduced shunt of a more desaturated mixed venous blood, with the result that the arterial Po2 is scarcely changed.
The Iso-shunt Diagram
If we assume normal values for arterial Pco2, haemoglobin and arterial/mixed venous oxygen content difference, the arterial Po2 is determined mainly by the inspired oxygen concentration and venous admixture considered in the context of the three-compartment model (Figure 8.8). The relationship between inspired oxygen concentration and arterial Po2 is a matter for constant attention in clinical situations, and it has been found useful to prepare a graph of the relationship at different levels of venous admixture (Figure 8.11). The arterial/mixed venous oxygen content difference is often unknown in the clinical situation and therefore the diagram has been prepared for an assumed content difference of 5 ml oxygen per 100 ml of blood. Iso-shunt bands have then been drawn on a plot of arterial Po2 against inspired oxygen concentration. Since calculation of the venous admixture requires knowledge of the actual arterial/mixed venous oxygen content difference, the iso-shunt lines in Figure 8.11 refer to the virtual shunt, which is defined above.
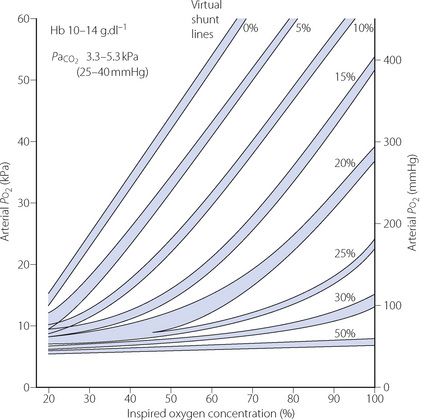
Fig. 8.11 Iso-shunt diagram. On coordinates of inspired oxygen concentration (abscissa) and arterial Po2 (ordinate), iso-shunt bands have been drawn to include all values of Hb and arterial Pco2 shown above. Arterial to mixed-venous oxygen content difference is assumed to be 5 ml.dl−1, and normal barometric pressure is assumed.
(After reference 41 by permission of the Editor of the British Journal of Anaesthesia and Oxford University Press.)
In practice, the iso-shunt diagram is useful for adjusting the inspired oxygen concentration to obtain a required level of arterial Po2. Under stable pathological conditions, changing the inspired oxygen concentration results in changes in arterial Po2 that are reasonably well predicted by the iso-shunt diagram.42 In critical care environments, the iso-shunt graph may therefore be used to determine the optimal inspired oxygen concentration to prevent hypoxaemia while avoiding the administration of an unnecessarily high concentration of oxygen.41 For example, if a patient is found to have an arterial Po2 of 30 kPa (225 mmHg) while breathing 90% oxygen, he has a virtual shunt of 20%, and if it is required to attain an arterial Po2 of 10 kPa (75 mmHg), this should be achieved by reducing the inspired oxygen concentration to 45%.
With inspired oxygen concentrations in excess of 40%, perfusion of alveoli with low (but not zero)  ratios has relatively little effect on arterial Po2. However, with inspired oxygen concentrations in the range 21–35% increased scatter of
  ratios has an appreciable effect on arterial Po2 for reasons that are explained below. Therefore in these circumstances, the standard iso-shunt diagram is not applicable, since arterial Po2 is less than predicted as the inspired oxygen concentration is reduced towards 21%, and a modified iso-shunt diagram is required as described below.
The Effect of Scatter of  Ratios on Arterial Po2
It is usually extremely difficult to say whether reduction of arterial Po2 is due to true shunt (areas of zero  ratio), or increased scatter of
  ratios with an appreciable contribution to arterial blood from alveoli with very low (but not zero)
  ratios. In the clinical field, it is quite usual to ignore scatter of
  ratios (which are difficult to quantify) and treat blood-gas results as if the alveolar/arterial Po2 difference was caused entirely by true shunt. In the example shown in Figure 8.12, it is quite impossible to distinguish between scatter of
  ratios and a shunt on the basis of a single measurement of arterial Po2. However, the two conditions are quite different in the effect of increased inspired oxygen concentrations on the alveolar/arterial Po2 difference and therefore the apparent shunt.
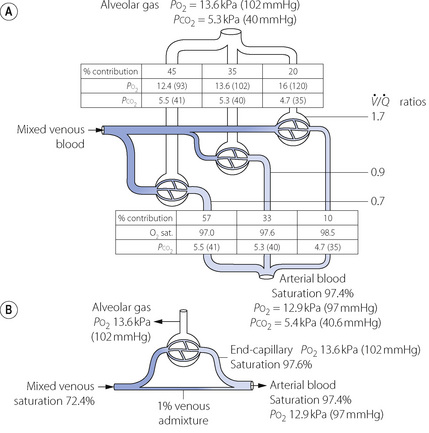
Fig. 8.12 Alveolar to arterial Po2 difference caused by scatter of  ratios and its representation by an equivalent degree of venous admixture. (A) Scatter of
  ratios corresponding roughly to the three zones of the lung in the normal upright subject. Mixed alveolar gas Po2 is calculated with allowance for the volume contribution of gas from the three zones. Arterial saturation is similarly determined and the Po2 derived. There is an alveolar/arterial Po2 difference of 0.7 kPa (5 mmHg). (B) A theoretical situation that would account for the same alveolar to arterial Po2 difference, caused solely by venous admixture. This is a useful method of quantifying the functional effect of scattered
  ratios but should be carefully distinguished from the actual situation.
Figure 8.11 shows that, for a true shunt, with increasing inspired oxygen concentration, the effect on arterial Po2 increases to reach a plateau value of 2–3 kPa (15–22 mmHg) for each 1% of shunt. This is more precisely shown in terms of alveolar/arterial Po2 difference, plotted as a function of alveolar Po2 in Figure 11.4.
It is not intuitively obvious why an increased spread of  ratios should increase the alveolar/arterial Po2 difference. There are essentially two reasons. First, there tends to be more blood from the alveoli with low
  ratio. For example, in Figure 8.12, 57% of the arterial blood comes from the alveoli with low
  ratio and low Po2, while only 10% is contributed by the alveoli with high
  ratio and high Po2. Therefore, the latter cannot compensate for the former, when arterial oxygen levels are determined with due allowance for volume contribution. The second reason is illustrated in Figure 8.13. Alveoli with high
  ratios are on a flatter part of the haemoglobin dissociation curve than are alveoli with low
  ratios. Therefore, the adverse effect on oxygen content is greater for alveoli with a low
  and therefore low Po2 than is the beneficial effect of alveoli with a high
  and therefore high Po2. Therefore, the greater the spread of
  ratios, the larger the alveolar/arterial Po2 difference.
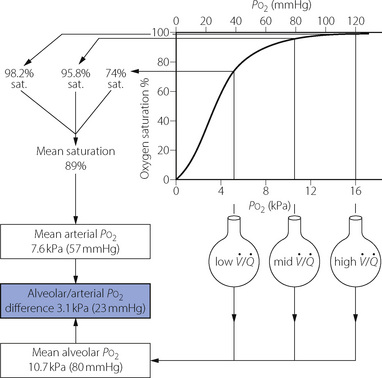
Fig. 8.13 Alveolar/arterial Po2 difference caused by scatter of  ratios resulting in oxygen tensions along the upper inflexion of the oxygen dissociation curve. The diagram shows the effect of three groups of alveoli with Po2 values of 5.3, 10.7 and 16.0 kPa (40, 80 and 120 mmHg). Ignoring the effect of the different volumes of gas and blood contributed by the three groups, the mean alveolar Po2 is 10.7 kPa. However, due to the shape of the dissociation curve, the saturations of the blood leaving the three groups are not proportional to their Po2. The mean arterial saturation is, in fact, 89% and the Po2 therefore is 7.6 kPa. The alveolar/arterial Po2 difference is thus 3.1 kPa. The actual difference would be somewhat greater since gas with a high Po2 would make a relatively greater contribution to the alveolar gas, and blood with a low Po2 would make a relatively greater contribution to the arterial blood. In this example, a calculated venous admixture of 27% would be required to account for the scatter of
  ratios in terms of the measured alveolar/arterial Po2 difference, at an alveolar Po2 of 10.7 kPa.
Modification of the iso-shunt diagram to include  scatter. The iso-shunt diagram described above does not take into account
  scatter so has bands too wide for practical use below an inspired oxygen concentration of approximately 40% (Figure 8.11). This problem has been overcome by the development of a two-compartment model including both true shunt and
  scatter components,43 which for the latter factor assumes a bimodal distribution of
  scatter and uses five grades of
  mismatch ‘severity’. Figure 8.14 shows the effect of
  mismatch on the 0% iso-shunt line (blue lines), clearly displaying the variation in arterial Po2 with
  scatter at lower inspired oxygen concentrations. Further examples are shown in Figure 8.14 of the effect of
  scatter on the inspired to arterial oxygen gradients. This model is clearly an over-simplification of the situation in lung disease (see Figure 8.7). Nevertheless, the second grade of
  mismatch, when combined with a range of shunt values, was found to provide a close simulation of the relationship between arterial Po2 and inspired oxygen concentration for a wide variety of patients with moderate respiratory dysfunction requiring inspired oxygen concentration in the range 25–35%.43,44
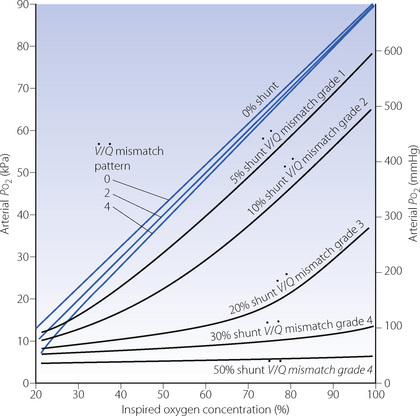
Fig. 8.14 Iso-shunt lines modified to incorporate the effect on arterial Po2 of increasing degrees of  mismatch.43 Blue lines show the effects of differing degrees of
  mismatch in the absence of a true shunt. At lower inspired oxygen the arterial Po2 is progressively decreased below normal for the reasons shown in Figures 8.12 and 8.13. The other iso-shunt lines shown are examples of progressively more severe degrees of combined shunt and
  mismatch.
Principles of Assessment of Distribution of Ventilation and Pulmonary Blood Flow
Regional Distribution of Ventilation and Perfusion
Radioactive tracers. Regional distribution of ventilation and perfusion may both be conveniently studied with a gamma camera. Ventilation is assessed following inhalation of a suitable radioactive gas that is not too soluble in blood. Both 133Xe and 81Kr are suitable for this purpose, the latter usually being used because its short half-life (13 s) reduces uptake by the pulmonary circulation. For assessment of regional perfusion, a relatively insoluble gas such as 133Xe or 99Tc may be dissolved in saline and administered intravenously, and its distribution within the lung again recorded with a gamma camera. The technique defines both ventilation and perfusion in zones of the lung that can be related to anatomical subdivisions by comparing anteroposterior and lateral scans.
Scanning techniques. A variety of scanners are now used, mostly for research purposes, to assess regional ventilation and perfusion including:
Positron emission tomography.8 For this technique radioactive isotopes are inhaled or injected intravenously, for example 13N2, and the radioisotopic concentration in a three dimensional field measured during normal breathing. Resolutions of less than 1 cm3 of lung tissue are now possible. Magnetic resonance imaging (MRI).9 Low proton density in lung tissue due to the presence of air makes MRI scanning of the lungs challenging. However, technological advances in MRI scanning have led to more functionally relevant scans.10,45 By using non-radioactive tracer gases, such as 3He that has been magnetically ‘hyperpolarised’, MRI scans can be greatly enhanced in a similar way to the use of contrast for traditional x-ray radiographs. Hyperpolarised 3He used in this way interacts with the paramagnetic oxygen molecules (page 208) in the lungs, causing oxygen-dependent decay of the hyperpolarisation, and this phenomenon can be used to generate scans showing regional Po2 in the lung.9 Single-photon-emission computed tomography (SPECT).7 This technique also uses inhaled or intravenous radioactive tracers. Though of low resolution compared with the other scans, it does have the advantage of being able to image more than one process simultaneously, for example lung ventilation and perfusion.Measurement of Ventilation and Perfusion as a Function of  Ratio
Ratio
The information of the type displayed in Figures 8.6 and 8.7 is obtained by the MIGET,23,25 which employs six tracer gases with different blood solubility ranging from very soluble (acetone) to very insoluble (sulphur hexafluoride). Saline is equilibrated with these gases and infused intravenously at a constant rate. Once steady state is achieved levels of the tracer gases in the arterial blood are then measured by gas chromatography, and levels in the mixed venous blood are derived by use of the Fick principle. It is then possible to calculate the retention of each tracer in the blood passing through the lung and the elimination of each in the expired gas. Retention and elimination are related to the solubility coefficient of each tracer in blood and therefore it is possible to compute a distribution curve for pulmonary blood flow and alveolar ventilation respectively in relation to the spectrum of  ratios (Figure 8.6).
The technique is technically demanding and laborious. It has not become widely used, but studies using the technique from a small number of laboratories have made major contributions to our understanding of gas exchange in a variety of circumstances.
Measurement of Venous Admixture
Venous admixture, according to the Riley three-compartment model (Figure 8.8), is calculated by solution of the equation shown in Figure 8.10. When the alveolar Po2 is less than about 30 kPa (225 mmHg), scatter of  ratios contributes appreciably to the total calculated venous admixture (Figure 8.14). When the subject breathes 100% oxygen, the component due to scatter of
  ratios is minimal. Nevertheless, the calculated quantity still does not indicate the precise value of shunted blood because some of the shunt consists of blood of which the oxygen content is unknown (e.g. from bronchial veins and venae cordis minimae). The calculated venous admixture is thus at best an index rather than a precise measurement of contamination of arterial blood with venous blood.
To solve the equation shown in Figure 8.10, there are three quantities required:
The Alveolar Air Equation
The difference between inspired and alveolar gas concentrations is equal to the ratio of the output (or uptake) of the gas to the alveolar ventilation according to the universal alveolar air equation:
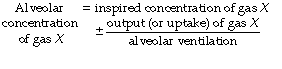
This equation uses fractional concentrations and does not correct for any difference between inspired and expired minute volumes (see below). The sign on the right-hand side is + for output of a gas (e.g. carbon dioxide) and − for uptake (e.g. oxygen).
For the derivation of Po2 in ‘ideal’ alveolar gas the universal air equation was first modified with some precision by Riley et al. in 1946.46 The equation exists in several forms that appear very different but give the same result.
Derivation of the ideal alveolar Po2 is based on the following assumptions.
Quite large degrees of venous admixture or  scatter cause relatively little difference between the Pco2 of ideal alveolar gas (or pulmonary end-capillary blood) and arterial blood (Table 8.2). Therefore ideal alveolar Pco2 is approximately equal to arterial Pco2. The respiratory exchange ratio of ideal alveolar gas (in relation to inspired gas) equals the respiratory exchange ratio of mixed expired gas (again in relation to inspired gas).
From these assumptions it is possible to derive an equation that indicates the ideal alveolar Po2 in terms of arterial Pco2 and inspired gas Po2. As a very rough approximation, the oxygen and carbon dioxide in the alveolar gas replace the oxygen in the inspired gas. Therefore, very approximately:

This equation is not sufficiently accurate for use, except in the special case when 100% oxygen is breathed. In other situations, three corrections are required to overcome errors due to the following factors:
The simplest practicable form of the equation makes correction for the principal effect of the respiratory exchange ratio (1), but not the small supplementary error due to the difference between the inspired and expired gas volumes (2):

This form is suitable for rapid bedside calculations of alveolar Po2, when great accuracy is not required.
One stage more complicated is an equation that allows for differences in the volume of inspired and expired gas due to the respiratory exchange ratio, but still does not allow for differences due to the exchange of inert gases. This equation exists in various forms, all algebraically identical:46
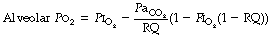
This equation is suitable for use whenever the subject has been breathing the inspired gas mixture long enough for the inert gas to be in equilibrium. It is unsuitable for use when the inspired oxygen concentration has recently been changed, when the ambient pressure has recently been changed (e.g. during hyperbaric oxygen therapy) or when the inert gas concentration has recently been changed (e.g. soon after the start or finish of a period of inhaling nitrous oxide).
Perhaps the most satisfactory form of the alveolar air equation is that which was advanced by Filley, MacIntosh & Wright in 1954.47 This equation makes no assumption that inert gases are in equilibrium and allows for the difference between inspired and expired gas from whatever cause. It also proves to be very simple in use and does not require the calculation of the respiratory exchange ratio, though does require sampling of mixed-expired gas:
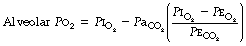
If the alveolar Po2 is calculated separately according to the last two equations, the difference (if any) will be that due to inert gas exchange.
When using these equations in practice it is important to take into account water vapour, as alveolar gas will be saturated with water at body temperature, such that:
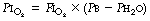
Where  is the fractional inspired oxygen concentration, Pb is barometric pressure, and Ph2o is saturated vapour pressure of water at 37°C (6.3 kPa, 47 mmHg).
Distinction between Shunt and the Effect of  Scatter
Shunt and scatter of  ratios will each produce an alveolar/arterial Po2 difference from which a value for venous admixture may be calculated. It is usually impossible to say to what extent the calculated venous admixture is due to a true shunt or to perfusion of alveoli with low
  ratio. Three methods are available for distinction between the two conditions.
If the inspired oxygen concentration is altered, the effect on the arterial Po2 will depend upon the nature of the disorder. If oxygenation is impaired by a shunt, the arterial Po2 will increase as shown in the iso-shunt diagram (Figure 8.11). If, however, the disorder is due to scatter of  ratios, the arterial Po2 will approach the normal value for the inspired oxygen concentration as the inspired oxygen concentration is increased (Figure 8.14).
  scatter has virtually no effect when the subject breathes 100% oxygen. This difference between shunt and
  scatter forms the basis of a non-invasive method for investigating the mechanism of impaired gas exchange in the clinical setting.48,49Oxygen saturation is measured at several different inspired oxygen concentrations and an
  versus
  curve drawn. Mathematical modelling, again using an assumed value for arterio-venous oxygen difference, and studies during one lung anaesthesia have shown that shunt depresses the curve downwards whilst increasing
  mismatch moves the curve to the right (Figure 8.15).48
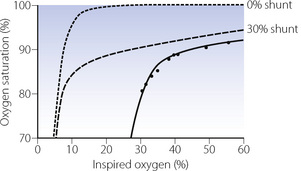
Fig. 8.15 Non-invasive evaluation of impaired gas exchange during one lung anaesthesia and thoracotomy. Oxygen saturation has been measured at nine different inspired oxygen concentrations (circles) and a curve fitted to the points (solid line). Mathematical modelling (broken lines) shows that shunt displaces the curve downwards (0% and 30% shunt shown) whilst  mismatch displaces the curve to the right. A computer algorithm, using an assumed value for arterio-venous oxygen difference, can compute the virtual shunt and the shift due to
  mismatch from the actual curve obtained from the patient, in this case 30% shunt and marked
  mismatch in the patient during one-lung ventilation (page 498).
(After reference 48 with permission of the authors and the Editor of Anaesthesia.)
The multiple inert gas elimination technique for analysis of distribution of blood flow in relation to  ratio is the best method for distinction between shunt and areas of low
  ratio (see above).
Measurement of Dead Space
Anatomical dead space is most conveniently measured by the technique illustrated in Figure 8.16, originally developed for use with a nitrogen analyser by Fowler.28 The CO2 concentration at the lips is measured continuously with a rapid gas analyser, and then displayed against the volume actually expired. The ‘alveolar plateau’ of CO2 concentration is not flat but slopes gently. Anatomical dead space is easily derived from the graph as shown in Figure 8.16 or by a variety of mathematical methods.50
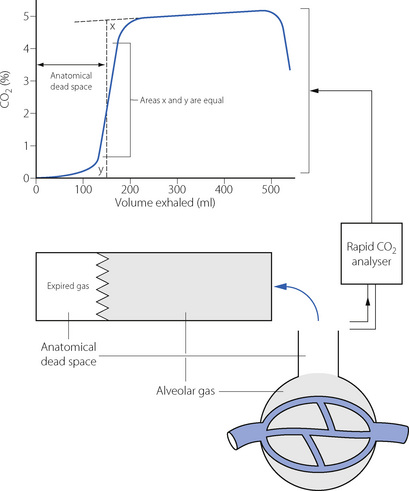
Fig. 8.16 Measurement of anatomical dead space using CO2 as the tracer gas. If the gas passing the patient’s lips is continuously analysed for CO2 concentration, there is a sudden rise to the alveolar plateau level, after the expiration of gas from the anatomical dead space. If the instantaneous CO2 concentration is plotted against the volume exhaled (allowing for delay in the CO2 analyser), a graph similar to that shown is obtained. A vertical line is constructed so that the two areas x and y are equal. This line will indicate the volume of the anatomical dead space. Note that the abscissa records volume rather than time as seen with capnography performed in clinical situations.
Physiological dead space. Mixed expired air is collected over a period of two or three minutes, during which time an arterial blood sample is collected, and the Pco2 of blood and gas are then determined. Provided that the inspired gas is free from carbon dioxide, physiological dead space is indicated by the following form of the Bohr equation:
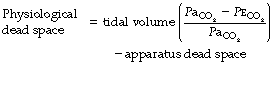
Alveolar dead space is measured as the difference between the physiological and anatomical dead space, determined separately but at the same time. When only the physiological dead space is measured, it is often possible to attribute a large increase in physiological dead space to an increase in the alveolar component, since there are few circumstances in which the anatomical dead space is greatly enlarged. Methods are now available for the estimation of anatomical, physiological and therefore alveolar dead spaces from a single breath recording of expired CO2, and a single arterial Pco2 measurement.51,52 The requirement for an arterial blood sample still makes this an invasive measurement, but the bedside assessment of alveolar dead space is now possible in critical care situations.52
The arterial/end-expiratory Pco2 difference is a convenient and relatively simple method of assessing the magnitude of the alveolar dead space. In Figure 8.9, end-expiratory gas is shown to consist of a mixture of ideal alveolar gas and alveolar dead space gas. If the patient has an appreciable alveolar dead space, the end-expiratory Pco2 will be less than the arterial Pco2, which is assumed equal to the ideal alveolar Pco2.
If, for example, ideal alveolar gas has a Pco2 of 5.3 kPa (40 mmHg) and the end-expiratory Pco2 is found to be 2.65 kPa (20 mmHg), it follows that the end expiratory gas consists of equal parts of ideal alveolar gas and alveolar dead space gas. Thus if the tidal volume is 500 ml, and the anatomical dead space 100 ml, then alveolar dead space and ideal alveolar gas components would be 200 ml each.
References
1. Svanberg L. Influence of posture on lung volumes, ventilation and circulation in normals. Scand J Clin Lab Invest. 9(supp 25), 1957.
2. Rehder K, Sessler AD. Function of each lung in spontaneously breathing man anesthetized with thiopentalmeperidine. Anesthesiology. 1973;38:320-327.
3. Rehder K, Hatch DJ, Sessler AD, Fowler WS. The function of each lung of anesthetized and paralyzed man during mechanical ventilation. Anesthesiology. 1972;37:16-26.
4. Nunn JF. The distribution of inspired gas during thoracic surgery. Ann R Coll Surg Eng. 1961;28:223-237.
*5. Galvin I, Drummond GB, Nirmalan M. Distribution of blood flow and ventilation in the lung: gravity is not the only factor. Br J Anaesth. 2007;98:420-428.
6. Hopkins SR, Henderson AC, Levin DL, et al. Vertical gradients in regional lung density and perfusion in the supine human lung: the Slinky effect. J Appl Physiol. 2007;103:240-248.
7. Petersson J, Sánchez-Crespo A, Larsson SA, Mure M. Physiological imaging of the lung: single-photon-emission computed tomography (SPECT). J Appl Physiol. 2007;102:468-476.
8. Harris RS, Schuster DP. Visualising lung function with positron emission tomography. J Appl Physiol. 2007;102:448-458.
9. Hopkins SR, Levin DL, Emami K, et al. Advances in magnetic resonance imaging of lung physiology. J Appl Physiol. 2007;102:1244-1254.
*10. Kauczor HU, Chen XJ, van Beek EJR, Schreiber WG. Pulmonary ventilation imaged by magnetic resonance: at the doorstep of clinical application. Eur Respir J. 2001;17:1008-1023.
11. Kaneko K, Milic-Emili ME, Dolovich MB, Dawson A, Bates DV. Regional distribution of ventilation and perfusion as a function of body position. J Appl Physiol. 1966;21:767-777.
12. Hughes JMB, Glazier JB, Maloney JE, West JB. Effect of lung volume on the distribution of pulmonary blood flow in man. Respir Physiol. 1968;4:58-72.
13. Brudin LH, Rhodes CG, Valind SO, Jones T, Hughes JB. Interrelationship between regional blood flow, blood volume, and ventilation in supine humans. J Appl Physiol. 1994;76:1205-1210.
14. Brudin LH, Rhodes CG, Valind SO, Jones T, Jonson B, Hughes JB. Relationship between regional ventilation and vascular and extravascular volume in supine humans. J Appl Physiol. 1994;76:1195-1204.
15. Hughes M, West JB. Gravity is the major factor determining the distribution of blood flow in the human lung. J Appl Physiol. 2008;104:1531-1533.
16. Glenny R. Gravity is not the major factor determining the distribution of blood flow in the healthy human lung. J Appl Physiol. 2008;104:1533-1536.
17. Jones AT, Hansell DM, Evans TW. Pulmonary perfusion in supine and prone positions: an electron-beam computed tomography study. J Appl Physiol. 2001;90:1342-1348.
18. Prisk GK, Yamada K, Henderson AC, et al. Pulmonary perfusion in the prone and supine postures in the normal human lung. J Appl Physiol. 2007;103:883-894.
19. Hakim TS, Lisbona R, Dean GW. Gravity-independent inequality in pulmonary blood flow in humans. J Appl Physiol. 1987;63:1114-1121.
*20. Hlastala MP, Glenny RW. Vascular structure determines pulmonary blood flow distribution. News Physiol Sci. 1999;14:182-186.
21. Burrowes KS, Hunter PJ, Tawhai MH. Anatomically based finite element models of the human pulmonary arterial and venous trees including supernumerary vessels. J Appl Physiol. 2005;99:731-738.
22. Hlastala MP. Ventilation/perfusion: from the bench to the patient. Cardiologia. 1996;41:405-415.
23. Roca J, Wagner PD. Principles and information content of the multiple inert gas elimination technique. Thorax. 1993;49:815-824.
24. Wagner PD, Laravuso RB, Uhl RR, West JB. Continuous distributions of ventilation-perfusion ratios in normal subjects breathing air and 100% O2. J Clin Invest. 1974;54:54-68.
25. West JB. Ventilation: blood flow and gas exchange. Oxford: Blackwell Scientific; 1990.
26. Fenn WO, Rahn H, Otis AB. A theoretical analysis of the composition of alveolar air at altitude. Am J Physiol. 1946;146:637-653.
27. Riley RL, Cournard A. ‘Ideal’ alveolar air and the analysis of ventilation perfusion relationships in the lung. J Appl Physiol. 1949;1:825-849.
28. Fowler WS. Lung function studies. II. The respiratory dead space. Am J Physiol. 1948;154:405-416.
29. Numa AH, Newth CJL. Anatomic dead space in infants and children. J Appl Physiol. 1996;80:1485-1489.
30. Nunn JF, Campbell EJM, Peckett BW. Anatomical subdivisions of the volume of respiratory dead space and effect of position of the jaw. J Appl Physiol. 1959;14:174-176.
31. Lifshay A, Fast CW, Glazier JB. Effects of changes in respiratory pattern on physiological dead space. J Appl Physiol. 1971;31:478-483.
32. Nunn JF, Hill DW. Respiratory dead space and arterial to end-tidal CO2 tension difference in anesthetized man. J Appl Physiol. 1960;15:383-389.
33. Casati A, Fanelli G, Torri G. Physiological dead space/tidal volume ratio during face mask, laryngeal mask, and cuffed oropharyngeal airway spontaneous ventilation. J Clin Anesth. 1998;10:652-655.
34. Bohr C. Über die Lungenathmung. Skand Arch Physiol. 1891;2:236.
35. Radford EP. Ventilation standards for use in artificial respiration. J Appl Physiol. 1955;7:451-463.
36. Harris EA, Hunter ME, Seelye ER, Vedder M, Whitlock RML. Prediction of the physiological dead-space in resting normal subjects. Clin Sci. 1973;45:375-386.
37. Craig DB, Wahba WM, Don HF, Couture JG, Becklake MR. ‘Closing volume’ and its relationship to gas exchange in seated and supine positions. J Appl Physiol. 1971;31:717-721.
38. Ravin MG, Epstein RM, Malm JR. Contribution of thebesian veins to the physiologic shunt in anesthetized man. J Appl Physiol. 1965;20:1148-1152.
39. Dantzker DR, Lynch JP, Weg JG. Depression of cardiac output is a mechanism of shunt reduction in the therapy of acute respiratory failure. Chest. 1980;77:636-647.
40. Lynch JP, Mhyre JG, Dantzker DR. Influence of cardiac output on intrapulmonary shunt. J Appl Physiol. 1979;46:315-321.
41. Benator SR, Hewlett AM, Nunn JF. The use of iso-shunt lines for control of oxygen therapy. Br J Anaesth. 1973;45:711-718.
42. Lawler PGP, Nunn JF. A reassessment of the validity of the iso-shunt graph. Br J Anaesth. 1984;56:1325-1335.
43. Petros AJ, Doré CJ, Nunn JF. Modification of the iso-shunt lines for low inspired oxygen concentrations. Br J Anaesth. 1994;72:515-522.
44. Drummond GB, Wright DJ. Oxygen therapy after abdominal surgery. Br J Anaesth. 1977;49:789-797.
*45. Mills GH, Wild JM, Eberle B, Van Beek EJR. Functional magnetic resonance imaging of the lung. Br J Anaesth. 2003;91:16-30.
46. Riley RL, Lilienthal JL, Proemmel DD, Franke RE. On the determination of the physiologically effective pressures of oxygen and carbon dioxide in alveolar air. Am J Physiol. 1946;147:191-198.
47. Filley GF, MacIntosh DJ, Wright GW. Carbon monoxide uptake and pulmonary diffusing capacity in normal subject at rest and during exercise. J Clin Invest. 1954;33:530-539.
*48. de Gray L, Rush EM, Jones JG. A noninvasive method for evaluating the effect of thoracotomy on shunt and ventilation perfusion inequality. Anaesthesia. 1997;52:630-635.
49. Kjaergaard S, Rees S, Malczynski J, et al. Non-invasive estimation of shunt and ventilation-perfusion mismatch. Intensive Care Med. 2003;29:727-734.
50. Tang Y, Turner MJ, Baker AB. Systematic errors and susceptibility to noise of four methods for calculating anatomical dead space from the CO2 expirogram. Br J Anaesth. 2007;98:828-834.
*51. Åström E, Niklason L, Drefeldt B, Bajc M, Jonson B. Partitioning of dead space – a method and reference values in the awake human. Eur Respir J. 2000;16:659-664.
52. Arnold JH. Measurement of alveolar deadspace: Are we there yet? Crit Care Med. 2001;29:1287-1288.