Laboratory Tests and Values
Many clients entering the health care delivery system undergo a variety of diagnostic and laboratory tests. Laboratory values may confirm a suspected diagnosis, rule out a suspected diagnosis, or be used as a screening tool.
With the need for shortened lengths of stay and improved client outcomes, therapists in many hospitals are being consulted earlier in the course of the inpatient’s treatment and for a “sicker” client base often with multiple medical conditions (comorbidities). At the same time that advances in medical technology are making it possible for earlier diagnosis, improved medical treatment is contributing to greater longevity for people with acute medical conditions.
In order to provide the best plan of care and intervention for today’s health care recipients, the therapist must understand test values and their variations, interpretations, and implications for therapy. Abnormal test results represent physiologic changes that may require modification of intervention or even contraindicate therapy intervention.25 Neglecting to take these results into consideration before determining goals and designing intervention plans could be harmful and possibly fatal for some clients.63
As members of a health care team, we are responsible for knowing a patient or client’s health status, what we can do to improve it, and what might harm it. What the therapist learns from taking a history and performing a physical examination is supplemented by information found in laboratory test values.
Single threshold values listed in this text are not always clinically relevant but provide a general guideline. We will continually emphasize the following: in all cases, the therapist must make decisions based on the entire clinical picture and consultation with others rather than relying on a particular lab value. Treatment also depends on the clinical setting and medical treatment being received by the individual.
Abnormal values (i.e., out of the reference range) can be viewed as yellow (cautionary) or red (warning) flags, indicating that more questions should be asked before treating or before canceling treatment because of documented abnormal values. The therapist is advised to consider the person’s physiology and weigh the risks and benefits of intervention. The therapist should have a reasonable rationale for canceling therapy when values are not within the reference ranges.25
Most of the time, abnormal values suggest the need to modify the treatment plan in order to treat in a safe and effective manner. Cancellation of treatment is advised when there is a critical (or panic level) lab value indicating a potentially life-threatening condition.
Monitoring vital signs is strongly encouraged in all patients/clients but especially when lab values are outside the reference ranges. More frequent rest periods, decreased exercise intensity during endurance training, or decreased resistance during strength training are examples of treatment modifications.25
This chapter describes the purpose of laboratory tests, normal values, abnormal values, and potential interpretation of abnormal values. This chapter is organized from basic screening tests that may be done for nearly all patients/clients and proceeds to more specific systems and less frequently performed tests.
A reference web site is provided by the American Association for Clinical Chemistry (www.labtestsonline.org).1 This web site will cover any additional lab tests the therapist might encounter, including the opportunity to enter a condition and determine which lab tests might be employed.
LABORATORY TESTS
As previously presented in this text, advances in medicine have resulted in a population that is living longer with a more complex pathologic picture. Orthopedic and neurologic conditions no longer present as singular phenomena but frequently occur in someone who has other medical pathologic findings.
We must be cognizant of the ways other conditions and diseases affect the individual’s neuromusculoskeletal system and take the necessary steps to treat safely and effectively. For these reasons, routine monitoring of vital signs and evaluation of clinical laboratory data (whenever available) is advised in all clients regardless of age, condition, or diagnosis.78
Laboratory values are a useful adjunct in evaluating a client’s medical condition and revealing potential precautions for or contraindications to therapy, particularly exercise. For example, a low platelet level (e.g., 50,000/mm3) requires careful consideration of the planned intervention program. Consider the client with diabetes mellitus who is admitted to the hospital for a myocardial infarction (MI). Cardiac rehabilitation for this person in any setting (i.e., whether the facility has a formal cardiac rehabilitation program) requires careful monitoring of glucose levels before, during, and after exercise. However, this same person needing wound care for a diabetic neuropathic ulcer would not necessarily require blood glucose testing before the local application of wound management.
Additional Abbreviations, Acronyms and Symbols (For Possible Future Inclusion in the Official “Do Not Use” List)
Data from The Joint Commission Official “Do not use list.” Available at www.jointcommission.org. Accessed August 14, 2007.
The number of possible lab tests that an individual may encounter can be overwhelming. Those tests addressed in this chapter were chosen because of their high volume in hospital use and their importance in clinical decision making for physical therapists in general.17,31
Abbreviations
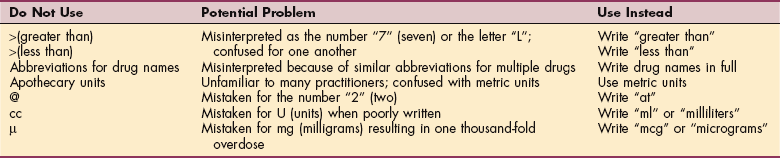
Recommended units for clinical laboratory data are provided in Box 40-1. The Joint Commission’s official “do not use” list of abbreviations is listed in Table 40-1. The list was originally created in 2004 by The Joint Commission as part of the requirements for meeting National Patient Safety Goal (NPSG) requirement 2B, which required a standardized list of abbreviations, acronyms, and symbols that are not to be used throughout the organization.
Table 40-1
Official “Do Not Use” List*
| Do Not Use | Potential Problem | Use Instead |
| U (Unit) | Mistaken for “0” (zero), the number 4 (four) or “cc.” | Write “unit” |
| IU (International Unit) | Mistaken for IV (intravenous) or the number 10 (ten). | Write “International Unit” |
| Q.D., QD, q.d., qd (daily) | Mistaken for each other. | Write “daily” |
| Q.O.D., QOD, q.o.d., qod (every other day) | Period after the Q mistaken for “1” and the “O” mistaken for “I.” | Write “every other day” |
| Trailing zero (X.0 mg)† | Decimal point is missed. | Write X mg |
| Lack of leading zero (.X mg) | Decimal point is missed. | Write 0.X mg |
| MS, MSO4, and MgSO4 | Can cause confusion between morphine sulfate and magnesium sulfate. | Write “morphine sulfate” or “magnesium sulfate” |
*Applies to all orders and all medication-related documentation that is handwritten (including free-text computer entry) or on preprinted forms.
†Exception: A “trailing zero” may be used only where required to demonstrate the level of precision of the value being reported, such as for laboratory results, imaging studies that report size of lesions, or catheter/tube sizes. It may not be used in medication orders or other medication-related documentation.
APACHE
The acute physiology and chronic health evaluation (APACHE), a system for prognosis development for critically ill patients, has been developed using a number of lab and other values. Based on data entered regarding admission diagnosis, age, health history, and the physiologic measurements taken during the first 24 hours, a predicted death rate is calculated. Length of stay in the intensive care unit (ICU) can also be predicted.
Measurements include body temperature, mean arterial pressure, heart rate, respiratory rate, partial pressure of arterial pressure, hematocrit, white blood cell (WBC) count, arterial pH, Glasgow coma scale, and serum bicarbonate, potassium, and creatinine.70,88 Newer variables (use of mechanical ventilation and thrombolytic therapy) and adjustment to the equations used for predictions have been used to generate the latest version (APACHE IV).89
Purpose
Laboratory tests may be used by the physician for screening (searching for an occult disease process in an otherwise healthy person), diagnosis (identifying the cause of symptoms), or monitoring (following the progress of a disease).63 A single test may be used differently in different people, depending on the need for information. For example, a glucose test may be used diagnostically or as a monitoring test.
Screening tests may be used on populations in an effort to find individuals at risk for certain diseases (e.g., those with high cholesterol who could benefit from treatment before disease manifestations become evident). Screening is also done for genetic or metabolic diseases to find individuals before disease occurs. State laws generally require routine screening in newborns for a number of disorders, notably phenylketonuria, sickle cell disease, and hypothyroidism.
Certain lab tests are very sensitive and specific for certain pathologic conditions, whereas others may only provide one piece of evidence suggesting a health problem without actually providing a certain diagnosis. For the therapist, laboratory values assist in deciding whether therapy can be provided at that time, should be scaled back, or should be more aggressive.17
Some lab values are clear contraindications for receiving therapy, whereas others are suggestive that therapy provided should be less physiologically demanding. The therapist must work with other members of the health care team to determine what aspects of therapy should be held until physiologic improvement, what should be modified, and what should be done in place of the prescribed treatment plan.31 For example, an individual who is short of breath with blood gas values that indicate no physiologic reserve for increasing metabolic demand should not undergo therapy that involves activity; other aspects may be addressed such as positioning, pressure relief, and educating caregivers. Note also that different physicians or facilities may adopt criteria for holding therapy that vary from those suggested in the text.
Limitations of Lab Testing
Although lab tests are generally reliable, a number of issues must be addressed. First, samples used for lab analysis may be contaminated, mishandled, or mislabeled, and testing materials and techniques may be flawed. Values obtained by tests reflect the status of the person at the time the sample is obtained.
The condition of the individual may fluctuate so that a sample taken at a given time does not reflect the person’s current condition, resulting in a false positive or false negative result. Results may be influenced by medications or drugs; sex; age; weight; physiologic changes, such as pregnancy; and fluid status. The range of values for a given test in a healthy person is known as the reference range or expected value, formerly known as the normal range. The reference range depends on the methods used for the test and must be compared against the reference range specific to that laboratory.
Reference ranges may vary among different laboratories; this variability is even more obvious in the values reported as reference ranges among various laboratory textbooks. The reference values or “normal” ranges provided are not meant to be memorized and applied as a standard to every case. The reference ranges provided in this chapter give the therapist a general idea of the values expected for each test, but interpretation of specific individual values must be done using the laboratory reference values (usually provided on most laboratory reports) not these figures.
Each laboratory will include a means of assessing the results—sometimes by placing L for low or H for high after a test result or by providing the range of reference lab values for the tests performed. Certain tests may have limited predictive value. The positive predictive value of a test depends on the prevalence of the disease in a population. The less prevalent the disease, the less accurate laboratory results may be.
A test may fail to produce a result that would indicate an abnormal condition that truly exists (false negative) or the results may falsely indicate that an abnormal condition exists (false positive). Statistically, as the number of tests performed on a single individual increase, the possibility of an incorrect conclusion also increases, whether the person is sick or not.45 This phenomenon is purely related to chance because a significant margin of error arises from the arbitrary setting of limits for normal or reference values. Laboratory tests are frequently “rechecked” in order to ensure a higher degree of diagnostic accuracy.
BASIC METABOLIC PANEL
The most common lab tests constitute what are now known as the basic metabolic panel (BMP),31 comprehensive metabolic panel, and hepatic function panel. These three terms are based on current procedural terminology (CPT) codes.9 These replace a variety of other names, such as SMA-6, SMA-7, SMA-12, SMA-20, Chemistry Panel, Chem Screen, Chem-6, Chem-7, Chem-12, Chem-20, SMAC-6, SMAC-7, SMAC-12, and SMAC-20.
The BMP is a group of eight specific tests for electrolyte level, acid/base balance, blood sugar, and kidney status. The tests consist of serum concentrations of sodium, potassium, chloride, calcium, blood urea nitrogen (BUN), creatinine, glucose, and carbon dioxide. The BMP may be done as part of a routine physical examination as an outpatient, routine testing of inpatients, or when a physician suspects an abnormality that may be detected by one or more components of the BMP.
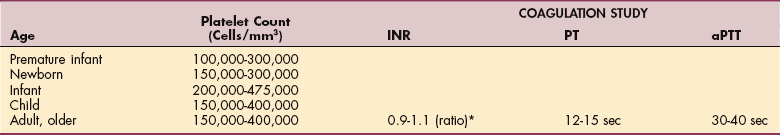
Normal values for BMP are given in Table 40-2, along with possible causes and consequences of abnormal values. BMP may be used as a screening tool, especially for diabetes and kidney disease. The sample is obtained by venipuncture, preferably after 10 to 12 hours of fasting.1
Table 40-2
Reference Values for Basic Metabolic Profile and Magnesium
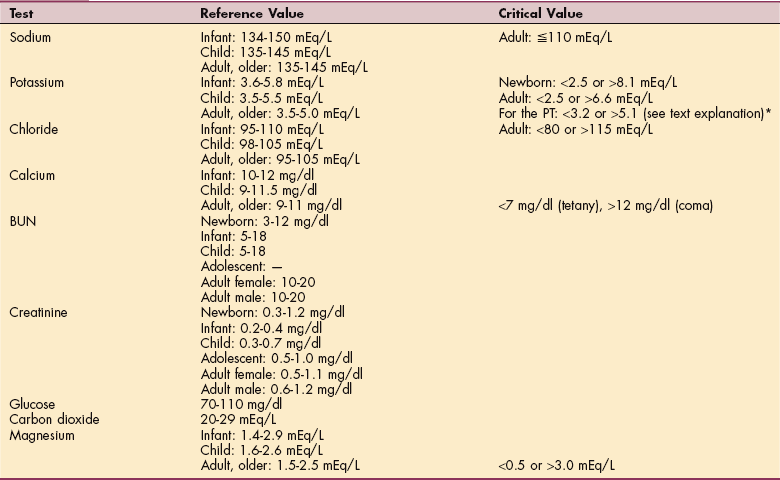
Creatinine for older adult decreases with decreased muscle mass. BUN may be slightly higher than adult level. BUN/Creatinine normal ratio is 10:1 to 20:1 for all ages.
*Some facilities use a slightly higher reference range (5.1 up to 5.3).
As an indicator of current status of electrolytes, acid/base balance, renal function, and blood sugar, significant changes in BMP values may indicate acute problems such as kidney failure, insulin shock, diabetic coma, and respiratory distress.1 Changes in sodium, potassium, and calcium, in particular, alter the excitability of neurons, cardiac, and skeletal muscle and can produce weakness, spasms, altered sensation, and cardiac arrhythmias.3
Sodium
Sodium is a critical determinant of fluid volume in the body. Under normal circumstances, increases in the amount of sodium in the body lead to retention of water and a loss of sodium leads to loss of water in the body. Changes in plasma sodium concentration indicate a loss of homeostasis. Sodium concentration may be altered by excessive infusion or ingestion of water or excessive production of antidiuretic hormone. Sodium concentration may increase when excessive water is lost from the body such as in profuse sweating or decreased antidiuretic hormone (ADH) production (diabetes insipidus). Increased fluid volume increases blood pressure and may increase cell volume. Neurons are especially vulnerable to cell swelling, leading to neurologic dysfunction, possibly progressing to coma or death.
Potassium
Potassium is particularly important for function of excitable cells (e.g., nerve, muscles, and heart). The heart muscle is most susceptible to potassium disturbances, and arrhythmias and cardiac arrest can result from hypokalemia or hyperkalemia. Abnormal values in either direction can lead to cardiac rhythm disturbance and muscle weakness or irritability. Potassium measurements provide useful information about renal and adrenal disorders and about water and acid-base imbalances. Potassium acts as a part of the body’s buffer system regulated by its excretion through the urine.
Chloride
Chloride levels tend to change along with changes in sodium and water (H2O). Bicarbonate ion (HCO3−) is a critical component of acid-base balance. HCO3− acts as a buffer, preventing changes in plasma pH. Low HCO3− occurs in conditions that produce metabolic acidosis such as diabetic ketoacidosis. Respiratory compensation for metabolic acidosis results in loss of carbon dioxide (CO2) from the plasma, which in turn reduces the amount of HCO3− from the plasma.
Bicarbonate works as buffer as a result of the equilibrium reaction of CO2 + H2O yielding H2CO3, which in turn is in equilibrium with HCO3− + hydrogen (H+). Exhaling CO2 is the equivalent of losing an equal number of H+. Conversely, slowing ventilation allows CO2 and thereby H+ to accumulate in the blood and lower pH. The renal system also contributes to pH regulation by altering the amount of H+ that passes in the urine and by synthesizing HCO3−.
Renal compensation is slower to correct pH, requiring several days, as opposed to the more rapid respiratory response. The ability to regulate pH can be compromised by either respiratory or renal disease. Hypoventilation allows carbon dioxide and thereby acid to accumulate. Renal disease decreases the ability of the kidney to selectively alter fluid concentration, usually resulting in acidosis. Table 40-3 provides lab values that indicate whether acidosis or alkalosis is metabolic or respiratory and whether it is compensated. Further discussion of acid-base balance in disease may be found in Chapter 5.
Table 40-3
Laboratory Values in Acid-Base Disorders*
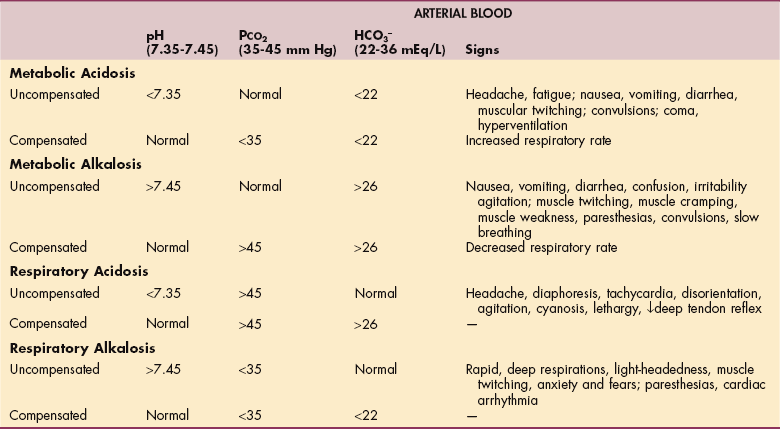
*See also Table 5-13.
Modified from Goodman CC, Snyder TE: Differential diagnosis for physical therapists: screening for referrals, ed 4, Philadelphia, 2007, WB Saunders. PCO2, Partial carbon dioxide pressure; HCO3−, bicarbonate.
Magnesium
Magnesium, like calcium, is involved in regulation of excitable cells but is not part of the BMP and is ordered separately. Low magnesium also results in arrhythmias, weakness, muscle spasms, and numbness. Magnesium (see Table 40-2) may be reduced in diabetes; with the use of diuretics; as a result of chronic vomiting or diarrhea; and may be increased by renal failure, hyperparathyroidism, or hypothyroidism.
Blood Glucose
In addition to the BMP, blood glucose may be measured under particular conditions to diagnose a suspected alteration in glucose homeostasis. Reference values for glucose testing are shown in Table 40-4. Fasting blood sugar (FBS), as the name implies, is done after fasting (at least 8 hours). Not eating overnight should allow blood sugar to fall to normal, whereas a random measurement may be elevated by eating close to the time of the test.
Table 40-4
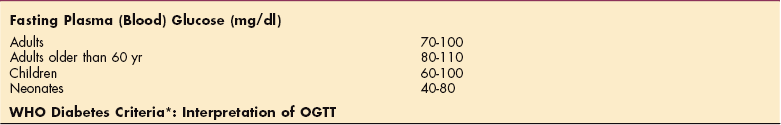
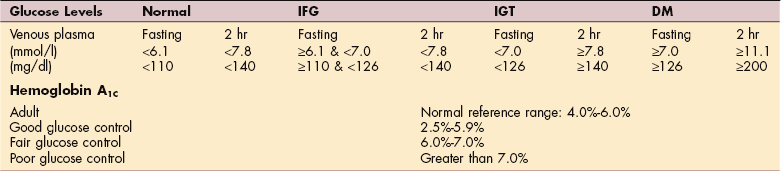
OGTT, Oral glucose tolerance test; WHO, World Health Organization; IFG, impaired fasting glycemia; IGT, impaired glucose tolerance; DM, diabetes mellitus.
*WHO Diabetes criteria available at: www.who.org. Accessed August 14, 2007.
Data from Corbett JV: Laboratory tests and diagnostics procedures, ed 7, Upper Saddle River, NJ, 2007, Prentice-Hall Health.
Another test is the 2-hour postprandial blood sugar (PPBS); 2 hours should be sufficient time for blood glucose to return to normal following eating. Another test, the oral glucose tolerance test (OGTT) involves con- sumption of a fixed amount of glucose and measurement of blood glucose at fixed intervals afterward to determine how quickly blood sugar can be brought back to normal. A person with a normal response will have a modest elevation in blood glucose after 1 hour and a return to normal by 2 hours. Blood glucose in an individual with either a lack of insulin or lack of insulin response will remain elevated after more than 2 hours.
A test for long-term glycemic control (ability to maintain a steady blood sugar concentration) is glycosylated hemoglobin (HbA1C). The amount of glycosylated hemoglobin measured in the red blood cells (RBCs) depends on the amount of glucose available in the bloodstream over the 120-day lifespan of the RBC, thereby reflecting the average blood sugar level for the 100-to 120-day period before the test.
The A1C test determines the fraction of hemoglobin containing bound glucose and reflects the average blood glucose concentration over a number of weeks to months, as opposed to the snapshot view provided by blood glucose monitoring. The more glucose the RBC was exposed to, the greater the HbA1C percentage. An important advantage of this test is that the sample is not affected by short-term variations such as food intake, exercise, stress, hypoglycemic agents, or compliance. The HbA1C measurement is now used more frequently than the 2-hour PPBS in monitoring people with diabetes.
Oral hypoglycemic agents are usually recommended when A1C levels are greater than 7.0%. People with HbA1c concentrations less than 5% have the lowest rates of cardiovascular disease and mortality.36 See Chapter 11 for further details.
Blood Urea Nitrogen and Creatinine
BUN and creatinine (see Table 40-2) are used to evaluate kidney function in individuals with kidney failure, for differential diagnosis if kidney disease is suspected, to monitor treatment of kidney disease, and to monitor kidney function while clients are using certain drugs.1 Creatinine is a normal waste product related to creatinine phosphate, a mechanism of regenerating adenosine triphosphate (ATP) in skeletal muscle. Normally, the amount of creatinine in the blood is kept at a normal level by clearance in the kidneys. Because release of creatinine into the blood from muscle remains constant, a rise in serum creatinine usually represents a decline in the kidney’s capacity for excreting wastes.
The rise in creatinine levels is directly correlated with the amount of loss of nephron function. With aging, there is a decrease in lean body mass (muscle tissue), possibly resulting in decreasing creatinine values. However, serum creatinine may remain normal in an older person even with significant declines in creatinine clearance and renal function because of the decline in lean body mass.
Causes for elevated creatinine may include glomerulonephritis, pyelonephritis, acute tubular necrosis, obstruction by prostate disease or kidney stones, or decreased renal blood flow. Creatinine may also be elevated as a result of excessive release of creatinine caused by muscle injury.
BUN also rises with decreased renal function, caused in particular by decreased renal blood flow, as opposed to decreased glomerular filtration (creatinine). Because BUN reflects a balance of nitrogen added to the blood and excreted by the kidney, BUN may be elevated by increased protein catabolism or dietary intake of protein.
Gastrointestinal bleeding will increase BUN because of the breakdown of protein from the blood within the gastrointestinal tract. The synthesis of urea also depends on the liver. People with severe primary liver disease will have a decreased BUN. With combined liver and renal disease (as occurs in hepatorenal syndrome), the BUN can be normal, not because renal excretory function is good but rather because poor hepatic functioning resulted in decreased formation of urea.
COMPREHENSIVE METABOLIC PANEL
The comprehensive metabolic panel (CMP) is composed of the BMP with the addition of tests for liver function. These additional tests may be conducted separately as the liver panel. The liver panel consists of bilirubin, total protein, albumin, and serum enzymes that are altered when liver function is compromised. These are aspartate aminotransferase (AST, formerly called SGOT), alanine aminotransferase (ALT, formerly called SGPT), lactate dehydrogenase (LDH), γ-glutamyltransferase (GGT), and alkaline phosphatase (ALP).
Hepatic Function Panel
The liver is one of the first organs exposed to bacteria and toxins in the bloodstream; when the liver is not functioning well, these substances may reach the heart and lungs. This is one reason why people with liver failure are at high risk of multiorgan dysfunction syndrome (MODS; also known as multiple organ failure syndrome [MOFS]) (see Chapter 5). Since no one liver function test can pinpoint the specific liver dysfunction, physicians rely on various tests and measures in conjunction with clinical observations and other diagnostic tests (Table 40-5).
Table 40-5
Laboratory Tests for Liver and Biliary Tract Disease
| Normal Range | Comment | |
| Serum bilirubin | ||
| Direct (conjugated) | 0.1-0.3mg/dl | Increased with obstruction |
| Indirect (unconjugated) | 0.2-0.8 mg/dl | Increased with other problems |
| Total | 0.1-1.0 mg/dl | Increased with cirrhosis; hepatitis, hemolytic anemia, jaundice, transfusion reaction |
| Urine bilirubin | 0 | — |
| Serum proteins | ||
| Albumin (A) | 3.5-5.5 g/dl | Decreased in liver damage, burns, Crohn’s disease, SLE, malnutrition (e.g., anorexia nervosa) digoxin (digitalis) toxicity |
| Globulin (G) | 2.5-3.5 g/dl | Increased in hepatitis |
| Total | 6-8 g/dl | Decreased in liver damage (synthesis is impaired) |
| A/G ratio | 1.5:1-2.5:1 | Ratio reverses with chronic hepatitis or other chronic liver disease |
| Transferrin (iron levels) | 250-300 mg/dl | Decreased in liver damage, increased in iron deficiency |
| Alpha-fetoprotein | 6-20 ng/ml | Cancer associated antigen; made by fetus but not by healthy adults; value >1000 ng/mg indicates likely hepatocellular carcinoma |
| Serum enzymes | ||
| AST | 8-20 U/L | Increased in liver damage, released by liver when damage occurs to liver cells; increased with primary muscle diseases (e.g., myopathy) |
| ALT | 5-35 U/L | Same as above |
| LDH | 45-90 U/L | Same as above. Increased with metastatic disease osteosarcoma |
| GGT | 5-38 U/L | Age-and gender-dependent elevated with significant liver disorder |
| Alkaline phosphatase | 30-85 U/L | Increased with liver tumor, biliary obstruction, rheumatoid arthritis, hyperparathyroidism, Paget’s disease of bone |
| Blood ammonia | <75 mcg/dl | Great variation in reported values because of methods used; increased in severe liver damage |
| Coagulation functions | ||
| Prothrombin time | 12-15 sec | Prolonged in liver damage; salicylate intoxication, intake of anticoagulants (warfarin), DIC |
| INR | 0.9-1.1 (ratio) | |
| aPTT | 30-40 sec; therapeutic level 2-2.5 times normal | Prolonged in clotting factor, deficiencies (e.g. hemophilia), leukemia, DIC, with administration of heparin |
| Platelets | 150,000-400,000/mm3 | May drop when spleen is enlarged from portal hypertension, decreased in DIC and burns; increased with inflammation (see table 40-6, 40-12) |
SLE, Systemic lupus erythematosus, AST, aspartate aminotransferase, ALT, alanine aminotransferase, LDH, lactate dehydrogenase GGT, γ-glutamyl transferase; PT, prothrombin time; INR, international normalized ratio; DIC, disseminated intravascular coagulation; aPTT, activated partial thromboplastin time.
Modified from Goodman CC, Snyder TE: Differential diagnosis for physical therapists: screening for referral, ed 4, Philadelphia, 2007, WB Saunders.
Measuring transaminases (enzymes) released into the blood from liver cells when they are damaged provides information about liver function and, in particular, the amount of inflammation in the liver. For example, ALT is an enzyme that serves as a sensitive indicator of hepa- tocellular damage; it is the primary test for detecting hepatitis.
ALP is related to the bile ducts and is increased when they are blocked and may indicate gallbladder, liver, and bile duct disease1 but may also be elevated from increased bone turnover in chronic renal failure.46 ALP may be elevated in diseases other than liver injury. Increased levels of this enzyme may indicate hyperparathyroidism, Paget’s disease of bone, or rheumatoid arthritis. It is also elevated in biliary obstruction or with hepatocytic carcinoma.
AST is found in the liver and also in the heart and skeletal muscles and historically had been used for differential diagnosis of chest pain. Bilirubin is measured as either total bilirubin, or direct bilirubin and indirect separately to determine the cause of elevated bilirubin. Total bilirubin can be elevated by liver disease or other causes such as bile duct occlusion and hemolytic anemia. Levels of albumin and total protein reflect the ability of the liver to synthesize proteins.1
ALT, AST, GGT, and LDH are elevated with injury to hepatocytes. LDH may be elevated by injury to other tissues, such as myocardial infarction, or by cancer cells. Therefore elevated LDH may raise the suspicion of metastatic disease, particularly osteosarcoma.
Blood Ammonia
Ammonia is an intermediate product of breaking down amino acids in proteins. Severe liver injury results in the inability to convert ammonia into urea to be excreted by the kidneys and accumulation of ammonia. Ammonia may also accumulate because of hepatic disease resulting in hepatic encephalopathy, including confusion, lethargy, dementia, daytime sleepiness, tremors, deterioration of fine motor skills, and speech impairment. Ammonia may be tested if hepatic encephalopathy or Reye’s syndrome is suspected as a cause of unexplained mental status or coma. A combination of elevated ammonia and decreased glucose in a child is indicative of Reye’s syndrome.
Other causes of elevated ammonia may include gastrointestinal bleeding and a genetic defect in the enzymes of the urea cycle.1 Reference values and interpretations for the hepatic function panel and ammonia are given in Table 40-5. When liver dysfunction results in increased serum ammonia and urea levels, peripheral nerve function can also be impaired. Asterixis and numbness or tingling (misinterpreted as carpal or tarsal tunnel syndrome) can occur as a result of this ammonia abnormality causing intrinsic nerve pathologic findings (see further discussion in Chapter 17).
COMPLETE BLOOD COUNT
The complete blood count (CBC) is a common laboratory test performed routinely in many clinical settings. Although the term complete is commonly used, different degrees of detail are available. The term CBC implies that red blood cells (RBCs; erythrocytes), WBCs (leukocytes), and platelets are counted from a sample of blood. CBC is an automated test that provides results regarding the concentration of RBCs, WBCs, and platelets.
Table 40-6 lists normal and abnormal values related to blood testing with a number of potential causes and the consequences of abnormal values. A simple count of RBCs, WBCs, and platelets may be sufficient for determining the appropriate level of mobilization and exercise. Reference values for the CBC are given in Table 40-7.
Table 40-6
WBCs, White blood cells; RBCs, red blood cells; HCT, hematocrit; Hgb, hemoglobin; AIDS, acquired immunodeficiency syndrome; SLE, systemic lupus erythematosus; COPD, chronic obstructive pulmonary disease; HIV, human immunodeficiency virus.
Table 40-7
Complete Blood Count (CBC) Reference Values

*Upper limit for men after age 50 is 20.
†Upper limit for women after age 50 is 30.
Data from Corbett JV: Laboratory tests and diagnostic procedures with nursing diagnoses, ed 7, Upper Saddle River, NJ, 2007, Prentice-Hall Health. WBCs, White blood cells; RBCs, red blood cells; ESR, erythrocyte sedimentation rate; HCT, hematocrit; Hgb hemoglobin.
Red Blood Cells
RBC count (or a simpler means of assessing the capacity of the blood to carry oxygen such as hemoglobin [Hgb] concentration or hematocrit [HCT]) correlate with a person’s endurance and orthostatic tolerance. A relative decrease in the capacity of blood to carry oxygen is termed anemia. Several additional tests may be required to determine the cause of anemia, including intrinsic factor, vitamin B12, and folic acid, which are necessary for erythropoiesis. Mean cell volume, mean cell Hgb, red cell distribution width (variation in RBC size), presence of immature cells (reticulocytes), and ferritin may be necessary to diagnose the cause of anemia.
Ferritin is an intracellular store of iron. Its value declines in anemia caused by chronic iron deficiency and severe protein depletion (e.g., burns or malnutrition). Elevation of ferritin is also used as an indicator of states of chronic iron excess such as hemochromatosis.1
Men with essential hypertension may have a high prevalence of increased iron stores and metabolic abnormalities that are part of the insulin-resistance–associated hepatic iron overload syndrome (IRHIO).60 In general, individuals with elevated ferritin are at increased risk for insulin-resistance syndrome.21,86 A major limitation to the test for ferritin levels is the fact that ferritin can be elevated in conditions that do not reflect iron stores such as acute inflammatory diseases, infections, and metastatic malignancies.
White Blood Cells
WBC count can be provided as a total, a count of individual types of leukocytes, or subtypes of leukocytes. WBCs may either increase or decrease in disease. In general, an increase suggests infection or other inflammatory response. WBC count may decrease as a result of bone marrow disease or chemotherapy for cancer or to prevent transplant rejection.
The primary therapy implications are related to the presence of infection with elevated leukocyte count (leukocytosis) or risk of patients/clients becoming infected with a low WBC count (leukopenia). In particular, neutropenia is a risk factor for nosocomial infection. Facility policy may require supply of individual equipment, air filtration systems, gowning, gloving, and facemasks.84
Platelets
Platelet count is decreased by excessive bleeding, coagulation disorders, autoimmune disorders, or histocompatibility problems caused by transfusion of incompatible platelets. Indications for platelet count include unexplained bruising and long coagulation time.
Platelet count is decreased in bone marrow diseases, such as aplastic anemia, leukemia, multiple myeloma, and other cancer in the bone marrow. In addition, chronic bleeding, autoimmune disease, and factors that suppress cell production by the bone marrow (e.g., cancer or other chemotherapies) may be causes of a low platelet count (thrombocytopenia).80
BLOOD TESTS
Tests may be conducted on characteristics and subpopulations of different cells to determine the causes of altered blood counts. Bone marrow disease may be suspected for a number of reasons, particularly a global decrease of blood cells (pancytopenia).
Aspiration of bone marrow may also be required when cancer involving the bone marrow is suspected.69 Bone marrow aspiration or biopsy allows evaluation of blood formation (hematopoiesis) by showing blood elements and precursor blood cells, as well as any abnormal or malignant cells.
Tests of RBCs
Symptoms of anemia may be present in spite of normal RBC count, or the cause of anemia may need to be identified. Therefore more specific testing of RBCs may be needed. These include tests of RBC size, shape, maturity, and the type and concentration of hemoglobin inside them.
Hematocrit
Hematocrit (HCT) is a simple test involving a small quantity of blood that can be obtained with a simple skin prick. The blood is drawn into a small pipette and placed into a centrifuge to determine the relative volume of RBCs expressed as the percentage of total volume occupied by RBCs. The blood then separates (based on weight) into packed RBCs, buffy coat consisting of WBCs and platelets, and serum. This test is a quick screen for anemia. A low hematocrit is indicative of anemia, but anemia could still exist in the presence of a normal relative volume of RBCs.
Hemoglobin
Hemoglobin (Hgb) concentration usually provides the same information as hematocrit. However, certain disease states may allow normal numbers of RBCs, but result in reduced concentration of hemoglobin within individual cells. Therefore anemia could result with normal hematocrit but reduced hemoglobin concentration. HCT and Hgb concentration are frequently tested simultaneously. When done this way, the term H & H is generally used.
Mean corpuscular hemoglobin concentration (MCHC) is used to determine whether RBCs have reduced hemoglobin concentration within them. This test would not be necessary if HCT and Hgb concentration show the same changes from normal or both were normal.
Mean corpuscular volume (MCV) is also used in the differential diagnosis of anemia. Different disease states may increase MCV, such as vitamin B12 or folic acid deficiency (macrocytic anemia), or it may be decreased as in iron deficiency anemia (hypochromic anemia) or other causes of decreased cell volume (microcytic anemia).
Hgb levels of 12 to 16 g/dl have been considered normal, but more recent studies have shown that older adults with a low-normal value of 12 g/dl are more likely to have difficulty performing daily tasks. Mild anemia may be dismissed as “innocent” but cause significant functional problems. Difficulty walking, climbing stairs, or doing house or yard work may be an early sign of low-normal Hgb levels.10
Red Blood Cell Shape
The normal biconcave disc of RBCs may be altered in a number of diseases. The crescent shape of RBCs may be seen microscopically to confirm the diagnosis of sickle cell disease. A number of rare genetic diseases may also alter the shape of RBCs. For example, hereditary spherocytosis, as the name implies, allows red cells to take on a spherical shape.
Reticulocyte Count
Immature RBCs are termed reticulocytes. Increased numbers of reticulocytes in the blood indicate compensation of the bone marrow for RBC loss, typically as a result of bleeding. This condition is termed reticulocytosis.
Iron
Iron is required for the synthesis of hemoglobin. Lack of iron results in small, hypochromic (pale) RBCs that cannot carry as much oxygen as normal. Iron status is determined by serum transferrin receptor assay59 and serum ferritin.11 Iron deficiency anemia is discussed further in Chapter 14.
Vitamin B12 and Folic Acid
Both of these vitamins are critical to the production of RBCs. Deficiency results in production of large immature RBCs being released from the bone marrow. B12 is obtained from ingesting animal protein and requires intrinsic factor, which is produced by the gastric mucosa for absorption in the distal part of the ileum. When absorption of vitamin B12 is inadequate (e.g., because of a malabsorption syndrome or from lack of intrinsic factor) pernicious anemia may develop.
B12 shots may be recommended when serum levels are too low. Folic acid (folate), one of the B vitamins, is also necessary for normal function of RBCs and WBCs and for the adequate synthesis of certain purines and pyrimidines, which are precursors to deoxyribonucleic acid (DNA). As with vitamin B12, folate depends on normal absorption in the intestinal mucosa.
40-5 SPECIAL IMPLICATIONS FOR THE THERAPIST
HCT and Hgb concentration may be decreased for a large number of reasons. Some of these result in chronically low Hgb and HCT, whereas others, especially bleeding, lead to acute decrease in Hgb and HCT. For example, decreased Hgb may be the result of obvious or occult blood loss, decreased RBC production (e.g., lack of substrate such as iron, vitamin B12, or folate), myeloproliferative processes (i.e., leukemias), or increased RBC destruction (e.g., disseminated intravascular coagulation [DIC], splenic involvement, or sequestration of sickle cells in sickle cell disease). Increased Hgb may be found in cases of dehydration and polycythemia (see also Table 40-6). Guidelines for exercise are given in Tables 40-8 and 40-9.
Table 40-8
Complete Blood Count: Exercise Guidelines (Adult)*
| WBC count | <1000/mm3 | No exercise*; wear protective mask |
| <5000/mm3 or >10,000 with fever | No exercise permitted | |
| 4,800-10,800 mm3 | Normal reference range; no activity restriction in healthy adults but some modifications may be needed in clients who are ill or during recovery after chemotherapy | |
| >5000/mm3 | Light exercise: progress to resistive exercise as tolerated | |
| HCT | <25% | No exercise permitted |
| >25% | Light exercise permitted | |
| 30%-32% | Add resistive exercise as tolerated | |
| Hgb | <8 g/dl | No exercise permitted |
| 8-10 g/dl | Light exercise permitted | |
| >10 g/dl | Resistive exercise permitted | |
| Platelets | <20,000/mm3 | No exercise† |
| PT | Values ≥2.5 times the reference range | Physical and occupational therapy contraindicated |
| Clients receiving anticoagulant therapy (PT) | INR ≥ 2.5-3.0 | Consult with physician (see text) |
WBC, White blood cell; HCT, hematocrit; Hgb, Hemoglobin; PT, prothrombin time; INR, International normalized ration.
*These guidelines are only meant as a general recommendation (see text for further discussion and explanation). The therapist must make individual determinations depending on the client’s age, general health status, and disease or condition present. For example, someone with an acute episode of urinary tract infection with altered WBC count and fever would be treated differently from someone with a chronic condition, such as diabetes Mellitus.
†See Table 40-9.
Modified from Garritan S, Jones P, Kornberg T, Parkin C: Laboratory values in the intensive care unit, Acute Care Perspective: Newsletter of the Acute Care/Hospital Clinical Practice Section, APTA, winter 1995.
Table 40-9
Exercise Guidelines for Thrombocytopenia*
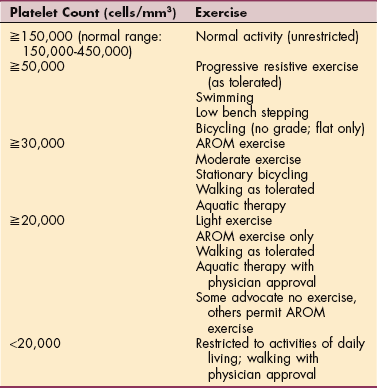
*These guidelines vary from institution to institution; the therapist should check with each facility for its specific guidelines. Some therapists working in oncology settings report a more liberal exercise guideline. For example, in some centers, restriction to AROM and activities of daily living is indicated only when platelet counts drop below 5000/mm3. See text for further discussion and explanation.
Regardless of the cause, anemia produces decreased exercise tolerance in the forms of decreased aerobic capacity (intensity), decreased endurance (requiring more rest breaks), and orthostatic intolerance. With HCT less than 25% or Hgb concentration less than 8 g/dl, physically demanding intervention is not likely to be beneficial.
Low Hgb values (8 to 10 g/dl) typically result in decreased exercise tolerance, increased fatigue, and tachycardia, conditions that may contraindicate aggressive therapeutic measures, including strength and endurance training. Treating functional limitations is often important but the timing is crucial. For example, activity tolerance is poor in anyone with hemoglobin values of less than 8 g/dL, and therapeutic intervention is limited (see Table 40-8). (See also Special Implications for the Therapist: The Anemias in Chapter 14.)
People with chronic anemia, however, are more likely to be able to perform some physical activity compared with individuals who have acute onset of anemia. Individuals with anemia may receive transfusions. Many facilities do not allow out-of-bed activity during transfusions, but others may allow careful lower level activity.
The therapist should be aware of white cell count for two important reasons. An elevated WBC count is indicative of infection. The patient is likely to have a compromised exercise tolerance and may also have precautions related to the therapist’s intervention, including contact precautions, requiring gloves, gowns, caps, masks, and shoe covers.
If the count is low, the client may be susceptible to opportunistic infections and severe complications. The importance of good hand hygiene practices cannot be overemphasized when treating these individuals. A decreased WBC count predisposes the person to infection. Special care must be taken to avoid transmitting bacteria, viruses, and fungi to the patient/client.
With a WBC of less than 1000/mm3 or a neutrophil count of less than 500/mm3, patients are usually required to wear a protective mask outside the hospital/facility room and have specialized equipment such as high efficiency particulate air (HEPA) filtration within the room. Handwashing and the use of alcohol hand sanitizer, use of patient-specific equipment, and disinfection of equipment that cannot be left in the patient’s room are necessary.
Granulocyte colony-stimulating factor (G-CSF) and/or prophylactic antibiotics may be prescribed by the physician for clients with low neutrophil counts, especially before and during chemotherapy to keep the WBC levels acceptable. Even with this medical intervention, therapists should adhere carefully to Standard Precautions and also ensure that all equipment is disinfected according to Standard Precautions when working with this population.20
Platelets initiate the clotting sequence to plug damaged blood vessels. When the platelets are less than 15,000 to 20,000/mm3, serious bleeding can occur and platelet transfusions may be required. Platelet count may be decreased for a number of reasons, whether a result of bone marrow suppression, bleeding disorders, or other diseases. As platelet count falls below 150,000/mm3, the risk of spontaneous bleeding increases. At higher platelet counts, trivial trauma may lead to bleeding. Exercise guidelines related to thrombocytopenia are given in Table 40-9.
SPECIAL CONSIDERATIONS FOR THE ONCOLOGY PATIENT
Many questions have been raised about the blood counts and exercise recommendations made in this chapter. These concerns are directed at oncology patients but may be valid for others as well. The guidelines offered here are based on current clinical practice at various cancer centers around the United States and consensus of opinion from many clinicians. There are many variables and factors to consider when using these values. They are only guidelines—a best guess given the little amount of published evidence available at the current time. Also, as mentioned in each of the appropriate tables, the therapist must make individual determinations depending on the client’s age, general health status, and disease or condition present.
More conservative treatment is considered when there is fever, known infection, a previous history of bleeding complication, or concern that overfatiguing the individual could lead to a decrease in immune function. Monitoring fatigue levels during and up to 8 hours after exercise may be warranted.48a
At the present time, there are no known studies or reports on hemorrhage as a result of exercise related to blood counts. Anecdotal stories of individual patients have been related and there is always the concern for this complication. Low platelet counts alone as a risk factor for hemorrhage are important, but the combination of low platelet counts and fever raises the risk even more. This consideration leads us to instruct patients to limit Valsalva maneuvers and maximal exertion and avoid resistive exercises when platelet levels fall below 20,000 cells/mm3.
Again, these guidelines vary; some institutions use much lower levels based on the patient population and individual health factors (e.g., history of falls or risk factors for falling, signs of bleeding such as petechiae or bruises, abnormal coagulation levels or receiving anticoagulant medication, nutritional factors such as low albumin levels).
Individuals who have received a platelet transfusion must be monitored carefully during exercise. The elevated platelet levels are sustained for 1 to 4 days, depending on individual factors and platelet consumption during that time; results are variable and unpredictable. High fever and infection can cause increased platelet consumption.19a Anyone receiving platelet transfusions whose counts rise very little at 1 hour and who need more than once daily transfusion may be refractory to transfusion and require gentle strength training to avoid muscle or joint bleeds. It is best to wait until counts are safe before instituting resistive exercises for strength training.22a
There are centers where bone marrow transplant patients who have white blood cell counts below 1000/mm3 for several weeks still exercise daily. Special satellite rehabilitation units are set up so the patients can exit their rooms with masks on, go down the hall with a nurse or therapist, and complete an exercise program on a stationary bicycle or treadmill. With airflow-controlled rooms, masks can be removed. The equipment is wiped down carefully between patients; only one patient is allowed in the room at a time.19b
What constitutes aerobic versus subaerobic exercise must be determined on an individual basis based on intensity variations applied by the therapist to the patient. Simple exercises such as ankle pumps, deep breathing, quad sets, or raising arms overhead are usually considered nonaerobic. But for some patients these types of activities (even using a bed pan or sit to stand) might become aerobic given their deconditioned status.
Whenever blood counts are in the questionable range, two comments may be used to guide the rehabilitation staff while training patients who have questionable blood count levels performing bed transfers, mobilizing to and from the bathroom or commode, and so forth37a:
This test is performed to determine the cause of altered blood cell counts or to diagnose disease of the bone marrow. Aspiration is typically performed on the posterior superior iliac spine, or the tibia of children. This test can be quite painful and the affected area can remain so for a number of days. Care must be taken to avoid touching, placing gait belts, doing manual therapy, and so forth at this site.
ERYTHROCYTE SEDIMENTATION RATE
Although not related to anemia, erythrocyte sedimentation rate (ESR, or sed rate) is clustered with other tests of RBCs and is presented in Table 40-7. Sed rate is a nonspecific test for inflammatory disorders, associated with a number of potential disorders, including cancer, autoimmune diseases, and infection. As the name implies, the test is based on how quickly RBCs sink to the bottom of a test solution containing anticoagulated (unclotted) blood. Sed rate is increased in the sense that sedimentation is more rapid (more cells sink to the bottom) when they clump together.
Clumping is caused by a change in blood proteins brought on by inflammation, specifically the presence of globulins or fibrinogen in the blood. The more severe the inflammation, the faster the sedimentation rate or settling of cells and the higher the ESR; a significant increase in the ESR warrants closer investigation
By itself, this test is nonspecific and therefore not diagnostic for any particular organ disease or injury, but the sed rate may be used as a screening test to rule out certain diseases or to monitor treatment in specific diseases such as juvenile rheumatoid arthritis, Kawasaki’s disease, temporal arteritis, gout, and polymyalgia rheumatica. It can be used as an index of musculoskeletal dysfunction (e.g., tissue injury or inflammation or bone infections).
The ESR is a fairly reliable indicator of the course of disease and therefore may be used to monitor the course of a disease or response to treatment of certain diseases. In general, as the disease worsens, the ESR increases and as the disease improves, the ESR decreases. Sed rates also increase with age.79
White Blood Cell Tests
Various disease states are characterized by their effects on specific types of WBCs. The elevation or depression of one type may be useful in diagnosis. A CBC can only demonstrate a normal level, a decreased level (leukocytopenia), or an elevated level (leukocytosis). Both the absolute numbers and the numbers of white cells relative to each other can be useful in diagnosis. An analysis of the relative numbers of different types of white cells is known as a white cell differential or diff.
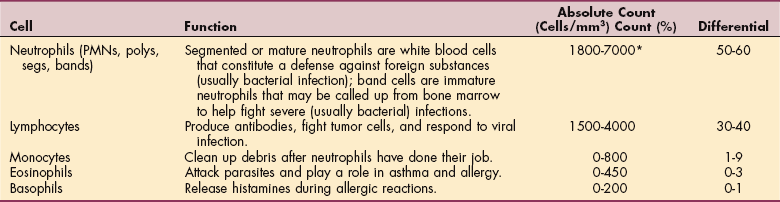
Neutrophils
Neutrophils normally represent the majority of WBCs present in the blood. A decreased number is termed neutropenia and an increased number is termed neutrophilia. Neutropenia is clinically significant as a risk factor for infection and may result from a large number of causes. In general, neutrophilia indicates the presence of infection.
Because of their appearance, neutrophils are also called polymorphonuclear (PMN) cells, or polys. Mature cells are segmented (called segs), whereas immature cells appear to be banded (bands). Bands make up about 3% to 5% of WBCs and circulate for about 6 hours before they mature into segmented neutrophils. During counting, PMNs are divided into bands and segs. the presence of relatively high numbers of immature PMNs (bands) indicates rapid production of neutrophils in response to events such as acute infection, necrosis, or autoimmune disease. This may be referred to as a left shift because of the historic method of hand counting the white cell differential.
Basophils and Eosinophils
Basophils are implicated in immune responses, particularly allergies. Eosinophils are elevated in the presence of certain disease states (eosinophilia), worm infestation, or allergies. Monocytes are blood cells that migrate into tissues as needed during injury or infection. After migration they are referred to as macrophages. The role of macrophages in immunity is described in Chapter 7.
Lymphocytes
Lymphocytes are divided into cells capable of producing antibodies (B cells) and T cells that either produce direct injury to cells carrying foreign markers or assist in modulating B and T cell function (helper and suppressor T cells). Interest in lymphocyte subtypes is primarily a result of the effect of acquired immunodeficiency syndrome (AIDS) on particular subtypes of WBCs. In particular, helper T cells are vulnerable to human immunodeficiency virus (HIV) destruction, resulting in immunosuppression. The relative populations of each is determined by the presence of cell markers denoted CD2, CD4, CD8, and CD19. Cytotoxic (killer) T cells have CD2, helper T cells have CD4, suppressor T cells have CD8, and B cells are detected by CD19. Table 40-10 lists the relative numbers of these cells. The potential indications of varying proportions in the WBC differential are listed in Table 40-11.
Table 40-10
T-and B-Cell Lymphocyte Surface Markers
| Surface Markers | Reference Value |
| T cells (CD2) | 95% |
| Helper T cells (CD4) | 24%-62% |
| Suppressor T cells (CD8) | 19%-65% |
| B cells (CD19) | 4%-25% |
| T helper/suppressor cell ratio | 0.5-2.0 |
Data from Corbett JV: Laboratory tests and diagnostics procedures, ed 7, Upper Saddle River, NJ, 2007, Prentice-Hall Health.
Table 40-11
Differential White Blood Cell Count Reference Values
*Level less than 500 is referred to as nadir; individuals undergoing chemotherapy may exhibit an absolute neutrophil count (ANC) nadir because of bone marrow suppression. Neutrophil levels bear watching because the danger of infection is related more to neutrophils or granulocytes than to the total white blood count.
HEMOSTASIS
The process of hemostasis is described in Chapter 14. Both excessive and deficient hemostasis can lead to problems. Tests relevant to hemostasis involve platelets; enzymes required to initiate, promote, or inhibit hemostasis; binding of coagulation factors; and calcium. Platelets are discussed in the previous section on CBC. Lab values related to tests of coagulation listed in Table 40-12 are referred to as the coagulation profile. Coagulation tests are important to determine whether the person clots too easily or does not clot sufficiently to prevent excessive bleeding.
Table 40-12
Coagulation Profile (Platelets)
INR, International normalized ration; PT, prothrombin time; aPTT, activated partial thromboplastin time.
*Minimal interlaboratory variability.
In addition to thrombocytopenia, disorders such as hemophilia, von Willebrand’s disease, and bone marrow suppression may lead to excessive bleeding. Therefore knowledge of coagulation status should be known before therapy that might cause bleeding is performed. This might include resistance exercise, activities with risk of falling, or sharp debridement.
Patients/clients may be anticoagulated for a number of reasons. When individuals are treated for venous thrombosis, atrial fibrillation, or coronary artery disease, they may become overly anticoagulated and bleed excessively. Tests for coagulation involve the function of the terminal products of the coagulation cascade. As discussed in Chapter 6, coagulation factors interact and result in the production of thrombin, which activates the reaction to convert fibrinogen to fibrin. The tests in the next section evaluate bleeding time, but because of how the test is performed, the tests indicate different mechanisms within the coagulation cascade.
Tests of Coagulation
Several tests are related to coagulability. Historically prothrombin time (PT) and activated partial thromboplastin time (aPTT) have been used to determine coagulability either diagnostically or to monitor anticoagulant therapy of heparin and warfarin. These medications are used for many conditions including atrial fibrillation; prevention of acute myocardial infarction in people with peripheral arterial disease; prevention of stroke, recurrent MI, or death in people who have had an MI; valvular heart disease (native and prosthetic); and venous thromboembolism (prevention or treatment).27
The international normalized ratio (INR) was developed to provide results that would not vary between laboratories. Individuals receiving anticoagulation therapy because of coronary artery disease, cerebrovascular disease, atrial fibrillation, history of deep venous thrombosis (DVT), and other reasons are anticoagulated to an INR of 2 to 3.24
As INR increases, however, the risk of bleeding with minor trauma increases and excessive bleeding may occur during surgery, as well as spontaneous bleeding. Within the past few years, low-molecular-weight heparins (LMWHs) have been developed. In spite of the greater cost, use of LMWHs has increased because of the more rapid onset of anticoagulation, lower risk of platelet-dependent thrombus formation,41 and less prolongation of bleeding time indices.23,48
Although INR has been an effective test for anticoagulation produced by heparin and warfarin, aPTT is used to monitor the effectiveness of LMWH. Therapeutic INR takes days to reach and is related more to extrinsic coagulation pathway, whereas LMWH can reduce coagulability much more rapidly as measured by aPTT, which is a better measure of intrinsic coagulation pathway.
Components of Coagulation
Specific components of coagulation may be tested on suspicion of their involvement in bleeding disorders. These include specific coagulation factors that produce hemophilia and von Willebrand’s factor.
Coagulation Factors
Individual factor testing may also be performed as a follow-up to abnormal PT, aPTT, or because of suspected coagulation factor deficiencies. Deficiencies may be genetic (e.g., hemophilia A and B) or acquired in conditions such as disseminated intravascular coagulation (DIC), liver disease, or vitamin K deficiency.1,8
Of particular interest are factors VIII and IX. Genetic defects in the production of these factors produce hemophilia A and B, respectively. Hemophilia B is also known as Christmas disease. Genetic defects may also occur in coagulation factors other than VIII and IX but are very rare. Abnormal aPTT (intrinsic pathway) with normal PT indicates involvement of factors VIII, IX, XI, or XII, whereas normal aPTT with prolonged PT (extrinsic pathway) suggests factor I, II, V, VII, or X.1
Von Willebrand’s disease, a genetic disease like hemophilia, impairs coagulation because of a lack of effective von Willebrand factor, which along with factor VIII, is necessary for binding of platelets to collagen. D-Dimer testing is performed to detect specific types of fibrin degradation products as part of the diagnosis of DVT, DIC, and pulmonary embolism (PE).39
Antiphospholipid antibodies may be tested to determine why aPTT is prolonged or to determine the cause of recurrent miscarriages. Antibodies to phospholipids can affect platelet function resulting in thrombus formation in arteries or veins and can lead to thrombocytopenia, as well as causing premature labor, preeclampsia, and second and third trimester miscarriages.
Cardiolipins are the group of these antibodies most commonly involved. Another important member of this group is lupus coagulant. These antibodies are associated with autoimmune diseases, especially systemic lupus erythematosus (SLE).
Inhibition of Coagulation
Proteins C and S regulate the rate of blood clot formation as part of a feedback loop on thrombin production. As thrombin increases, proteins C and S are produced more rapidly and slow the coagulation cascade, thereby preventing excessive coagulation. Problems with proteins C and S can be inherited or acquired. Lack of protein C or S leads to excessive or inappropriate clotting. The exces sive clotting usually occurs in veins, increasing the risk of PE, but can also occur in arteries.
CARDIOVASCULAR LAB TESTS
Cardiac biomarkers have gained increasing significance in clinical cardiology during the last 2 decades. Laboratory parameters play an important role as risk markers for coronary events in primary and secondary prevention, as well as in the diagnosis of acute myocardial infarction and heart failure. Cardiac biomarkers are increasingly used routinely.
Congestive Heart Failure
Atrial natriuretic peptide (ANP) was discovered many years ago and found to provide a minor contribution to regulation of body fluid composition. As blood volume increases, stretching the atria, the amount of ANP released increases, causing the loss of sodium and water in the urine to correct excessive volume.
A similar peptide, brain natriuretic peptide (BNP), was discovered in the brain. Subsequent research showed that BNP was also found in the ventricles, but the name was retained. Testing for BNP has gained in popularity recently.
Like ANP, BNP is related to excessive blood volume. It is used for differential diagnosis of shortness of breath as BNP is elevated in congestive heart failure (CHF).26,37 A value of greater than 100 pg/ml is considered positive for congestive heart failure. Levels of BNP rise with disease severity, so levels from 100 to 300 pg/ml generally indicate mild heart failure; 300 to 700 pg/ml indicates moderate heart failure; and levels above 700 pg/ml indicate severe heart failure.74
Research indicates that even smaller elevations of BNP above normal are indicative of impaired cardiac pump function26 and future mortality.83 The BNP test can also be used to monitor disease progression in individuals with left-sided heart failure.
Risk Factors for Atherosclerotic Disease
Although lipids are important molecules involved in the storage of energy, production of steroids and bile acids, and maintenance of cell membranes, inappropriate serum levels of certain lipids are associated with atherosclerotic vascular disease. Those of particular interest include triglycerides, cholesterol, and lipoproteins. Several blood lipids are used for screening in certain populations based on age or presence of risk factors.
Lipids
The lipids are fat substances that provide energy for metabolism and are necessary for the production of steroids, bile acids, and cellular membranes. The liver metabolizes cholesterol to its free form, which is then transported in the bloodstream by lipoproteins. Lipid measurements are important in detecting genetically determined disorders of lipid metabolism and in assessing the risk of coronary artery disease. In particular, elevation of low-density lipoprotein is a strong predictor of cardiovascular disease. A decreased level of high-density lipoprotein also increases the risk. In addition to genetic defects associated with elevated LDL, other factors, such as smoking, diet, certain drugs (oral contraceptives, sulfonamides, aspirin, and steroids), hypothyroidism, exercise, and alcohol, have been shown to alter one or both.
A full lipid profile includes total cholesterol, low-density lipoprotein (LDL), high-density lipoprotein (HDL), and triglycerides (Table 40-13). The tests may also be used to assess the need for and the efficacy of treatment.
Table 40-13
| Lipids, Lipoprotein | Expected Values (mg/dl) | Comments |
| LDL | <70 | Recommended if at very high risk for heart disease |
| <100 | Recommended if heart disease or diabetes is present | |
| <130 | Recommended if two or more risk factors are present | |
| <160 | Recommended if one or no risk factors present | |
| 160-189 | High | |
| >189 | Very high | |
| HDL | <40 | Desirable |
| >60 | Represents a negative risk factor; the higher the number, the better | |
| Total cholesterol | <200 | Desirable; recommended |
| 200-239 | Borderline high; moderate risk | |
| >240 | Higher risk | |
| Triglycerides | <150 | Recommended |
| <100 | Desirable | |
| 150-199 | Moderate risk | |
| 200-499 | High risk | |
| >499 | Very high risk | |
| >1000 | At risk for pancreatitis |
LDL, Low-density lipoprotein; HDL, high-density lipoprotein.
Risk factors include cigarette smoking, male older than 45 years old, female older than 55 years old, low HDL (less than 40 mg/dl), hypertension, family history of premature heart disease.14
Data from Executive Summary of the Third Report of The National Cholesterol Education Program (NCEP) Expert Panel on Detection, Evaluation, and Treatment of High Blood Cholesterol in Adults (Adult Treatment Panel III), JAMA 285(19):2486-2497, 2001.
For screening purposes, total cholesterol may be used. Unlike HDL, LDL, and triglycerides, total cholesterol does not need to be measured after fasting. Approximately 75% of cholesterol is bound to LDL and 25% to HDL. LDL (commonly referred to as “lousy” or “bad” cholesterol) transports excessive amounts of cholesterol because of genetic defects in LDL metabolism, whereas HDL “happy” or “good” cholesterol) is associated with removing excess cholesterol from the blood.
Triglycerides are a component of fat and are converted between glycerol, free fatty acids, and monoglycerides within the liver and adipose tissue as the need to either store or release energy arises. For example, the liver reconverts glycerol, fatty acids, and monoglycerides in adipose tissue to triglycerides when the body requires an additional source of energy.
Elevated serum triglyceride will usually occur in conjunction with elevated cholesterol and is a risk factor for atherosclerotic disease. Because cholesterol and triglycerides can vary independently, measurement of both values is more meaningful than the measurement of either substance alone. Elevated levels of triglyceride usually necessitate treatment with lipid-lowering medications. Poor glycemic control can also elevate triglycerides. A very high level of triglycerides (1000 mg/dl) is also a risk factor for pancreatitis.1 Reference values for the lipid profile are given in Table 40-13.14
Homocysteine
Other cardiac markers include homocysteine and C-reactive protein (CRP), which are both risk factors and cardiac markers. Homocysteine is a naturally occurring amino acid in the blood produced by the breakdown of various proteins in the body. It is related to free radicals, which may be involved in the oxidation of LDL and plaque formation in arteries. Homocysteine levels increase with age; high levels have a significant effect in accelerating the aging process of the arteries caused by atherosclerosis.
Homocysteine is also linked to the development of early arterial changes characteristic of development of Alzheimer’s disease, hypertension,87 and the risk of stroke.56 Lowering serum homocysteine by folic acid and B vitamin supplementation may retard the atherosclerotic process and reduce the number of heart attacks, stroke, and peripheral artery disease,33 although this has not been conclusively proved.7,16
An elevated homocysteine level is also an independent risk factor for osteoporotic fractures in older adults. The magnitude of the effect of homocysteine level on fracture risk is similar to its observed effect on the risk of cardiovascular disease and dementia.18,82
The exact mechanism for this phenomenon is not clear, but scientists suspect homocysteine interferes with collagen synthesis since homocysteine and vitamin B6 are both regulatory factors of collagen crosslinking. As with heart disease, taking supplemental folic acid and other B vitamins may lower homocysteine levels and reduce the risk of fractures.
C-Reactive Protein
CRP is produced by the liver in response to the presence of inflammation anywhere in the body. Several recent studies indicate a role of systemic inflammation in the pathogenesis of atherosclerosis and in particular an association with high-sensitivity CRP (hs-CRP). CRP is an indicator of systemic inflammation68 and may be directly involved in the atherothrombotic process itself.65
Clinically, levels of hs-CRP above 3.0 mg/L indicate elevated risk for MI and stroke, even among apparently healthy individuals with low-to-normal lipid levels.50 Elevated CRP is an independent predictor of future car- diovascular events that also predicts the risk of hypertension, diabetes, and restenosis after angioplasty.28,66 Values for these tests are listed in Table 40-14.
Table 40-14
Homocysteine and High-Sensitivity C-Reactive Protein
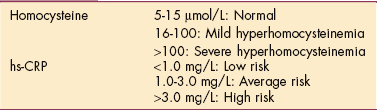
Data from Bortolotto LA, Safar ME, Billaud E, et al. Plasma homocysteine, aortic stiffness, and renal function in hypertensive patients, Hypertension 34(4 Pt 2):837-842, 2007; American Association for Clinical Chemistry (AACC): Lab tests online. Available on-line at http://www.labtestsonline.org/. Accessed August 30, 2007.
Half of all heart attacks and strokes in the United States occur in people with normal cholesterol levels, and 20% of all cardiac-related events occur in people with no major risk factors. People with low LDL and high CRP have more cardiovascular events than people with high LDL and low CRP. Using hs-CRP along with traditional methods of measuring risk may help prevent morbidity and mortality associated with vascular disease.65
CRP is associated with elevated blood sugar and triglycerides, poor diet, and sedentary lifestyle. Genetic factors may also play a significant role in CRP levels. Although the 2007 American Heart Association Guidelines for Cardiovascular Disease Prevention advise physicians to consider family history of heart attack before age 60 years but not CRP values, some independent researchers are including CRP in the development of risk scores (e.g., Reynolds Risk score).67
CRP levels are also measured in secondary prevention (individuals already diagnosed at high risk for coronary events) toward dual-goal therapy of LDL reduction and reduction of CRP levels, since CRP levels correlate with progression of atherosclerosis and clinical outcomes in individuals with coronary artery disease who are treated with statins. This reflects a change from previous policies in which it was assumed CRP levels did not provide additional information for at-risk individuals.51,64
Although not a part of this section on cardiac risk factors, elevated levels of CRP have been identified as a predictive factor in HIV disease progression, independent of CD4 T cell count and HIV ribonucleic acid (RNA) level. Levels of CRP above 2.3 mg/L may signal faster progression of HIV to AIDS and may provide additional prognostic information.40
Cardiac Enzymes and Markers
Enzymes catalyze the chemical reactions that cells need to stay alive, but the enzymes are not destroyed in the reaction and remain in the cell. Normally, these enzymes do not leak into the bloodstream (or leak in small predictable amounts), but when a cell is stressed or damaged it releases its contents (including enzymes) into the bloodstream.
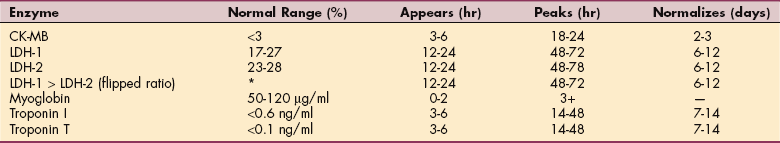
Some enzymes are present in almost all cells; others occur mainly in specific organs. The types and amounts of enzymes circulating in the bloodstream (Table 40-15) can indicate which cells (and therefore which organs) are damaged.
Table 40-15
| Isoenzyme | Where Found | Increased In |
| CK-BB | Brain | CNS surgery, cardiac arrest, Reye’s syndrome, cerebral contusion, cerebrovascular accident, malignant hyperthermia, bowel infarction, renal failure |
| CK-MB | Myocardium | MI, cardiac contusion, cardiac trauma, congestive heart failure without MI, tachyarrhythmias with underlying coronary artery disease, cardiac surgery, myocarditis |
| CK-MM | Skeletal muscle | Intramuscular injections, skeletal muscle trauma, extreme muscle exertion, tonic clonic seizures, surgery, excess alcohol (toxic effect on muscle), alcohol withdrawal syndrome, seizures, electric countershock, muscular dystrophy, severe hypokalemia, hypothyroidism, extreme hypothermia or hyperthermia |
| LDH-1 | Heart, kidney, red blood cells | MI, cardiac contusion or trauma, myocarditis, cardiac surgery; also, renal disease and infarction, hemolysis, hemolytic anemia, hemolysis with prosthetic heart valves, leukemia, pernicious or megaloblastic anemia |
| LDH-2 | Almost all tissues except skeletal muscle | Injury to any tissue except skeletal muscle |
| Troponin (I, T, C) | Contractile proteins found in heart and skeletal muscle | MI (specific isoforms or troponin I and T) |
| Myoglobin | Skeletal and cardiac muscle | Immediate rise when cardiac or skeletal muscle is damaged |
CK, Creatine kinase; CK-BB, CK-MB, CK-MM, CK subunits; LDH, lactate dehydrogenase.
The laboratory tests for differential diagnosis of chest pain have changed in recent years. Carbonic anhydrase, LDH, and AST (formerly SGOT) had been used for determining whether MI had occurred and the severity of the MI. Unfortunately, these tests were not very specific and could be elevated by muscle, liver, renal, or other system injury.
Creatine Kinase
CK is a major cytoplasmic enzyme of muscle present in three major isoenzymatic forms: skeletal muscle (MM), brain (BB), and cardiac muscle (MB). CK-MM constitutes more than 90% of serum total CK. Trauma to skeletal muscle can cause myofiber contusion and necrosis with release of CK, and elevation of total serum CK levels associated with muscle soreness. Increase in serum CK has been found to occur within 6 to 24 hours of direct muscle injury and may be an even more sensitive indication of skeletal muscle damage than magnetic resonance images.76
CK-MM levels have been found to be elevated as a result of orthopedic surgery when muscles are retracted. The effects of the retractor blade pressure on paraspinal muscles during spine surgery has been documented, with the level of CK-MM being a direct result of retraction duration and pressure.73
Elevation of this isozyme in plasma is used in conjunction with other enzymes to determine whether cardiac muscle injury has occurred. A ratio of CK-MB to total CK more than 2.5 to 3 is indicative of MI.1 CK-MB may require more than 1 to 2 days to indicate MI in the differential diagnosis of chest pain, so other tests that provide results more rapidly are indicated. These include troponin and myoglobin.54
Troponin is a molecule specific to muscle tissue; as a biochemical marker, it is quite specific for myocardial injury. Slight elevations are indicative of unstable angina or MI12 and predict whether a person can benefit from early invasive intervention (i.e., revascularization compared with conservative medical treatment).49 Those with elevated troponin are also at increased risk for mortality for the next few months.29,35
Myoglobin is a small protein involved in the transport and storage of oxygen in muscle cells that leaks out of cells soon after injury. It starts to rise within 2 to 3 hours of a MI and reaches its peak in 8 to 12 hours.1 However, it falls rapidly back to normal within 1 to 2 days after the MI and therefore could be missed as a serum marker of MI if medical attention is delayed.
LDH remains elevated for 10 to 14 days1 and can still be useful when medical attention has been delayed several days when other serum markers have returned toward normal. Characteristics for these enzymes are listed in Table 40-15. Reference values for the cardiac isozymes are given in Table 40-16.
Table 40-16
Cardiac Enzymes and Markers (Serum)
CK-MB, Creatine kinase subunit; LDH, lactate dehydrogenase.
*No actual value is reported, only that LDH-1 becomes higher than LDH-2 for a short period.
Data from Corbett JV: Laboratory tests and diagnosis procedures, ed 7 Upper Saddle River, NJ, 2007, Prentice-Hall Health.
Cardiovascular Pressures
A number of physiologic measurements are made in the ICU or coronary care unit to monitor cardiovascular health and response to treatment. These include central venous pressure (CVP), pulmonary artery wedge pressure (PAWP), and pulmonary artery pressure (PAP).
CVP is measured from a catheter introduced from a peripheral vein such as the subclavian or jugular into the right atrium. CVP indicates the working pressure of the right ventricle, which can either indicate the effectiveness of the right ventricle as a pump or the fluid status of the individual. Increased CVP indicates either poor pumping function of the right ventricle or fluid overload. Dehydration, on the other hand, causes CVP to decrease.
PAWP is an indicator of the effectiveness of the left ventricle as a pump. A balloon-tipped catheter is inserted from a central vein, through the right side of the heart, and fed into the pulmonary arterial vessel. The balloon tip is forced or wedged into a small arterial vessel, and the balloon is inflated. With the balloon inflated, the catheter is exposed only to the pressure present in the fluid between the catheter tip and the left atrium. Poor pumping function of the left ventricle leads to increased pressure as determined by PAWP.
PAP is also determined by a catheter inserted through a central vein, through the right side of the heart, and into the pulmonary arterial circulation. However, no balloon is inflated. The catheter is exposed to the fluctuations in pressure during the cardiac cycle as blood fills and is emptied from the pulmonary arterial vessels. Generally, one is interested in whether pulmonary hypertension exists. PAP can be measured by the same catheter used for PAWP by deflating the balloon and withdrawing the tip so it is no longer wedged. Table 40-17 lists reference values for vascular pressures.
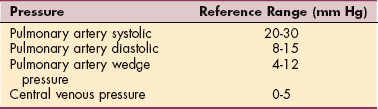
Oxygenation of the Blood
Assessing the cardiopulmonary system’s ability to deliver oxygen may be done simply and noninvasively with pulse oximetry, which provides an estimate of the relative concentrations of saturated and unsaturated Hgb by passing different wavelengths of red light through tissue and determining the absorption at these different wavelengths.
Pulse oximetry also provides the heart rate, but the device has several limitations. Its accuracy declines when arterial blood flow becomes decreased; it does not give information about the ability to rid the body of CO2 and regulate acid/base balance, and its accuracy is limited to about ±2%.
Arterial Blood Gases
A more accurate means of assessing cardiopulmonary function and the effectiveness of ventilation and oxygen transport is by analyzing the oxygen (O2) and CO2 dissolved in the blood and related chemical components. Measurements are performed on a sample of arterial blood, usually withdrawn from a radial artery. These include the partial pressures of O2 and CO2, the blood’s pH, the concentration of HCO3−, and a calculation of base excess.
The measurements are primarily used to analyze how well acid base is being regulated by the respiratory system. Under normal circumstances, regulation of pH by the respiratory system provides near maximal saturation of hemoglobin by oxygen, as well as maintaining the partial pressure of CO2 and arterial pH.
Bicarbonate and base excess are related to whether compensations for metabolic or respiratory shortfalls are occurring in regulating pH. Samples from other vessels can be taken to determine the performance of the cardiac and ventilatory pumps in their roles of gas exchange. For example, a person with good arterial blood gases (ABGs), but low venous O2 and high venous CO2would have normal gas exchange in the lungs, but poor cardiac pump performance. ABG analysis includes information about oxygenation, ventilation, and metabolic function. The test measures the amount of dissolved O2 and CO2 in arterial blood and indicates acid-base status by measuring the arterial blood pH.
The pH is inversely proportional to the hydrogen ion concentration in the blood. As the hydrogen ion concentration increases (acidosis), the pH decreases; as the hydrogen ion concentration decreases (alkalosis), the pH increases.
The specific measurements associated with ABGs include serum pH, partial pressure of CO2, HCO3−, partial pressure of O2, and O2 saturation (Table 40-18). A detailed explanation of these measures and how they interrelate is included in Chapter 5.
Table 40-18
| Term | Definition | Reference Value |
| pH | Measure of blood acidity; ratio of acids to bases. | 7.35-7.45 |
| PaCO2 | Pressure or tension exerted by CO2 dissolved in arterial blood; measures effectiveness of alveolar ventilation (i.e., how well air is exchanging with blood in the lungs). | 35-45 mm Hg |
| HCO3− | Amount of bicarbonate or alkaline substance dissolved in blood; influenced mainly by metabolic changes. | 22-26 mEq/L |
| PaO2 | Pressure exerted by O2 dissolved in arterial blood in attempting to diffuse through pulmonary membrane. | 75-100 mm Hg |
| O2 saturation | Oxyhemoglobin saturation: percentage of oxygen carried by hemoglobin. | 96%-100% |
| Critical Values | ||
| pH | <7.20 or >7.60 | |
| PCO2 | ≤20 or >70 mm Hg | |
| HC03∼ | <10 or >40 mEq/L | |
| PO2 | ≤40 mm Hg | |
| O2 saturation | <95%* |
Paco2, Partial pressure of arterial carbon dioxide; CO2, carbon dioxide; HCO3−, bicarbonate ion; PaO2, partial pressure of arterial oxygen; O2, oxygen.
*This value varies depending on the clinical situation. For example, a healthy adult with O2 saturation levels less than 95% would bear further investigation, whereas in someone who smokes, 95% saturation level would not be suspect; resting Po2 declines with aging after age 70.
Modified from Goodman CC, Snyder TE: Differential diagnosis for physical therapists: screening for referrals, ed 4, Philadelphia, 2007, WB Saunders.
Arterial blood is a good way to sample a mixture of blood that has come from various parts of the body and gives the added information of how well the lungs are oxygenating the blood. For example, if the arterial O2 concentration is normal (indicating that the lungs are functioning normally), but the mixed venous O2 is low, it can be inferred that the heart and circulation are impaired. Arterial samples provide information on the ability of the lungs to regulate acid-base balance through retention or release of CO2 and the effectiveness of the kidneys in maintaining appropriate HCO3− levels.
SERUM HORMONES
Several hormones may be affected in populations seen in physical therapy and may impact systems relevant to the provision of therapy. Most common is hypothyroidism. Alterations in parathyroid hormone, cortisol, and adrenocorticotropic hormone (ACTH) may also occur.
Thyroid hormone is necessary initially for normal growth and development. It is routinely tested in newborns in all states to detect hypothyroidism, a potential cause of cognitive delays or developmental disability when left untreated or when treatment is delayed.
In adults, a slowing of metabolism with hypothyroidism may cause sensitivity to cold; brittle, coarse skin and nails; bradycardia; constipation; and slower cognitive processing. Hypothyroidism has also been linked to musculoskeletal injuries and affective changes, including depression and anxiety.
Severe chronic hypothyroidism may progress to a condition known as myxedemic coma. Hypothyroidism may be caused by either pituitary dysfunction or thyroid dysfunction. Thyroid testing includes both thyroid-stimulating hormone (TSH) and thyroxine (T4). TSH (produced in the pituitary) stimulates the thyroid to produce thyroid hormones (T3 and T4). Elevated TSH with decreased T4 indicates thyroid disease, whereas depressed TSH indicates pituitary disease. Hyperthyroidism, most notably from Graves’ disease, may produce atrial fibrillation and exophthalmos, which is a protrusion of the eyes.
Parathyroid hormone (PTH) regulates calcium metabolism. In the face of hypocalcemia, release of PTH causes bones to release calcium into the blood.
Cortisol and ACTH are related to adrenal cortex function. ACTH is released by the anterior pituitary to stimulate release of cortisol by cells of the adrenal cortex. Cortisol, a glucocorticoid, is released in response to stress and provides glucose to circulate in the blood. In particular, protein reservoirs are made available for conversion of amino acids into fuel sources, which can damage musculoskeletal structures. Cortisol also inhibits the immune system.
Fluid volume and composition may be altered by changes in the release of several hormones. ADH may be either elevated or depressed as a result of injury to or disease of the posterior pituitary. ADH is increased in what is termed syndrome of inappropriate ADH (SIADH), causing fluid retention and hyponatremia.
The potentially life-threatening disease, diabetes insipidus, produces decreased ADH with extreme loss of water in the urine and hypernatremia. Tests may also be performed for renin, angiotensin, and aldosterone as part of a workup for low potassium (hypokalemia), muscle weakness, hypertension, or hypotension. Reference values for serum thyroid hormones are given in Table 40-19.

IMMUNOLOGIC
Diagnostic immunology or serodiagnostic testing uses blood tests to aid in the diagnosis of infectious disease, immune disorders, allergic reactions, neoplastic disease (e.g., genetic changes and tumor-related antigens), and in blood grouping and typing (not discussed further here). Blood tests can be used to determine whether particular antigens are present (bacteria, viruses, parasites, fungi, or enzymes).
Immunoglobulins, the general term for antibodies that are produced in response to antigens, are divided into five subclasses (IgA, IgD, IgE, IgG, and IgM). These classes of immunoglobulins can be differentiated by morphology and by their roles in the immune system. During lab testing, the globulins are separated by electrophoresis into different fractions. Different fractions are indicative of different diseases. For example, alpha (α)-globulin is elevated in rheumatoid arthritis and beta (β)-and gamma (γ)-globulins are elevated in multiple myeloma.
Ideally, serum is collected at the beginning of the illness during the acute phase and again 3 to 4 weeks later during the convalescent phase. An increase in the quantity (titer) of a specific antibody between these two phases is diagnostically significant. The specific antibody tests for individual antigens are beyond the scope of this chapter. The reader is referred to more comprehensive laboratory and diagnostic manuals.
Cancer Screening
Cancer has overtaken heart disease as a major cause of mortality in the United States. The Human Genome Project has advanced our knowledge of genetics used to develop molecular signatures for disease diagnosis, prediction of treatment outcomes, and final prognosis.
In the last 30 years, there have been important advances in the understanding of the molecular events that underlie the development of malignancy. New techniques to analyze genetic changes and biomarkers for tumors have advanced the diagnostic and monitoring methods for cancer.
Polymerase Chain Reaction
The polymerase chain reaction (PCR) is now a common technique used in medical and biologic research labs for a variety of tasks such as the sequencing of genes and the diagnosis of hereditary diseases, the identification of genetic fingerprints (used in forensics and paternity testing), and the detection and diagnosis of infectious diseases. The use of PCR may help prevent misclassification of prosthetic joint problems such as aseptic loosening when infection is present.4 In the future, other routine uses for PCR may include the early diagnosis of Lyme arthritis using joint fluid or a tissue sample from the synovial membrane.38
PCR has greatly simplified the analysis of DNA and facilitated the development of tests that use these changes as markers. Enough DNA can be obtained for analysis from a needle biopsy specimen or in some cases, body fluid (e.g., urine, sputum, or cerebrospinal fluid [CSF]). PCR is a simple, sensitive, and fast test of small quantities of cells.
In cancer screening, PCR is useful in analyzing DNA or RNA of the tumor when it differs from the normal DNA or RNA of the surrounding tissue. Point mutations and chromosomal translocations linked with cancer can also be identified with this technique (e.g., Philadelphia chromosome linked with leukemia or Ewing’s sarcoma). PCR may help identify asymptomatic individuals who have a familial predisposition to cancer (e.g., Li-Fraumeni syndrome or familial colon cancer).
The sensitivity of PCR for detecting nucleic acid markers of cancer make it possible to find very small amounts of disease (micrometastases). This is helpful when examining bone marrow for cancer in people being evaluated for bone marrow transplantation. Research around the use of PCR in cancer treatment is focusing now on identifying sets of genes whose expression can be correlated with response to specific drugs and drug combinations making it possible to tailor chemotherapy regimes to the individual, based on tumor or host gene expression profiles.52,55
Tumor-Associated Antigens
Knowledge of the interactions between tumor cells and the immune system have made it possible to identify tumor-associated antigens. Tumor-associated antigens discovered by these methods are being used to develop passive (humoral), as well as active immunotherapy strategies to stimulate the immune system. Development of biomarkers is ongoing in hopes of developing better screening techniques for early detection,47 along with identifying strategies for antitumor vaccines.
Investigations and identification of gene expression profiles and prognostic markers for different types of cancer (e.g., breast, prostate, ovarian, or lung) are ongoing. Efforts to find molecular methods to detect disease recurrence and micrometastases using biomarkers is also underway. Although not completely reliable, tumor-antigen markers such as prostate-specific antigen (PSA) and CA-125 for ovarian cancer are already in use.
Rheumatoid Factor
Rheumatoid factor (RF), an anti-γ-globulin antibody, is elevated in rheumatoid arthritis and Sjögren’s syndrome. However, a negative test does not rule out either disease. Approximately 20% of those diagnosed with these diseases are negative for RF. A positive RF test may also occur with chronic diseases, such as SLE, endocarditis, syphilis, tuberculosis, sarcoidosis, cancer, and viral infections, and other diseases.1
Antinuclear Antibodies
Antinuclear antibodies (ANA) are generally related to SLE. Exacerbations of SLE are related to elevations in ANA, which may occur with events such as exposure to sunlight. Human leukocyte antigen (HLA) represents the genetic contribution to the immune system. Inheritance of certain HLA proteins increases the risk of specific diseases, especially spondyloarthropathies such as ankylosing spondylitis, reactive arthropathy, Reiter’s syndrome, and psoriatic arthropathy. Not all persons with a certain HLA pattern will develop the disease, but those who do have a greater probability for its development than the general population. Other diseases and related HLA proteins are listed in Table 40-20.
Table 40-20
Diseases Associated with HLA Antigens*
| Disease | HLA Antigen |
| Ankylosing spondylitis | HLA-B27 (present in 90% of cases) |
| Multiple sclerosis | HLA-B27, HLA-Dw2, HLA-A3, HLA-B18 |
| Myasthenia gravis | HLA-B8 |
| Psoriasis | HLA-B13, HLA-B17 |
| Reiter’s syndrome, reactive arthritis | HLA-B27 |
| Juvenile insulin-dependent diabetes | HLA-Bw15, HLA-B8 |
| Graves’ disease | HLA-B27 |
| Juvenile rheumatoid arthritis | HLA-B27, HLA-DR4 |
| Autoimmune chronic active hepatitis | HLA-B8 |
| Polymyalgia rheumatica | HLA-DR4 |
HLA, Human leukocyte antigens.
*HLA testing is used to confirm the diagnosis and is not usually regarded as diagnostic by itself.
Data from Pagana KD, Pagana JJ: Mosby’s diagnostic and laboratory test reference, ed 8, St Louis, 2006, Mosby.
URINALYSIS
Urine is a very complex fluid, composed of 95% water and 5% solids. It is the end-product of metabolic processes carried out in the body. Although urine contains thousands of dissolved substances, the three main components are water, urea, and sodium chloride.
Some constituents of the blood (e.g., glucose) have a renal threshold; that is, a certain elevated level must be reached in the blood before showing up in the urine. Almost all substances found in the urine are also found in the blood, although in different concentrations. Urea, for example, is present in the blood but at a much lower concentration than in the excreted urine.
Testing of urine is centuries old. Simple yet important screening tests are done easily with small patches placed on urine dipsticks. Important components of urinalysis include color, specific gravity, glucose, ketone, WBCs, RBCs (occult blood), electrolytes, and drug screens.
Color and Appearance
The color of urine is related to a number of factors and the most important is its concentration. A pale yellow color is considered normal. Dilution of solute within increased volume of urine decreases its color, whereas reduced volume caused by dehydration increases its yellow appearance. The presence of blood with intact RBCs produces a more purple-to-red color and hemolyzed blood produces a smoky appearance.
Color may also be altered by medications, including antibiotics, some laxatives, chlorzoxazone (a muscle relaxant), and Pyridium. Pyridium is an anesthetic used for treating the burning pain of urinary tract infection that colors the urine orange. The ingestion of certain foods (e.g., rhubarb, carrots, and beets) or some vitamins and supplements can cause a change in the color of urine.
Dark brown urine may occur with liver disease or with DIC. Highly concentrated urine (e.g., decreased hydration or renal dysfunction) is also colored differently depending on the individual and may appear dark yellow, gold, or orange, often accompanied by a strong odor. Asparagus can also bring about a characteristic odor to the urine, and certain vitamin and herbal supplements can change the color (e.g., vitamin C can cause the urine to turn a bright yellow or orange).
Bleeding from the upper urinary tract (kidney and ureters) may produce dark red urine, whereas bleeding in the lower urinary tract (bladder and urethra) produces bright red urine. Occult blood, meaning hidden blood, represents a more subtle change in urine color than the red, purple, or smoky-appearing urine and is tested as part of urinalysis. Bleeding can indicate a number of disorders such as kidney stones, infection, or cancer. Frank purulence (visible pus in the urine) or a cloudy appearance is indicative of infection of the urinary tract.
Specific Gravity
Specific gravity is a test to measure the kidney’s ability to concentrate urine and depends on the state of hydration; specific gravity is an indicator of the solute present in urine. A high specific gravity indicates concentrated urine, whereas a low specific gravity indicates dilute urine. Renal dysfunction is suspected when the kidney is unable to concentrate or dilute the urine.
Dilute urine has a specific gravity approaching 1.0, whereas the specific gravity caused by dehydration may reach 1.2 or greater. Specific gravity correlates with color. Urine with a specific gravity close to 1.0 will be clear, whereas specific gravity closer to 1.2 produces dark yellow urine.
When urine gives a positive result for occult blood but no RBCs are seen on a microscopic examination, myoglobinuria is suspected. Myoglobinuria is the excretion of myoglobin, a muscle protein, into the urine as a result of traumatic muscle injury (e.g., automobile accident, football injury, or electric shock), muscle disorder (e.g., muscular dystrophy, arterial occlusion to a muscle), or certain kinds of poisoning (e.g., carbon monoxide).
Glucose and Ketones
Glucose and ketones present in the urine represent alterations in glucose metabolism. Glucose present in the urine indicates saturation of the active transport mechanism for glucose from the filtered urine. Under normal circumstances, virtually all glucose that filters from the blood can be reabsorbed from the urine.
When the blood glucose level exceeds the reabsorption capacity of the renal tubules, glucose will be spilled into the urine. Failure to absorb all of the glucose indicates a very high plasma glucose concentration and most likely diabetes mellitus.
Ketones in the urine represent the failure to obtain sufficient glucose metabolism, leading to a shift of triglyceride metabolism from the Krebs cycle to the production of ketones. In healthy individuals, ketone bodies are formed in the liver and are completely metabolized so that only negligible amounts (if any) appear in the urine.
However, when glucose cannot be transferred into the cell because of an insufficiency or inefficiency of insulin, carbohydrate metabolism is altered, and fat becomes the alternate body fuel (instead of carbohydrates), producing excessive amounts of ketones. Both diabetes mellitus and starvation (including eating disorders) may be the cause of increased ketones in the urine. Table 40-21 lists reference values for urinalysis.

DRUG SCREENING
Drug screening may be encountered for two primary reasons. Employees of healthcare institutions may be subjected to preemployment screening, random tests, and testing after significant incidents at work. Policies vary between facilities and may include screening of students on clinical affiliations. Patients may also be tested as part of the diagnostic process.
Tests may be performed for a number of substances, including alcohol, amphetamines, methamphetamines, barbiturates, cocaine, LSD, marijuana, opiates, phencyclidine, and other drugs that might impair employee performance or confound patient diagnosis including analgesics, tranquilizers, sedatives, and stimulants.
MICROBIOLOGIC STUDIES
A large number of microbiologic studies are available to identify potential causes of infection. Identification of the pathogen aids in the prognosis and treatment of infectious disease. In particular, patients may be placed in isolation, requiring special attention to their therapy. Gram stains and cultures are the most commonly encountered microbiologic studies in the therapy practice.
Gram Stain
Gram stain is used to distinguish organisms that take up the stain (gram positive) from those that do not. A number of common pathogens are gram positive, including Staphylococcus and Streptococcus species. Gramnegative organisms frequently require different antimicrobial drugs. Potassium hydroxide (KOH) is used for identifying fungal infection. Acid-fast testing is generally for determining tuberculosis infection. Acid-fast bacillus (AFB) is a term generally applied to Mycobacterium tuberculosis. Testing is done on sputum samples but may also be done with samples obtained from bronchoscopy or other tissue or fluid samples.
Cultures
Cultures are obtained to detect the presence of bacteria in the blood (e.g., bacteremia), sputum (e.g., pneumonia or tuberculosis), pleural fluid (e.g., empyema), throat (e.g., streptococci, meningococci, or gonococci), urine (e.g., urinary tract infection), skin (e.g., staphylococci, streptococci, or Pseudomonas), and wounds (e.g., staphylococci, streptococci, or Pseudomonas).
Other cultures may include stool and anal, CSF, cervical, and urethral cultures. Cultures are usually performed on the basis of clinical presentation (e.g., chills, fever, or pus). Cultures should be performed before antibiotic therapy is initiated (often the culture is taken and the antibiotic dispensed before results are known); otherwise, the antibiotic may interrupt the organism’s growth in the laboratory.
Samples of tissue or body fluids are used to determine the species or quantity of microbes present. A quantitative culture by tissue biopsy or fluid obtained by needle aspiration is best to determine the number of organisms present. Infection, delayed wound healing, and failure of skin grafts are associated with cultures numbering 100,000 or more organisms per gram. β-Hemolytic Streptococcus causes infection at a lower number per gram of tissue.71
Blood cultures are taken when systemic infection is suspected. These may be done when patients have indwelling catheters, localized infection, and other risk factors in the presence of fever, malaise, or anorexia. Skin, even in healthy individuals, is expected to have a number of organisms on its surface. In particular, species of Streptococcus, Staphylococcus, and various fungi are commonly present. In some cases, virulent strains may become present and lead to infection. Infection may take the form of a crusty, honey-colored area (impetigo), spread through follicles (folliculitis), cause abscess formation (furuncles), spread through fascial planes (carbuncles), or appear as fungal manifestations such as ringworm or athlete’s foot.
Wounds are frequently cultured for a number of reasons. Both quantitative and qualitative cultures may be taken to determine the appropriate medical treatment. Swab cultures with culturettes are still used frequently but only represent surface bacteria, which may not be the source of the infection. Biopsy of the wound or removal of fluid deep in the wound is more likely to identify the problematic microbes than a swab.
PULMONARY FUNCTION TESTS
Tests may be performed for screening purposes or for diagnosis of specific pulmonary diseases. Pulmonary function studies may reveal abnormalities in the airways, alveoli, and pulmonary vascular bed early in the course of disease when physical examinations and x-ray studies are still normal. In addition, the location of an airway abnormality can be determined (i.e., upper airway, large airway, or small airway).
Tests include static lung volumes, dynamic breathing tests, and physiologic tests. Imaging may also be used to augment these tests. These tests can provide additional information for the physical examination of the person with compromised respiratory function such as distinguishing obstructive from restrictive disease, separating airway disease from issues with elasticity, and determining central from peripheral causes of breathing disorders.
Static lung volumes are shown in Table 40-22. These are obtained with a spirometer that records volumes of air that move in and out of the lungs during breathing. Norms based on height, age, and sex are available for comparison of the individual’s results. These values include tidal volume (TV), inspiratory reserve volume (IRV), expiratory reserve volume (ERV), and vital capacity (VC).
Table 40-22
Pulmonary Function Test Components
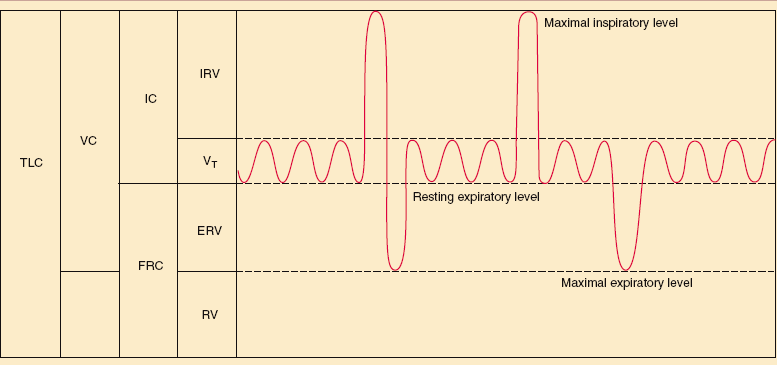
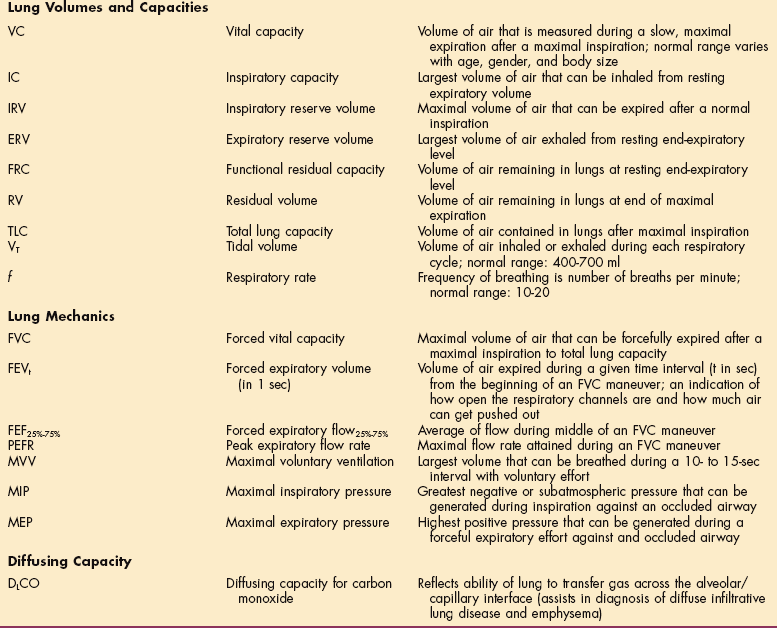
From Black JM, Hawks J, editors: Medial-surgical nursing: clinical management for positive outcomes, ed 7, Philadelphia, 2005, WB Saunders.
TV is the amount that is inspired with a normal breath. The amount that can be inspired in addition to that volume with a maximal inspiratory effort is the IRV. The amount of air that can be expired beyond the normal expiration using maximal expiratory effort is the ERV. Additional volumes are determined by dilution techniques that can be used to compute the volume of air present in the lungs. The residual volume (RV) present in the lungs at the end of maximal expiration is determined by use of helium or nitrogen dilution techniques. When this volume is determined, both functional residual capacity (FRC) and total lung capacity (TLC) can be computed. FRC is computed by adding RV to ERV. TLC is computed as RV plus ERV, TV, and IRV (see Table 40-22).
Clients with obstructive and restrictive diseases will have disease-specific changes in lung volumes and capacities. Obstructive diseases are characterized by relatively decreased expiratory function, most simply by computing the ratio of forced expiratory volume in 1 second (FEV1) to forced vital capacity (FVC). Obstructive lung diseases result in air trapping and associated symptoms. The TLC will be increased with severe disease along with lung hyperinflation (seen on chest radiograph). Obstructive disease is also characterized by increased RV and FRC.
Restrictive disease is characterized by diminished volumes of all types and difficulty taking a deep breath, although FEV1/FVC may be normal or greater than normal because of excessive stiffness of the lungs. Functional testing also includes the maximal ability to ventilate test, in which the person is asked to breathe as deeply and quickly as possible. This test is referred to as the maximum voluntary ventilation (MVV).
A simple device frequently used for screening persons with asthma is the peak flow meter. The person expires as forcefully as possible for one breath. The device is individualized for a given person with areas of the scale marked with colors to indicate whether function is adequate (green), some intervention is needed (yellow), or emergency care should be sought (red).
FLUID ANALYSIS
Samples of fluid may be drawn from a number of body compartments. Tests are performed for a variety of reasons including determining the cause of fluid accumulation in these spaces, determining whether these compartments are infected, or whether cancer or other cells or substances are present. Compartments may include the area around the brain and spinal cord, joints, the spaces around the lungs or heart, and in the abdomen.
Cerebrospinal Fluid
This fluid surrounds the brain and spinal cord and exists in cavities within the brain called ventricles and within the central canal of the spinal cord. CSF is typically collected by a lumbar puncture. At this site distal to the end of the spinal cord, a needle can be introduced without risk of injuring the spinal cord.
Both the composition and pressure of CSF may be analyzed. Infections (meningitis) may be determined by both presence of bacteria and by alterations in the normal composition of CSF. Pressure within the CSF space may be altered through blockage of the normal flow and reabsorption mechanisms of the brain, which may alter cerebral function or even cause death.
The presence of immunoglobulins (Ig) may be indicative of other disorders, especially the presence of IgG with multiple sclerosis. Other indications for lumbar puncture are included in Box 40-2.
Appearance
Testing of CSF involves measurement of a variety of substances and states. Standard pathologic levels of substances found in the CSF are listed in Box 40-3. Appearance is normally clear; cloudiness indicates a disease state, graded from 0 to 4 (indicating progressive levels of cloudiness); 0 denotes a clear fluid, and 4 indicates inability to see newsprint through the fluid. Bilirubin accumulating in the body (jaundice) can give the CSF a yellow tinge, and blood in the fluid will cause it to turn pink.
Cells found in the CSF usually indicate an abnormality in the central nervous system (CNS), since the CSF is normally virtually free of cells. Cell types found in disease or trauma include WBCs, macrophages, cartilage cells, glial cells, bone marrow, and various tumor cells.
Levels of inorganic compounds in the CSF can reflect disorders of the nervous system. Calcium can alter the activation of various neurotransmitters, and low levels are implicated in seizure disorders. Low levels of calcium are also associated with tetany and tumors of the diencephalon. Increased levels of calcium are seen in meningitis.
Magnesium levels will drop in the person with meningitis and ischemic brain disorders. Increased levels of magnesium are seen after intracranial hemorrhage. CSF sodium levels normally change as the plasma levels change. Sodium levels can be out of proportion in the CSF in encephalomalacia and tuberculous meningitis. Elevated potassium levels are seen in neonatal hemorrhage, aspiration pneumonia, seizure disorders, and cardiac arrest.
Glucose concentrations in CSF usually parallel plasma levels but have a 4-hour lag period. Decreased levels are seen as a result of subarachnoid hemorrhage, hypoglycemia, neoplastic or inflammatory infiltration of the meninges, and many forms of meningitis. LDH is increased in meningitis. Amino acids acting as neurotransmitters in CSF represent an important regulatory mechanism. Levels are increased in meningitis and in CSF blocks and are decreased in multiple sclerosis. Abnormalities are found in Parkinson’s disease and depression.
The CSF plays an important role in the transport of peptides to target areas of the brain. Neuropeptides (e.g., endorphins) are related to higher brain functions, such as learning, memory, posture, and movement, as well as to emotions57 and pain mechanisms. Persons with phantom and neurogenic pain have been found to have low CSF endorphin levels.
Synovial Fluid Analysis
Arthrocentesis, the surgical puncture of a joint cavity for aspiration (withdrawal) of fluid, is performed by inserting a sterile needle into the joint space. Although the knee is the most commonly aspirated joint, arthrocentesis can be done on any major joint (e.g., shoulder, hip, elbow, wrist, ankle). This test is performed for many different reasons, such as to establish the presence of infection, crystal-induced arthritis, synovitis, or neoplasms.
Fluid may be aspirated from joints to determine the cause of joint effusion, or simply to relieve pressure caused by effusion due to acute trauma. Joint aspiration also offers the potential benefit of removing WBCs, a source of destructive enzymes, from the joint. Joint effusions may increase intraarticular pressure impairing synovial capillary perfusion. Removing synovial fluid via arthrocentesis could potentially improve the delivery of nutrients to cartilage and surrounding tissues.
Once the fluid sample is obtained, it is examined microscopically and chemically. Classification of synovial fluid is described in Table 40-23. Normal joint fluid is clear, colorless or straw-colored, and viscous because of hyaluronic acid in the absence of inflammation. A small amount of blood may be caused by needle trauma; true hemarthrosis gives the fluid a homogeneous pink or red appearance. Viscosity is reduced in people with inflammatory arthritis, and the synovial fluid tends to drip like water; fluid of high viscosity forms a string several inches long.
Table 40-23
Classification of Synovial Fluid
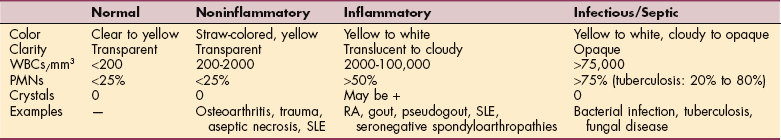
WBCs, White blood cells; PMNs, neutrophils; RA, rheumatoid arthritis; SLE, systemic lupus erythematosus.
The mucin clot test correlates with the viscosity and is performed by adding acetic acid to joint fluid. Cell counts are also performed, including a WBC count (normal joint fluid contains fewer than 200/mm3) and neutrophils (PMNs). The concentration of WBCs determines cloudiness.
Although a low WBC count usually indicates a noninflammatory condition, a higher count does not exclude traumatic effusion. Synovial fluid WBC counts may approach 100,000/μl immediately after joint surgery. Normal synovial fluid contains 25% or fewer neutrophils. A very high percentage of PMNs (>75%) is found in most people with acute bacterial infectious arthritis (see Table 40-23).
Fluid containing 70% or more of PMNs may indicate an inflammatory process even if the total WBC count is low. The presence of crystals, which is usually associated with an inflammatory process, can be determined by examining the synovial fluid under polarized light. This test is used to differentiate between gout and pseudogout and sometimes other crystal-induced arthropathies. Finding characteristic crystals does not rule out concomitant infection.
Pleural and Pericardial Fluid Analysis
Accumulations of fluid around the lungs and heart may result from inflammatory diseases, neoplastic disease, infection, or altered lymphatic drainage. Either of these compartments may be affected in isolation or both may be affected, particularly in systemic inflammatory diseases such as amyloidosis, sarcoidosis, rheumatoid arthritis, or SLE. Accumulation of fluid in the pleural space may reduce the inflation of the lungs during inspiration or increase the work of breathing, and in severe cases, cause respiratory failure.
The pericardial space may be filled with inflammatory fluid or blood. Pericarditis may produce audible changes (friction rub) and electrocardiographic changes and other symptoms. Filling of the pericardium with blood, however, is a potentially life-threatening condition called hemopericardium.
When the right side of the heart cannot fill sufficiently to maintain cardiac output, the condition is known as cardiac tamponade resulting in acute heart failure. Fluid can be drawn from either the pleural (pleurocentesis) or pericardial spaces (pericardiocentesis) with a needle for either analysis or to relieve pressure within these spaces.
Peritoneal fluid may accumulate for a large number of reasons, including hepatic failure. Fluid drawn from the peritoneum will be analyzed for infectious agents, cancer cells, electrolytes, and other fluid components to investigate the reason for ascites, the term used to describe peritoneal fluid accumulation. Withdrawal of fluid from the peritoneum is paracentesis.
References
1. American Association for Clinical Chemistry (AACC) lab tests. Available on-line at http://www.labtestsonline.org/ Accessed August 30, 2007.
2. American Thyroid Association (ATA): American Thyroid Association statement on “Wilson’s syndrome,” 2005. Available on-line at www.thyroid.org Accessed August 15, 2007.
3. Barri, Y, Knochel, JP. Hypercalcemia and electrolyte disturbances in malignancy. Hematol Oncol Clin North Am. 1996;10:775–790.
4. Bauer, TW. Diagnosis of periprosthetic infection. J Bone Joint Surg. 2006;88A(4):869–882.
5. Bergstrom, N. Treatment of pressure ulcers: clinical practice guideline no. 15. Bethesda, MD: Health and Human Services Department, Public Health Service, Agency for Health Care Policy and Research (AHCPR), 1994.
6. Boissonnault, WG, Koopmeiners, MB. Medical history profile: orthopaedic physical therapy outpatients. J Orthop Sports Phys Ther. 1994;20:2–10.
7. Bonaa, KH. Homocysteine lowering and cardiovascular events after acute myocardial infarction. N Engl J Med. 2006;354(15):1578–1588.
8. Caprini, J. Laboratory markers in the diagnosis of venous thromboembolism. Circulation. 2004;109(12 1):4S–8S.
9. Centers for Medicaid & Medicaid Services (CMS): Current procedure terminology, Available on-line at http://www.cms.hhs.gov/TransactionCodeSetsStands/04_CodeSets.asp Accessed August 16, 2007.
10. Chaves, PH. Association between mild anemia and executive function impairment in community-dwelling older women: The Women’s Health and Aging Study II. J Am Geriatr Soc. 2006;54(9):1429–1435.
11. Coyne, D, Iron indices: what do they really mean? Kidney Int. 2006(101):4S–8S.
12. Dinckal, M. Acute rest perfusion imaging in high risk unstable angina: association with troponin T and clinical endpoints. Int J Cardiovasc Imaging. 2003;19:511–517.
13. Elphick, HL. The determinants of successful in-hospital rehabilitation in people aged 90 years and older. Gerontology. 2007;53(2):116–120.
14. Executive summary of the third report of the national cholesterol education program (NCEP) Expert panel on detection, evaluation, and treatment of high blood cholesterol in adults (Adult Treatment Panel III). JAMA. 2001;285(19):2486–2497.
15. Ferry, S, Hannaford, P, Warskyj, M, et al. Carpal tunnel syndrome: a nested case-control study of risk actors in women. Am J Epidemiol. 2000;151(6):566–574.
16. Foussas, SG, Zairis, MN, Makrygiannis, SS, et al. The impact of circulating total homocysteine levels on long-term cardiovascular mortality in patients with acute coronary syndromes. Int J Cardiol. 2007;124(3):312–318.
17. Garritan, S. Laboratory values in the intensive care unit. Acute Care Perspectives. 1995;3(4):7–11.
18. Gjesdal, CG, Vollset, SE, Ueland, PM, et al. Plasma homocysteine, folate, and vitamin B12 and the risk of hip fracture: the Hordaland homocysteine study. J Bone Miner Res. 2007;22(5):747–756.
19. Glenn, MB. Serum albumin as a predictor of course and outcome on a rehabilitation service. Arch Phys Med Rehabil. 1985;75:80–84.
19a. Gmür, J. Safety and stringent prophylactic platelet transfusion policy for patients with acute leukaemia. Lancet. 1991;338:1223–1226.
19b. Gold E: Personal communication, June 2, 2008.
20. Goldman, D, Weinstein, R, Wensel, R. Strategies to prevent and control the emergence and spread of antimicrobial-resistant micro-organisms in hospitals: a challenge to hospital leadership. JAMA. 1996;275:234–240.
21. Gonzales, AS. Metabolic syndrome, insulin resistance, and the inflammation markers c-reactive protein and ferritin. Eur J Clin Nutr. 2006;60(6):802–809.
22. Grossman, LA, Kaplan, HJ, Ownby, FD, et al. Carpal tunnel syndrome-initial manifestations of systemic disease. JAMA. 1961;176:259–261.
22a. Gudas S: Personal communication, June 2, 2008.
23. Gurfinkel, E. Rationale for the management of coronary syndromes with low-molecular-weight heparins. Am J Cardiol. 1998;82:15L–18L.
24. Heit, J. Current management of acute symptomatic deep vein thrombosis. Am J Cardiovasc Drugs. 2001;1(1):45–50.
25. Hergenroeder, AL. Implementation of a competency-based assessment for interpretation of laboratory values. Acute Care Perspectives. 2006;15(1):7–15.
26. Hildebrandt, P. N-terminal pro brain natriuretic peptide in arterial hypertension-a marker for left ventricular dimensions and prognosis. Eur J Heart Fail. 2004;6:313–317.
27. Hirsh, J. Data from the Seventh ACCP Conference on Antithrombotic and Thrombolytic Therapy: evidence-based guidelines. Chest. 2004;126(3):188S–203S.
28. Hoshida, S. A persistent increase in C-reactive protein is a risk factor for restenosis in patients with stable angina who are not receiving statins. Atherosclerosis. 2004;173:285–290.
29. Hudson, M. Implications of elevated cardiac troponin T in ambulatory patients with heart failure: a prospective analysis. Am Heart J. 2004;147:546–552.
30. Hulme, JA. Fibromyalgia: a handbook for self care & treatment, ed 3. Missoula, MT: Phoenix Publishing Co., 2000.
31. Irion, G. Lab values update. Acute Care Perspectives. 2004;13(1):1–5.
32. Jones, NL, Killian, KJ. Exercise limitations in health and disease. N Engl J Med. 2000;343(9):632–641.
33. Kalra, D. Homocysteine and cardiovascular disease. Curr Atheroscler Rep. 2004;6:101–106.
34. Kelley, GA. Effects of aerobic exercise on C-reactive protein, body composition, and maximum oxygen consumption in adults: a meta-analysis of randomized controlled trials. Metabolism. 2006;55(11):1500–1507.
35. Kennon, S. Cumulative risk assessment in unstable angina: clinical, electrocardiographic, autonomic, and biochemical markers. Heart. 2003;89:36–41.
36. Khaw, KT, Wareham, N, Bingham, S, et al. Association of hemoglobin A1c with cardiovascular disease and mortality in adults. Ann Intern Med. 2004;141(6):413–420.
37. Knudsen, C. Diagnostic value of B-Type natriuretic peptide and chest radiographic findings in patients with acute dyspnea. Am J Med. 2004;116:363–368.
37a. Konecne S: Personal communication. June 2, 2008.
38. Krause, A. Early diagnosis of Lyme arthritis. Z Rheumatol. 2005;64(8):531–537.
39. Kulstad, E. A rapid quantitative turbimetric d-dimer assay has high sensitivity for detection of pulmonary embolism in the ED. Am J Emerg Med. 2004;22:111–114.
40. Lau, B. C-reactive protein is a marker for human immunodeficiency virus disease progression. Arch Intern Med. 2006;166(1):64–70.
41. Leadley, RJ. Inhibition of repetitive thrombus formation in the stenosed canine coronary artery by enoxaparin, but not by unfractionated heparin. Arterioscler Thromb Vasc Biol. 1998;18:908–914.
42. Lowe, J, Reichman, A, Yellin, J. A case-control study of metabolic therapy for fibromyalgia: long-term follow-up comparison of treated and untreated patients. Clin Bull Myofascial Ther. 1998;3(1):65–79.
43. Lowe, J, Reichman, A, Yellin, J. The process of change during T3 treatment for euthyroid fibromyalgia: a double-blind placebo-controlled crossover study. Clin Bull Myofascial Ther. 1997;2(2-3):91–124.
44. Lowe, JC, Results of an open trial of T3 therapy with 77 euthyroid female fibromyalgia patients. Clin Bull Myofascial Ther. 1996;2(1):20. [www.drlowe.com].
45. Lundberg GD: Caution-lab test ordering trouble ahead, Medscape General Medicine. Available on-line at: http://www.medscape.com/viewarticle/495665?src=mp. Accessed August 11, 2007.
46. Magnusson, P. Effect of chronic renal failure on bone turnover and bone alkaline phosphatase isoforms. Kidney Int. 2001;60:257–265.
47. Malyankar, UM. Tumor-associated antigens and biomarkers in cancer and immune therapy. Int Rev Immunol. 2007;26(3-4):223–247.
48. Meyer, G. Comparison of low-molecular-weight heparin and warfarin for the secondary prevention of venous thromboembolism in patients with cancer: a randomized controlled study. Arch Intern Med. 2002;162:1729–1735.
48a. Morris S: Personal communication. June 2, 2008.
49. Morrow, D. Ability of minor elevations of troponin I and T to predict benefit from an early invasive strategy in patients with unstable angina and non-ST elevation myocardial infarction: results from a randomized trial. JAMA. 2001;286:2405–2412.
50. Ndumele, CE. Interrelationship between inflammation, C-reactive protein, and insulin resistance. J Cardiometab Syndr. 2006;1(3):190–196.
51. Nissen, SE. Effect of intensive compared with moderate lipid-lowering therapy on progression of coronary atherosclerosis: a randomized controlled trial. JAMA. 2004;291:1071–1080.
52. Oehler, V. Monitoring patients with chronic myeloid leukemia receiving Ab1 tyrosine kinase inhibitor therapy. Clin Lymphoma Myeloma. 2007;72:58S–63S.
53. Okita, K. Can exercise training with weight loss lower serum C-reactive protein levels? Arterioscler Thromb Vasc Biol. 2004;24(10):1868–1873.
54. O’Neil, B, Ross, MA. Cardiac markers protocols in a chest pain observation unit. Emerg Med Clin North Am. 2001;19:67–86.
55. Parissenti, AM. Gene expression profiles as biomarkers for the prediction of chemotherapy drug response in human tumour cells. Anticancer Drugs. 2007;18(5):499–523.
56. Parnetti, L. Mild hyperhomocysteinemia is a risk-factor in all etiological subtypes of stroke. Neurol Sci. 2004;25:13–17.
57. Pert, C. Molecules of emotion: the science behind mind-body medicine. New York: Simon and Schuster, 1999.
58. Phalen, GS. The carpal tunnel syndrome: seventeen years’ experience in diagnosis and treatment of six hundred and fifty-four hands. J Bone Joint Surg. 1966;48A:211–228.
59. Pieracci, FM, Barie, PS. Diagnosis and management of iron-related anemias in critical illness. Crit Care Med. 2006;34(7):1898–1905.
60. Piperno, A. Increased serum ferritin is common in men with essential hypertension. J Hypertens. 2002;20(8):1513–1518.
61. Pitsavos, C. Diet, exercise, and C-reactive protein levels in people with abdominal obesity: the ATTICA epidemiological study. Angiology. 2007;58(2):225–233.
62. Plaisance, EP. Cardiovascular fitness and vascular inflammatory markers after acute aerobic exercise. Int J Sport Nutr Exerc Metab. 2007;17(2):152–162.
63. Polich, S, Faynor, SM. Interpreting lab test values. PT Magazine. 1996;4:76–88.
64. Ray, KK. Relationship between uncontrolled risk factors and C-reactive protein levels in patients receiving standard or intensive statin therapy for acute coronary syndromes in the PROVE IT-TIMI 22 trial. J Am Coll Cardiol. 2005;46(8):1417–1424.
65. Ridker, PM, C-reactive protein-inflammatory marker and more in cardiovascular disease. Medscape Cardiology. 2005;9(1). Available on-line at: www.medscape.com/viewarticle/500108 Accessed August 15, 2007.
66. Ridker, PM. C-reactive protein and the prediction of cardiovascular events among those at intermediate risk: moving an inflammatory hypothesis toward consensus. J Am Coll Cardiol. 2007;49(21):2129–2138.
67. Ridker, PM. Development and validation of improved algorithms for the assessment of global cardiovascular risk in women: the Reynolds Risk Score. JAMA. 2007;297(6):611–619.
68. Ridker, P, Cook, N. Clinical usefulness of very high and very low levels of C-reactive protein across the full range of Framingham risk scores. Circulation. 2004;109:1955–1959.
69. Riley, RS. A pathologist’s perspective on bone marrow aspiration and biopsy: I. Performing a bone marrow examination. J Clin Lab Anal. 2004;18(2):70–90.
70. Rivera-Fernandez, R. The Apache III prognostic system: customized mortality predictions for Spanish ICU patients. Intensive Care Med. 1998;24(6):574–581.
71. Robson, MC. Wound infection. A failure of wound healing caused by an imbalance of bacteria. Surg Clin North Am. 1997;77(3):637–650.
72. Sack, KE. Joint aspiration and injection: a how-to guide. J Musculo Med. 1999;16(7):419–427.
73. Schwender, JD. Minimally invasive transforaminal lumbar interbody fusion (TLIF). Technical feasibility and initial results. J Spinal Disord Tech. 2005;18(1):1S–6S.
74. Sharp, A. The utility of BNP in clinical practice. J Renin-Angiotensin-Aldosterone System. 2004;5(2):53–58.
75. Siscovick, DS, Raghunathan, TE, Psaty, BM, et al. Diuretic therapy for hypertension and the risk of primary cardiac arrest. N Engl J Med. 1994;330:1852.
76. Soritcher, S. Light concentric exercise and heavy eccentric muscle loading effects on creatine kinase, MRI, and markers of inflammation. Int J Sport Med. 1995;16:280–292.
77. Stein, PD. Antithrombotic therapy in patients with mechanical and biological prosthetic heart valves. Chest. 2001;119:220S–227S.
78. Swan, L. A path toward “master clinician”. PT Magazine. 1996;4:81–84.
79. Taffet, GE. Age-related physiologic changes. In: Cobbs EL, ed. American Geriatrics Society Geriatrics Review syllabus. ed 4. Malden, MA: Blackwell Publishing; 1999:1131–1135. [2001].
80. Tefferi, A. How to interpret and pursue an abnormal complete blood cell count in adults. Mayo Clin Proc. 2005;80(7):923–936.
81. Teixera de Lemos, E. Exercise training is associated with improved levels of C-reactive protein and adiponectin in ZDF (type 2) diabetic rats. Med Sci Monit. 2007;13(8):BR168–174.
82. Van Meurs, JB. Homocysteine levels and the risk of osteoporotic fracture. N Engl J Med. 2004:2033–2041.
83. Wang, T. Plasma natriuretic peptide levels and the risk of cardiovascular events and death. N Engl J Med. 2004;350:655–663.
84. West, F, Mitchell, SA. Evidence-based guidelines for the management of neutropenia following outpatient hematopoietic stem cell transplantation. Clin J Oncol Nurs. 2004;8(6):601–613.
85. Wluka, AE, Cicuttini, FM, Spector, TD. Menopause, oestrogens and arthritis. Maturitas. 2000;35(3):183–199.
86. Wrede, CE. Association between serum ferritin and the insulin resistance syndrome in a representative population. Eur J Endocrinol. 2006;154(2):333–340.
87. Yasmin, Falzone, R. Determinants of arterial stiffness in offspring of families with essential hypertension. Am J Hypertens. 2004;17:292–298.
88. Zimmerman, JE. Evaluation of acute physiology and chronic health evaluation III predictions of hospital mortality in an independent database. Crit Care Med. 1998;26(8):1317–1326.
89. Zimmerman, JE. Intensive care unit length of stay: benchmarking based on Acute Physiology And Chronic Health Evaluation (APACHE) IV. Crit Care Med. 2006;34(10):2517–2529.