Chapter 19 Alternative and specialized imaging modalities
INTRODUCTION
An array of medical imaging modalities has been developed in recent years and these continue to be developed at a phenomenal rate. Totally new imaging techniques have been introduced, while the resolution and image quality of existing systems are continually being refined and improved. Research and development have focused on manipulating and altering all three of the basic requirements for image production — the patient, the image-generating equipment (to find alternatives to ionizing radiation) and the image receptor. Digital image receptors (solid-state and photostimulable phosphor plates) are now used routinely (see Ch. 6). More and more sophisticated computer software is being developed to manipulate the image itself, once it has been captured. Many of these imaging modalities are playing an increasingly important role in dentistry. As a result, clinicians need to be aware of them and their application in the head and neck region. The main specialized imaging modalities include:
This chapter provides a summary of these modalities and their main applications in the head and neck region.
CONTRAST STUDIES
These investigations use contrast media, radiopaque substances that have been developed to alter artificially the density of different parts of the patient, so altering subject contrast — the difference in the X-ray beam transmitted through different parts of the patient’s tissues (see Ch. 18). Thus, by altering the patient, certain organs, structures and tissues, invisible using conventional means, can be seen (see Fig. 19.1). Contrast studies, and the tissues imaged, include:
• Sialography — salivary glands
• Lymphography — lymph nodes and vessels
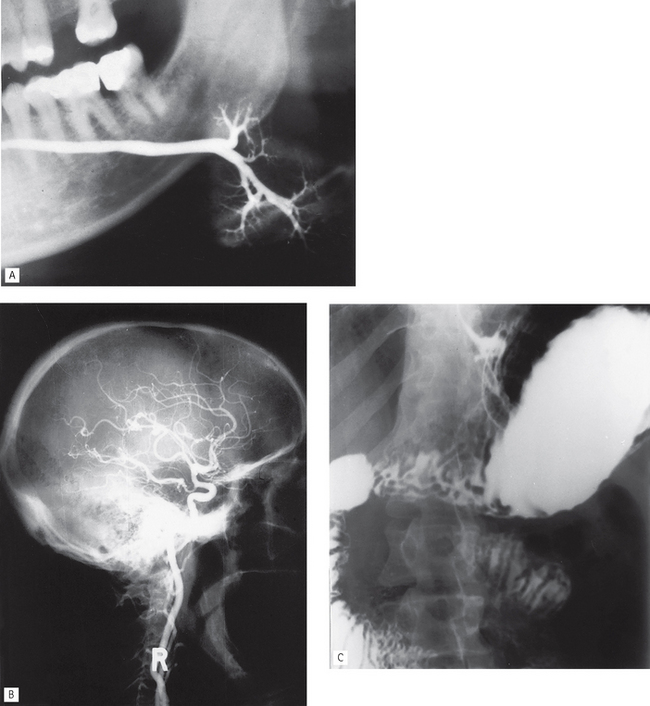
Fig. 19.1 Examples of different contrast studies. A A left submandibular gland sialograph. B A lateral skull angiograph showing contrast media in the branches of the right internal carotid artery. C An abdominal radiograph following a barium meal showing contrast media in the stomach, duodenum and small bowel.
(B, courtesy of Mrs J. E. Brown)
Types of contrast media
Harmful effects of contrast media
Ideally, contrast media should have no harmful effects at all. However, there is a small risk associated with their use, especially with the iodine-based aqueous solutions (the so-called general contrast media) when they are introduced into the blood stream. Considering a single dose of contrast medium contains more than 2000 times as much iodine as the body’s total physiological content, adverse or residual effects are remarkably rare.
Important point to note
Several of the newer imaging modalities now being used more routinely in dentistry, as discussed later, rely heavily on the use of these contrast-enhancing agents and clinicians should therefore be aware of the risks involved.
Main contrast studies used in the head and neck
• Sialography — (see Ch. 33)
• Arthrography — (see Ch. 29)
• Computed tomography — to provide general enhancement (see later)
• Angiography — this involves the introduction of aqueous iodine-based contrast media into selected blood vessels. In the head and neck region, this involves usually the carotids (common, internal or external) or the vertebral arteries.
The procedure usually entails introducing a catheter into a femoral artery followed by selective catheterization of the carotid or vertebral arteries, as required, using fluoroscopic control. Once the catheter is sited correctly, the contrast medium is injected and radiographs of the appropriate area taken (see Fig. 19.1B).
Main indications for angiography in the head and neck
• To show the vascular anatomy and feeder vessels associated with haemangiomas.
• To show the vascular anatomy of arteriovenous malformations.
• Investigation of suspected subarachnoid haemorrhage resulting from an aneurysm in the Circle of Willis.
• Investigation of transient ischaemic attacks possibly caused by emboli from atheromatous plaques in the carotid arteries.
RADIOISOTOPE IMAGING
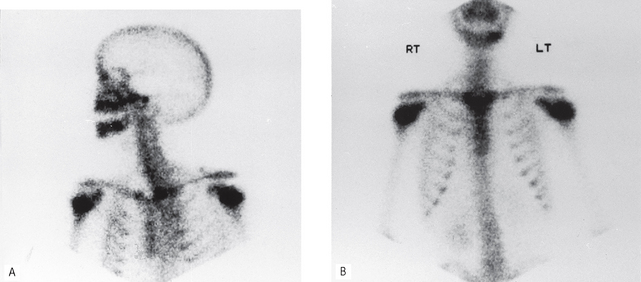
Radioisotope imaging relies upon altering the patient by making the tissues radioactive and the patient becoming the source of ionizing radiation. This is done by injecting certain radioactive compounds into the patient that have an affinity for particular tissues — so-called target tissues. The radioactive compounds become concentrated in the target tissue and their radiation emissions are then detected and imaged, usually using a stationary gamma camera (see Fig. 19.2). This investigation allows the function and/or the structure of the target tissue to be examined under both static and dynamic conditions.
Radioisotopes and radioactivity
Radioisotopes, as defined in Chapter 2, are isotopes with unstable nuclei which undergo radioactive disintegration. This disintegration is often accompanied by the emission of radioactive particles or radiation. The important emissions include:
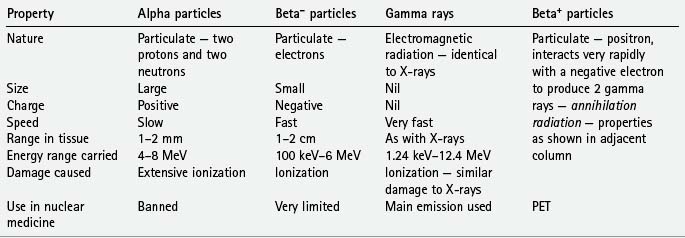
The main properties and characteristics of these emissions are summarized in Table 19.1.
Radioisotopes used in conventional nuclear medicine
Several radioisotopes are used in conventional nuclear medicine, depending on the organ or tissue under investigation. Typical examples together with their target tissues or target diseases include:
• Technetium (99mTc) — salivary glands, thyroid, bone, blood, liver, lung and heart
99mTc is the most commonly used radioisotope. Its main properties include:
• Single 141 keV gamma emissions which are ideal for imaging purposes
• A short half-life of 6½ hours which ensures a minimal radiation dose
• It is readily attached to a variety of different substances that are concentrated in different organs, e.g.:
• It can be used on its own in its ionic form (pertechnetate 99mTcO4−), since this is taken up selectively by the thyroid and salivary glands
Main indications for conventional isotope imaging in the head and neck
• Tumour staging — the assessment of the sites and extent of bone metastases.
• Investigation of salivary gland function, particularly in Sjögren’s syndrome (see Ch. 33)
• Assessment of continued growth in condylar hyperplasia.
• Investigation of the thyroid.
• Brain scans and assessment of a breakdown of the blood–brain barrier.
Disadvantages
• Poor image resolution — often only minimal information is obtained on target tissue anatomy.
• The radiation dose to the whole body can be relatively high.
• Images are not usually disease-specific.
• Difficult to localize exact anatomical site of source of emission.
Further developments in radioisotope imaging techniques include:
• Single photon emission computed tomography (SPECT), where the photons (gamma rays) are emitted from the patient and detected by a gamma camera rotating around the patient and the distribution of radioactivity is displayed as a cross-sectional image or SPECT scan enabling the exact anatomical site of the source of the emissions to be determined.
• Positron emission tomography (PET). As shown in Table 19.1, some radioactive isotopes decay by the emission of a positively charged electron (positron) from the nucleus. This positron usually travels a very short distance (1–2 mm) before colliding with a free electron. In the ensuing reaction, the mass of the two particles is annihilated with the emission of two (photons) gamma rays of high energy (511 keV) at almost exactly 180° to each other. These emissions, known as annihilation radiation, can then be detected simultaneously (in coincidence) by opposite radiation detectors which are arranged in a ring around the patient. The exact site of origin of each signal is recorded and a cross-sectional slice is displayed as a PET scan. The major advantages of PET as a functional imaging technique are due to this unique detection method and the variety of new radioisotopes which can now be used clinically. These include:
As in conventional nuclear medicine, these radioisotopes can be used on their own or incorporated into diverse and biologically important compounds (e.g. glucose, amino acids, and ammonia) and then administered in trace amounts to study:
PET can therefore be used to investigate disease at a molecular level, even in the absence of anatomical abnormalities apparent on CT or MRI (see later). It is also possible to superimpose a PET scan on a CT scan, by a technique known as co-localization, to determine a lesion’s exact anatomical position. Clinically it has been used in the management of patients with epilesy, cerebrovascular and cardiovascular disease, dementia and malignant tumours.
COMPUTED TOMOGRAPHY (CT)
CT scanners use X-rays to produce sectional or slice images, as in conventional tomography (see Ch. 16), but the radiographic film is replaced by very sensitive crystal or gas detectors. The detectors measure the intensity of the X-ray beam emerging from the patient and convert this into digital data which are stored and can be manipulated by a computer as described in Chapter 7. This numerical information is converted into a grey scale representing different tissue densities, thus allowing a visual image to be generated (see Fig. 19.3).
Equipment and theory
The CT scanner is essentially a large square piece of equipment (the gantry) with a central circular hole as shown in Figure 19.4A. The patient lies down with the part of the body to be examined within this circular hole. The gantry houses the X-ray tubehead and the detectors. The mechanical geometry of scanners varies. In so-called third-generation scanners, both the X-ray tubehead and the detector array revolve around the patient, as shown in Figure 19.4. In so-called fourth-generation scanners, there is a fixed circular array of detectors (as many as 1000) and only the X-ray tubehead rotates, as shown in Figure 19.4C. Whatever the mechanical geometry, each set of detectors produces an attenuation or penetration profile of the slice of the body being examined. The patient is then moved further into the gantry and the next sequential adjacent slice is imaged. The patient is then moved again, and so on until the part of the body under investigation has been completed. This stop–start movement means the investigation takes several minutes to complete and the radiation dose to the patient is high.
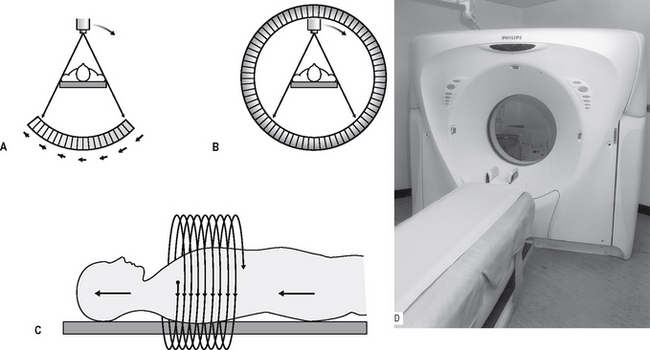
Fig. 19.4 Diagrams showing the principles of A a third-generation CT scanner — both the X-ray tubehead and the detector array rotate around the patient, B a fourth-generation CT scanner — the X-ray tubehead rotates within a stationary ring of detectors, and C spiral CT — the tubehead and detectors move in a continuous spiral motion around the patient as the patient moves continuously into the gantry in the direction of the solid arrows. D The Philips MX 8000 multislice spiral CT scanner.
As a result, spiral CT has been developed in recent years. Acquiring spiral CT data requires a continuously rotating X-ray tubehead and detector system in the case of third-generation scanners or, for fourth-generation systems, a continuously rotating X-ray tubehead. This movement is achieved by slip-ring technology. The patient is now advanced continuously into the gantry while the equipment rotates, in a spiral movement, around the patient, as shown in Figure 19.4D. The investigation time has been shortened to only a few seconds with a radiation dose reduction of up to 75%.
Whatever type of scanner is used, the level, plane and thicknesses (usually between 1.5 mm and 6 mm) of the slices to be imaged are selected and the X-ray tubehead rotates around the patient, scanning the desired part of the body and producing the required number of slices. These are usually in the axial plane, as was shown in Figure 19.3.
The sequence of events in image generation can be summarized as follows:
• As the tubehead rotates around the patient, the detectors produce the attenuation or penetration profile of the slice of the body being examined.
• The computer calculates the absorption at points on a grid or matrix formed by the intersection of all the generation profiles for that slice.
• Each point on the matrix is called a pixel and typical matrix sizes comprise either 512 × 512 or 1024 × 1024 pixels. The smaller the individual pixel the greater the resolution of the final image (as described for digital imaging in Chs 6 and 7).
• The area being imaged by each pixel has a definite volume, depending on the thickness of the tomographic slice, and is referred to as a voxel (see Fig. 19.5).
• Each voxel is given a CT number or Hounsfield unit between, for example, +1000 and −1000, depending on the amount of absorption within that block of tissue (see Table 19.2).
• Each CT number is assigned a different degree of greyness, allowing a visual image to be constructed and displayed on the monitor.
• The patient moves through the gantry and sequential adjacent sections are imaged.
• The selected images are photographed subsequently to produce the hard copy pictures, with the rest of the images remaining on disc.
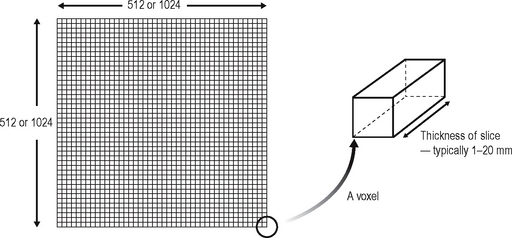
Table 19.2 Typical CT numbers for different tissues
| Tissue | CT number | Colour |
|---|---|---|
| Air | −1000 | Black |
| Fat | −100 to −60 | |
| Water | 0 | |
| Soft tissue | +40 to +60 | |
| Blood | +55 to +75 | |
| Dense bone | +1000 | White |
Image manipulation
The major benefits of computer-generated images are the facilities to manipulate or alter the image and to reconstruct new ones, without the patient having to be re-exposed to ionizing radiation (see also Ch. 7).
Window level and window width
These two variables enable the visual image to be altered by selecting the optimal range and level of densities to be displayed.
• Window level — this is the CT number selected for the centre of the range, depending on whether the lesion under investigation is in soft tissue or bone.
• Window width — the range selected to view on the screen for the various shades of grey, e.g. a narrow range allows subtle differences between very similar tissues to be detected.
Reconstructed images
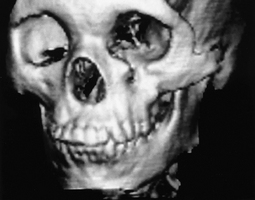
The information obtained from the original axial scan can be manipulated by the computer to reconstruct tomographic sections in the coronal, sagittal or any other plane that is required, or to produce three-dimensional images, as shown in Figure 19.6. However, to minimize the step effect evident in these reconstructed images, the original axial scans need to be very thin and contiguous or overlapping with a resultant relatively high dose of radiation to the patient.
Main indications for CT in the head and neck
• Investigation of intracranial disease including tumours, haemorrhage and infarcts.
• Investigation of suspected intracranial and spinal cord damage following trauma to the head and neck.
• Assessment of fractures involving:
• Assessment of the site, size and extent of cysts, giant cell and other bone lesions (see Fig. 19.7).
• Assessment of disease within the paranasal air sinuses (see Ch. 29).
• Tumour staging — assessment of the site, size and extent of tumours, both benign and malignant, affecting:
• Investigation of tumours and tumour-like discrete swellings both intrinsic and extrinsic to the salivary glands.
• Investigation of osteomyelitis.
• Preoperative assessment of maxillary and mandibular alveolar bone height and thickness before inserting implants (see Ch. 24).
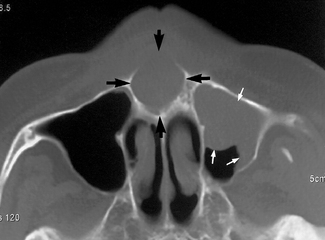
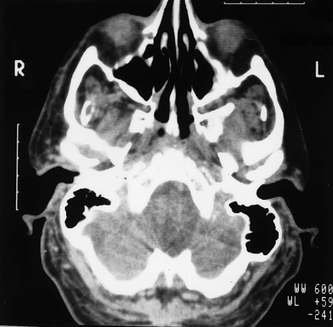
Fig. 19.7 Part of an axial CT scan showing an expansive cystic lesion in the anterior palate (black arrows). Mucosal thickening within the antrum is also evident (white arrows).
(Kindly provided by Dr J. Kabala and Dr J. Luker).
Appropriate examples of CT scans are included in later chapters.
Advantages over conventional film-based tomography
• Very small amounts, and differences, in X-ray absorption can be detected. This in turn enables:
• Axial tomographic sections are obtainable.
• Reconstructed images can be obtained from information obtained in the axial plane.
• Images can be enhanced by the use of IV contrast media to delineate blood vessels.
Disadvantages
• The equipment is very expensive.
• Very thin contiguous or overlapping slices resulting in a generally high dose investigation (see Ch. 3).
• Metallic objects, such as fillings may produce marked streak or star artefacts across the CT image.
• Inherent risks associated with IV contrast agents (see earlier).
CONE BEAM CT
Low dose cone beam CT technology has recently been developed specifically for use in the dental and maxillofacial regions and is rapidly establishing itself as the imaging modality of choice in many clinicaly situations. It is also referred to as digital volume tomography.
Equipment and theory
Several machines are currently available with new developments planned by most manufacturers of X-ray equipment. Designs vary from those resembling panoramic units to one resembling a medical CT unit, as shown in Figure 19.8.
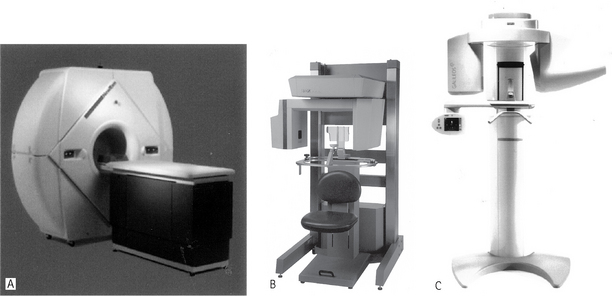
Fig. 19.8 Examples of three cone beam CT machines specially designed for imaging the maxillofacial skeleton ANewTom® 3G (NIM s.r.l. Italy). B I-CAT™ (Imaging Sciences International, Inc., USA). C Galileos (Sirona, Germany).
(Figure C kindly provided by Mr Jochen Kusch and siCAT).
The equipment employs a cone-shaped X-ray beam (rather than the flat fan-shaped beam used in conventional CT) and a special detector (e.g. an image intensifier or an amorphous silicon flat panel). The equipment orbits around the patient, taking approximately 20–40 seconds, and in one cycle or scan, images a cylindrical or spherical volume — described as the field of view. As all the information is obtained in the single scan, the patient must remain absolutely stationary throughout the exposure.
The size of the cylindrical or spherical field of view varies from one machine to another. Using a large field of view (typically 15 cm diameter) most of the maxillofacial skeleton fits within the cylindrical or spherical shape and is imaged in the one scan, as shown in Figure 19.9. Having obtained data from the one scan, the computer then collates the information into tiny cubes or voxels (typically 0.4 mm × 0.4 mm × 0.4 mm) — referred to as the primary reconstruction. Individual voxels are much smaller than in medical CT (see earlier Fig. 19.5). The voxel sizes in newer machines are even smaller (0.15 mm × 0.15 mm × 0.15 mm), so improving image resolution. Typically one scan contains over 100 million voxels. Computer software allows the operator to select whichever voxels are required in the sagittal, coronal or axial planes — referred to as secondary (or multiplanar) reconstruction, as shown in Figure 19.9.
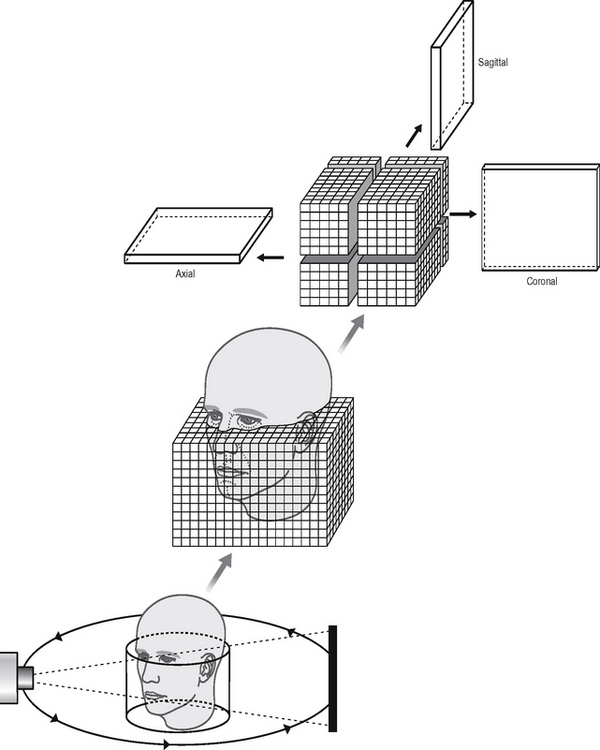
Fig. 19.9 Diagram showing the basic concept of cone beam CT. A cone-shaped X-ray beam is used which orbits once around the patient obtaining information in a cylindrical volume. The patient’s maxillofacial skeleton is positioned within the cylinder and is divided up into tiny cubes or voxels. Computer manipulation (multiplanar reconstruction) of the data obtained allows separate images in the sagittal, coronal and axial planes to be created.
Sagittal, coronal and axial images appear simultaneously on the computer monitor (see Fig. 19.10). Selecting and moving the cursor on one image, for example the sagittal image, automatically alters the other two reconstructed coronal and axial slices, so allowing images to be scrolled through in real time.
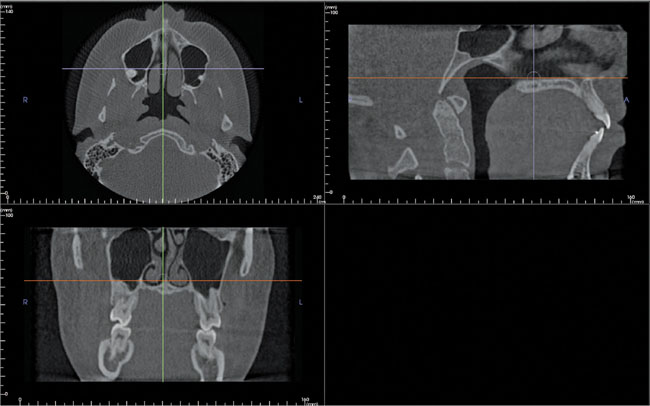
Fig. 19.10 An example of the i-CAT monitor screen showing axial, sagittal and coronal images simultaneously. Each image has two cursor lines (arrowed) allowing the images in the selected plane to be scrolled through in real time.
(Reproduced with kind permision of Imaging Sciences International, Inc.)
Multiplanar reconstruction also allows voxels in other planes to be selected. For example, it is possible to plot the curvature and shape of the dental arch to enable the computer to construct a panoramic image made up of the voxels that coincide with the plotted arch shape (see Fig. 19.11A and B). In addition, as with medical CT, it is also possible to reconstruct cross-sectional (also referred to as transaxial) images of any part of the jaw, and with appropriate software to produce three-dimensional images (see Fig. 19.12).
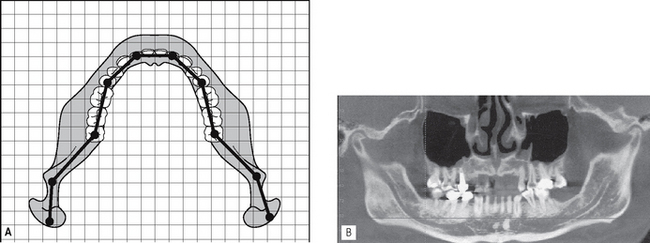
Fig. 19.11A Diagram showing how plotting the shape of the arch, identifies the cubes/voxels that are required for the computer to generate a panoramic image. B An example of a computer-generated cone beam CT panoramic image.
(Image B reproduced with kind permission of Imaging Sciences International, Inc.)
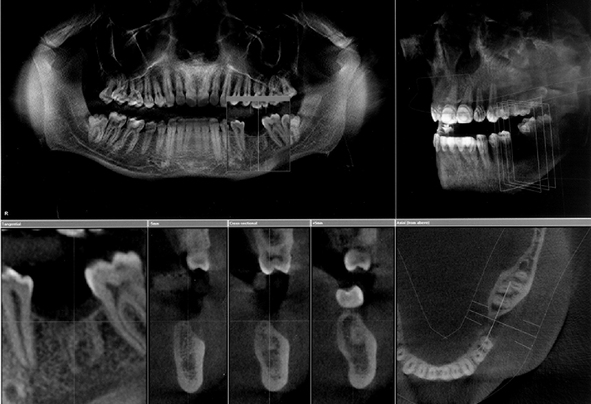
Fig. 19.12 An example of the Galileos (Sirona, Germany) monitor screen showing panoramic, three dimensional skull as well as sagittal, transaxial and axial images.
(Kindly provided by Mr Jochen Kusch and siCAT).
The equipment typically employs a high kV (90–110 kV) pulsed beam to minimize soft tissue absorption. For example, during a scan lasting 20 seconds, the patient is only exposed to ionizing radiation for about 3.5 seconds. The overall effective dose has been estimated to be in the order of 0.035–0.10 mSv, (using the proposed 2005 ICRP tissue weighting factors (see Ch. 3)), depending on the length of the scan, the size of the field of view and the type of equipment being used. This is equivalent to approximately 2–8 conventional panoramic radiographs. It is considerably lower than a medical CT scan of the mandible and maxilla which is the equivalent of 200–300 conventional panoramic radiographs. The hard tissues — teeth and bones — are imaged well using cone beam CT, but very little detail is provided on the soft tissues.
One machine, the 3D Accuitomo shown in Figure 19.13, has been developed which only images a very small cylinder of information (4 cm in diameter and 3cm tall). This enables high resolution images of specific teeth to be obtained, as shown in Figure 19.14, rather than the whole maxillofacial skeleton. The voxel size is a tiny 0.125 mm × 0.125mm × 0.125 mm. The dose from this unit is very low and has been estimated to be in the order of 3–4 periapical radiographs.
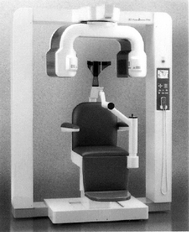
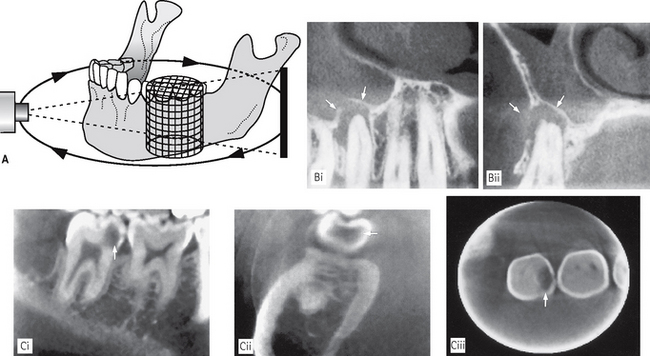
Fig. 19.14A Diagram showing the basic concept of the low dose 3D Accuitomo (J. Morita, Japan) that images a small cylindrical volume (4 cm in diameter × 3 cm in height) to produce high resolution multiplanar images of the teeth. B (i) Sagittal and (ii) coronal high resolution images showing the apical radiolucency associated with  (arrowed). Mucosal thickening with the antrum is also evident. C Examples of high resolution (i) sagittal, (ii) coronal and (iii) axial images showing the mesial carious cavity in
  (arrowed).
(Figures B and C kindly provided by Professor D. Benn.)
Main indications in the head and neck
Cone beam CT has the potential to revolutionize imaging in all aspects of dental and maxillofacial radiology. It has already been shown to be particularly valuable in:
• Investigation of all conditions affecting the mandible or maxilla including cysts, tumours, giant cell lesions and osseous dysplasias
• Investigation of the maxillary antra (see Ch. 29)
• Investigation of the TMJ (see Ch. 31)
• Implant assessment (see Ch. 24)
• Localization of unerupted teeth or odontomes (see Ch. 25)
• Assessment of lower third molars and identification of the relationship with the ID canal (see Ch. 25)
• Investigation of fractures of the mandible or middle third of the facial skeleton
• Multiplanar imaging of the teeth, periapical and periodontal tissues with the high resolution scanner. Examples of various cone beam CT images are included in later chapters.
Disadvantages
• Patient has to remain absolutely stationary.
• Soft tissues not imaged in detail.
• Computer constructed panoramic images are not directly comparable with conventional panoramic radiographs — particular care is needed in their interpretation.
• Metallic objects, such as fillings, may produce streak or star artefacts as with medical CT.
ULTRASOUND
Diagnostic ultrasound is now established as the first choice imaging modality for soft tissue investigations of the face and neck, particularly of the salivary glands (see Ch. 33). It is a non-invasive investigation that uses a very high frequency (7.5–20 MHz) pulsed ultrasound beam, rather than ionizing radiation, to produce high resolution images of more superficial structures. The use of colour power Doppler allows blood flow to be detected.
Equipment and theory
Several machines are available — an example is shown in Figure 19.15. The high frequency ultrasound beam is directed into the body from a transducer placed in contact with the skin. Jelly is placed between the transducer and the skin to avoid an air interface, as shown in Figure 19.15A. As the ultrasound travels through the body, some of it is reflected back by tissue interfaces to produce echoes, which are picked up by the same transducer and converted into an electrical signal and then into a real-time black, white and grey visual echo picture, which is displaced on a computer screen. Examples are shown in Figure 19.16.
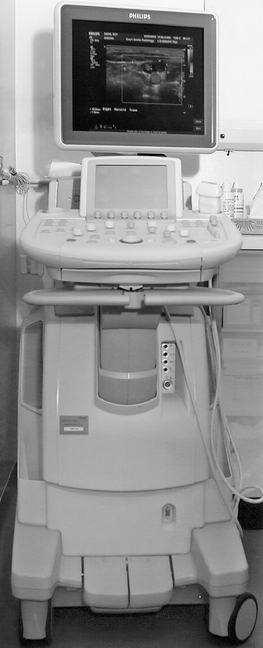
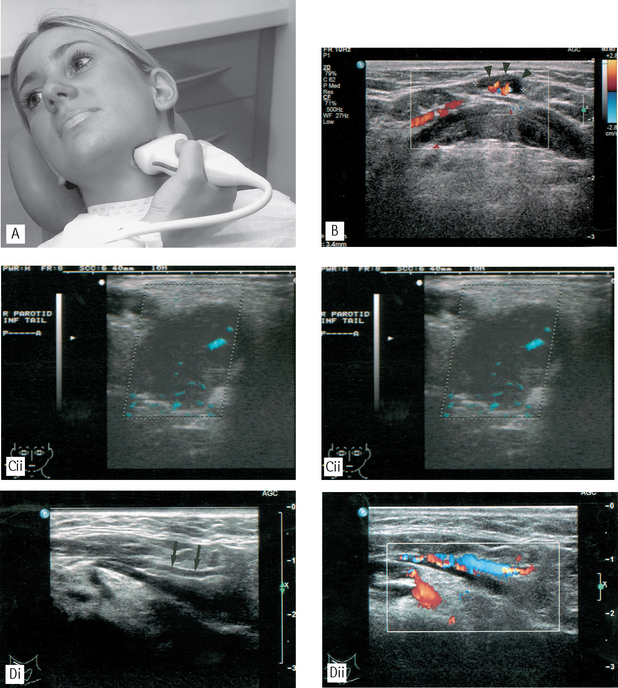
Fig. 19.16A A patient undergoing an ultrasound investigation of the left submandibular salivary gland. The transducer is placed against the skin overlying the gland. Note the jelly between the transducer and the skin. B Ultrasound image of the submental region showing the use of Doppler colour flow imaging to detect blood flow in the hilar vessels of a small submental lymph node (arrow heads). C (i) Ultrasound image of a pleomorphic adenoma in the parotid gland showing a hypoechoic (dark) mass with a well-defined, lobulated outline; (ii) Ultrasound image of the same patient with colour power Doppler showing blood flow in the fine vessels within the benign tumour. D Ultrasound image of the submental region demonstrating the value of colour Doppler imaging in differentiating vessels from other structures; (i) shows a submental vessel (arrowed) while (ii) illustrates blood flow within the vessel.
(Figures B, C and D kindly provided by Mrs J.E. Brown.)
The ultrasound image is also a sectional image or tomograph, but it represents a topographical map of the depth of tissue interfaces, just like a sonar picture of the seabed. The thickness of the section is determined by the width of the ultrasound beam. Areas of different density in the black/white echo picture are described as hypoechoic (dark) or hyperechoic (light).
Utilization of the Doppler effect — a change in the frequency of sound reflected from a moving source — allows the detection of arterial and/or venous blood flow as shown in Figure 19.15. As can be seen, the computer adds the appropriate colour, red or blue, to the vascular structures in the visual echo picture image, making differentiation between structures straighforward.
The ultrasound wave must be able to travel through the tissue to return to the transducer. If it is absorbed by the tissue, no image will result. Since air, bone and other calcified materials absorb nearly all the low frequency ultrasound beam its diagnostic use is limited. However, the newer high frequency machines enable penetration of more superficial structures to provide high resolution images.
Main indications for ultrasound in the head and neck
• Evaluation of swellings of the neck, particularly those involving the thyroid, cervical lymph nodes or the major salivary glands — ultrasound is now regarded as the investigation of choice for detecting solid and cystic soft tissue masses.
• Detection of salivary gland and duct calculi (see Ch. 33).
• Determination of the relationship of vascular structures and vascularity of masses with the addition of colour flow Doppler imaging.
• Assessment of blood flow in the carotids and carotid body tumours.
• Assessment of the ventricular system in babies by imaging through the open fontanelles.
• Therapeutically, in conjunction with the newly developed sialolithotripter, to break up salivary calculi into approximately 2-mm fragments which can then pass out of the ductal system so avoiding major surgery.
Advantages over conventional X-ray imaging
• Sound waves are NOT ionizing radiation.
• There are no known harmful effects on any tissues at the energies and doses currently used in diagnostic ultrasound.
• Images show good differentiation between different soft tissues and are very sensitive for detecting focal disease in the salivary glands.
Disadvantages
• Ultrasound has limited use in the head and neck region because sound waves are absorbed by bone. Its use is therefore restricted to the superficial structures.
• Technique is operator dependent.
• Images can be difficult to interpret for inexperienced operators.
• Real-time imaging means that the radiologist must be present during the investigation.
MAGNETIC RESONANCE (MR)
Magnetic resonance is another specialized imaging modality that does not involve the use of ionizing radiation. It is now widely available and is becoming increasingly sophisticated and important in imaging intracranial and soft tissue lesions.
Essentially it involves the behaviour of protons (positively charged nuclear particles (see Chap. 2)) in a magnetic field. The simplest atom is hydrogen, consisting of one proton in the nucleus and one orbiting electron, and it is the hydrogen protons that are used to create the MR image. The image itself is another example of a tomograph or sectional image that at first glance resembles a CT image.
Equipment and theory
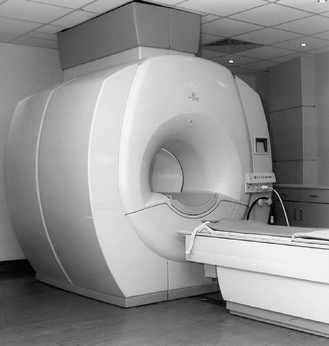
An example of an MR machine is shown in Figure 19.17. The basic principles on how it works can be summarized as follows:
• The patient is placed within a very strong magnetic field (usually between 0.5–1.5 Tesla). The patient’s hydrogen protons, which normally spin on an axis, behave like small magnets to produce the net magnetization vector (NMV) which aligns itself readily with the long axis of the magnetic field. This contributes to the longitudinal magnetic force or magnetic moment which runs along the long axis of the patient.
• Radiowaves are pulsed into the patient by the body coil transmitter at 90° to the magnetic field. These radiowaves are chosen to have the same frequency as the spinning hydrogen protons. This energy input is thus readily absorbed by the protons inducing them to resonate.
• The excited hydrogen protons then do two things:
• This magnetic moment now lies transversely across the patient and since it is moving around the patient, it is in effect a fluctuating magnetic force and is therefore capable of inducing an electrical current in a neighbouring conductor or receiver.
• Surface coils act as receiver coils and detect the small electrical current induced by the signal for a long time and appear white on so-called T2-weighted images. Fat on the other hand has a short T2, produces a weak signal and appears dark on a T2-weighted image.
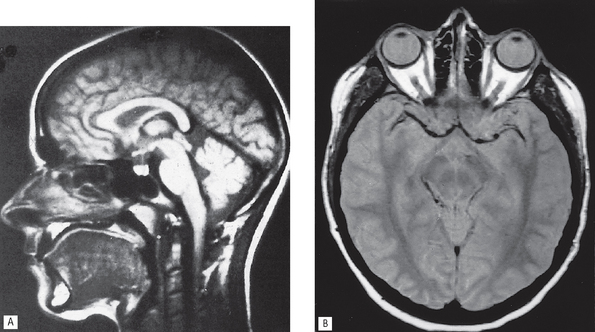
• As the hydrogen atoms relax, they drop back into the long axis of the main magnetic field and the longitudinal moment begins to increase. The rate at which it returns to normal is described by the time constant T1. Fluids have a long T1 (i.e. they take a long time to re-establish their longitudinal magnetic moment), produce a weak signal and appear dark on so-called T1-weighted images (see Fig. 19.18). Again fat behaves in the opposite manner and has a short T1, produces a strong signal and appears white on a T1-weighted image.
• The computer correlates this information and images may be produced that are either T1- or T2-weighted to show up differences in the T1 or T2 characteristics of the various tissues. Essentially T1-weighted images with a strong longitudinal signal show normal anatomy well, whereases T2-weighted images with a strong transverse signal show disease well.
• Alternatively, since the signal emanates principally from excited hydrogen protons, an image can be produced which indicates the distribution of protons in the tissues — the so-called proton density image where neither T1 or T2 effects predominate.
• By varying the frequency and timing of the radiofrequency input, the hydrogen protons can be excited to differing degrees allowing different tissue characteristics to be highlighted on a variety of imaging sequences. In addition, tissue characteristics can be changed by using gadolinium as a contrast agent, which shortens the T1 relaxation time of tissues giving a high signal on a T1-weighted image.
Main indications for MR in the head and neck
• Assessment of intracranial lesions involving particularly the posterior cranial fossa, the pituitary and the spinal cord.
• Investigation of the salivary glands (see Ch. 33).
• Tumour staging — evaluation of the site, size and extent of soft and hard tissue tumours including nodal involvement, involving all areas in particular:
• Investigation of the TMJ to show both the bony and soft tissue components of the joint including the disc position (see Ch. 31). MR may be indicated:
• Implant assessment (see Ch. 24).
Advantages
• Ionizing radiation is not used.
• No adverse effects have yet been demonstrated.
• Image manipulation available.
• High-resolution images can be reconstructed in all planes (using 3D volume techniques).
• Excellent differentiation between different soft tissues is possible and between normal and abnormal tissues enabling useful differentiation between benign and malignant disease and between recurrence and postoperative effects.
Disadvantages
• Bone does not give an MR signal, a signal is only obtainable from bone marrow, although this is of less importance now that radiologists are used to looking at MR images.
• Scanning time can be long and is thus demanding on the patient.
• It is contraindicated in patients with certain types of surgical clips, cardiac pacemakers, cochlear implants and in the first trimester of pregnancy.
• Equipment tends to be claustrophobic and noisy.
• Metallic objects, e.g. endotracheal tubes need to be replaced by non-ferromagnetic alternatives.
• Equipment is very expensive.
• The very powerful magnets can pose problems with siting of equipment although magnet shielding is now becoming more sophisticated.
• Bone, teeth, air and metallic objects all appear black, making differentiation difficult.