22 THE STRUCTURE AND FUNCTION OF THE CARDIOVASCULAR AND LYMPHATIC SYSTEMS
INTRODUCTION
The function of the circulatory system is to deliver oxygen, nutrients and other substances to all the body’s cells and to remove the waste products of cellular metabolism such as carbon dioxide. Delivery and removal are achieved by a complex array of tubing (the blood vessels) connected to a pump (the heart). The heart pumps blood continuously through the blood vessels with cooperation from other systems, particularly the nervous and endocrine systems, which are intrinsic regulators of heart and blood vessel activity. Nutrients and oxygen are supplied by the digestive and respiratory systems; gaseous wastes of cellular metabolism are blown off by the lungs; and other wastes are removed by the liver and kidneys. Of critical importance to cardiovascular function is the vascular endothelium, the cells that line the blood vessels and facilitate homeostasis. As a multifunctional system, its health is essential to normal vascular physiology and its dysfunction is a critical factor in the development of vascular disease.
THE CIRCULATORY SYSTEM
The heart pumps blood through two separate circulatory systems: one to the lungs, and one to all the other tissues and organs of the body. Structures on the right side of the heart (or right heart) pump blood through the lungs. This system is known as the pulmonary circulation. The left side of the heart (or left heart) sends blood throughout the systemic circulation, which supplies all other body cells (see Figure 22-1). The two systems are serially connected; thus, the output of one becomes the input of the other. Blood flow is always in one direction through the circulatory system, so that it moves from right heart to pulmonary circulation, then to left heart and systemic circulation.
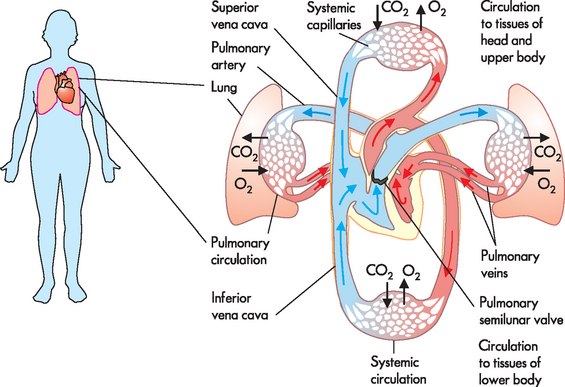
FIGURE 22-1 Blood flow through the circulatory system.
In the pulmonary circulation, blood is pumped from the right side of the heart to the gas-exchange tissues of the lungs. In the systemic circulation, blood is pumped from the left side of the heart to all other tissues of the body.
Source: Based on Thibodeau GA, Patton KT. The human body in health and disease. 5th edn. Philadelphia: Elsevier; 2010.
Arteries carry blood from the heart to all parts of the body, where they branch into increasingly smaller vessels and ultimately become a fine meshwork of capillaries (see Figure 22-2). Capillaries allow the closest contact and exchange between the blood and the interstitial fluid (interstitium) — the environment in which the cells live. The plasma passes through the walls of the capillaries into the interstitial space. Veins channel blood from capillaries in all parts of the body back to the heart.
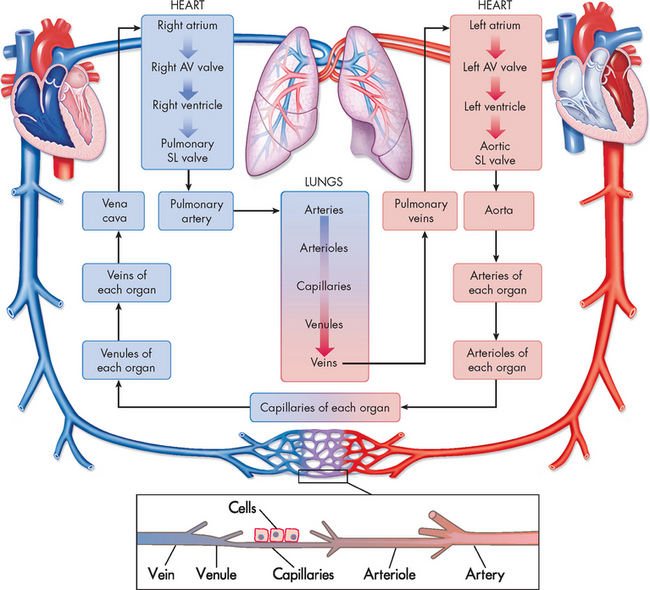
FIGURE 22-2 Diagram showing the serially connected pulmonary and systemic circulatory systems and how to trace the flow of blood.
Right heart chambers propel unoxygenated blood through the pulmonary circulation, and the left heart chambers propel oxygenated blood through the systemic circulation. AV = atrioventricular; SL = semilunar.
Source: Based on Thibodeau GA, Patton KT. Anatomy & physiology. 6th edn. St Louis: Mosby; 2007.
THE STRUCTURE OF THE HEART
The size and location of the heart
The heart weighs approximately 250–300 g in the adult and is about the size of a fist. It lies obliquely (diagonally) within the thoracic cavity in the mediastinum, an area above the diaphragm and between the lungs, slightly to the left of the midline of the body (see Figures 22-3 and 22-4). The heart is protected by the bony structures of the thoracic cage, namely the thoracic vertebrae, the sternum and the ribs. Within the mediastinum, the heart is enclosed by a fibrous pericardium. This tough sac surrounds the heart and anchors it between the major blood vessels and the diaphragm (see Figure 22-5). The apex or tip of the heart (inferior part) points towards the left hip and actually touches the chest wall between the fifth and the sixth ribs (fifth intercostal space).
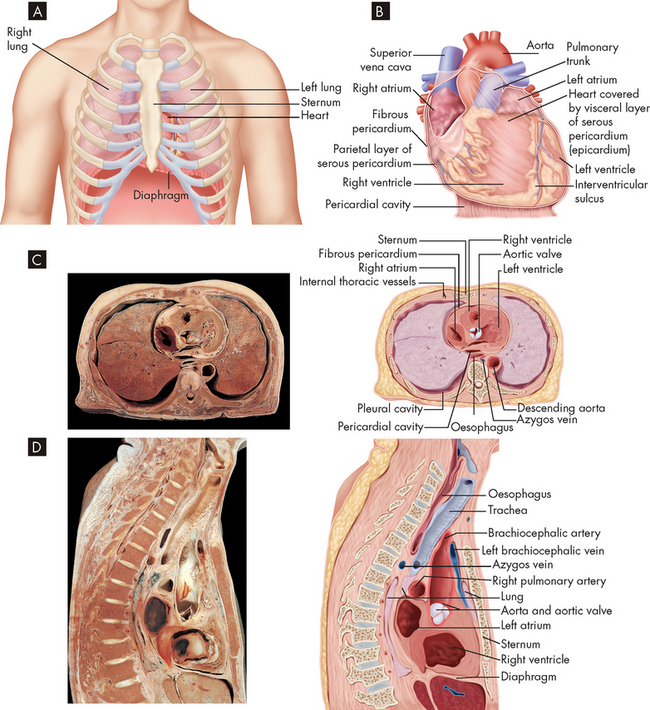
FIGURE 22-3 The location of the heart.
A The heart in the mediastinum showing its relationship to the lungs and other structures. B Detail of the heart resting on the diaphragm with the pericardial sac opened. C Transverse section of a cadaver specimen and a drawing of the thoracic structures at the level of the sixth thoracic vertebra. D Midline sagittal section of a cadaver specimen and a line drawing showing thorax structures.
Source: Patton KT, Thibodeau GA. Anatomy & physiology. 7th edn. St Louis: Mosby; 2010.
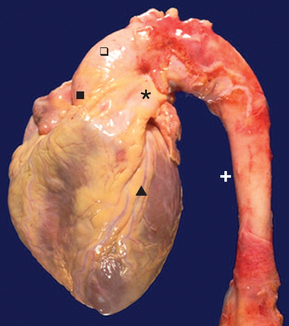
FIGURE 22-4 Normal heart and aorta, gross.
From this view can be seen the aortic root ( ), aortic arch (
 ) and thoracic aorta (+). The pulmonic trunk (*) is present. On the anterior surface of the heart is the anterior descending coronary artery (
 ).
).
Source: Klatt EC. Robbins and Cotran Atlas of Pathology. 2nd edn. Philadelphia: Saunders; 2010.
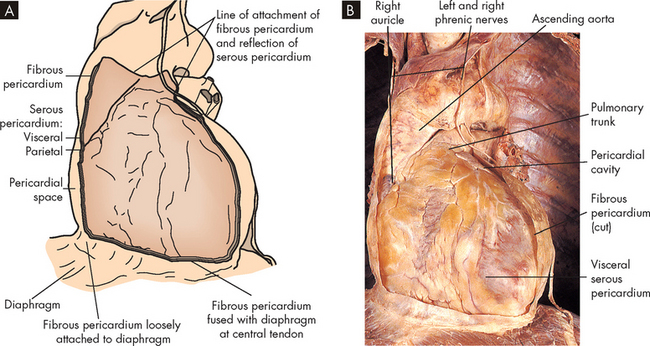
FIGURE 22-5 Right heart chambers propel unoxygenated blood through the pulmonary circulation, and the left heart propels oxygenated blood through the systemic circulation.
A The pericardial sac cut and opened to expose the anterior surface of the heart. B Cadaver dissection showing many of the structures identified in the diagram.
Source: Thibodeau GA, Patton KT. Anatomy & physiology. 6th edn. St Louis: Mosby; 2007.
The heart wall
The heart wall has three layers: the pericardium, the myocardium and the endocardium (see Figure 22-6). The serous pericardium (or epicardium) is a double-walled membranous sac that encloses the heart and: (1) prevents displacement of the heart during gravitational acceleration or deceleration; (2) serves as a physical barrier that protects the heart against infection and inflammation from the lungs and pleural space; and (3) contains pain receptors (nociceptors) and mechanoreceptors to elicit reflex changes in blood pressure and heart rate. The two layers of the serous pericardium are the parietal and the visceral pericardia (see Figure 22-6). These are separated by a fluid-filled space called the pericardial cavity. The pericardial fluid (10–30 mL) is secreted by cells of the serous pericardium and lubricates the membranes that line the pericardial cavity, enabling them to slide over one another with a minimum of friction as the heart beats.
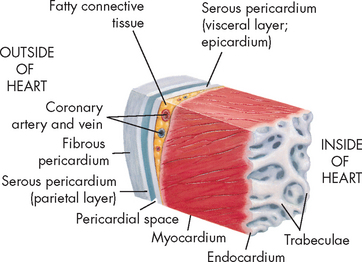
FIGURE 22-6 The wall of the heart.
This section of the heart wall shows the fibrous pericardium, the parietal and visceral layers of the serous pericardium (with the pericardial space between them), the myocardium and the endocardium. Note the fatty connective tissue between the visceral layer of the serous pericardium (epicardium) and the myocardium. Note also that the endocardium covers beamlike projections of myocardial muscle tissue called trabeculae.
The thickest layer of the heart wall, the myocardium, is composed of cardiac muscle. The thickness of the myocardium is quite different in each heart chamber and is related to the amount of work the muscle must perform — the left side of the heart does more work and has a thicker myocardium. The internal lining of the myocardium, the endocardium, consists of connective tissue and simple squamous epithelial cells (see Figure 22-6). This lining is continuous with the endothelium that lines all the arteries, veins and capillaries of the body, creating a continuous, closed circulatory system.
Heart chambers and great vessels
The heart is divided into four chambers: the right and left atria (atria = plural, atrium = singular), and the right and left ventricles. Blood passes from the right atrium to the right ventricle and then travels to the pulmonary circulation. After gas exchange in the lungs, oxygenated blood returns to the left side of the heart to the left atrium, then to the left ventricle and finally to the systemic circulation to reach all body cells. Blood flow through these chambers is illustrated in Figure 22-7.
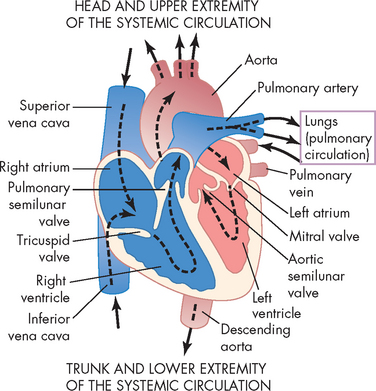
FIGURE 22-7 The course of blood flow through the heart chambers and heart valves.
Source: Guyton AC, Hall JE. Textbook of medical physiology. 11th edn. Philadelphia: Saunders; 2006.
The myocardial thickness of each cardiac chamber depends on the amount of pressure it must generate to send blood over different distances. The atria are smaller than the ventricles and have thinner walls because they are low-pressure chambers that serve as storage units for blood, which is emptied into the adjacent ventricles. The ventricles have a much thicker myocardial layer, constitute most of the bulk of the heart and provide the force to pump blood around the pulmonary and systemic circulations. The ventricular myocardium also must be strong enough to pump against pressures within the pulmonary or systemic vessels. The mean pulmonary arterial pressure is only 15 mmHg; by comparison, the mean systemic arterial pressure is much higher at about 95 mmHg. For this reason, the myocardium of the left ventricle is several times thicker than that of the right ventricle.
Blood moves in and out of the heart through several large vessels (see Figure 22-7). Blood vessels that transport blood away from the heart are called arteries, while those returning blood to the heart are called veins. The right side of the heart receives deoxygenated blood from the systemic circulation and then forces it into the pulmonary circulation. Blood returning to the heart from the pulmonary circulation is oxygenated and enters the left side and is then pumped to the systemic circulation.
The right atrium receives blood from the systemic circulation through the superior and inferior venae cavae (venae cavae = plural, vena cava = singular). The superior vena cava transports venous blood from the brain, head, neck, arms and thorax, while the inferior vena cava returns blood from the abdomen, pelvis and legs.
Blood flows from the right atrium to the right ventricle. From here, blood exits the right heart via the pulmonary trunk (or artery), which divides into right and left pulmonary arteries to transport deoxygenated blood to the right and left lungs. These pulmonary arteries branch further into the pulmonary capillary bed, where oxygen and carbon dioxide exchange occurs.
The four pulmonary veins, two from the right lung and two from the left lung, carry oxygenated blood from the lungs to the left atrium. Blood enters the left atrium and then fills the left ventricle. Blood is ejected out of the left side of the heart through the aorta (the largest artery of the body) to supply the systemic circulation. The ascending aorta has a small branch that goes to the coronary arteries of the myocardium. The aorta then curves into the aortic arch, which has branches to the head, neck, brain and arms, before extending down to the descending aorta, which supplies the rest of the body.
The relative shape of the ventricles reflects their functions. The right ventricle is shaped like a crescent or triangle, enabling a bellows-like action that efficiently ejects large volumes of blood through a very small valve into the low-pressure pulmonary system. The left ventricle is larger and bullet-shaped, helping it to eject blood through a relatively large valve opening into the high-pressure systemic circulation.
The septal membrane separates the right and left sides of the heart and prevents blood from crossing to the other side. The atria are separated by the interatrial septum (the membrane between two cavities) and the ventricles are separated by the interventricular septum. Indentations of the endocardium form valves that separate the atria from the ventricles and the ventricles from the aorta and pulmonary arteries.
Valves of the heart
One-way blood flow through the heart is ensured by the four heart valves. During ventricular relaxation or filling, the two atrioventricular valves open and blood flows from the atria into the relaxed ventricles. With increasing ventricular pressure, these valves close and prevent backflow into the atria as the ventricles contract.
The two atrioventricular valves are located in the wall between the atria and ventricles (see Figure 22-8). They consist of flaps of tissue called leaflets or cusps, which are attached to the papillary muscles by the chordae tendineae — these are strong cords of connective tissue that prevent the valves from blowing out. The papillary muscles are extensions of the myocardium that pull the cusps together and downwards at the onset of ventricular contraction when the valves close, thus preventing their backward expulsion into the atria. The right atrioventricular valve is called the tricuspid valve because it has three cusps. The left atrioventricular valve is a bicuspid (two-cusp) valve called the mitral valve (as it resembles a bishop’s headwear known as a mitre). The tricuspid and mitral valves function as a unit because the atrium, fibrous rings, valvular tissue, chordae tendineae, papillary muscles and ventricular walls are connected. Collectively, these six structures are known as the mitral and tricuspid complex. Damage to any one of the complex’s six components can alter function significantly.
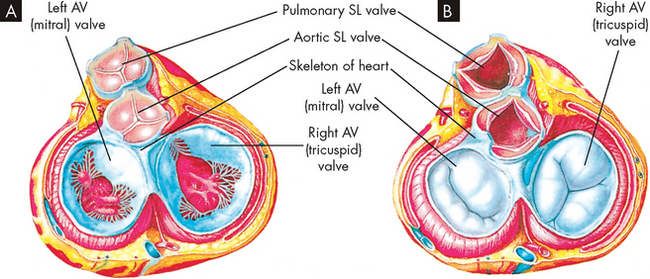
FIGURE 22-8 The structure of the heart valves.
A The heart valves in this drawing are depicted as viewed from above (looking down into the heart). Note that the semilunar (SL) valves are closed and the atrioventricular (AV) valves are open, as when the atria are contracting. B is similar to A except that the semilunar valves are open and the atrioventricular valves are closed, as when the ventricles are contracting.
Source: Thibodeau GA, Patton KT. Anatomy & physiology. 6th edn. St Louis: Mosby; 2007.
The semilunar valves of the heart are located at the junction between the ventricle and its flow-on artery. They open when intraventricular pressure exceeds aortic and pulmonary pressure and blood flows out of the ventricles and into the systemic and pulmonary circulations, respectively. After ventricular contraction and ejection, intraventricular pressure falls and the pulmonary and aortic semilunar valves close, preventing backflow into the right and left ventricles. The fibrous skeleton of the heart consists of four rings of dense fibrous connective tissue. These surround each heart valve and provide strong sites for each valve to anchor. This fibrous skeleton also somewhat divides the atrium from the ventricles.
Heart sounds
Sounds can be heard when listening to the heart using a stethoscope and are described as sounding like ‘lub-dub’. The sounds are generated by closing of the heart valves and therefore are important clinically in indicating valve abnormalities. The first sound (‘lub’) occurs during ventricular contraction and results from closure of the atrioventricular valves (left mitral valve, right tricuspid valve). The second sound (‘dub’) results from closure of the semilunar valves (pulmonary and aortic) at the beginning of ventricular relaxation.
Although we usually refer to two heart sounds, it is actually possible to ‘split’ each sound as the valves on the left side tend to close slightly before those on the right side. Furthermore, the sounds from each valve project to specific locations on the anterior thoracic wall, which assists in hearing individual valves (see Figure 22-9). Heart sounds are often difficult to auscultate (hear using a stethoscope) and require practice to distinguish differences, especially the individual valves. The valves are located as follows (see Figure 22-10):
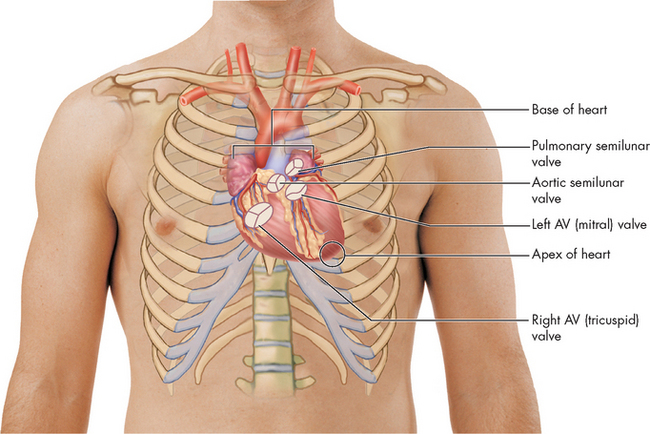
FIGURE 22-9 Relationship of the heart to the anterior wall of the thorax.
Source: Patton KT, Thibodeau GA. Anatomy & physiology. 7th edn. St Louis: Mosby; 2010.
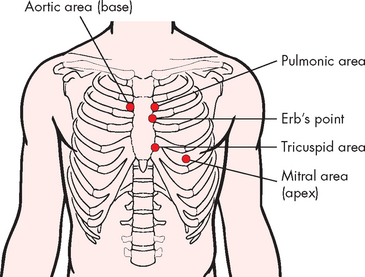
FIGURE 22-10 Cardiac auscultatory areas.
Source: Brown D, Edwards H. Lewis’s medical–surgical nursing. 2nd edn. Sydney: Mosby; 2008.
BLOOD FLOW DURING THE CARDIAC CYCLE
The pumping action of the heart consists of contraction and relaxation of the myocardial layer of the heart wall. Each contraction and the relaxation that follows it constitutes one cardiac cycle. Blood flow through the heart during a single cardiac cycle is illustrated in Figure 22-13. During diastole (relaxation), blood fills the ventricles. The ventricles fill rapidly in early diastole and again in late diastole when the atrium contracts. The ventricular contraction that follows, termed systole, propels the blood out of the ventricles and into the circulation. Contraction of the left ventricle is slightly earlier than contraction of the right ventricle (see Figure 22-14).
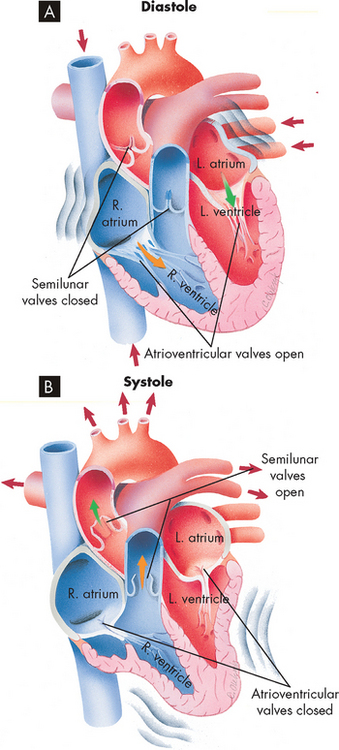
FIGURE 22-13 Blood flow through the heart during a single cardiac cycle.
A During diastole, blood flows into atria, atrioventricular valves are pushed open and blood begins to fill ventricles. Atrial systole squeezes any blood remaining in atria out into the ventricles. B During ventricular systole, the ventricles contract, pushing blood out through the semilunar valves into the pulmonary artery (right ventricle) and aorta (left ventricle).
Source: Thibodeau GA, Patton KT. Anatomy & physiology. 6th edn. St Louis: Mosby; 2007.
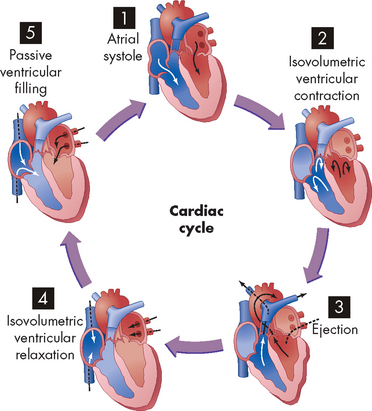
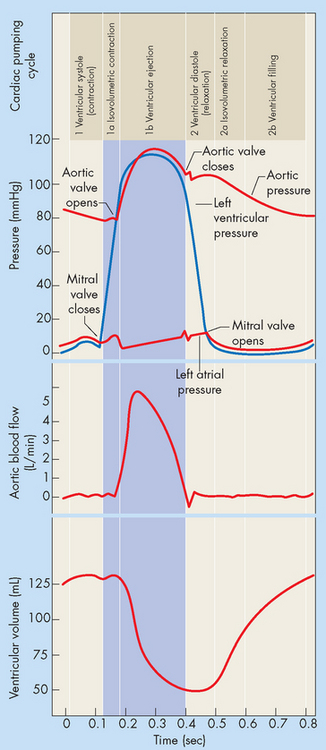
FIGURE 22-14 The phases of the cardiac cycle.
(1) Atrial systole. (2) Isovolumetric ventricular contraction. Ventricular volume remains constant as pressure increases rapidly. (3) Ejection. (4) Isovolumetric ventricular relaxation. Both sets of valves are closed, and the ventricles are relaxing. (5) Passive ventricular filling. The atrioventricular (AV) valves are forced open and the blood rushes into the relaxing ventricles.
Source: Thibodeau GA, Patton KT. Anatomy & physiology. 6th edn. St Louis: Mosby; 2007.
 PAEDIATRICS
FETAL CIRCULATION
The circulatory anatomy of the fetus is substantially different from that of a newborn. The differences reflect the presence of the umbilical cord and the functions performed by the mother.
Umbilical cord
The placenta is an organ that grows early in embryonic development and its function is to allow the exchange of nutrients, wastes and blood gases between the circulations of the mother and the fetus. Blood vessels travel between the placenta and the fetus via the umbilical cord and enter the fetus at the umbilicus (see Figure 22-11). The umbilical cord contains one umbilical vein, which returns oxygenated nutrient-rich blood from the mother, via the placenta, towards the fetal heart. Two umbilical arteries, which arise from the fetal internal iliac arteries, transport deoxygenated blood and waste products towards the placenta, to be eliminated by the mother. It is important to note that although extensive exchange between maternal and fetal blood components occurs, the two blood supplies do not actually mix.
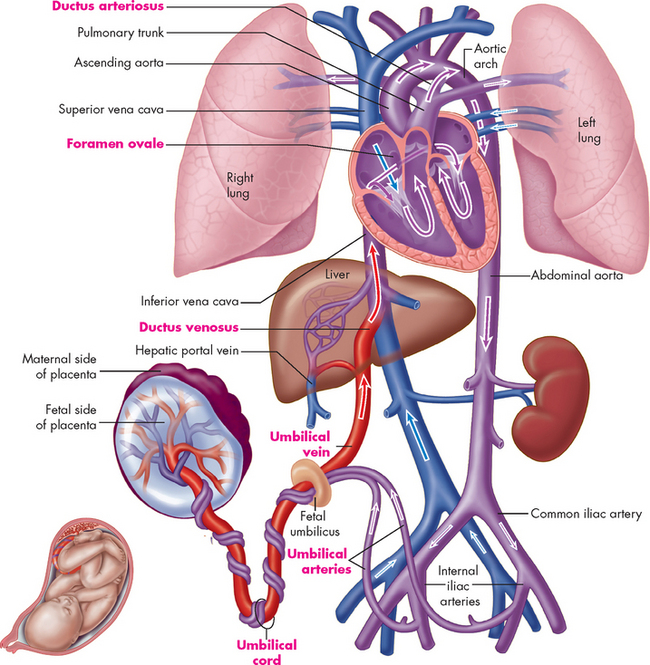
FIGURE 22-11 Plan of fetal circulation.
Before birth, the human circulatory system has several special features that adapt the body to life in the womb. These features (labelled in red type) include two umbilical arteries, one umbilical vein, ductus venosus, foramen ovale, ductus arteriosus and umbilical cord.
Source: Patton KT, Thibodeau GA. Anatomy & physiology. 7th edn. St Louis: Mosby; 2010.
Fetal circulatory features
The anatomical and physiological features of the fetal circulation are required because the placenta undertakes the functions of the lungs, digestive system, waste removal and immune function of the fetus. Accordingly, the fetal liver and lungs require only minimal blood flow and three vascular shunts bypass blood from these organs. The features that are unique to the fetus are:
These fetal shunts usually close shortly after birth to allow adequate perfusion of the lungs and liver (see Figure 22-12).
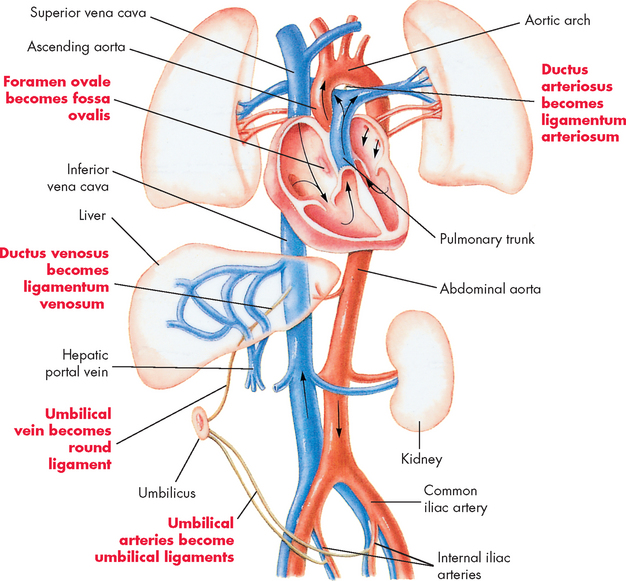
FIGURE 22-12 Changes in circulation after birth.
After birth the foramen ovale closes to become the fossa ovalis, the ductus arteriosus closes to become the ligamentum arteriosum and the ductus venosus becomes the ligamentum venosum.
Source: Thibodeau GA, Patton KT. Anatomy & physiology. 6th edn. St Louis: Mosby; 2007.
The phases of the cardiac cycle can be identified on initiation of ventricular myocardial contraction (see Figures 22-15):
THE CORONARY CIRCULATION
The blood within the heart chambers does not supply oxygen and other nutrients to the cells of the heart, as blood travels through these chambers too quickly for oxygen and other nutrients to diffuse through the layers of cells of the thick myocardium. Like all organs (including the lungs), the heart structures are nourished by vessels of the systemic circulation. The branch of the systemic circulation that supplies the heart is termed the coronary circulation and consists of coronary arteries, which receive blood through openings in the aorta called the coronary ostia. The coronary veins carry blood away from the cells and empty into the right atrium through the opening of a large vein called the coronary sinus (see Figure 22-16).
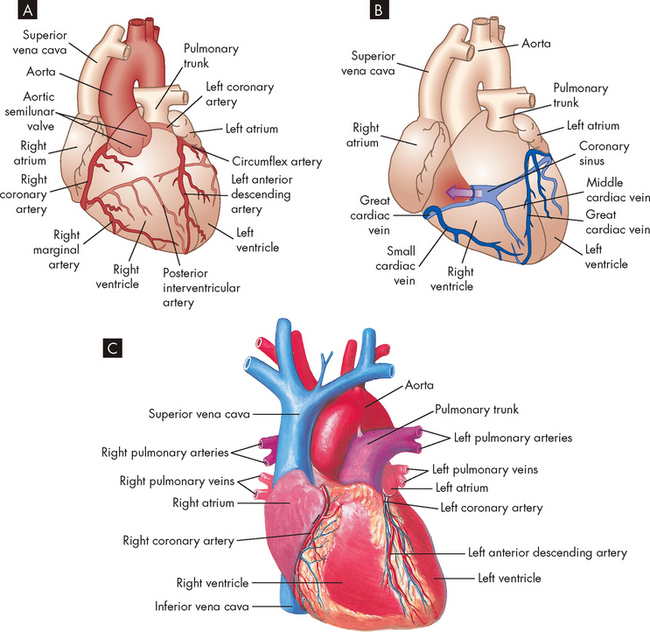
FIGURE 22-16 Coronary circulation.
A Arteries. B Veins. Both A and B are anterior views of the heart. Vessels near the anterior surface are more darkly coloured than vessels of the posterior surface seen through the heart. C View of the anterior (sternocostal) surface.
Source: A & B Thibodeau GA, Patton KT. Anatomy & physiology. 6th edn. St Louis: Mosby; 2007. C Seeley RR, Stephens TD, Tate P. Anatomy and physiology. 3rd edn. St Louis: Mosby; 1995.
Coronary arteries
The right coronary artery and the left coronary artery (see Figure 22-16) traverse the epicardium, myocardium and endocardium, and branch to become arterioles and then capillaries.2 Their main branches are outlined in Box 22-1.
Box 22-1 MAIN BRANCHES OF THE CORONARY ARTERIES
Collateral arteries
The collateral arteries are really connections, or anastomoses, between two branches of the same or the opposite coronary artery. The epicardium contains more collateral vessels than the endocardium. It may surprise you to learn that we are capable of growing new blood vessels — this process of angiogenesis may be initiated by increasing amounts of tissue (such as during weight gain or the growth of cancers) or when existing vessels are not delivering sufficient oxygen. In this case, gradual coronary occlusion results in the growth of coronary collaterals. The collateral circulation is responsible for supplying blood and oxygen to the myocardium, which has been deprived of oxygen following severe narrowing and reduced vasoelastic function (how far the blood vessel stretches) of a major coronary artery. New collateral vessels are formed through angiogenesis, which is stimulated by hypoxia and vascular endothelial growth factor.3 In response to flow, stress and pressure, collateral vessels are restructured and remodelled through the synthesis and degradation of extracellular matrix components in the vessel wall.
Coronary capillaries
The heart has an extensive capillary network. Blood travels from the arteries to the arterioles and then into the capillaries, where exchange of oxygen and other nutrients takes place. At rest, the heart extracts 70–80% of the oxygen delivered to it and coronary blood flow is directly related to myocardial oxygen consumption.4 Therefore, as myocardial oxygen requirements increase, such as during exercise, so too must coronary blood flow increase.
Coronary veins and lymphatic vessels
After passing through the extensive capillary network, blood from the coronary arteries drains into the cardiac veins, which travel alongside the arteries. Most of the venous drainage of the heart occurs through veins in the visceral pericardium. The veins then feed into the great cardiac vein (see Figure 22-16) and coronary sinus (a cavity that acts like a vein) on the posterior surface of the heart, between the atria and ventricles, in the coronary sulcus. The deoxygenated blood of the coronary sinus empties directly into the right atrium, along with deoxygenated blood returning from the remaining systemic circulation.
The myocardium has an extensive system of lymphatic vessels. With cardiac contraction, the lymphatic vessels drain fluid to lymph nodes in the anterior mediastinum that eventually empty into the superior vena cava. The lymphatics are important for protecting the myocardium against injury (see ‘The lymphatic system’ below).
STRUCTURES THAT CONTROL HEART FUNCTION
Myocardial cells
The cells of the myocardium are referred to as cardiac myocytes (muscle cells); they are composed of long, narrow fibres that contain bundles of longitudinally arranged myofibrils. The cardiac muscle is striated and shares many features with skeletal muscle (see Chapter 20). In this section, we compare skeletal and cardiac muscle and explore the features that are unique to the cells of our hearts.
Although both cardiac muscle cells and skeletal muscle cells are striated, cardiac muscle cells are short and branched, whereas skeletal muscle cells are long without branching. Skeletal muscle cells are multinucleated due to their length; however, cardiac muscle cells being much shorter have only one (or two) nuclei.
The differences between cardiac and skeletal muscle reflect heart function and enable cardiac fibres to (1) transmit action potentials quickly from cell to cell, (2) maintain high levels of energy synthesis and (3) gain access to more ions, particularly sodium and potassium, in the extracellular environment.
First, electrical impulses are transmitted rapidly from cardiac fibre to cardiac fibre because the network of fibres is connected at intercalated discs, which are thickened portions of the sarcolemma. The intercalated discs contain two junctions: desmosomes, which attach one cell to another, and gap junctions (see Figure 22-17), which allow the electrical impulse to spread from cell to cell. Together, these junctions provide a low-resistance pathway for impulse propagation. As the gap junctions allow the electrical impulses to spread between cells immediately, it allows the cardiac muscles to contract in unison, creating a functional syncytium.
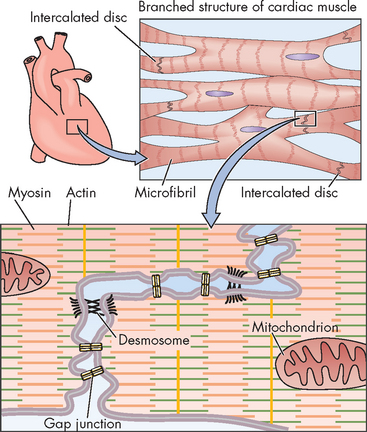
FIGURE 22-17 Electrical coupling of cardiac myocytes.
Source: Boron WF, Boulpaep EL. Medical physiology. 2nd edn. Philadelphia: Saunders; 2009.
Second, unlike skeletal muscle, the heart cannot rest and is in constant need of energy compounds such as adenosine triphosphate (ATP). Therefore, the cytoplasm surrounding the bundles of myofibrils in each cardiac muscle cell contains a superabundance of mitochondria (25% of the cellular volume is mitochondria compared to 2% for skeletal muscle cells). Cardiac muscle cells have more mitochondria than do skeletal muscle cells to provide the necessary respiratory enzymes for aerobic metabolism and to supply quantities of ATP sufficient for the constant action of the myocardium.
Third, cardiac fibres contain more T tubules than do skeletal muscle fibres. Because the T tubule system is continuous with the extracellular space and the interstitial fluid, it facilitates the rapid transmission of electrical impulses from the surface of the sarcolemma to the myofibrils inside the fibre. This activates all the myofibrils of one fibre simultaneously. When an action potential is transmitted through the T tubules, it induces the sarcoplasmic reticulum to release its stored calcium, which is necessary to allow muscle contraction.
Myocardial excitation-contraction coupling
Excitation-contraction coupling is the process by which an action potential in the plasma membrane of the muscle fibre triggers the cycle, leading to cross-bridge activity and contraction. Activation of this cycle depends on the availability of calcium; calcium binds with troponin to allow actin–myosin cross-bridge formation (refer to Chapter 20).
Calcium is stored in the T tubule system and the sarcoplasmic reticulum (located around the myofibrils). After electrical excitation, calcium enters the myocardial cell from the extracellular fluid, due to the opening of calcium channels (L-type, T-type) in cardiac tissues.5,6 The L-type, or long-lasting, channels predominate and are the channels blocked by calcium channel–blocking drugs (verapamil, nifedipine, diltiazem).6 These drugs lessen the strength of cardiac contraction, thereby decreasing the heart’s requirements for oxygen, and treat angina pectoris (refer to Chapter 23). The T-type, or transient, channels are less abundant in the heart and are not blocked by calcium channel-blocking drugs, but novel T-type channel blockers are being explored.7
The action potential of the cardiac myocyte has similarities with that of skeletal muscle, although there are some distinct differences. The important ions for the cardiac muscle action potential are sodium, potassium and calcium. As the action potential spreads across the cell membrane, the sodium channels open briefly, allowing sodium to move into the cell during depolarisation (see Figure 22-18). Rather than this being followed immediately by potassium exiting the cell (as occurs in skeletal muscle cells), for the cardiac myocytes there is an additional intermediate step. When the membrane potential reaches approximately +30 mV, the calcium channels open, allowing intracellular stores of calcium in the sarcoplasmic reticulum, as well as from the extracellular fluid, to enter the cell cytoplasm. This calcium entry causes a unique plateau on the action potential, which occupies a relatively long period of time. Finally, the potassium channels open, allowing potassium to exit the cell and resulting in repolarisation, which returns the membrane potential to rest.
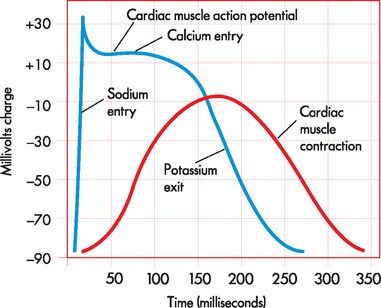
FIGURE 22-18 Comparison between cardiac muscle action potential and cardiac muscle contraction.
Cardiac muscle action potential is prolonged, producing a slow contraction in cardiac muscle.
Source: Based on Patton KT, Thibodeau GA. Anatomy & physiology. 7th edn. St Louis: Mosby; 2010.
A refractory period, during which no new cardiac action potential can be initiated by a stimulus, follows depolarisation. The absolute refractory period corresponds to the time needed for the reopening of channels that permit sodium and calcium influx. A relative refractory period occurs near the end of repolarisation, following the effective refractory period. Importantly, the refractory period in cardiac myocytes is quite long — much longer than for skeletal muscle. This is particularly important in the cardiac myocyte, as it prevents additional contractions from occurring immediately, thereby allowing time for filling.
Finally, because calcium is so important in the cardiac muscle drugs that alter ion movement (e.g. calcium) have profound effects on the action potential and can alter heart rate.
Myocardial relaxation
Adequate relaxation is just as vital to optimal cardiac function as contraction, as relaxation allows for the filling of chambers with blood. After contraction, free calcium ions are actively pumped out of the cell cytoplasm back into the interstitial fluid or are reaccumulated in the sarcoplasmic reticulum and stored. Troponin releases its bound calcium. The tropomyosin complex blocks the active sites on the actin molecule, preventing cross-bridges with the myosin heads. Relaxation of the myocardium then permits filling of the heart chambers.
Myocardial metabolism
Cardiac muscle depends on the constant production of ATP for energy. ATP is produced within the mitochondria mainly from glucose, fatty acids and lactate. If the myocardium is inadequately perfused (has inadequate blood flow), such as during coronary heart disease, anaerobic metabolism becomes an essential source of energy. The energy produced by metabolic processes is used for muscle contraction and relaxation, electrical excitation, membrane transport and synthesis of large molecules. Normally, the amount of ATP produced supplies sufficient energy to pump blood throughout the system.
The oxygen supply to the myocardium is delivered exclusively by the coronary arteries. Approximately 70–75% of the oxygen from the coronary arteries is used immediately by cardiac muscle, leaving little oxygen in reserve. Any increased energy needs can be met only by increasing coronary blood flow. When oxygen content decreases, the local concentration of metabolic factors increases. One of these, adenosine, dilates coronary arterioles, thereby increasing coronary blood flow, providing more oxygen and restoring homeostasis. The oxygen content of the blood cannot be increased under normal atmospheric conditions, nor can the amount of oxygen extracted from the blood be appreciably increased from the resting level. However, myocardial oxygen consumption can increase several-fold with exercise and decrease moderately under conditions such as hypotension and hypothermia. The cardiac muscle cells are susceptible to damage from oxygen deficiency.
The cardiac conduction system
The continuous, rhythmic repetition of the cardiac cycle (systole and diastole) depends on the transmission of electrical impulses, termed cardiac action potentials, through the myocardium. (Action potentials are described in Chapter 6.) Because the muscle fibres of the myocardium are uniquely joined by intercalated discs, action potentials pass from cell to cell rapidly and efficiently. This allows cells to contract synchronously, thereby allowing coordination of cells and coordination of heart function.
The myocardium contains its own conduction system — specialised cells that enable it to generate and transmit action potentials without stimulation from the nervous system. These cells are concentrated at certain sites in the myocardium called nodes.
Normally, electrical impulses arise in the sinoatrial node (SA node), which is often called the pacemaker of the heart. The SA node is located at the junction of the right atrium and superior vena cava, just above the tricuspid valve (see Figure 22-19). The SA node is heavily innervated by both sympathetic and parasympathetic nerve fibres.5 In the resting adult, the SA node generates about 75 action potentials per minute. Each one travels rapidly from cell to cell and through special pathways in the atrial myocardium, causing both atria to contract, thus beginning systole. The SA node is responsible for setting the regular rhythm of the heart — this regular rhythm is referred to as the sinus rhythm.
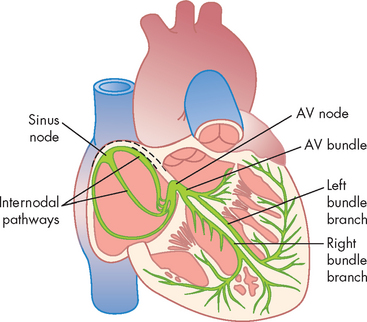
FIGURE 22-19 The cardiac conduction system.
Sinoatrial node, intermodal pathways, atrioventricular node, ventricular bundle branches (bundle of His), and the Purkinje system of the heart. AV = atrioventricular.
Source: Guyton AC, Hall JE. Textbook of medical physiology. 11th edn. Philadelphia: Saunders; 2006.
Ventricular contraction is delayed because the fibrous skeleton of the heart interrupts cell-to-cell transmission of the electrical impulses. In this manner, the atria can contract first, which has the important role of ‘topping up’ the blood volume of the ventricles (prior to their contraction). The action potential is transmitted from the atrial to the ventricular myocardium through fibres of the conduction system, travelling first to the atrioventricular node (AV node), then to the bundle of His (atrioventricular bundle) and finally through the bundle branches of the interventricular septum to Purkinje fibres in the heart wall (see Figure 22-19).
The AV node is well situated for controlling conduction between the atria and ventricles. It is located in the right atrial wall above the tricuspid valve. Behind it are numerous autonomic parasympathetic ganglia. These ganglia serve as receptors for the vagus nerve (of the parasymphathetic nervous system) and cause slowing of impulse conduction through the AV node.
Conducting fibres from the AV node converge to form the bundle of His, which travels a short distance inferiorly before splitting into the right and left bundles. The right bundle branch is thin and travels without much branching to the right ventricular apex. Because of its thinness and relative lack of branches, the right bundle branch is susceptible to interruption by damage to the endocardium.
The left bundle branch arises perpendicularly from the bundle of His and, in some hearts, divides into two branches, or fascicles — a left anterior bundle branch and a left posterior bundle branch. Blood flow through the posterior of the left ventricle is relatively non-turbulent, so the left bundle branch is somewhat protected from injury caused by wear and tear.
The Purkinje fibres are the terminal branches of the right and left bundle branches. They extend from the ventricular apices to the fibrous rings and penetrate the heart wall to the outer myocardium.
From the SA node the impulse that begins contraction spreads throughout the right atrium at a conduction velocity of about 1 metre per second. Intermodal conducting pathways conduct the impulse from the SA node to the left atrium and also from the SA node to the AV node. From the AV node, the impulse travels from the atrioventricular bundle and through the bundle branches to the Purkinje fibres. The first areas of the ventricles to be excited are portions of the interventricular septum. The septum is activated from both the right bundle branch and the left bundle branch. The extensive network of Purkinje fibres promotes the rapid spread of the impulse to the ventricular apices. The basal and posterior portions of the ventricles are the last to be activated.
Action potentials of the cardiac conduction system
Automaticity, or the property of generating spontaneous depolarisation to threshold, enables the SA and AV nodes to generate cardiac action potentials without any stimulus. Cells capable of spontaneous depolarisation are called autorhythmic cells. These cells of the cardiac conduction system can stimulate the heart to beat even when it is removed from the body. The membrane potential of autorhythmic cells does not actually have a stable membrane potential at ‘rest’. Instead, it slowly creeps towards threshold during the diastolic phase of the cardiac cycle. During this time, slow depolarisation occurs due to the opening of slow sodium channels, which allows a gradual influx of sodium ions, causing the membrane potential to approach threshold (see Figure 22-20).
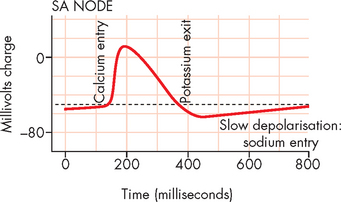
FIGURE 22-20 Cardiac action potentials in the SA node.
Source: Modified from Boron WF, Boulpaep EL. Medical physiology. 2nd edn. Philadelphia: Saunders; 2009.
Once the threshold of −40 mV has been reached, calcium channels open, allowing for rapid calcium influx from the extracellular fluid. This causes the main depolarisation (upwards) spike in the graph in Figure 22-20. This contrasts with the action potentials of other excitable tissues (neurons and muscles), whereby in those cells the depolarisation is due to sodium entry. Finally, the calcium channels close and the potassium channels open, allowing potassium to exit the cell, resulting in repolarisation, which returns the autorhythmic cells to ‘rest’. This is instantly followed by slow depolarisation, which allows the next action potential to commence.
Rhythmicity is the regular generation of an action potential by the heart’s conduction system. The electrical impulse begins in the SA node and it sets the pace because it has the fastest rate of depolarisation (compared with other components of the conduction system). The SA node depolarises spontaneously between 60 and 100 times per minute — average is approximately 75 times per minute, which results in a heart rate of 75 beats per minute. If the SA node is damaged, the AV node will become the heart’s pacemaker at a rate of about 40–60 spontaneous depolarisations per minute. Purkinje fibres are capable of spontaneous depolarisation, but at a rate of only 30–40 beats per minute (see Figure 22-20).5
Cardiac innervation
Although the cardiac cells are autorhythmic, the rate of SA node depolarisation is usually controlled by the sympathetic and parasympathetic fibres of the autonomic nervous system. Thus, the heart will beat in the absence of any nervous connection. Stimulation of the SA node by the sympathetic nervous system rapidly increases heart rate. Furthermore, noradrenaline and adrenaline interact with β1(beta1)-adrenergic receptors on the cardiac cell membranes. The overall effect is an increased influx of calcium, which increases the contractile strength of the heart and increases the speed of electrical impulses through the heart muscle and the nodes (see Figure 22-21).
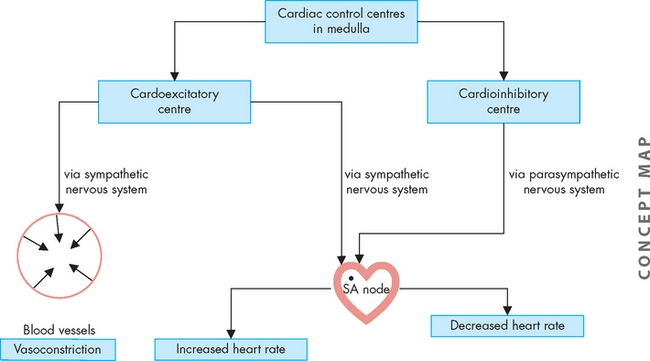
FIGURE 22-21 Autonomic innervation of the cardiovascular system.
The sympathetic nervous system increases both heart rate and vasoconstriction, while the parasympathetic nervous system decreases heart rate.
The parasympathetic nervous system affects the heart through the vagus nerve, which releases acetylcholine. Acetylcholine causes decreased heart rate and slows conduction through the AV node and prolongs intranodal conduction time.5
In addition to the autonomic nervous system, the heart action is also influenced by substances delivered to the myocardium in coronary blood. Nutrients and oxygen are needed for cellular survival and normal function, whereas hormones and other substances affect the strength and duration of myocardial contraction and the degree and duration of myocardial relaxation. Normal or appropriate function depends on the availability of these substances, which is why coronary heart disease can seriously disrupt heart function.
THE ELECTROCARDIOGRAM
The amount of electrical activity of the heart is substantial when you consider the large number of cells that are depolarising and repolarising in unison. In fact, the amount of activity is so great that this current is conducted through body fluids and can be recorded from the body surface — by electrocardiogram (ECG). ECG is performed using a number of electrodes that are placed in specific locations on the body surface; these electrodes reflect different aspects of the heart. The standard position for recording an ECG is to have the patient supine (lying down on their back), although other positions may be used too (such as while the patient exercises during a stress test).
The position of the electrodes for the standard limb leads (leads I, II and III) is shown in Figure 22-22. The recording electrodes are attached to both arms and the left leg, in positions that essentially form a triangle around the body (Einthoven’s triangle). Importantly, only two electrodes are active at any one time. Each electrode pair (one positive, one negative) is referred to as a lead and recordings from each lead give different traces from the ECG trace. In addition to the standard leads, augmented limb leads (aVR, aVL, aVF) provide further traces, which are made by comparisons between the existing limb leads. The use of the chest (precordial) leads requires six more leads being placed at specific locations around the chest (see Figure 22-23):
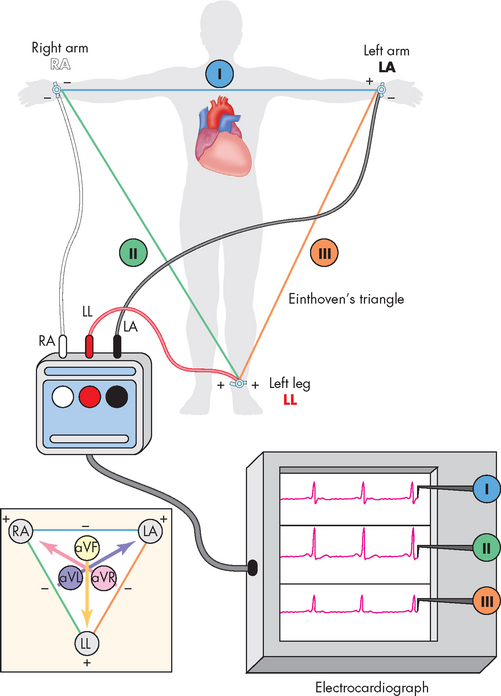
FIGURE 22-22 Electrocardiogram limb leads.
Electrodes are placed on the right arm (RA) or wrist, on the left arm (LA) or wrist and on the left leg (LL) or ankle. Einthoven’s triangle shows the ‘electrical angle’ of each of the three standard limb leads: I, II and III. The inset shows the electrical angle of the augmented limb leads (aVR, aVL, aVF), which combine limb leads to form virtual leads given different angles of electrical voltage measurement.
Source: Thibodeau GA, Patton KT. Anatomy & physiology. 6th edn. St Louis: Mosby; 2007.
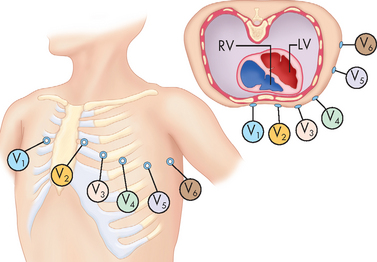
FIGURE 22-23 Electrocardiogram chest leads.
Electrodes are placed at specific locations across the chest. Each of these is compared with a single virtual lead formed by the combination of all three limb electrodes and electrically positioned approximately over the spine.
Source: Thibodeau GA, Patton KT. Anatomy & physiology. 6th edn. St Louis: Mosby; 2007.
By combining the standard limb leads, the augmented limb leads and the chest lead recordings, a comprehensive view of heart function can be obtained using a 12-lead ECG (see Figure 22-24). Although the ECG recording appears different for each of the 12-lead recordings, some underlying principles common to all traces are:
Waves that are travelling at a 90° angle to a particular lead will create no deflection, and this is called an isoelectric signal.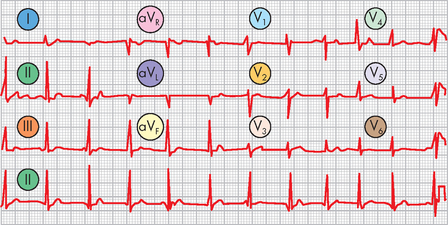
FIGURE 22-24 12-lead electrocardiogram recording.
This brief recording of a typical 12-lead ECG shows information recorded from all six limb leads and all six chest leads. Note that they are all printed above a continuous recording of lead II, which becomes a point of reference. Health professionals can usually get more information from 12 different ECG leads than from any one ECG lead.
Source: Thibodeau GA, Patton KT. Anatomy & physiology. 6th edn. St Louis: Mosby; 2007.
On an ECG recording (see Figure 22-25), the waves or segments and their corresponding cardiac events are:
PR interval: this is a measure of time from the onset of atrial activation to the onset of ventricular activation (normally 0.12–0.20 seconds). It is the time necessary for electrical activity to travel from the SA node through the atria, AV node, bundle of His and Purkinje fibres to activate ventricular myocardial cells. QRS complex: this represents ventricular depolarisation. The QRS complex represents the sum of all ventricular muscle cell depolarisations. The configuration and amplitude of the QRS complex vary considerably between individuals. The duration is normally between 0.06 and 0.10 seconds. Atrial repolarisation is occurring at this time. ST segment: during the ST interval, the entire ventricular myocardium is depolarised, so the ventricles are contracting. QT interval: this is sometimes called the ‘electrical systole’ of the ventricles. It lasts about 0.4 seconds but varies inversely with the heart rate.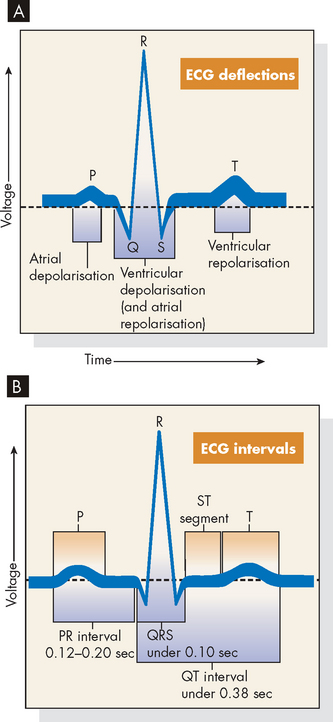
FIGURE 22-25 Electrocardiogram and cardiac electrical activity.
A Normal ECG: depolarisation and repolarisation. B ECG intervals among P, QRS and T waves.
Source: Thibodeau GA, Patton KT. Anatomy & physiology. 6th edn. St Louis: Mosby; 2007.
Electrical depolarisation refers to the spread of action potentials through the cardiac muscle. The action potential initiates events that cause the interaction of actin and myosin, thereby causing muscle contraction. If we consider how this relates to an ECG (see Figure 22-26), the atrial depolarisation of the P wave causes contraction of the atria (Figure 22-26B and C), followed by atrial repolarisation (relaxation; see Figure 22-26D). Next, the QRS complex corresponds to ventricular depolarisation, reflected in the contraction of the ventricles (see Figure 22-26D and E). The ventricles then repolarise (relax; see Figure 22-26F) and the heart cycle is fully relaxed and the cycle is ready to commence again (see Figure 22-26G).
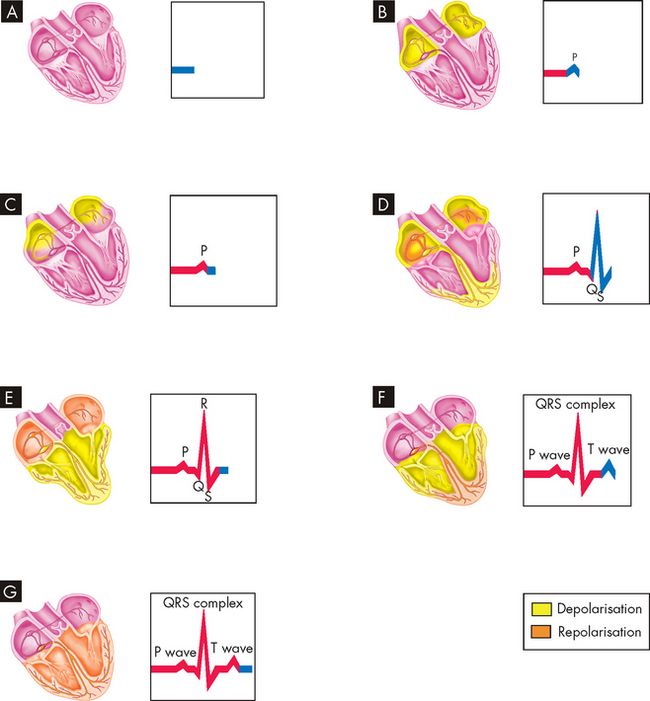
FIGURE 22-26 Events represented by electrocardiogram.
A The heart wall is completely relaxed, with no change in electrical activity, so the ECG remains constant. B The P wave occurs when the AV node and atrial walls depolarise. C The atrial walls are completely depolarised, and thus no change is recorded on the ECG. D The QRS complex occurs as the atria repolarise and the ventricular walls depolarise. E The atrial walls are now completely repolarised, the ventricular walls are now completely depolarised and thus no change is seen on the ECG. F The T wave appears on the ECG when the ventricular walls repolarise. G Once the ventricles are completely repolarised, we are back at the baseline of the ECG.
Source: Patton KT, Thibodeau GA. Anatomy & physiology. 7th edn. St Louis: Mosby; 2010.
FACTORS AFFECTING CARDIAC PERFORMANCE
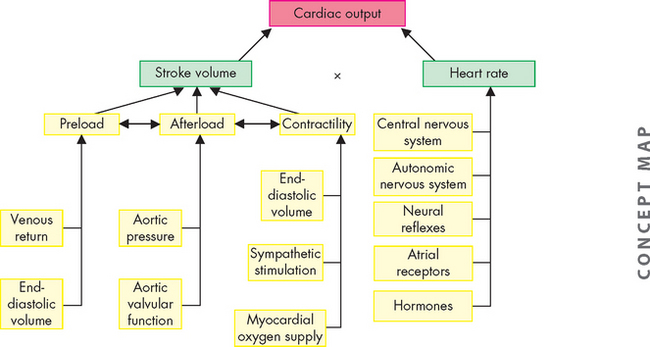
Cardiac performance can be quantified by measuring the cardiac output. Cardiac output is the volume of blood that is pumped out of the heart and flows through the systemic (or pulmonary) circuit over 1 minute; it is expressed in litres per minute. To determine cardiac output, heart rate is multiplied by stroke volume (the volume of blood pumped out of one ventricle with each contraction). Normal cardiac output is approximately 5 litres per minute for a resting adult.
Although the ventricular contraction is powerful, it does not eject all the blood it contains. The maximum amount of blood that fills the ventricle during diastole (relaxation) is defined as the end-diastolic volume, while the volume that remains in the ventricle at the end of systole (contraction) is known as the end-systolic volume. It is the difference between these two values which gives us the stroke volume:
Thus, an average of 70 mL of blood is pumped out of each ventricle during ventricular contraction.
An alternative measure of the amount of blood leaving the ventricle with contraction is the ejection fraction, which indicates the percentage of blood that has filled the ventricle and that is then ejected with ventricular contraction. It is calculated as follows:
The normal ejection fraction of the resting heart is in the range of 55–75%. The ejection fraction is increased by factors that increase contractility (e.g. sympathetic nervous system activity). A decrease in the ejection fraction is a hallmark of ventricular failure and is used clinically to assist with diagnosis of ventricular performance. The ejection fraction can be measured clinically using echocardiography or injection of a dye during cardiac ventriculography (such as during a coronary angiogram; refer to Chapter 23).
The factors that determine cardiac output are (1) preload, (2) afterload, (3) myocardial contractility and (4) heart rate. Preload, afterload and contractility all affect stroke volume.
Preload
Preload is influenced by the factors just prior to ventricular contraction and is determined by the end-diastolic volume (and the associated end-diastolic pressure). The first factor is the amount of venous return to the ventricle, which relates directly to the end-diastolic volume — the amount of blood returning to the heart and filling the ventricle. More filling of blood leads to a greater volume of blood available to leave the heart as stroke volume.
Also, muscle fibres have an optimal resting length from which to generate the maximum amount of contractile strength (the length–tension relationship; refer to Chapter 20). The Frank-Starling law of the heart describes the length–tension relationship between the end-diastolic volume (amount of filling) and the stroke volume. Within a normal range of muscle stretching, increased preload increases cardiac output (see Figure 22-27). However, excessive stretching causes actin and myosin to become completely disengaged and causes the developed tension (force of contraction) to drop to zero. The relationship between stretch and contraction can be compared with the actions of a rubber band. To a certain point, the more the rubber band is stretched, the further it will fly when one end is released. Beyond that amount of stretching, the rubber band will break. Factors that increase contractility cause the heart to operate on a higher length–tension curve. Heart failure is characterised by a lower length–tension curve (see Chapter 23). Figure 22-28 illustrates the relationship between end-diastolic volume and cardiac output.
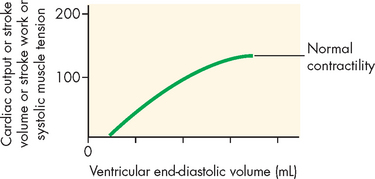
FIGURE 22-27 The Frank-Starling law of the heart.
The relationship between length and tension in the heart. End-diastolic volume determines the end-diastolic length of the ventricular muscle fibres and is proportional to the tension generated during systole, as well as to cardiac output, stroke volume and stroke work.
Afterload
Left ventricular afterload refers to the resistance ‘downstream’ to the ejection of blood from the left ventricle. It is the load the ventricular muscle must move as it contracts. Aortic systolic pressure is a good index of afterload. Pressure in the ventricle must exceed the blood pressure within the aorta before blood can be pumped out during systole. Low aortic pressures (decreased afterload) enable the heart to contract more rapidly, whereas high aortic pressures (increased afterload) slow contraction and cause higher workloads against which the heart must function so that it can eject less blood. This is common in those with increased blood pressure (hypertension), as there is increased pressure in the aorta (refer to Chapter 23). In some individuals, changes in afterload are the result of aortic valvular disease.
Myocardial contractility
Stroke volume (the volume of blood ejected per beat) depends on the force of contraction, which is determined by myocardial contractility, or the degree of myocardial fibre shortening. Three major factors determine the force of contraction: (1) changes in the stretching of the ventricular myocardium caused by changes in ventricular filling volume (preload); (2) alterations in the sympathetic activation of the ventricles; and (3) adequacy of myocardial oxygen supply. As discussed previously, increased blood flow from the veins into the heart distends (stretches) the ventricle by increasing preload, which increases the stroke volume and, subsequently, cardiac output.
Chemicals affecting contractility are called inotropes. The most important positive inotropes, those that increase contractility, are adrenaline and noradrenaline released from the sympathetic nervous system and adrenal glands. Other positive inotropes include thyroid hormone and dopamine. The most important of the negative inotropes, those that decrease contractility, is acetylcholine released from the parasympathetic nervous system (via the vagus nerve). Many drugs have positive or negative inotropic properties that can have profound effects on cardiac function.
Myocardial contractility is also affected by oxygen and carbon dioxide levels in the coronary blood. With severe hypoxaemia (arterial oxygen saturation less than 50% compared with a normal value of approximately 98%), contractility is decreased. On the other hand, with less severe hypoxaemia (oxygen saturation more than 50%), contractility is stimulated, as there may be an increased myocardial response to circulating catecholamines.2 Preload, afterload and contractility all interact with one another to determine stroke volume and cardiac output.
Heart rate
The average heart rate in adults is about 75 beats per minute, which diminishes by 10–20 beats/minute during sleep. Substantial slowing of the heart rate to below 60 beats per minute is referred to as bradycardia. The heart rate can accelerate to a state of tachycardia of more than 100 beats/minute during muscular activity, emotional excitement or pathophysiological conditions. In highly trained athletes, the resting heart rate can be below 50 beats/minute, as training produces hypertrophy of the cardiac muscle, leading to a lower resting heart rate and greater stroke volume than before training. In addition, training lowers peripheral resistance in blood vessels by vasodilation in active muscles, which lowers afterload. In effect, each contraction is more powerful than prior to athletic training, so fewer contractions are required. The control of heart rate includes activity of the central nervous system, such as excitement, autonomic nervous system (fight–flight stimulation), neural reflexes, atrial receptors and hormones (see Figure 22-28).
Pulse
With each ventricular contraction, the burst of pressure entering the arterial system corresponds to a wave of pressure that spreads throughout the major arteries. Hence the pulse is a reflection of the heart rate. The pulse can be palpated at various sites throughout the body, where the artery is located near to the body surface with a bone or other firm tissue behind it. Sites where the pulse points are most easily felt are shown in Figure 22-29.
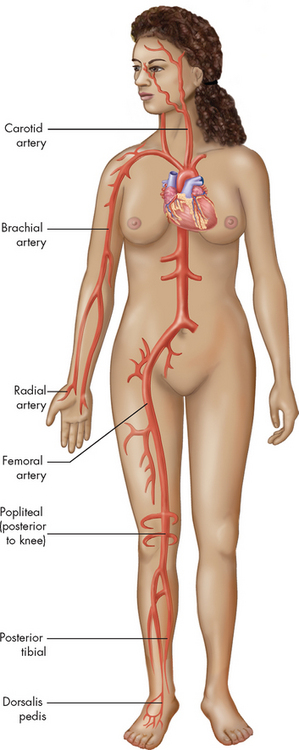
Each pulse point is named after the artery with which it is associated.
Source: Patton KT, Thibodeau GA. Anatomy & physiology. 7th edn. St Louis: Mosby; 2010.
THE PHYSIOLOGY OF CARDIOVASCULAR CONTROL
Cardiovascular control centres in the brain
The cardiovascular control centres are in the medulla oblongata of the brainstem, along with other vital centres such as the respiratory control centre. The neurons from the cardiovascular control centres communicate with the heart via the autonomic nervous system. Because parasympathetic activation generally depresses cardiac function (slows down the SA node rate of depolarisation and decreases the heart rate), this area of the medulla oblongata is referred to as the cardioinhibitory centre. The resting heart rate in healthy individuals is primarily under the control of parasympathetic stimulation, which slows down the rate of the SA node from its inherent (or inbuilt) rate of depolarisation of 100 times per minute to the actual average resting rate of 75 per minute. Excitation or increased heart activity occurs with sympathetic stimulation, which arises from the cardioexcitatory centre in the medulla oblongata. Sympathetic activation increases the rate of depolarisation of the SA node, causing an increase in heart rate. Parasympathetic effects from the vagus nerves override sympathetic effects in the SA node.
Secondary brain regions involved in control of cardiovascular function are located in the hypothalamus, cerebral cortex and thalamus, as well as complex networks of exciting or inhibiting interneurons (connecting neurons) throughout the brain. The hypothalamic centres regulate cardiovascular responses to changes in temperature; the cerebral cortex centres adjust cardiac reaction to a variety of emotional states; and the medullary control centre regulates heart rate and blood pressure (see Figure 22-30).
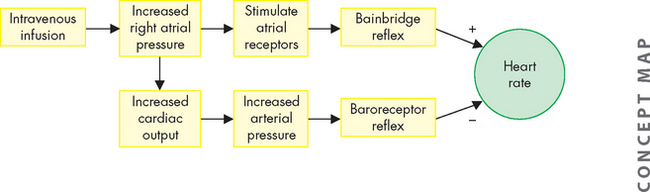
FIGURE 22-30 The heart rate and intravenous infusions.
Intravenous infusions of blood or electrolyte solutions tend to increase the heart rate through the Bainbridge reflex and to decrease the heart rate through the baroreceptor reflex. The actual change in heart rate induced by such infusions is the result of these two opposing effects.
Source: Berne RM, Levy MN. Cardiovascular physiology. 8th edn. St Louis: Mosby; 2001.
Neural reflexes
The Bainbridge reflex causes the heart rate to increase with increased venous return or after intravenous infusion of fluid (see Figure 22-30), whereby increased pressure in the right atrium stimulates atrial stretch receptors, leading to a rise in the heart rate. The magnitude of the change in the heart rate depends on the initial heart rate.
The baroreceptor reflex facilitates blood pressure changes and heart rate changes. It is mediated by receptors known as baroreceptors, which are stimulated by the amount of stretch in the blood vessel wall due to blood pressure; these are located in the walls of the aortic arch and carotid arteries. These baroreceptors increase their rate of firing (discharge), sending neural impulses over the glossopharyngeal nerve (ninth cranial nerve) and through the vagus nerve (tenth cranial nerve) to the cardiovascular control centres in the medulla oblongata. In response to a rise in blood pressure, these centres increase parasympathetic activity and decrease sympathetic activity, causing blood vessels to dilate and the heart rate to decrease. Responses to the baroreceptor reflex return the blood pressure to its previous level, which may or may not be normal. The higher the blood pressure, the greater the reflexive decrease in the heart rate. If blood pressure is decreased, the baroreceptor reflex accelerates the heart rate and causes vessels to constrict, raising blood pressure back towards normal (see Figure 22-30).8 Baroreceptor function is discussed in more detail later under ‘Regulation of blood pressure’.
Neural receptors in the lungs cause the heart rate to increase during inspiration and decrease during expiration. This is a normal effect of the cardiac cycle and is referred to as sinus arrhythmia. The vagal fibres are stretched in inspiration and inhibit the cardioinhibitory centre of the medulla. This allows unopposed sympathetic acceleration of the heart rate. It is likely that changes in the pressures of the abdominal and thoracic cavities during respiration contribute to sinus arrhythmia. During inspiration, the diaphragm pushes down into the abdominal cavity, thereby increasing the pressure within the cavity. This assists venous return to the heart from the abdominal veins, which results in an increase in the heart rate.
Atrial receptors
Receptors that influence heart rate exist in both atria.2,5 They are located in the right atrium at its junctions with the venae cavae and in the left atrium at its junctions with the pulmonary veins. Stimulation of these atrial receptors also increases urine volume, presumably because of a neurally mediated reduction in antidiuretic hormone (ADH). In addition, atrial natriuretic peptide (ANP) is released from atrial tissue in response to the increases in blood volume. ANP has powerful diuretic and natriuretic (sodium excretion) properties, which act on the kidneys and result in decreased blood volume and pressure.5,9
Hormones and biochemicals
Hormones and biochemicals affect the arteries, arterioles, venules and capillaries and the contractility of the myocardium. Noradrenaline increases the heart rate, enhances myocardial contractility and constricts blood vessels. Adrenaline dilates vessels of the liver and skeletal muscle and also causes an increase in myocardial contractility. Some adrenocortical hormones, such as cortisol, potentiate the effects of these catecholamines. Thyroid hormones enhance sympathetic activity, promoting increased cardiac output. A decrease in growth hormone, as well as in thyroid and adrenal hormones, results in bradycardia, reduced cardiac output and low blood pressure. Therefore, overall there are many influences on cardiovascular function.
THE SYSTEMIC CIRCULATION
The arteries and veins of the systemic circulation are illustrated in Figure 22-31. Blood from the left side of the heart flows through the aorta and into the systemic arteries. The arteries branch into small arterioles, which branch further into the smallest vessels, the capillaries, where nutrient exchange occurs between the blood and tissues. Blood from the capillaries then enters tiny venules that join to form the larger veins, which return venous blood to the right heart. The peripheral vascular system is an imprecise term used to describe the part of the systemic circulation that supplies the skin and the extremities, particularly the legs and feet.
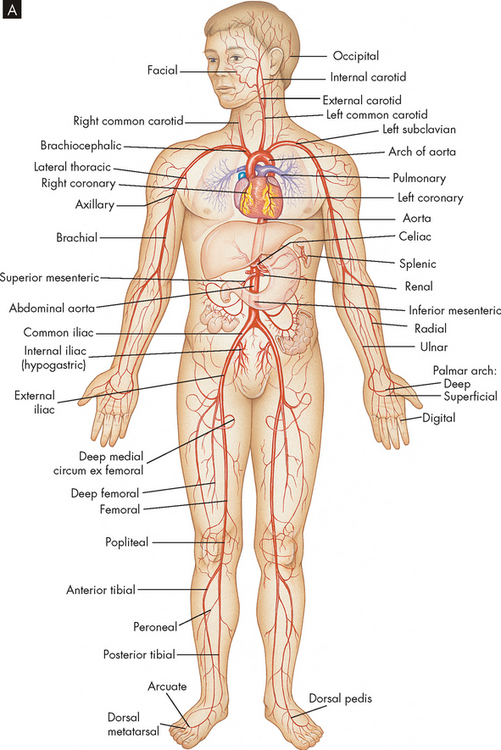
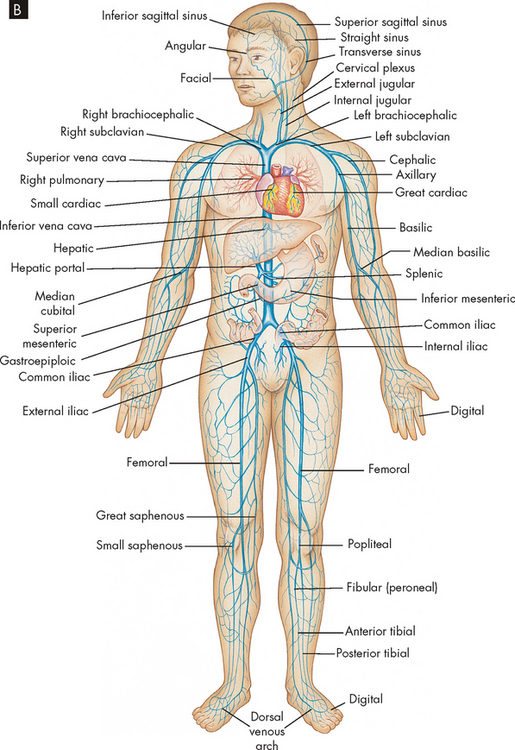
FIGURE 22-31 The circulatory system.
A Principal arteries of the body.
B Principal veins of the body.
Source: Thibodeau GA, Patton KT. Anatomy & physiology. 6th edn. St Louis: Mosby; 2007.
Most organs receive an arterial supply of oxygenated blood with venous drainage of deoxygenated blood. However, some organs have a more unusual blood vessel system:
Blood vessels
Blood vessel walls are composed of three layers:
These structures are illustrated in Figure 22-32. Blood vessel walls vary in thickness depending on the thickness or absence of one or more of these three layers. Cells of the larger vessels are nourished by the vasa vasorum, small vessels located in the tunica externa.
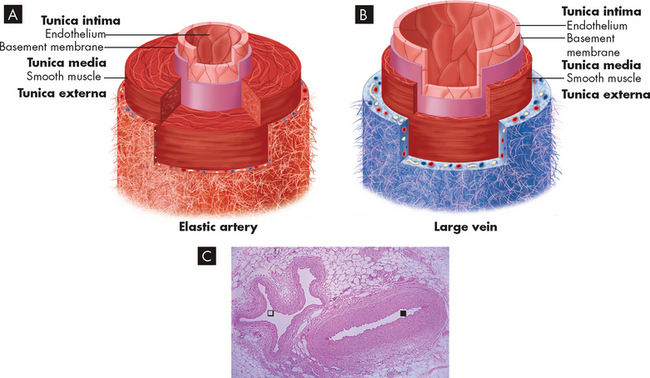
FIGURE 22-32 Schematic drawing and micrograph of an artery and a vein.
Blood vessel walls of A artery and B vein, showing the layers of the vessels and the comparative thicknesses of tissue layers. C Seen here in cross-section is a normal artery () with a thick, smooth muscle wall alongside a normal vein () with a thin, smooth muscle wall, running in connective tissue in a fascial plane between muscle bundles of the lower leg.
Source: A & B Patton KT, Thibodeau GA. Anatomy & physiology. 7th edn. St Louis: Mosby; 2010. C Klatt EC. Robbins & Cotran atlas of pathology. 2nd edn. Philadelphia: Saunders; 2010.
Arteries
Arterial walls are composed of elastic connective tissue, fibrous connective tissue and smooth muscle. Elastic arteries have a thick tunica media with more elastic fibres than smooth muscle fibres. They are located nearest to the heart and include the aorta, its major branches and the pulmonary trunk. Elasticity allows the vessels to stretch as blood is ejected from the heart during systole. During diastole, elasticity promotes recoil of the arteries, maintaining blood pressure within the vessels.
Muscular arteries are medium-sized and small arteries and are further from the heart than the elastic arteries. By the time blood reaches the muscular arteries, the major fluctuations in blood pressure have decreased substantially. Muscular arteries have more muscle fibres than the elastic arteries because they require less stretch and recoil. Muscular arteries distribute blood to arterioles throughout the body and help control blood flow because their smooth muscle can be stimulated to contract or relax. Contraction narrows the vessel lumen — vasoconstriction — which diminishes flow through the vessel. Conversely, when the smooth muscle layer relaxes — vasodilation — more blood flows through the vessel lumen.
An artery becomes an arteriole where the diameter of its lumen narrows to less than 0.5 mm. The arterioles are composed almost exclusively of smooth muscle and regulate the flow of blood into the capillaries in two ways: (1) arteriole vasoconstriction, which limits the flow of blood into the capillaries; and (2) arteriole vasodilation, which permits blood to enter the capillaries freely. The thick smooth muscle layer of the arterioles is a major determinant of the resistance blood encounters as it flows through the systemic circulation.
Capillaries
The capillaries are the smallest blood vessels; they are the sites of actual exchange of substances between the blood and the cells (see Figure 22-33). The capillary network is composed of connective channels, or thoroughfares, called metarterioles and ‘true’ capillaries (see Figure 22-34). The capillaries branch from the metarterioles, meeting at a ring of smooth muscle called the precapillary sphincter. As the sphincters contract and relax, they regulate blood flow through the capillaries. Appropriately stimulated, the precapillary sphincters help maintain arterial pressure and regulate selective flow to vascular beds.
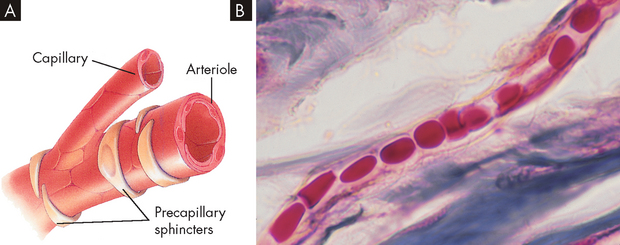
A Capillaries have a wall composed of only a single layer of flattened cells, whereas the walls of the larger vessels also have smooth muscle. B Capillary with red blood cells in single file (× 500).
Source: A Thibodeau GA, Patton KT. Anatomy & physiology. 6th edn. St Louis: Mosby; 2007. B Copyright Ed Reschke.
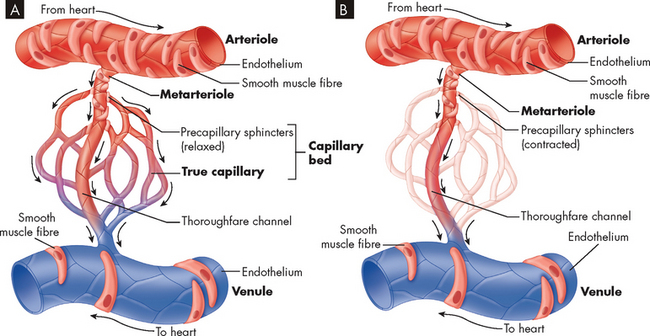
FIGURE 22-34 Microcirculation.
Control of blood flow through a capillary network is regulated by the relative contraction of precapillary sphincters surrounding arterioles and metarterioles. A Sphincters are relaxed, permitting blood flow to enter the capillary bed. B With sphincters contracted blood flows from the metarteriole directly into the thoroughfare channel, bypassing the capillary bed.
Source: Patton KT, Thibodeau GA. Anatomy & physiology. 7th edn. St Louis: Mosby; 2010.
The capillary walls are very thin, making possible the rapid exchange of substances including nutrients and hormones between the blood and the interstitial fluid, from which they are taken up by the cells. A single endothelial cell may form the entire vessel wall if the capillary has no tunica media or tunica externa. In continuous capillaries, very few spaces are available for substances to cross the vessel wall (such as in the brain; see Figure 22-35A). In fenestrated capillaries, the endothelial cells contain pores termed fenestrations (see Figure 22-35B), whereas sinusoids have large openings that facilitate exit of substances from the capillary (see Figure 22-35C).
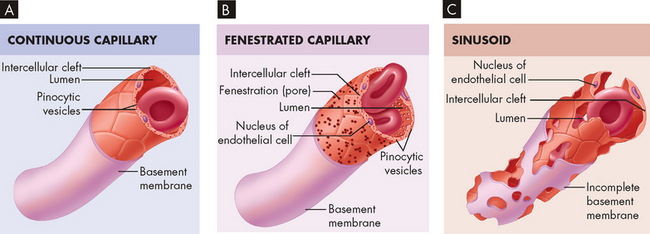
FIGURE 22-35 Types of capillaries.
A Note the presence of clefts only between adjacent endothelial cells. B In addition to intercellular clefts, fenestrations (pores) exist in the plasma membranes of endothelial cells. C In addition to large intercellular clefts and cellular fenestrations, the basement membrane is incomplete or absent.
Source: Patton KT, Thibodeau GA. Anatomy & physiology. 7th edn. St Louis: Mosby; 2010.
Substances pass between the capillary lumen and the interstitial fluid (1) through junctions between endothelial cells, (2) through fenestrations in endothelial cells, (3) in vesicles moved by active transport across the endothelial cell membrane or (4) by diffusion through the endothelial cell membrane. A single capillary may be only 0.5 to 1 mm in length and 0.01 mm in diameter — this is just large enough for red blood cells to flow through in single file, remembering that the diameter of an erythrocyte is approximately 8 micrometres, or 0.008 mm (refer to Chapter 16 and Figure 22.33B). The capillaries are so numerous that their total surface area may be more than 600 m2 — larger than 100 football fields.
Endothelium
All tissues depend on a blood supply and the blood supply depends on endothelial cells, which form the lining of the blood vessel. This blood vessel lining is referred to as the endothelium. Endothelial cells are really quite remarkable in that they can adjust their number and arrangement to accommodate local requirements. Thus, they are a life-support tissue extending and remodelling the network of blood vessels to enable tissue growth, motion and repair. The endothelium provides a smooth, continuous lining throughout the vascular system and an intact endothelium facilitates good blood flow. An intact endothelium also prevents unnecessary blood clotting and platelet activation (refer to Chapter 16).
Veins
Approximately two-thirds of the total blood volume is in the veins of the systemic circulation, hence veins are also referred to as capacitance vessels. Despite the large volume of blood, veins are low-pressure vessels. The smallest venules closest to the capillaries have an inner lining, composed of the endothelium of the tunica intima and surrounded by fibrous tissue. The largest venules are surrounded by smooth muscle fibres constituting a thin tunica media.
Compared with arteries, veins are thin-walled and fibrous and have a larger diameter (see Figure 22-31). Veins are also more numerous than arteries. In veins, the tunica externa has less elastic tissue than in arteries, so veins do not recoil after distention as quickly as do arteries. Like arteries, veins receive nourishment from the tiny vasa vasorum. Some veins, most commonly in the lower limbs, contain valves to regulate the one-way flow of blood towards the heart (see Figure 22-36). These valves are folds of the tunica intima and resemble the semilunar valves of the heart. When a person stands up, contraction of the skeletal muscles of the legs compresses the deep veins of the legs and assists the flow of blood towards the heart. This important mechanism of venous return is called the skeletal muscle pump (see Figure 22-37).
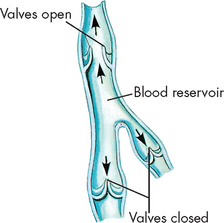
Pooled blood is moved towards the heart as valves are forced open by pressure from the volume of blood downstream.
Source: Thibodeau GA, Patton KT. Anatomy & physiology. 5th edn. St Louis: Mosby; 2003.
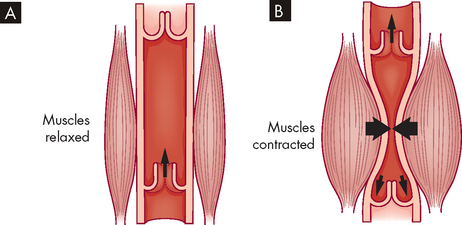
FIGURE 22-37 The skeletal muscle pump.
A When the skeletal muscle is relaxed, the blood flow through the vein is largely unaffected. B During contraction of the skeletal muscle, the compression of the vein forces the blood to be returned towards the heart. Note: the closure of the venous valves prevents backflow of blood.
BLOOD PRESSURE AND BLOOD FLOW
Normal pressures within cardiac chambers and the vessels of the systemic and pulmonary circulations are shown in Table 22-1. In both the systemic and the pulmonary circulations, blood pressures decline as the blood travels from the ventricle through the circulation and returns to the heart (see Figure 22-38).
Table 22-1 THE RANGE OF PRESSURES OF THE SYSTEMIC AND PULMONARY CIRCULATIONS
| LOCATION | RANGE (mmHg) |
|---|---|
| Left side of heart | |
| Left atrium | 4–12 |
| Left ventricle: systolic | 90–140 |
| Left ventricle: end-diastolic | 4–12 |
| Systemic circulation | |
| Aorta, large arteries | 120–80 |
| Arterioles | 60 |
| Capillaries | 15–35 |
| Venules | 15 |
| Veins, venae cavae | 3–15 |
| Right side of heart | |
| Right atrium | 0–8 |
| Right ventricle: systolic | 15–28 |
| Right ventricle: end-diastolic | 0–8 |
| Pulmonary circulation | |
| Pulmonary artery | 15 |
| Capillaries | 10 |
| Pulmonary veins | 5 |
Source: Modified from Boron W, Boulpaep E. Medical physiology. Philadelphia: Saunders; 2003.
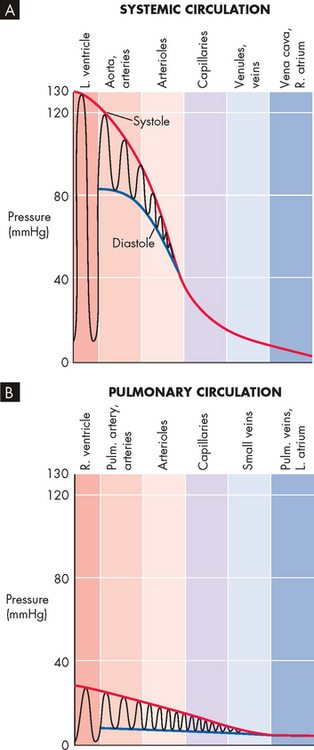
FIGURE 22-38 Pressure profiles along the systemic and pulmonary circulations.
The oscillations represent variations in time, not distance. Pulm = pulmonary; L = left; R = right.
Source: Boron WF, Boulpaep EL. Medical physiology. 2nd edn. Philadelphia: Saunders; 2009.
Factors affecting blood flow
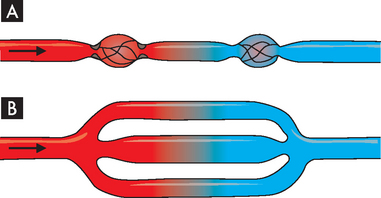
Blood flow is the amount of fluid moved per unit of time and is usually expressed as litres or millilitres per minute (mL/min). Flow is regulated by the same physical properties that govern the movement of simple fluids in a closed, rigid system — that is, pressure, resistance, velocity, turbulent versus laminar flow and compliance.
Pressure and resistance
Pressure in a liquid system is the force exerted on the liquid per unit area and is expressed as millimetres of mercury (mmHg) when referring to the body. Blood flow throughout the entire vascular system depends partly on the difference between pressures in the arterial and venous vessels supplying the organ. Fluid moves from the arterial end of the capillaries, a region of greater pressure, to the venous end, a region of lesser pressure.
Resistance is the opposite to force. In the cardiovascular system, most opposition to blood flow is provided by the diameter and length of the blood vessels themselves. Therefore, changes in blood flow through an organ result from changes in the vascular resistance within the organ. Resistance in a vessel is inversely related to blood flow — that is, increased resistance leads to decreased blood flow.
Poiseuille’s law shows the relationship among blood flow, pressure and resistance:
Resistance to flow cannot be measured directly, but it can be calculated if the pressure difference and flow volumes are known. Resistance to blood flow is proportional to the viscosity of the blood and the length of the vessel (as well as a constant 8/π) and it is inversely proportional to the fourth power of the lumen’s radius (radius4).
Blood vessel radius
The most important factor determining resistance within a blood vessel is the radius or diameter of the vessel lumen, expressed in Poiseuille’s formula as its radius (see Figure 22-39). Small changes in the lumen radius lead to quite substantial changes in vascular resistance. The calculations from Figure 22-39 demonstrate that by halving the blood vessel radius from 4 to 2, the resulting increase in resistance decreases the flow rate tremendously, from 256 mL/min to a mere 16 mL/min. This clearly shows that vessel radius is a powerful influence on resistance and blood flow rate. It is important to learn that changes in radius are used to facilitate immediate changes in blood flow, as this is undertaken regularly throughout the day in different parts of the body.
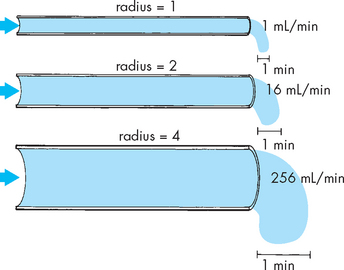
FIGURE 22-39 Lumen diameter, blood flow and resistance.
The effect of lumen radius on blood flow rate through a vessel. Note that the flow rate changes substantially with small changes in radius. The calculations were performed using the formula, blood flow rate = radius4 (i.e. radius × radius × radius × radius).
Source: Thibodeau GA, Patton KT. Anatomy & physiology. 5th edn. St Louis: Mosby; 2003.
Blood vessel length
Another important factor is the length of the vessel. Generally, resistance to flow is greater in longer tubes because resistance increases with length. Clearly, blood vessel length does not change in the short term and therefore this is not used to alter blood flow rate in the short term.
Viscosity
Blood flow rate decreases with increasing viscosity of the fluid, which provides greater resistance to flow than thin fluids. Blood that contains a high percentage of red cells is more viscous. This relationship is expressed as the haematocrit — the ratio of the volume of red blood cells to the volume of whole blood. A high haematocrit reduces flow through the blood vessels, particularly the microcirculation (arterioles, capillaries, venules). Conditions in which the haematocrit is elevated — for example, dehydration, cyanotic congenital heart disease or polycythaemia — can lead to increased cardiac work as a result of increased vascular resistance.
Total resistance
Resistance to flow through a system of vessels, or total resistance, depends not only on characteristics of individual vessels but also on whether the vessels are arranged in series or in parallel (see Figure 22-40). Resistance is lessened where the blood flow can travel through a parallel arrangement. This represents the blood flow through a capillary bed, where capillaries are in parallel.
Neural control of total peripheral resistance
Total resistance in the systemic circulation, sometimes called total peripheral resistance, is determined primarily by change in the radius of the arterioles. As described in the previous section, radius has the main influence on blood flow. Reflex control of total cardiac output and peripheral resistance includes (1) sympathetic stimulation of heart, arterioles and veins; and (2) parasympathetic stimulation of the heart.
The autonomic nervous system is monitored by the cardiovascular control centre in the brain (see Figure 22-41). The hypothalamic centres regulate vascular (and cardiac) responses to changes in temperature. When the body’s core temperature exceeds normal, the hypothalamus initiates reflex dilation of arterioles and veins in the skin. Skin blood flow increases and heat is lost in the form of sweat and convective heat loss. When body core temperature decreases below normal, surface vessels constrict, shunting blood to the vital organs. Vasoconstriction is regulated by an area of the brainstem that maintains a constant (tonic) output of noradrenaline from sympathetic fibres in the peripheral arterioles. This tonic activity is essential for maintenance of blood pressure.
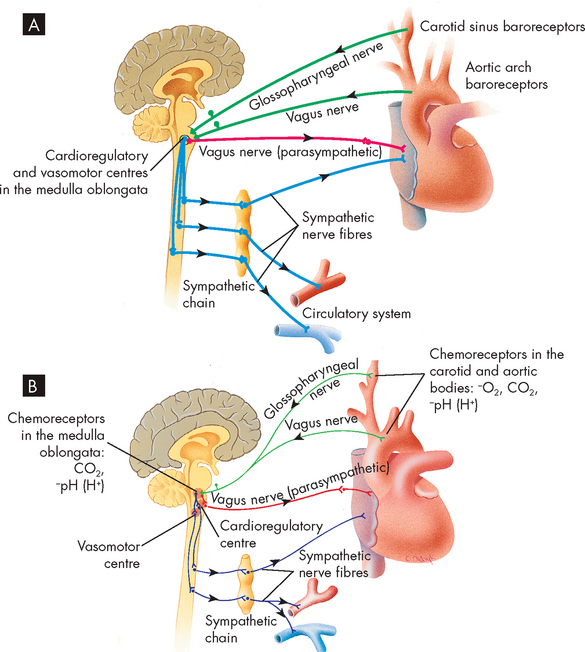
FIGURE 22-41 Baroreceptor and chemoreceptor reflex control of blood pressure.
A Baroreceptors located in the carotid sinuses and aortic arch detect changes in blood pressure. Action potentials are conducted to the cardioregulatory and vasomotor centres. The heart rate can be decreased by the parasympathetic system; the heart rate and stroke volume can be increased by the sympathetic system. The sympathetic system can also constrict or dilate blood vessels. B Chemoreceptors located in the medulla oblongata and in the carotid and aortic bodies detect changes in blood oxygen, carbon dioxide or pH. Action potentials are conducted to the medulla oblongata. In response, the vasomotor centre can cause vasoconstriction or dilation of blood vessels by the sympathetic system, and the cardioregulatory centre can cause changes in the pumping activity of the heart through the parasympathetic and sympathetic systems.
Source: Seeley RR, Stephens TD, Tate P. Anatomy and physiology. 3rd edn. St Louis: Mosby; 1995.
Laminar versus turbulent flow
Normally, blood flow through the vessels is laminar (laminar flow), meaning that concentric layers of molecules move ‘straight ahead’. Each concentric layer flows at a different velocity (see Figure 22-42). The cohesive attraction between the fluid and the vessel wall prevents the molecules of blood that are in contact with the wall from moving. The next thin layer of blood is able to slide slowly past the stationary layer and so on until, at the centre, the blood velocity is greatest. Large vessels have room for a large centre layer; therefore, they have less resistance to flow and greater flow and velocity than smaller vessels.
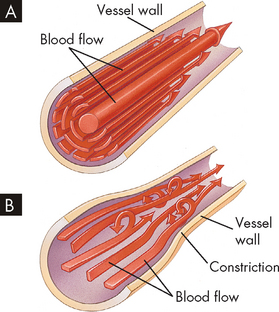
FIGURE 22-42 Laminar and turbulent blood flow.
A Laminar flow. Fluid flows in long, smooth-walled tubes as if it is composed of a large number of concentric layers. B Turbulent flow. Turbulent flow is caused by numerous small currents flowing crosswise or oblique to the long axis of the vessel, resulting in flowing whorls and eddy currents.
Source: Seeley RR, Stephens TD, Tate P. Anatomy and physiology. 3rd edn. St Louis: Mosby; 1995.
Where flow is obstructed, the vessel turns or blood flows over rough surfaces, the flow becomes turbulent (turbulent flow), with whorls or eddy currents that produce noise, causing a murmur to be heard on auscultation. Resistance increases with turbulence (see Figure 22-42).
Vascular compliance
Vascular compliance is the increase in volume a vessel can accommodate for a given increase in pressure. Compliance depends on the ratio of elastic fibres to muscle fibres in the vessel wall. The elastic arteries are more compliant than the muscular arteries and the veins are more compliant than either type of artery and can serve as storage areas for the circulatory system.
Compliance determines a vessel’s response to pressure changes. For example, with a small increase in pressure, a large volume of blood can be accommodated by the venous system. In the less-compliant arterial system, where smaller volumes and higher pressures are normal, small variations in pressure cause little or no change in the volume of blood within the arterial vessels.
Regulation of blood pressure
Arterial pressure
Arterial pressure is constantly regulated to maintain tissue perfusion or blood supply to the capillary beds, during a wide range of physiological conditions, including changes in body position, muscular activity and circulating blood volume. The mean arterial pressure (MAP), which is the average pressure in the arteries throughout the cardiac cycle, depends on the elastic properties of the arterial walls and the mean volume of blood in the arterial system. Mean arterial pressure can be approximated from the measured values of the systolic and diastolic pressures, as follows:
An alternative method of assessing arterial blood pressure is by calculating the pulse pressure. This is the difference between systolic and diastolic blood pressures, and using normal values is as follows:
The mean arterial pressure can now be rewritten as:
The pulse pressure is used in some clinical situations, as it can be useful in predicting adverse events with coronary heart disease.10 The major factors and relationships that regulate arterial blood pressure are summarised in Figure 22-43. Table 22-2 summarises factors that affect both mean arterial pressure and capillary flow.
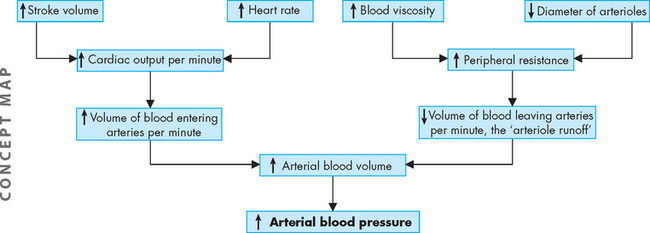
FIGURE 22-43 The relationship between arterial blood volume and blood pressure.
Source: Patton KT, Thibodeau GA. Anatomy & physiology. 7th edn. St Louis: Mosby; 2010.
Table 22-2 FACTORS THAT AFFECT MEAN ARTERIAL PRESSURE AND CAPILLARY FLOW
| MEAN ARTERIAL PRESSURE | CAPILLARY FLOW | |
|---|---|---|
| PERIPHERAL RESISTANCE* | ||
| HEART RATE† | ||
| STROKE VOLUME‡ |
† peripheral resistance and stroke volume constant
‡ peripheral resistance and heart rate constant.
Source: Little RC. Physiology of the heart and circulation. 3rd edn. St Louis: Mosby; 1985.
Baroreceptors
Major stretch receptors (baroreceptors) are located in the aorta and in the carotid sinus (see Figure 22-44, also Figure 22-41). They respond to changes in smooth muscle fibre length by altering their rate of discharge and supply sensory information to the cardiovascular centre that regulates blood pressure. The net effect of this major blood pressure–regulating reflex is to reduce blood pressure to normal by decreasing cardiac output (heart rate and stroke volume) and peripheral resistance.
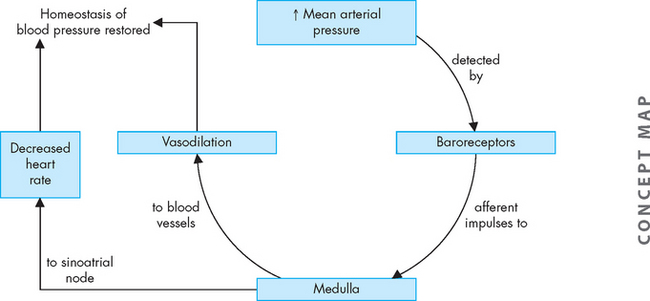
Arterial chemoreceptors
Specialised areas within the aortic and carotid arteries are sensitive to concentrations of oxygen, carbon dioxide and hydrogen ions (pH) in the blood. These chemoreceptors are most important for the control of respiration but also transmit impulses to the medullary cardiovascular centres that regulate blood pressure. If arterial oxygen concentration or pH falls, a reflexive increase in blood pressure occurs, whereas an increase in carbon dioxide causes a slight increase in blood pressure. The major chemoreceptive reflex is the result of alterations in arterial oxygen concentration, with only minor effects resulting from altered pH or carbon dioxide levels.
Hormones
Blood pressure can be influenced by factors that change the total volume of blood in the circulatory system. Antidiuretic hormone (ADH) is released by the posterior pituitary and causes reabsorption of water by the kidney (refer to Chapter 10). With reabsorption, the blood plasma volume increases, thereby increasing blood pressure (see Figure 22-45).
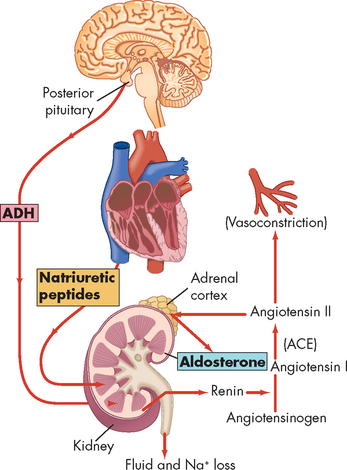
FIGURE 22-45 Three mechanisms that influence total plasma volume.
The antidiuretic hormone (ADH) mechanism and renin-angiotensin and aldosterone mechanisms tend to increase water retention and thus increase total plasma volume. The natriuretic peptides antagonise these mechanisms by promoting water loss and sodium (Na+) loss, thus promoting a decrease in total plasma volume. ACE = angiotensin-converting enzyme.
Source: Patton KT, Thibodeau GA. Anatomy & physiology. 7th edn. St Louis: Mosby; 2010.
Renin is an enzyme synthesised and secreted by the juxtaglomerular cells of the kidneys. Factors that increase renin release include the following:
Once in the circulation, renin splits off a polypeptide from angiotensinogen to generate angiotensin I. This is converted by an enzyme, angiotensin-converting enzyme (ACE), to angiotensin II, a powerful vasoconstrictor that stimulates the secretion of aldosterone from the adrenal gland (see Figure 22-45 and the box ‘Health alert: aldosterone and injury’). Full details of this important renin-angiotensin-aldosterone system are discussed in Chapter 28 (see also Figure 28-14).
Aldosterone and injury
Aldosterone has a number of deleterious effects, including myocardial necrosis and fibrosis, vascular stiffening and injury, reduced fibrinolysis, endothelial dysfunction, catecholamine release and promotion of dysrhythmias. These effects are caused by aldosterone itself and are independent of aldosterone’s stimulation of renal sodium and water retention.
Source: Schiffrin EL. Effects of aldosterone on the vasculature. Hypertens 2006; 47(3):312–318.
This kidney-based renin-angiotensin system serves as an important regulatory loop. For example, decreases in blood pressure or sodium delivery to the kidneys (specifically, the macula densa), as might occur after haemorrhage or extracellular fluid volume deficits (dehydration), stimulate secretion of renin, which leads to formation of angiotensin II to restore blood pressure. Angiotensin II stimulates aldosterone release, resulting in sodium and water retention by the kidneys. Overall, the renin-angiotensin system is activated after volume depletion or hypotension, or both, and is suppressed after volume repletion (see the box ‘Health alert: angiotensin II’).
Angiotensin II
The systemic effects exerted by angiotensin II include vasoconstriction, increased blood pressure, glomerular hypertension, activation of the sympathetic nervous system and retention of sodium and fluids. Angiotensin II also has local effects on both cardiac and vascular tissue and can cause hypertrophy and scarring of tissues, a process that is called ‘remodelling’.
Source: Daugherty A, Cassis L. Angiotensin II-mediated development of vascular diseases. Trends Cardiovasc Med 2004; 14(3):117–120; Touyz RM. Molecular and cellular mechanisms in vascular injury in hypertension: role of angiotensin II. Curr Opin Nephrol Hypertens 2005; 14(2):125–131.
Angiotensin II has two subtypes of receptors — AT1 and AT2 (see Figure 22-46) — both of which are expressed in human hearts. AT1 is also found on vascular smooth muscle and endothelial cells, nerve endings and conduction tissues, adrenal cortex, liver, kidneys and brain; AT2 has been found in fetal mesenchymal tissue, adrenal medulla, uterus and ovarian follicles, renal tubules and vasculature.11 The majority of actions of angiotensin II occur through the AT1 receptor, including vasoconstriction, stimulation of aldosterone release, inflammatory myocyte hypertrophy, fibroblast proliferation, collagen synthesis, smooth muscle cell growth, endothelial adhesion molecule expression and catecholamine synthesis.12,13 Angiotensin II has been implicated in the progression of heart failure (see Chapter 23).14 Therefore, treatments such as ACE inhibitors and angiotensin-receptor antagonists that inhibit mostly AT1 receptors are a main target in preventive and repairing strategies in cardiovascular diseases. The role of AT2 receptors remains controversial.
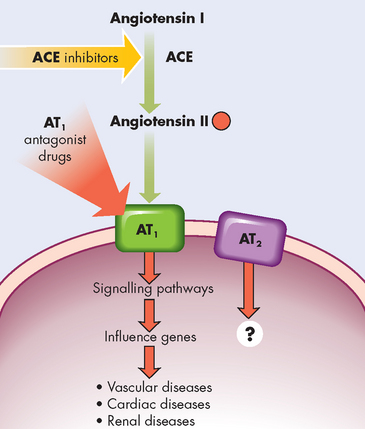
FIGURE 22-46 Angiotensin II and receptors, AT1 and AT2.
Blocking the angiotensin-converting enzyme (ACE) with ACE inhibitors decreases the amount of angiotensin II. Blocking the receptor AT1 with drugs (AT1 antagonists) blocks the attachment of angiotensin II to the cell, preventing the cellular effects and decreasing the vascular, cardiac and renal effects.
Another mechanism that can change blood plasma volume and therefore blood pressure is the natriuretic peptides (see Figure 22-45). Atrial natriuretic peptide is a hormone secreted from cells in the right atrium when blood pressure increases within this chamber. Atrial natriuretic peptide inhibits antidiuretic hormone by increasing urine sodium loss, leading to the formation of a large volume of dilute urine that decreases blood volume and blood pressure. In addition, B-type natriuretic peptide is also secreted from cardiac cells and it too increases sodium loss from the body through the kidneys. It is used both as an indicator and as a treatment for acute heart failure.
Insulin has direct vascular actions that contribute to both vascular protection and injury. Insulin resistance and diabetes have a profound effect on cardiovascular disorders, including hypertension and atherosclerotic disease.15,16
Venous pressure
The main determinants of venous blood pressure are (1) the volume of fluid within the veins and (2) the compliance (distensibility, or stretchiness) of the vessel walls. The venous system accommodates approximately two-thirds of the total blood volume at any given moment, with venous pressure averaging less than 10 mmHg. In contrast, the arteries accommodate about 15% of the total blood volume, with an average arterial pressure (blood pressure) of about 100 mmHg.
The sympathetic nervous system controls compliance. The walls of the veins are highly innervated by sympathetic fibres that, when stimulated, cause venous smooth muscle to contract and increase muscle tone. This stiffens the wall of the vein, which reduces distensibility and increases blood pressure, forcing more blood through the veins and into the right heart.
Two other mechanisms that increase venous pressure and venous return to the heart are (1) the skeletal muscle pump and (2) the respiratory pump. During skeletal muscle contraction, the veins within the muscles are partially compressed, causing decreased venous capacity and increased return to the heart (see Figure 22-37). The respiratory pump acts during inspiration, when the veins of the abdomen are partially compressed by the downward movement of the diaphragm. Thus increased abdominal pressure will increase venous pressure and move blood towards the heart (increased venous return).
Regulation of the coronary circulation
Flow of blood in the coronary circulation is directly proportional to the perfusion pressure and inversely proportional to the vascular resistance of the bed. Coronary perfusion pressure is the difference between pressure in the aorta and pressure in the venous coronary vessels of the right atrium. Aortic pressure is the driving pressure that perfuses vessels of the myocardium. Vasodilation and vasoconstriction normally maintain coronary blood flow despite stresses imposed by the constant contraction and relaxation of the heart muscle and despite shifts (within a physiological range) of coronary perfusion pressure.
Several anatomical factors influence coronary blood flow. The aortic valve cusps obstruct coronary blood flow by pushing against the openings of the coronary arteries during systole. Also during systole, the coronary arteries are compressed by ventricular contraction. The resulting systolic compressive effect is particularly evident in the subendocardial layers of the left ventricular wall and can greatly decrease coronary blood flow. Therefore, most coronary blood flow in the left ventricle occurs during diastole. During the period of systolic compression, when flow is slowed or stopped, oxygen is supplied by myoglobin, a protein present in heart muscle that binds oxygen during diastole and then releases it when blood levels of oxygen fall during systole.
Autoregulation
Autoregulation (automatic self-regulation) enables individual vessels to regulate blood flow by altering their own arteriolar resistances. Autoregulation in the coronary circulation maintains constant blood flow at perfusion pressures (mean arterial pressure) between 60 and 180 mmHg, provided that other influencing factors are held constant. Thus, autoregulation ensures constant coronary blood flow despite shifts in the perfusion pressure within the stated range.
The mechanism of autoregulation is not known, but two explanations have been proposed:
The myogenic hypothesis proposes that autoregulation originates in vascular smooth muscle, responding to changes in arterial pressure. With an increase in arterial pressure, vasoconstriction occurs due to contraction of smooth muscle. Conversely, vasodilation is stimulated by decreased arterial pressure. The metabolic hypothesis of autoregulation proposes that autoregulation of coronary vessels originates in the myocardium. Myocardial cells release chemicals in response to oxygen requirements when arterial pressure is low. This causes vasodilation and an increase in blood flow. When arterial pressure is high, the chemicals are washed out and vasoconstriction occurs and blood flow returns to normal.THE LYMPHATIC SYSTEM
Lymphatic capillaries
The lymphatic system is a special vascular system that picks up excess tissue fluid and returns it to the bloodstream (see Figure 22-47). Normally, fluid is forced out of the blood at the arterial end of the blood capillary bed and is reabsorbed into the bloodstream at the venous end. However, capillary outflow exceeds venous reabsorption by about 3 litres per day, so some fluid lags behind in the interstitium. To maintain sufficient blood volume in the cardiovascular system, this fluid must eventually rejoin the bloodstream; this is the function of the lymphatic system.
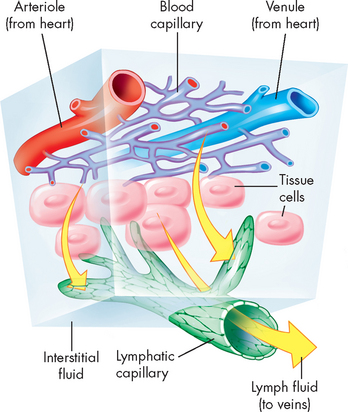
FIGURE 22-47 The role of the lymphatic system in fluid balance.
Fluid from plasma flowing through the capillaries moves into interstitial spaces. Although much of this interstitial fluid is either absorbed by tissue cells or reabsorbed by capillaries, some of the fluid tends to accumulate in the interstitial spaces. As this fluid builds up, it tends to drain into lymphatic vessels that eventually return the fluid to the venous blood.
Source: Thibodeau GA, Patton KT. Anatomy & physiology. 6th edn. St Louis: Mosby; 2007.
Fluid flow from the blood capillary to the extracellular fluid is an important part of maintaining hydration of body cells. The amount of fluid flow is dependent on two main pressures (referred to as Starling’s law of the capillaries):
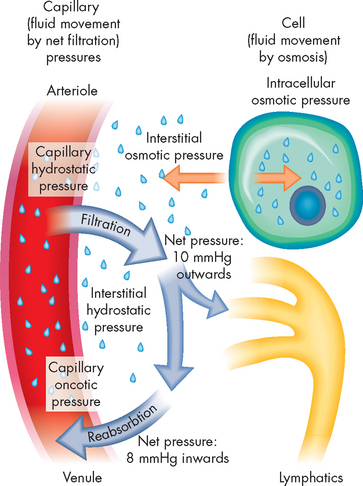
FIGURE 22-48 Fluid movement between the plasma and interstitial spaces.
The movement of fluid between the vascular interstitial spaces and the lymphatics is the result of net filtration of fluid across the capillary membrane. Capillary hydrostatic pressure is the primary force for fluid movement out of the arteriolar end of the capillary and into the interstitial spaces. At the venous end, capillary oncotic pressure (from plasma proteins) attracts water back into the vascular space. Fluid that does not return in the venous end of the capillary is drained by the lymphatic system.
The overall effect of fluid flow is that fluid leaves the capillary at the arterial end and not all of this is returned to the blood stream. This remaining excess fluid is drained by the lymphatic capillaries, through the lymphatic vessels. It is worth briefly mentioning that both hydrostatic and oncotic pressures also exist in the extracellular fluid, due to the presence of both fluid (hydrostatic pressure) and proteins (oncotic pressure). However, both of these pressures are quite small (0–1 mmHg) due to constant drainage by the lymphatic system (see Chapter 29).
Lymphatic vessels and ducts
The components of the lymphatic system are the lymphatic vessels and the lymph nodes (see Figure 22-49). In this pumpless system, a series of valves ensures one-way flow of the excess interstitial fluid (now called lymph) towards the heart. The lymphatic capillaries are closed at the ends, as shown in Figure 22-50.
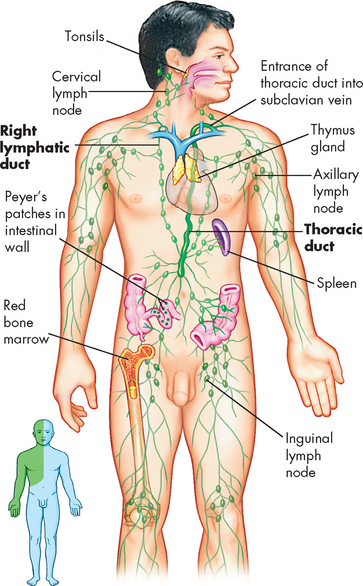
FIGURE 22-49 Principal organs of the lymphatic system.
The inset shows the areas drained by the right lymphatic duct (green) and the thoracic duct (blue).
Source: Patton KT, Thibodeau GA. Anatomy & physiology. 7th edn. St Louis: Mosby; 2010.
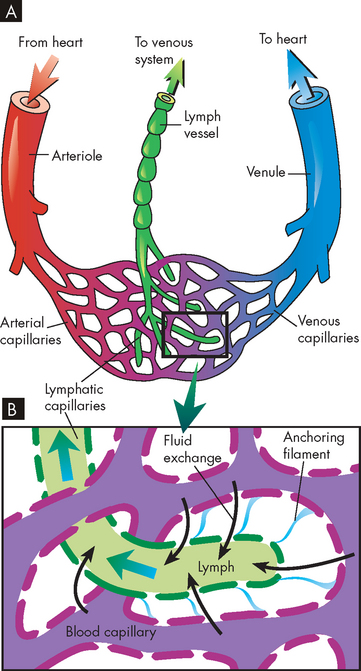
FIGURE 22-50 Lymphatic capillaries.
A Schematic representation of the lymphatic capillaries. B Anatomic components of microcirculation.
Lymph consists primarily of water and small amounts of dissolved proteins (mostly albumin) that are too large to be reabsorbed into the less permeable blood capillaries. Once within the lymphatic system, lymph travels through larger vessels called lymphatic venules and lymphatic veins. The lymphatic vessels run alongside the arteries and veins and eventually drain into one of two large ducts in the thorax: the right lymphatic duct or the thoracic duct. The right lymphatic duct drains lymph from the right arm and the right side of the head and thorax, whereas the larger thoracic duct receives lymph from the rest of the body (see Figure 22-49). The right lymphatic duct and the thoracic duct drain lymph into the right and left subclavian veins, respectively.
The lymphatic veins are thin-walled like the veins of the cardiovascular system. In the larger lymphatic veins, endothelial flaps form valves similar to those in the circulatory veins (see Figure 22-36). The valves permit lymph to flow in only one direction because lymphatic vessels are compressed intermittently by contraction of skeletal muscles, pulsatile expansion of an adjacent artery (in the same sheath) and contraction of the smooth muscles in the walls of the lymphatic vessel.
Lymph nodes
As lymph is transported towards the heart, it is filtered through thousands of bean-shaped lymph nodes clustered along the lymphatic vessels (see Figure 22-49). Lymph enters the node through several afferent lymphatic vessels, filters through the sinuses in the node and leaves by way of efferent lymphatic vessels. Lymph flows slowly through the node, which facilitates the phagocytosis of foreign substances within the node and prevents them from re-entering the bloodstream. (Phagocytosis is described in Chapter 12.)
AGEING AND THE CARDIOVASCULAR SYSTEM
A range of normal anatomical and physiological changes are seen in the ageing heart.17 In most cases, these changes do not lead to the development of cardiovascular diseases, but reflect general body trends leading to decline in performance towards the later stage of our life span. There is a decrease in the number of cardiac myocytes, with an increased proportion of collagen within the myocardium. The heart valves become calcified and fibrous. The size of the lumen in the left ventricle decreases. Also, more fat is deposited around the heart. These anatomical changes lead to corresponding alterations in cardiac performance. The effects of ageing on cardiovascular function are summarised in Table 22-3.
Table 22-3 CARDIOVASCULAR FUNCTION IN THE ELDERLY
| DETERMINANT | RESTING CARDIAC PERFORMANCE |
|---|---|
| Cardiac output | Unchanged or slightly decreased in women only |
| Heart rate | Slight decrease |
| Stroke volume | Slight increase |
| Ejection fraction | Unchanged |
| Afterload | Increased |
| End-diastolic volume | Unchanged |
| End-systolic volume | Unchanged |
| Contraction | Increased because of prolonged relaxation |
| Cardiac dilation | No change |
Source: Gerstenblith G, Lakatta EG. Aging and the cardiovascular system. In: Willerson JT, Cohn JN (eds). Cardiovascular medicine. New York: Churchill Livingstone; 1995; Kaye D, Esler M. Sympathetic neuronal regulation of the heart in aging and heart failure. Cardiovasc Res 2005; 66(2):256–264; Kenny RA, Ceifer CM. Aging and geriatric heart disease. In: Crawford MH, DiMarco JP. Cardiology. London: Mosby; 2001.
Blood vessels become less compliant (or stretchable) with age, so that changes in vessel diameter are restricted. In addition, there is narrowing of vessel lumen due to development of atherosclerosis (described in detail in Chapter 23). These changes, along with progressive fibrosis that occurs with age, can substantially limit the movement of vessel walls that is seen in younger ages. These changes increase the tendency to develop raised blood pressure with increasing age18 (see Figure 22-51). Increased blood pressure (hypertension) and atherosclerosis are major causes of cardiovascular pathophysiology, which are discussed in more detail in Chapter 23.
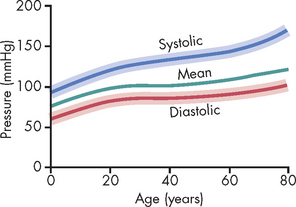
FIGURE 22-51 Changes in systolic, diastolic and mean arterial pressures with age.
The shaded areas show the approximate normal ranges.
Source: Guyton AC, Hall JE. Textbook of medical physiology. 11th edn. Philadelphia: Saunders; 2006.
The circulatory system
The circulatory system is the body’s transport system. It delivers oxygen, nutrients and other valuable substances throughout the body and carries metabolic wastes to the liver, kidneys and lungs for excretion. The circulatory system consists of the heart and blood vessels and is made up of two separate, serially connected systems: the pulmonary circulation and the systemic circulation.The structure of the heart
The heart consists of four chambers (two atria and two ventricles), four valves (two atrioventricular valves and two semilunar valves), a muscular wall, a fibrous skeleton, a conduction system, nerve fibres, systemic vessels (the coronary circulation) and openings where the great vessels enter the atria and ventricles. The heart wall, which encloses the heart and divides it into chambers, is made up of three layers: the pericardium (outer layer), the myocardium (muscular layer) and the endocardium (inner lining). The myocardial layer of the two atria, which receive blood entering the heart, is thinner than the myocardial layer of the ventricles, which have to be stronger to squeeze blood out of the heart. Deoxygenated (venous) blood from the systemic circulation enters the right atrium through the superior and inferior venae cavae. From the atrium, the blood passes through the right atrioventricular (tricuspid) valve into the right ventricle. In the ventricle, the blood flows from the inflow tract to the outflow tract and then through the pulmonary semilunar valve (pulmonary valve) into the pulmonary artery, which delivers it to the lungs for oxygenation. Oxygenated blood from the lungs enters the left atrium through the four pulmonary veins (two from the left lung and two from the right lung). From the left atrium, the blood passes through the left atrioventricular valve (mitral valve) into the left ventricle. In the ventricle, the blood flows from the inflow tract to the outflow tract and then through the aortic semilunar valve (aortic valve) into the aorta, which delivers it to systemic arteries of the entire body.Blood flow during the cardiac cycle
The pumping action of the heart consists of two phases: diastole, during which the myocardium relaxes and the ventricles fill with blood; and systole, during which the myocardium contracts, forcing blood out of the ventricles. A cardiac cycle consists of one systolic contraction and the diastolic relaxation that follows it. Each cardiac cycle constitutes one ‘heartbeat’.The coronary circulation
The coronary circulation consists of arteries and veins that supply blood to the cells of the myocardium. Oxygenated blood enters the coronary arteries through an opening in the aorta and unoxygenated blood from the coronary veins enters the right atrium through the coronary sinus. The ability of the coronary vessels to form anastomoses is an important feature that ensures that oxygen supply to the myocardium remains adequate.Structures that control heart function
Unique features that distinguish myocardial cells from skeletal cells enable myocardial cells to transmit action potentials faster (through intercalated discs), synthesise more ATP (because of a large number of mitochondria) and have readier access to ions in the interstitium (because of an abundance of transverse tubules). These combined differences enable the myocardium to work constantly, which skeletal muscle is not required to do. Cardiac myocyte action potentials differ from those of skeletal muscle. One important difference is the role of calcium in the action potential, particularly through the L-type channels. Calcium influx gives a unique shape to the action potential. The conduction system of the heart generates and transmits electrical impulses (cardiac action potentials) that stimulate systolic contractions. The autonomic nerves (sympathetic and parasympathetic fibres) can adjust heart rate and systolic force, but they do not stimulate the heart to beat. Cells of the cardiac conduction system possess the properties of automaticity and rhythmicity. Automatic cells return to threshold and depolarise rhythmically without outside stimulus. The cells of the sinoatrial (SA) node depolarise faster than other automatic cells, making it the natural pacemaker of the heart. If the SA node is disabled, the next fastest pacemaker, the atrioventricular (AV) node, takes over. Cardiac action potentials are generated by the SA node at the rate of about 75 impulses per minute. The impulses can travel through the conduction system of the heart, stimulating myocardial contraction as they go. Each cardiac action potential travels from the SA node to the AV node to the bundle of His (atrioventricular bundle), through the bundle branches and finally to the Purkinje fibres. There the impulse is stopped. It is prevented from reversing its path by the refractory period of cells that have just been polarised. The refractory period ensures that diastole (relaxation) occurs, thereby completing the cardiac cycle.Factors affecting cardiac performance
Preload, or pressure generated in the ventricles at the end of diastole, depends on the amount of blood in the ventricle. Afterload is the resistance to ejection of the blood from the ventricle. Afterload depends on pressure in the aorta. The Frank-Starling law of the heart states that the myocardial stretch determines the force of myocardial contraction (the greater the stretch, the stronger the contraction).The physiology of cardiovascular control
The systemic circulation
Vessel walls consist of three layers: the tunica intima (inner layer), the tunica media (middle layer) and the tunica externa (outer layer). Layers of the vessel wall differ in thickness and composition from vessel to vessel, depending on the vessel’s size and location within the circulatory system. In general, the tunica media of arteries close to the heart contains a greater proportion of elastic fibres because these arteries must be able to distend during systole and recoil during diastole. Distributing arteries further from the heart contain a greater proportion of smooth muscle fibres because these arteries must be able to constrict and dilate to control blood pressure and volume within specific capillary beds. Blood flows from the left ventricle into the aorta and then into arteries that eventually branch into arterioles and capillaries, the smallest of the arterial vessels. Oxygen, nutrients and other substances needed for cellular metabolism pass from the capillaries into the extracellular fluid where they are available for uptake by the cells. Capillaries also absorb products of cellular metabolism from the cells in venous blood. Venules, the smallest veins, receive capillary blood. From the venules, the venous blood flows into larger and larger veins until it reaches the venae cavae, through which it enters the right atrium. Blood flow into the capillary beds is controlled by the contraction and relaxation of smooth muscle bands (precapillary sphincters) at junctions between metarterioles and capillaries.Blood pressure and blood flow
Blood flow is affected by blood pressure, resistance to flow within the vessels, blood consistency (which affects velocity), anatomic features that may cause turbulent or laminar flow and compliance (distensibility) of the vessels. Poiseuille’s law describes the relationship of blood flow, pressure and resistance as the difference between pressure at the inflow end of the vessel and pressure at the outflow end, divided by resistance within the vessel. According to this law, resistance depends on the vessel’s length and radius and on the viscosity of the blood. The greater the vessel’s length and the blood’s viscosity and the narrower the radius of the vessel’s lumen, the greater the resistance within the vessel. Total peripheral resistance, or the resistance to flow within the entire systemic circulatory system, depends on the combined length and radius of all the vessels within the system. Arterial blood pressure is influenced and regulated by factors that affect cardiac output (heart rate, stroke volume), total resistance within the system and blood volume. Antidiuretic hormone, the renin-angiotensin system and natriuretic peptides can all alter blood volume and thus blood pressure. The tissue renin-angiotensin system is activated in response to tissue injury. This system is gaining importance in the maladaptive alterations, such as ventricular and vascular remodelling, alterations in renal function and atherosclerosis. Venous blood pressure is influenced by blood volume within the venous system and compliance of the venous walls. Blood flow through the coronary circulation is governed not only by the same principles as flow through other vascular beds but also by adaptations dictated by cardiac dynamics. First, blood flows into the coronary arteries during diastole rather than systole, because during systole, the cusps of the aortic semilunar valve block the openings of the coronary arteries. Second, systolic contraction inhibits coronary artery flow by compressing the coronary arteries.The lymphatic system
The lymphatic vessels collect fluids from the interstitium and return the fluids to the circulatory system. The vessels of the lymphatic system run in the same sheaths with the arteries and veins.Tim is a 32-year-old engineer who started a job at a new company one year ago. When he started his new job, Tim realised that after being employed with his previous company for 10 years, he had allowed himself to become complacent with many aspects of his life, including his health. He decided to get fit again and slowly worked up to a comprehensive exercise regimen. He now exercises for one to two hours per day and has a healthy diet. He does not smoke, but he does enjoy regular partying and drinks alcohol on weekends. His height and weight are normal.
Tim recently volunteered for a research project on exercise physiology and has been able to see a range of data on his cardiac performance. During the exercise phase of the project, Tim was required to undertake vigorous cycling for 30 minutes while he was attached to various monitors that assess his ventilation and heart performance. He was unable to drink fluid during the period of cycling.