Catalytic Proteins – Enzymes
Learning objectives
After reading this chapter you should be able to:
 Describe the characteristics of enzymatic reactions from the viewpoint of free energy, equilibrium and kinetics.
Discuss the structure and composition of enzymes, including the role of cofactors, and conditions that affect enzymatic reactions.
Describe enzyme kinetics based on the Michaelis–Menten equation and the significance of the Michaelis constant (Km).
Describe the elements of enzyme structure that explain their substrate specificity and catalytic activity.
Describe regulatory mechanisms affecting enzymatic reactions, including regulation by allosteric effectors and covalent modification.
Differentiate among the major types of enzyme inhibition from the viewpoint of enzyme kinetics.
Discuss the therapeutic use of enzyme inhibitors and the diagnostic utility of clinical enzyme assays.
Introduction
Almost all biological functions are supported by chemical reactions catalyzed by biological catalysts, called enzymes
Efficient metabolism is controlled by orderly, sequential, and branching metabolic pathways. Enzymes accelerate chemical reactions under physiologic conditions. However, an enzyme cannot alter the equilibrium for a reaction; it can only accelerate the reaction rate, by decreasing the activation energy of the reaction (Fig. 6.1). Regulation of enzymatic activities allows metabolism to adapt to rapidly changing conditions. Nearly all enzymes are proteins, although some ribonucleic acid molecules, termed ribozymes, also have catalytic activity (Chapter 32). Based on analysis of the human genome, it is estimated that about a quarter of human genes encode for enzymes that catalyze metabolic reactions.
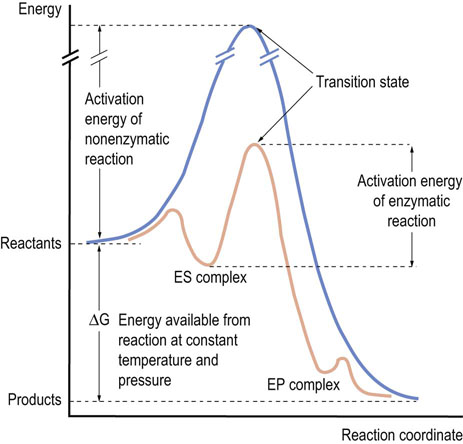
Fig. 6.1 Reaction profile for enzymatic and nonenzymatic reactions.
The basic principles of an enzyme-catalyzed reaction are the same as any chemical reaction. When a chemical reaction proceeds, the substrate must gain activation energy to reach a point called the transition state of the reaction, at which the energy level is maximum. Since the transition state of the enzyme-catalyzed reaction has a lower energy than that of the uncatalyzed reaction, the reaction can proceed faster. ES complex, enzyme–substrate complex; EP complex, enzyme–product complex.
Enzymatic Reactions
Factors affecting enzymatic reactions
Effect of temperature
Enzymes have an optimum temperature at which they function most efficiently
In the case of an inorganic catalyst, the reaction rate increases with the temperature of the system, and high temperature may be used to accelerate a reaction. In contrast, enzymes normally function as catalysts at constant (ambient or body) temperature. In in vitro assays, however, enzyme activity increases with temperature, but then declines at higher temperature. This happens because enzymes, like all proteins, denature at high temperature and lose activity.
Effect of pH
Every enzyme has a pH optimum because ionizable amino acids, such as histidine, glutamate, and cysteine, participate in the catalytic reactions
Cytosolic enzymes have pH optima in the pH 7–8 range. Pepsin, which is secreted by gastric cells and functions in gastric juice, has a pH optimum of 1.5–2.0; trypsin and chymotrypsin have alkaline pH optima, consistent with their digestive activity in alkaline pancreatic juice; lysosomal enzymes typically have acidic pH optima. The pH sensitivity of enzymes results from the effect of pH on the ionic charge of amino acid side chains of enzymes. Various solutes, including substrates, products, metal ions and regulatory molecules, also affect the rate of enzymatic reactions.
Definition of enzyme activity
One international unit (IU) of enzyme catalyzes conversion of 1 µmol of substrate to product per minute
For the purposes of standardization, the activity of an enzyme is measured under defined conditions (temperature, pH, buffer, substrate and coenzyme concentration). The rate or velocity (v) of an enzymatic reaction under these conditions is defined as the rate of conversion of substrate to product per unit of time. A unit of enzyme is a measure of the amount of enzyme. The commonly used international unit (IU) is the amount of enzyme that catalyzes conversion of one micromole of substrate to product per min (1 IU = 1 µmol/min). The katal is an international unit for the amount of enzyme that catalyzes conversion of 1 mole of substrate into 1 mole of product per second (1 kat = 1 mol/s). Because the katal is generally a very small number, the much larger international unit is more commonly used as the standard unit of activity.
The specific activity of an enzyme is a measure of the number of IU/mg protein
The specific activity of an enzyme, a measure of activity per amount of protein, is expressed as µmol/min/mg of protein or IU/mg of protein. The specific activity of enzymes varies greatly among tissues, depending on the metabolic function of the tissue. The enzymes for cholesterol synthesis, for example, have a higher specific activity (IU/mg tissue) in liver than in muscle, consistent with the role of liver in biosynthesis of cholesterol. The specific activity of an enzyme is useful for estimating its purity – the higher the specific activity of an enzyme, the higher its purity or homogeneity.
Reaction and substrate specificity
Most enzymes are highly specific for both the type of reaction catalyzed and the nature of the substrate(s)
The reaction that the enzyme catalyzes, is determined chemically by the amino acid residues in the catalytic center of the enzyme. In general, the active site of the enzyme is composed of the substrate binding site and the catalytic site. Substrate specificity is determined by the size, structure, charges, polarity, and hydrophobicity of the substrate binding site. This is because the substrate must bind in the active site as the first step in the reaction, setting the stage for catalysis. Highly specific enzymes such as catalase and urease, which degrade H2O2 and urea, respectively, catalyze only one specific chemical reaction, but some enzymes have broader substrate specificity. The serine proteases are a typical example of such a group of enzymes. These are a family of closely related enzymes, such as the pancreatic enzymes, chymotrypsin, trypsin, and elastase, which contain a reactive serine residue in the catalytic site. They catalyze the hydrolysis of peptide bonds on the carboxyl side of a limited range of amino acids in protein. Although they have similar structures and catalytic mechanisms, their substrate specificities are quite different because of structural features of the substrate binding site (Fig. 6.2).
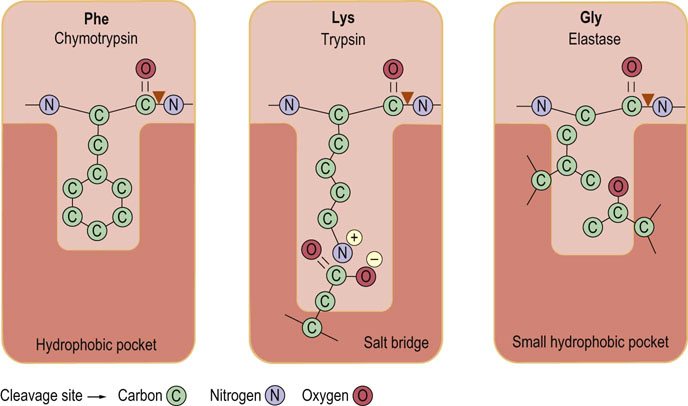
Fig. 6.2 Characteristics of the substrate binding sites in the serine proteases chymotrypsin, trypsin, and elastase.
In chymotrypsin a hydrophobic pocket binds aromatic amino acid residues such as phenyl-alanine (Phe). In trypsin, the negative charge of the aspartate residue in the substrate binding site promotes cleavage to the carboxyl side of positively charged lysine (Lys) and arginine (Arg) residues. In elastase, side chains of valine and threonine block the substrate binding site and permit binding of amino acids with small or no side chains, such as glycine (Gly). ▼ site of hydrolysis by enzyme.
All enzymes are assigned a four-digit enzyme classification (EC) number to organize the different enzymes that catalyze the many thousands of reactions. The first digit indicates membership of one of the six major classes of enzymes shown in Table 6.1. The next two digits indicate substrate subclasses and sub-subclasses; the fourth digit indicates the serial number of the specific enzyme. Isozymes are enzymes that catalyze the same reaction, but differ in their primary structure and/or subunit composition. The activities of some tissue-specific enzymes and isozymes are measured in serum for diagnostic purposes (Fig. 6.3 and Table 6.2).
Table 6.1
| Class | Reaction | Enzymes |
| 1. Oxidoreductases | Ared + Box→Aox + Bred | Dehydrogenases, peroxidases |
| 2. Transferases | A-B + C→A + B-C | Hexokinase, transaminases |
| 3. Hydrolases | A-B + H2O→A-H + B-OH | Alkaline phosphatase, trypsin |
| 4. Lyases (synthases) | X-A-B-Y→A = B + XY | fumarase, dehydratases |
| 5. Isomerases | A  isoA isoA |
Triose phosphate isomerase, phosphogluco-mutase |
| 6. Ligases (synthetases) | A + B + ATP→A-B + ADP + Pi | Pyruvate carboxylase, DNA ligases |
Table 6.2
Some enzymes used for clinical diagnosis
| Enzyme | Tissue source(s) | Diagnostic use |
| AST | Heart, skeletal muscle, liver, brain | Liver disease |
| ALT | Liver | Liver disease, e.g. hepatitis |
| Amylase | Pancreas, salivary gland | Acute pancreatitis, biliary obstruction |
| CK | Skeletal muscle, heart, brain | Muscular dystrophy, myocardial infarction |
| GGT | Liver | Hepatitis, cirrhosis |
| LDH | Heart, liver, erythrocytes | Lymphoma, hepatitis |
| Lipase | Pancreas | Acute pancreatitis, biliary obstruction |
| Alkaline phosphatase | Osteoblast | Bone disease, bone tumors |
| Acid phosphatase (PSA) |
Prostate | Prostate cancer |
AST, aspartate aminotransferase, formerly known as serum glutamate oxaloacetate transaminase (SGOT); ALT, alanine aminotransferase, formerly known as serum glutamate pyruvate transaminase (SGPT) CK, creatine phosphokinase; GGT, γ-glutamyl transpeptidase; LDH, lactate dehydrogenase; PSA, prostate-specific antigen (kallikrein 3).
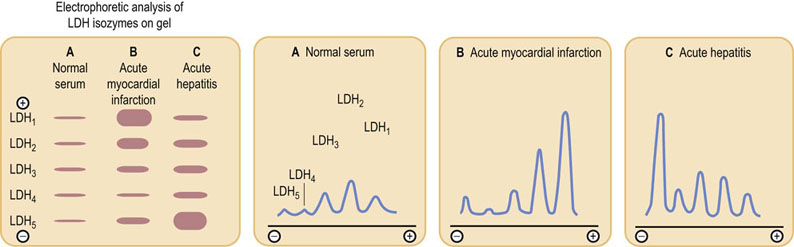
Fig. 6.3 Densitometric patterns of the lactate dehydrogenase (LDH) isozymes in serum of patients diagnosed with myocardial infarction or acute hepatitis.
Isozymes, differing slightly in charge, are separated by electrophoresis on cellulose acetate, visualized using a chromogenic substrate, and quantified by densitometry. Total serum LDH activity is also increased in these patients. Since hemolysis releases LDH from red blood cells and affects isozyme distribution and differential diagnosis, blood samples should be treated with care. The LDH measurements for the diagnosis of myocardial infarction have now been superseded by assay of plasma troponin and other biomarkers.
Roles of coenzymes
Helper molecules, referred to as coenzymes, play an essential part in many enzyme-catalyzed reactions
Enzymes with covalently or noncovalently bound coenzymes are referred to as holoenzymes. A holoenzyme without a coenzyme is termed an apoenzyme. Coenzymes are divided into two categories. Soluble coenzymes bind reversibly to the protein moiety of the enzyme. They are often modified during the enzymatic reaction, then dissociate from the enzyme and are recycled by another enzyme; oxidoreductases, discussed in Chapter 9, have coenzymes that may be oxidized by one enzyme, then reduced and recycled by another. Coenzymes, such as coenzyme A, assist in the transport of intermediates from one enzyme to another during a sequence of reactions. Most coenzymes are vitamin derivatives. Derivatives of the B vitamins, niacin and riboflavin, act as coenzymes for oxidoreductase reactions. The structure and function of coenzymes will be described in later chapters. Prosthetic groups are tightly bound, often covalently linked, to an enzyme and remain associated with the enzyme during the entire catalytic cycle. Some enzymes require inorganic (metal) ions, frequently termed cofactors, for their activity, e.g. blood-clotting enzymes that require Ca2+, and oxidoreductases, which use iron, copper, and manganese.
 Clinical test box Tissue specificity of lactate dehydrogenase isozymes
A 56-year-old female was admitted to an intensive care unit. The patient had suffered from a slight fever for 1 week, and had some chest pain, and difficulty breathing for the past 24 h. No abnormality was found on chest X-ray or by electrocardiography. However, a blood test showed white blood cells 12,100/mm3 (normal: 4000–9000/mm3), red blood cells 240 × 104/mm3 (normal: 380–500 × 104/mm3), hemoglobin 8.6 g/dL (normal: 11.8–16.0 g/dL), lactate dehydrogenase (LDH) 1400 IU/L (normal: 200–400 IU/L). Levels of other enzymes were normal. Based on the blood tests, the LDH isozyme profile and other data, the patient was eventually diagnosed with malignant lymphoma.
LDH is a tetrameric enzyme, and oxidoreductases composed of two different 35 kDa subunits. The heart contains mainly the H type, and skeletal muscle and the liver the M type subunit, which are encoded by different genes. Five types of tetrameric isozymes can be formed from these subunits: H4 (LDH1), H3M1 (LDH2), H2M2 (LDH3), H1M3 (LDH4), and M4 (LDH5). Since isozyme distributions differ among tissues, it is possible to diagnose tissue damage by assaying total LDH activity and then by isozyme profiling (Fig. 6.3).
For hematological reference values, see Table 5.2 and appendix 1.
 Advanced concept box Proportion of enzyme genes in whole human genome
Original data (Venter et al., Science 291:1335, 2001) are quoted here, and so classification does not exactly match nomenclature in Table 6.2. About a quarter of genes encode enzymes. Names of enzyme groups with number and proportion (percentage in parenthesis) in a total of 26,383 human genes were as follows: transferase, 610 (2.0); synthase and synthetase, 313 (1.0); oxidoreductase, 656 (2.1); lyase, 117 (0.4); ligase, 56 (0.2); isomerase, 163 (0.5); hydrolase, 1227 (4.0); kinase, 868 (2.8); nucleic acid enzyme, 2308 (7.5).
Clinical test box Isozymes
Isozyme profiles are often performed in the clinical laboratory for diagnostic purposes (see Fig. 6.3). The definition of isozymes is often operational, i.e. based on simple and reproducible substrate-specific assay methods that sometimes do not require precise knowledge of enzyme structure.
The term isozyme is commonly used to refer to: (1) genetic variants of an enzyme; (2) genetically independent proteins with little homology; (3) heteropolymers of two or more noncovalently bound polypeptide chains; (4) unrelated enzymes that catalyze similar reactions, e.g. enzymes conjugated with different prosthetic groups or requiring different coenzymes or cofactors; (5) different forms of a single polypeptide chain, e.g. varying in carbohydrate composition, deamination of amino acids, or proteolytic modification.
Enzyme Kinetics
The Michaelis–Menten equation: a simple model of an enzymatic reaction
Enzyme reactions are multistep in nature and comprise several partial reactions
In 1913, long before the structure of proteins was known, Leonor Michaelis and Maud Leonora Menten developed a simple model for the kinetics of enzyme-catalyzed reactions (Fig. 6.4). The Michaelis–Menten model assumes that the substrate S binds to the enzyme E, forming an essential intermediate, the enzyme-substrate complex (ES), which then undergoes reaction on the enzyme surface and decomposes to E + P (product). The model assumes that E, S, and ES are all in rapid equilibrium with one another, so that a steady-state concentration of ES is rapidly achieved, and that decomposition of the ES complex to E + P is the rate-limiting step in catalysis. The rate of this reaction is directly dependent on the activation energy of the enzyme-catalyzed reaction (Fig. 6.1).
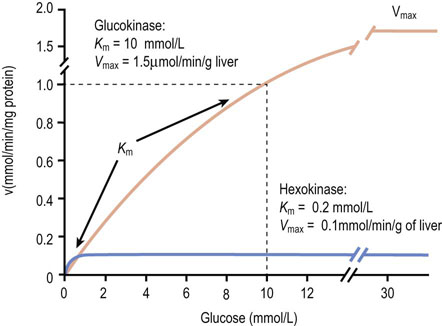
Fig. 6.4 Properties of glucokinase and hexokinase.
Glucokinase and hexokinase catalyze the same reaction, phosphorylation of glucose to glucose 6-phosphate (Glc-6-P). They exhibit different kinetic properties and have different tissue distributions and physiologic functions.
The catalytic constant, kcat, also known as the turnover number, is a rate constant which describes how quickly an enzyme can catalyze a reaction. The kcat is defined as the number of substrate molecules converted to product per enzyme molecule per unit time. The proportion of ES, in relation to the total number of enzyme molecules [E]t, i.e. the ratio [ES]/[E]t, limits the velocity of an enzyme (v) so that:
Since E, S, and ES are all in chemical equilibrium, the enzyme achieves maximal velocity, Vmax, at very high (saturating) substrate concentrations [S], when [ES] ≈ [E]t (total enzyme). Thus:
For the dissociation of the ES complex, the law of mass action yields:

Given that:

it can be shown that:

Consequently, the velocity of the enzymatic reaction, v, is given by:
Since kcat [E]t corresponds to the maximum velocity, Vmax, that is attained at high (saturating) substrate concentrations, we obtain the Michaelis–Menten equation:
Analysis of the above equations indicates that the Michaelis constant, Km, is expressed in units of concentration and corresponds to the substrate concentration at which v is 50% of the maximum velocity, i.e. [ES] = ½ [E]t and v = Vmax/2 (Fig. 6.4)
Km is a useful constant for estimating the affinity of an enzyme for its substrate. Enzymes with a high Km require high substrate concentration for efficient activity, while those with low Km operate efficiently on trace levels of substrate.The Michaelis–Menten model is based on the assumptions that:
E, S, and ES are in rapid equilibrium.
There are no forms of the enzyme present other than E and ES.
The conversion of ES into E + P is a rate-limiting, irreversible step. While all enzyme-catalyzed reactions are theoretically reversible, initial velocities are normally measured, i.e. when product concentration, and therefore the rate of the reverse reaction, is negligible.
Importantly, similar types of kinetic models have been developed for describing the kinetics of multisubstrate, multiproduct enzymes.
Advanced concept box glucokinase and hexokinase
Hexokinase catalyzes the first step in glucose metabolism in all cells, namely the phosphorylation reaction of glucose by adenosine triphosphate (ATP) to form glucose 6-phosphate (Glc-6-P):

This enzyme has a low Km for glucose (0.2 mmol/L) and is inhibited allosterically by its product, Glc-6-P. Since normal glucose levels in blood are about 5 mmol/L and intracellular levels are 0.2–2 mmol/L, hexokinase efficiently catalyzes this reaction (50–90% of Vmax) under normal conditions, e.g. in muscle.
Hepatocytes, which store glucose as glycogen, and pancreatic β-cells, which regulate glucose consumption in tissues and its storage in liver by secreting insulin, contain an isozyme called glucokinase.
Glucokinase catalyzes the same reaction as hexokinase, but has a higher Km for glucose (10 mmol/L) and is not inhibited by the product, Glc-6-P. Since glucokinase has a much higher Km than hexokinase, glucokinase phosphorylates glucose with increasing efficiency as blood glucose levels increase following a meal (see Fig. 6.4). One of the physiologic roles of glucokinase in the liver is to provide Glc-6-P for the synthesis of glycogen, a storage form of glucose. In the pancreatic β-cell, glucokinase functions as the glucose sensor, determining the threshold for insulin secretion. Mice lacking glucokinase in the pancreatic β-cell die within 3 days of birth of profound hyperglycemia, because of failure to secrete insulin.
Use of the Lineweaver–Burk and Eadie–Hofstee plots
Alternative graphical analyses permit more accurate determination of the Km and Vmax of an enzyme
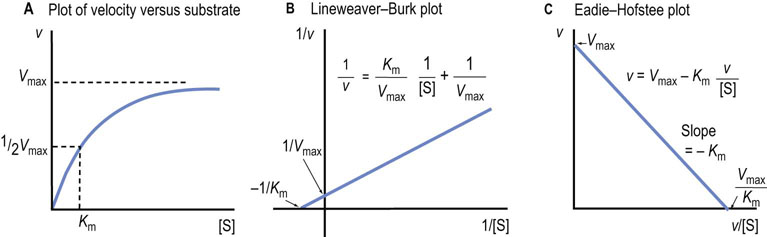
In a plot of reaction rate versus substrate concentration, the rate of the reaction approaches the maximum velocity (Vmax) asymptotically (Fig. 6.5A), so that it is difficult to obtain accurate values for Vmax and, as a result, Km (substrate concentration required for half-maximal activity), by simple extrapolation. To solve this problem, several linear transformations of the Michaelis–Menten equation have been developed.
Lineweaver–Burk plot
The Lineweaver–Burk, or double reciprocal, plot is obtained by taking the reciprocal of the Michaelis–Menten equation (Fig. 6.5B). By rearranging the equation, we obtain:
This equation yields a straight line (y = mx + b), with y = 1/v, x = 1/[S], m = slope, b = y intercept. Therefore, a graph of 1/v versus 1/[S] (Fig. 6.5B) has a slope of Km/Vmax, a 1/v intercept of 1/Vmax and a 1/[S] intercept of –1/Km. Although the Lineweaver–Burk plot is widely used for kinetic analysis of enzyme reactions, because reciprocals of the data are calculated, a small experimental error, especially at low substrate concentration, can result in a large error in the graphically determined values of Km and Vmax. An additional disadvantage is that important data obtained at high substrate concentrations are concentrated into a narrow region near the 1/v axis.
Eadie–Hofstee plot
A second, widely used linear form of the Michaelis–Menten equation is the Eadie–Hofstee plot (Fig. 6.5C), described by the equation:
In this case, a plot of v versus v/[S] has a y axis (v-intercept) of Vmax, an x axis (v/[S]) intercept of Vmax/Km, and a slope of −Km. The Eadie–Hofstee plot does not compress the data at high substrate concentrations.
Clinical test box Measurement of enzyme activity in clinical samples
In clinical laboratories, enzyme activity is measured in the presence of saturating substrate(s) and coenzyme concentrations. Initial rates are recorded to minimize errors resulting from the reverse reaction. Under these conditions v ≈ Vmax, and enzyme activity is directly proportional to enzyme concentration. The amount of enzyme (enzyme activity) is commonly expressed in IU/mL of plasma, serum, cerebrospinal fluid, rather than per mg protein. For interlaboratory comparisons, the conditions for the enzyme assay must be standardized, e.g. by specifying the substrate and coenzyme concentrations used, the buffer, buffer concentration, ionic species and ionic strength, pH and temperature.
Most clinical samples are collected under fasting conditions; this assures consistency in measurement of analytes whose concentration may vary diurnally or others, such as glucose or lipids, which vary in response to food intake. Lipemic samples are cloudy and may yield unreliable data by spectrophotometric or fluorometric methods. To avoid such problems, clinical samples must be delipidated, commonly by extraction with organic solvent.
Mechanism of Enzyme Action
Enzymatic reactions involve functional groups on enzymes, coenzymes, substrates and products
Enzymes vary significantly in their mechanism of action. In some cases catalysis is carried out on the substrate, non-covalently, reversibly bound to the enzyme. In other cases, a covalent intermediate is formed on, and then released from, the enzyme and, in others, all the action takes place on a coenzyme which forms a covalent bond with substrate. The mechanisms of action of many enzymes are discussed in later chapters in this text.
The serine proteases, introduced in Figure 6.2, are representative of enzymes that form a covalent intermediate with their substrates. These enzymes cleave peptide bonds in proteins and, as in all enzymatic reactions, functional groups on amino acid side chains participate in the enzyme-catalyzed reaction. In the serine protease family, an active site serine residue catalyzes cleavage of the peptide bond. The functional group on serine, a primary alcohol, is not among the more reactive functional groups in organic chemistry. To enhance its activity in serine proteases, this serine residue is part of a ‘catalytic triad’, in the case of chymotrypsin: Asp102, His57 and Ser195 (Fig. 6.6). Concerted hydrogen bonding interactions between these amino acids increase the nucleophilicity of the serine residue, so that it can attack the carbonyl carbon atom of the peptide bond in the substrate. Chymotrypsin is specific for cleavage on the carboxyl side of peptide bonds containing aromatic amino acids, such as phenylalanine. The mechanism of the enzymatic reaction is outlined in Figure 6.7, showing the formation and cleavage of an enzyme-bound intermediate.
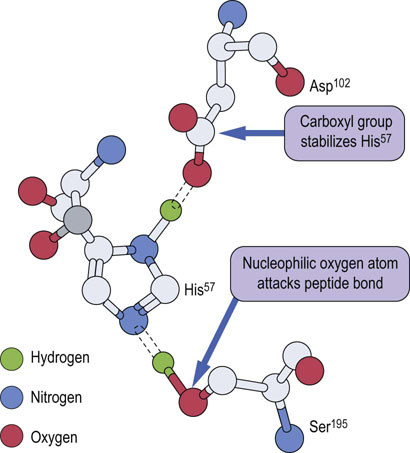
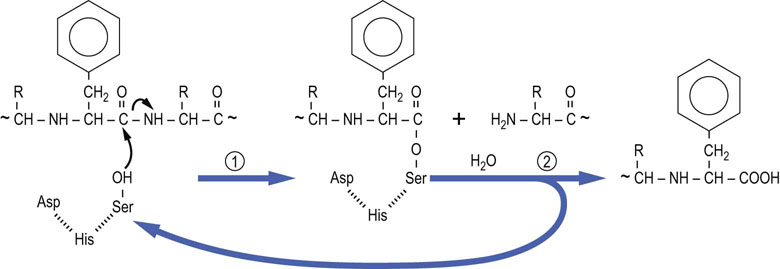
Fig. 6.7 Mechanism of action of chymotrypsin.
The active site serine residue attacks the carbonyl group of the peptide bond on the carboxyl side of a phenylalanine residue. The carboxy-terminal peptide is released and the amino-terminal peptide remains an enzyme-bound intermediate – the amino-terminal peptide linked covalently through its carboxy-terminal phenylalanine esterified to the active site serine residue. The ester bond is hydrolyzed in the second step of the reaction to release the amino-terminal peptide and regenerate active enzyme.
Trypsin and elastase, two other digestive enzymes with different amino acid specificities (Fig. 6.2), are similar to chymotrypsin in many respects. About 40% of the amino acid sequences of these three enzymes are identical, and their three-dimensional structures are very similar. All three enzymes contain the aspartate-histidine-serine catalytic triad, and are inactivated by reaction of fluorophosphates with the active serine residue. The nerve gas, diisopropylfluorophosphate, forms a sterically hindered, very slowly hydrolyzed serine-diisopropylphospate ester and inhibits serine proteases.
Enzyme Inhibition
Among numerous substances affecting metabolic processes, enzyme inhibitors are particularly important. Many drugs, either naturally occurring or synthetic, act as enzyme inhibitors. Metabolites of these compounds may also inhibit enzyme activity. Most enzyme inhibitors act reversibly, but there are also irreversible inhibitors that permanently modify the target enzyme. Using the Lineweaver–Burk plots, it is possible to distinguish three forms of reversible inhibition: competitive, uncompetitive, and noncompetitive inhibition.
Competitive inhibitors cause an apparent increase in Km, without changing Vmax
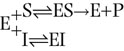
An enzyme can be inhibited competitively by substances that are similar in chemical structure to the substrate. These compounds bind in the active site and compete with substrate for the active site of the enzyme; they cause an apparent increase in Km, but no change in Vmax (Fig. 6.8). The inhibition is not the result of an effect on enzyme activity, but on substrate access to the active site. The reaction scheme for competitive inhibition is:
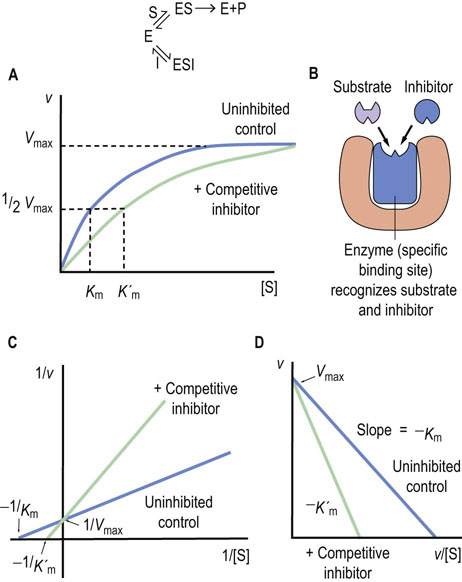
Fig. 6.8 Competitive enzyme inhibition.
(A) Plot of velocity versus substrate concentration. (B) Mechanism of competitive inhibition. (C) Lineweaver–Burk plot in the presence of a competitive inhibitor. (D) Eadie–Hofstee plot in the presence of a competitive inhibitor. K′m is the apparent Km in presence of inhibitor.
The inhibition constant (Ki) is the dissociation constant of the enzyme–inhibitor complex (EI) and the lower the Ki, the more efficient the inhibition of enzyme activity. Regardless of the Ki, however, the rate of the enzyme-catalyzed reaction in the presence of a competitive inhibitor can be increased by increasing the substrate concentration, since substrate, at higher concentration, competes more effectively with the inhibitor.
 Clinical box Treatment with an inhibitor of angiotensin-converting enzyme (ACE)
A 50-year-old man was admitted to hospital suffering from general fatigue, a stiff shoulder, and headache. The patient was 1.8 m tall and weighed 84 kg. His blood pressure was 196/98 mmHg (normal below 140/90 mmHg; optimal below 120/80 mmHg) and his pulse was 74. He was diagnosed as hypertensive. The patient was given captopril, an angiotensin-converting enzyme (ACE) inhibitor. After 5 days' treatment, his blood pressure returned to near-normal levels.
Renin in the kidney converts angiotensinogen into angiotensin I, which is then proteolytically cleaved to angiotensin II by ACE. Angiotensin II increases renal fluid and electrolyte retention, contributing to hypertension. Inhibition of ACE activity is therefore an important target for hypertension treatment. Captopril inhibits ACE competitively, decreasing blood pressure. (See also Chapter 23.)
Clinical box Methanol poisoning can be treated by ethanol administration
A 46-year-old male presented to the emergency room 7 h after consuming a large quantity of bootleg alcohol. He could not see clearly and complained of abdominal and back pain. Laboratory results indicated severe metabolic acidosis, a serum osmolality of 465 mmol/kg (reference range 285–295 mmol/kg), and serum methanol level of 4.93 g/L (156 mmol/L!). By aggressive treatment, including an ethanol drip, bicarbonate, and hemodialysis, he survived and regained his eyesight.
Methanol poisoning is uncommon but extremely hazardous. Ethylene glycol poisoning is more common and exhibits similar clinical characteristics. The most important initial symptom of methanol poisoning is visual disturbance. Laboratory evidence of methanol poisoning includes severe metabolic acidosis and increased plasma solute (methanol) concentration. Methanol is slowly metabolized to formaldehyde, which is then rapidly metabolized to formate by alcohol dehydrogenase. Formate accumulates during methanol intoxication and is responsible for the metabolic acidosis in the early stage of intoxication. In later stages lactate may also accumulate as a result of formate inhibition of respiration. Ethanol is metabolized by alcohol dehydrogenase, which binds ethanol with much higher affinity than either methanol or ethylene glycol. Ethanol is therefore a useful agent to inhibit competitively the metabolism of methanol and ethylene glycol to toxic metabolites. The unmetabolized methanol and ethylene glycol are gradually excreted in urine. Early treatment with ethanol, together with bicarbonate to combat acidosis and hemodialysis to remove methanol and its toxic metabolites, yields a good prognosis.
Noncompetitive inhibitors cause an apparent decrease in Vmax
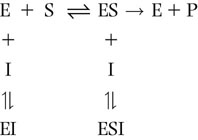
An uncompetitive inhibitor binds only to the enzyme–substrate complex and not to the free enzyme. The equation below shows the reaction scheme for uncompetitive inhibition. In this case, the Ki is the dissociation constant for the enzyme–substrate–inhibitor complex (ESI).
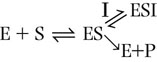
The inhibitor causes a decrease in Vmax because a fraction of the enzyme–substrate complex is diverted by the inhibitor to the inactive ESI complex. Binding of the inhibitor and the increase in the ESI complex may also affect the dissociation of substrate, causing an apparent decrease in Km, i.e. an apparent increase in substrate affinity.
Non-competitive inhibitors may bind to sites outside the active site and alter both the Km and Vmax of the enzyme
An uncompetitive inhibitor can bind either to the free enzyme or to the enzyme–substrate complex, e.g. at an allosteric site. Uncompetitive inhibitors exhibit more complex effects and may alter both the Km and Vmax of an enzymatic reaction. The equation below shows the reaction scheme observed for noncompetitive inhibition.
Many drugs and poisons irreversibly inhibit enzymes
Prostaglandins are key inflammatory mediators. Their synthesis is initiated by cyclooxygenase-mediated oxidation and cyclization of arachidonate under inflammatory conditions (Chapter 40). Compounds that suppress cyclooxygenase have anti-inflammatory activity. Aspirin (acetylsalicylic acid) inhibits cyclooxygenase activity by acetylating Ser530, which blocks access of arachidonate to the active site of the enzyme. Other nonsteroidal anti-inflammatory drugs (NSAIDs), such as indomethacin, inhibit cyclooxygenase activity by reversibly blocking the arachidonate binding site.
Disulfiram (Antabuse®) is a drug used for the treatment of alcoholism. Alcohol is metabolized in two steps to acetic acid. The first enzyme, alcohol dehydrogenase, yields acetaldehyde, which is then converted into acetic acid by aldehyde dehydrogenase. The latter enzyme has an active site cysteine residue that is irreversibly modified by disulfiram, resulting in accumulation of alcohol and acetaldehyde in the blood. People who take disulfiram become sick because of the accumulation of acetaldehyde in blood and tissues, leading to alcohol avoidance.
Alkylating agents, such as iodoacetamide (ICH2CONH2), irreversibly inhibit the catalytic activity of some enzymes by modifying essential cysteine residues. Heavy metals, such as mercury and lead salts, also inhibit enzymes with active site sulfhydryl residues. The mercury adducts are often reversible by thiol compounds. Eggs or egg white are sometimes administered as an antidote for accidental ingestion of heavy metals The egg white protein, ovalbumin, is rich in sulfhydryl groups; it traps the free metal ions and prevents their absorption from the gastrointestinal tract.
In many cases, irreversible inhibitors are used to identify active-site residues involved in enzyme catalysis, and to gain insight into the mechanism of enzyme action. By sequencing or mass spectrometric analysis of the modified peptide, it is possible to identify the specific amino acid residue modified by the inhibitor and involved in catalysis.
Advanced concept box Enzyme inhibition: transition-state inhibition and suicide substrate
Enzymes catalyze reactions by inducing the transition state of the reaction. It should therefore be possible to construct molecules that bind very tightly to the enzyme by mimicking the transition state of the substrate. Transition states themselves cannot be isolated, because they are not a stable arrangement of atoms, and some bonds are only partially formed or broken. But for some enzymes, analogues can be synthesized that are stable, but still have some of the structural features of the transition state.
Penicillin (Fig. 6.9) is a good example of a transition state analogue. It inhibits the transpeptidase that crosslinks bacterial cell-wall peptidoglycan strands, the last step in cell-wall synthesis in bacteria. It has a strained 4-membered lactam ring that mimics the transition state of the normal substrate. When penicillin binds to the active site of the enzyme, its lactam ring opens, forming a covalent bond with a serine residue at the active site. Penicillin is a potent irreversible inhibitor of bacterial cell-wall synthesis, making the bacterium osmotically fragile and unable to survive in the body.
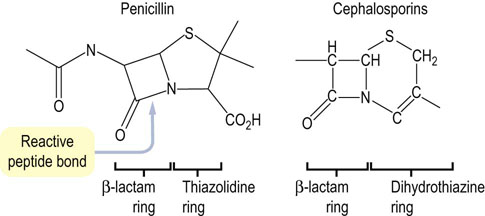
Fig. 6.9 Structure of penicillin showing the reactive peptide bond in the β-lactam ring and core structure of cephalosporins.
Penicillins contain a β-lactam ring fused to a thiazolidine ring. Cephalosporins are another class of compounds containing the β-lactam ring fused to a six-membered dihydrothiazine ring. Because of their effectiveness and lack of toxicity, β-lactam compounds are widely used antibiotics. Bacteria with β-lactamase, which breaks the β-lactam ring, are resistant to these antibiotics.
Regulation of Enzyme Activity
In multistep metabolic pathways, the slowest step limits the overall rate of the reaction
It is most efficient to regulate a metabolic pathway by controlling key enzymes that are involved in the ‘rate-limiting’ step. Generally, five independent mechanisms are involved in the regulation of enzyme activity.
The expression of the enzyme protein from the corresponding gene changes in response to the cell's changing environment or metabolic demands.
Enzymes may be irreversibly activated or inactivated by proteolytic enzymes.
Enzymes may be reversibly activated or inactivated by covalent modification, such as phosphorylation.
Allosteric regulation modulates the activity of key enzymes through reversible binding of small molecules at sites distinct from the active site in a process that is relatively rapid and, hence, the first response of cells to changing conditions.
The degradation of enzymes by intracellular proteases in the lysosome or by proteasomes in the cytosol also determines the lifetimes of the enzymes and consequently enzyme activity over a much longer period of time.
Despite extensive studies it is still impossible to deduce precisely the activity of specific enzymes in the body; many factors including substrate concentrations, pH and allosteric effectors change with time under physiologic conditions. Advances in technology now permit the measurement of thousands of metabolites quantitatively and simultaneously in tissues – a developing field known as metabolomics (Chapter 36). Using the tools of basic enzymology and metabolomics, it may eventually be possible to measure the endogenous flux through complex metabolic pathways in vivo.
Proteolytic activation of digestive enzymes
Some enzymes are stored in subcellular organelles or compartments in an inactive precursor form
Several digestive enzymes are stored as inactive zymogens or proenzymes in secretory vesicles in the pancreas. The zymogens are secreted in pancreatic juice following a meal and are activated in the gastrointestinal tract. Trypsinogen is converted into trypsin by the action of intestinal enteropeptidase. Enteropeptidase, located on the inner surface of the duodenum, hydrolyzes an N-terminal peptide from the inactive trypsinogen. Rearrangement of the tertiary structure yields the proteolytically active form of trypsin. The active trypsin then digests other zymogens, such as procarboxypeptidase, proelastase and chymotrypsinogen, as well as other trypsinogen molecules (Chapter 10). Similar proteolytic cascades are observed in blood clotting and fibrinolysis (dissolution of clots) (Chapter 7).
Allosteric regulation of rate-limiting enzymes in metabolic pathways
Allosteric enzymes display sigmoidal, rather than hyperbolic, plots of reaction rate vs. substrate concentration
The substrate saturation curve for an ‘isosteric’ (single shape) enzyme is hyperbolic (see Fig. 6.5A). In contrast, allosteric enzymes show sigmoidal plots of reaction velocity versus substrate concentration [S] (Fig. 6.10). An allosteric (other site) effector molecule binds to the enzyme at a site that is distinct and physically separate from the substrate binding site, and affects substrate binding (Km) and/or kcat. In some cases, the substrate may exert allosteric effects; this is referred to as a homotropic effect. If the allosteric effector is different from the substrate, it is referred to as a heterotropic effect. Homotropic effects are observed when the reaction of one substrate molecule with a multimeric enzyme affects the binding of a second substrate molecule at a different active site on the enzyme. The interaction between subunits makes the binding of substrate cooperative and results in a sigmoidal curve in the plot of v versus [S]. This effect is essentially identical with that described for the binding of O2 to hemoglobin (Chapter 5), except that in the case of enzymes, substrate binding leads to an enzyme-catalyzed reaction.
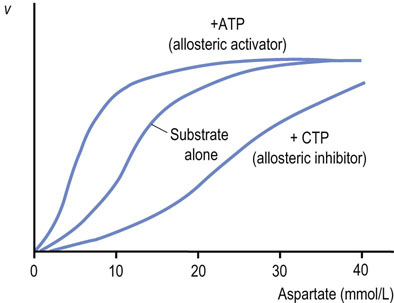
Fig. 6.10 Allosteric regulation of aspartate transcarbamoylase (ATCase).
Plot of velocity (v) versus substrate concentration in the presence of an allosteric activator or allosteric inhibitor ATCase is an example of an allosteric enzyme. Aspartate (substrate) homotropically regulates ATCase activity, providing sigmoidal kinetics. CTP, an end product, heterotropically inhibits, but ATP, a precursor, heterotropically activates ATCase.
Clinical box Hemophilia is caused by a defect in zymogen activation
A child was admitted to hospital with muscle bleeding affecting the femoral nerve. Laboratory findings indicated a blood-clotting disorder, hemophilia A, resulting from deficiency of factor VIII. Factor VIII was administered to the patient to restore blood-clotting activity.
Formation of a blood clot results from a cascade of zymogen-activation reactions. Over a dozen different proteins, known as blood-clotting factors, are involved. In the final step, the blood clot is formed by conversion of a soluble protein, fibrinogen (factor I), into an insoluble, fibrous product, fibrin, which forms the matrix of the clot. This last step is catalyzed by the serine protease, thrombin (factor IIa). Hemophilia is a disorder of blood clotting caused by a defect in one of the sequence of clotting factors. Hemophilia A, the major (85%) form of hemophilia, is caused by a defect of clotting Factor VIII (see Chapter 7).
Advanced concept box Nucleoside analogues as ANTIVIRAL agents
Nucleoside analogues such as acyclovir and ganciclovir have been used for treatment of herpes simplex virus (HSV), varicella-zoster (VZV), and cytomegalovirus (CMV). They are pro-drugs that are activated by phosphorylation and terminate viral DNA synthesis by inhibiting the viral DNA polymerase reaction. The thymidine kinase (TK), more properly a nucleoside kinase, of the viruses phosphorylate these compounds to their monophosphate form. Cellular kinases next add phosphates to form the active triphosphate compounds, which are competitive inhibitors of the viral DNA polymerase during DNA replication (Chapter 32).
While viral TK has low substrate specificity and efficiently phosphorylates nucleoside analogues, cellular nucleoside kinases have high substrate specificity and barely phosphorylate the nucleoside analogues. Thus, virus-infected cells are prone to be arrested at specific cell cycle stage, G2-M checkpoint (Chapter 42), but uninfected cells are resistant to the nucleoside analogues.
Positive and negative cooperativity
Positive cooperativity indicates that the reaction of a substrate with one active site makes it easier for another substrate to react at another active site. Negative cooperativity means that the reaction of a substrate with one active site makes it more difficult for a substrate to react at the other active site. Since the affinity of the enzyme changes with substrate concentration, it cannot be described by simple Michaelis–Menten kinetics. Instead, it is characterized by the substrate concentration giving a half-maximal rate, [S]0.5, and the Hill coefficient (H) (Chapter 5). The H-values are larger than 1 for enzymes with positive cooperativity and less than 1 for those with negative cooperativity. For most allosteric enzymes, intracellular substrate concentrations are poised near the [S]0.5, so that the enzyme's activity responds to slight changes in substrate concentration.
The model most often invoked to rationalize allosteric behavior was established by Monod, Wyman and Changeaux, the so-called concerted model (Fig. 6.11). As with O2 binding to Hb, in the absence of substrate, the enzyme has a low affinity for substrate and is in the T state (tense state). The other conformation of the enzyme is the R state (relaxed state). Binding of allosteric effector molecules shifts the fraction of enzyme from one state to the other. In this model, all the active sites in the R state are the same and all have higher substrate affinity than in the T state. Because the transition between the T and R states occurs at the same time for all subunits, this is called the concerted (two-state) model. An alternative model, the so-called sequential (multistate) model, was proposed by Koshland, Nèmethy and Filmer. It postulates that each subunit changes independently to a different conformation and that different subunits may have different affinities for substrate. It is now recognized that both models are applicable to different enzymes.
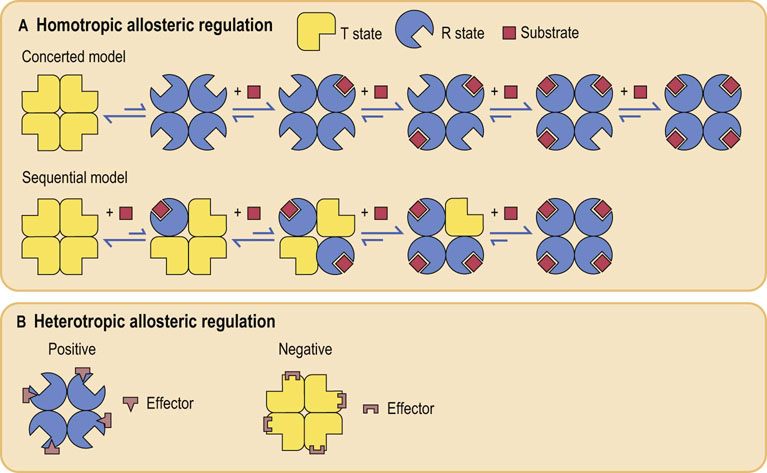
Fig. 6.11 Schematic representation of allosteric regulation.
(A) In homotropic regulation, the substrate acts as an allosteric effector. Two models are presented. In the concerted model, all of the subunits convert from the T (tense; low affinity for substrate) – into the R (relaxed; high affinity for substrate) – state at the same time; in the sequential model, they change one by one, with each substrate binding reaction. (B) In heterotropic regulation, the effector is distinct from the substrate, and binds at a structurally different site on the enzyme. Positive and negative effectors stabilize the enzyme in R and T state, respectively.
Clinical box Insecticide poisoning
A 55-year-old man was spraying an insecticide containing organic fluorophosphates in a rice field. He suddenly developed a frontal headache, eye pain, and tightness in his chest, typical signs of over-exposure to toxic organic fluorophosphates. He was taken to hospital and treated with an intravenous injection of 2 mg of atropine sulfate, and gradually recovered.
Organic fluorophosphates form covalent phosphoryl-enzyme complexes with both serine proteases and esterases, such as acetylcholinesterase. irreversibly inhibiting the enzymes. Acetylcholinesterase terminates the action of acetylcholine during neuromuscular activity (Chapter 41) by hydrolyzing the acetylcholine to acetate and choline. Inhibition of this enzyme prolongs the action of acetylcholine, leading to constant neuromuscular stimulation. Atropine competitively blocks acetylcholine binding and muscle stimulation at the neuromuscular junction.
Enzymatic Measurement of Blood Glucose
The glucose oxidase/peroxidase assay
In clinical laboratories, most compounds are measured by automated enzymatic methods
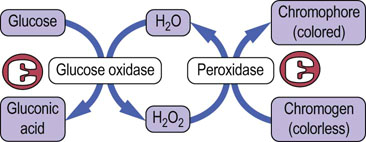
The most common assay procedure uses a mixture of glucose oxidase and peroxidase (Fig. 6.12). Glucose oxidase is highly specific for glucose, but oxidizes only the β-anomer of the sugar, which represents ~64% of glucose in solution. The assay mixture is therefore supplemented with mutarotase, which rapidly catalyzes the interconversion of the anomers, enhancing assay sensitivity by ~50%. The H2O2 produced in the oxidase reaction is then used in a peroxidase reaction to oxidize a chromogen to yield a colored chromophore. The color yield is directly proportional to the glucose content of the sample. There are fluorometric versions of this assay for high sensitivity, and one commercial analyzer uses an oxygen electrode to measure the rate of decrease in oxygen concentration in the sample, which is also directly proportional to the glucose concentration.
Reagent strips and glucometers
People with diabetes normally monitor their blood glucose several times a day using reagent strips or glucose meters
The glucose reagent strips are impregnated with a glucose oxidase/peroxidase (GOP) reagent. In the manual version of this assay, the extent of color change on a dipstick is related to glucose concentration – typically on a 1–4 scale. Modern glucometers use a small drop of blood (~1 µL) and amperometric electrodes to measure the current produced by the redox reaction catalyzed by glucose dehydrogenase (GDH), which oxidizes glucose to gluconic acid, but reduces a coenzyme rather than oxygen. These assays are commonly used where rapid or frequent measurements of blood glucose are required. When the GOP and GDH assays were compared at high altitude on a trek up Mount Kilimanjaro, the GOP assay, which depends on ambient oxygen, had a greater error. Both methods were less accurate at the low temperatures at high altitude.
Kinetic assays
Kinetic assays are more rapid than end-point assays
In the assay described in Figure 6.12 and plotted for several glucose concentrations in Figure 6.13A, the reaction is allowed to proceed to its endpoint, i.e. until all the glucose has been oxidized; then the color change is measured. The color yield is then plotted against a standard to determine blood glucose concentration (Fig. 6.13B). High-throughput kinetic analyzers estimate the glucose concentration in a sample by measuring the initial rate of the reaction. Analysis of the kinetic plots in Figure 6.13A, for example, indicates that both the endpoint and the initial rate of the glucose oxidase assay are dependent on glucose concentration. Thus, the analyzer can measure the change in absorbance (or some other parameter) during the early stages of the reaction and compare this rate to that of a standard solution to estimate the glucose concentration (Fig. 6.13C). These assays are performed on flow-injection or centrifugal analyzers to insure rapid mixing of reagents and sample.
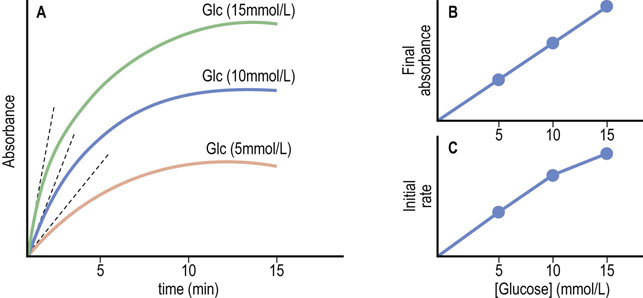
Fig. 6.13 Glucose oxidase/peroxidase assays – endpoint versus kinetic assays.
(A) Graphical analysis of an endpoint assay. (B) The final (endpoint) absorbances are plotted as a function of glucose concentration, yielding a straight line. (C) Initial rates of reactions are estimated by multiple measurements early in the assay (dotted lines in frame A), and plotted versus glucose concentration. Nonlinear plots, when obtained, are analyzed by computer.
Kinetic analyzers are inherently faster than endpoint assays because they estimate glucose concentration before the assay reaches its endpoint. These assays work because glucose oxidase and glucose dehydrogenase have a high Km for glucose. At the concentrations of glucose found in blood, the rate of the oxidase reaction is proportional to glucose concentration, i.e. in the first-order region of the Michaelis–Menten equation where the substrate concentration is less than the Km (see Fig. 6.4).
Summary
Most metabolism is catalyzed by biological catalysts called enzymes. Their catalytic activities are apparent at body temperature, and they are strictly regulated by several mechanisms.
Both covalent and noncovalent modifications are involved in this regulation and allow for efficient metabolic control. Enzyme activity can be inhibited (or activated) by synthetic compounds (drugs), exogenous compounds (toxins), and endogenous compounds (allosteric effectors).
Kinetic analyses of enzymatic reaction are beneficial for evaluating the biological role of enzymes and for elucidating their reaction mechanisms.
Assays of enzymes in blood are useful for diagnosis and monitoring of many clinical conditions.
Androutsopoulos, VP, Hernandez, AF, Liesivuori, J, et al. A mechanistic overview of health associated effects of low levels of organochlorine and organophosphorous pesticides. Toxicology. 2012.
Christenson, RH, Duh, SH. Methodological and analytic considerations for blood biomarkers. Prog Cardiovasc Dis. 2012; 55:25–33.
Claudino, WM, Goncalves, PH, di Leo, A, et al. Metabolomics in cancer: A bench-to-bedside intersection. Crit Rev Oncol Hematol. 2012.
DeFeo, EM, Wu, CL, McDougal, WS, et al. A decade in prostate cancer: from NMR to metabolomics. Nat Rev Urol. 2011; 8(6):301–311.
Lippi, G, Valentino, M, Cervellin, G. Laboratory diagnosis of acute pancreatitis: in search of the Holy Grail. Crit Rev Clin Lab Sci. 2012; 49:18–31.
Lopez-Otin, C, Matrisian, LM. Emerging roles of proteases in tumour suppression. Nat Rev Cancer. 2007; 7:800–808.
Niemela, O, Alatalo, P. Biomarkers of alcohol consumption and related liver disease. Scand J Clin Lab Invest. 2010; 70:305–312.
Öberg, D, Östenson, C-G. Performance of glucose dehydrogenase-and glucose oxidase-based blood glucose meters at high altitude and low temperature. Diabetes Care. 2005; 28:1261.
Spratt, BG. The 2011 Garrod Lecture: From penicillin-binding proteins to molecular endocrinology. J Antimicrob Chemother. 2012; 67:1578–1588.
Teicher, BA, Linehan, WM, Helman, LJ. Targeting cancer metabolism. Clin Cancer Res. 2012; 18:5537–5545.
Zhang, GF, Sadhukhan, S, Tochtrop, GP, et al. Metabolomics, pathway regulation, and pathway discovery. J Biol Chem. 2011; 286:23631–23635.
Clinical Enzymology. www.labtestsonline.org/.
International Federation of Clinical Chemistry and Laboratory Medicin. www.ifcc.org/
Chymotrypsin, mechanism of action. www.chembio.uoguelph.ca/educmat/chm258/lecture12.pdf.
Serine proteases. www.med.unibs.it/~marchesi/pps97/course/section12/serprot1.html.
Enzyme classification. www.chem.qmul.ac.uk/iubmb/enzyme/rules.html.
The Comprehensive Enzyme Information Syste. www.brenda-enzymes.info/
A Database of Enzyme Catalytic Mechanism. http://mbs.cbrc.jp/EzCatDB/
The Enzyme Databas. www.enzyme-database.org/
Enzyme nomenclature. www.chem.qmul.ac.uk/iubmb/enzyme/.
Enzyme nomenclature database. http://enzyme.expasy.org/.
Enzyme structures database. www.ebi.ac.uk/thornton-srv/databases/enzymes/.
IntEnz (Integrated relational Enzyme database). www.ebi.ac.uk/intenz/.
A resource portal for enzymes. www.enzymedirectory.com/.