Chapter 3 Elastic forces and lung volumes
 Inward elastic recoil of the lung opposes outward elastic recoil of the chest wall, and the balance of these forces determines static lung volumes. Surface tension within the alveoli contributes significantly to lung recoil, and is reduced by the presence of surfactant, though the mechanism by which this occurs is poorly understood.
An isolated lung will tend to contract until eventually all the contained air is expelled. In contrast, when the thoracic cage is opened it tends to expand to a volume about 1 litre greater than functional residual capacity (FRC). Thus in a relaxed subject with an open airway and no air flowing, for example at the end of expiration or inspiration, the inward elastic recoil of the lungs is exactly balanced by the outward recoil of the thoracic cage.
The movements of the lungs are entirely passive and result from forces external to the lungs. In the case of spontaneous breathing the external forces are the respiratory muscles, while artificial ventilation is usually in response to a pressure gradient that is developed between the airway and the environment. In each case, the pattern of response by the lung is governed by the physical impedance of the respiratory system. This impedance, or hindrance, has numerous origins, the most important of which are:
The last three may be grouped together as non-elastic resistance or respiratory system resistance; they are discussed in Chapter 4. They are measured while gas is flowing within the airways, and work performed in overcoming this ‘frictional’ resistance is dissipated as heat and lost.
The first two forms of impedance may be grouped together as ‘elastic’ resistance. These are measured when gas is not flowing within the lung. Work performed in overcoming elastic resistance is stored as potential energy, and elastic deformation during inspiration is the usual source of energy for expiration during both spontaneous and artificial breathing.
This chapter is concerned with the elastic resistance afforded by lungs (including the alveoli) and chest wall, which will be considered separately and then together. When the respiratory muscles are totally relaxed, these factors govern the resting end-expiratory lung volume or FRC, and therefore lung volumes will also be considered in this chapter.
Elastic Recoil of the Lungs
Lung compliance is defined as the change in lung volume per unit change in transmural pressure gradient (i.e. between the alveolus and pleural space). Compliance is usually expressed in litres (or millilitres) per kilopascal (or centimetres of water) with a normal value of 1.5 l.kPa−1 (150 ml.cmH2O−1). Stiff lungs have a low compliance.
Compliance may be described as static or dynamic depending on the method of measurement (page 38). Static compliance is measured after a lung volume has been held at a fixed volume for as long as is practicable, while dynamic compliance is usually measured in the course of normal rhythmic breathing. Elastance is the reciprocal of compliance and is expressed in kilopascals per litre. Stiff lungs have a high elastance.
The Nature of the Forces Causing Recoil of the Lung
For many years it was thought that the recoil of the lung was due entirely to stretching of the yellow elastin fibres present in the lung parenchyma. In 1929, von Neergaard (page 243) showed that a lung completely filled with and immersed in water had an elastance that was much less than the normal value obtained when the lung was filled with air. He correctly concluded that much of the ‘elastic recoil’ was due to surface tension acting throughout the vast air/water interface lining the alveoli.
Surface tension at an air/water interface produces forces that tend to reduce the area of the interface. Thus the gas pressure within a bubble is always higher than the surrounding gas pressure because the surface of the bubble is in a state of tension. Alveoli resemble bubbles in this respect, although the alveolar gas is connected to the exterior by the air passages. The pressure inside a bubble is higher than the surrounding pressure by an amount depending on the surface tension of the liquid and the radius of curvature of the bubble according to the Laplace equation:

where P is the pressure within the bubble (dyn.cm−2), T is the surface tension of the liquid (dyn.cm−1) and R is the radius of the bubble (cm). In coherent SI units (see Appendix A), the appropriate units would be pressure in pascals (Pa), surface tension in newtons/metre (N.m−1) and radius in metres (m).
On the left of Figure 3.1A is shown a typical alveolus of radius 0.1 mm. Assuming that the alveolar lining fluid has a normal surface tension of 20 mN.m−1 (= 20 dyn.cm−1), the pressure within the alveolus will be 0.4 kPa (4 cmH2O), which is rather less than the normal transmural pressure at FRC. If the alveolar lining fluid had the same surface tension as water (72 mN.m−1), the lungs would be very stiff.
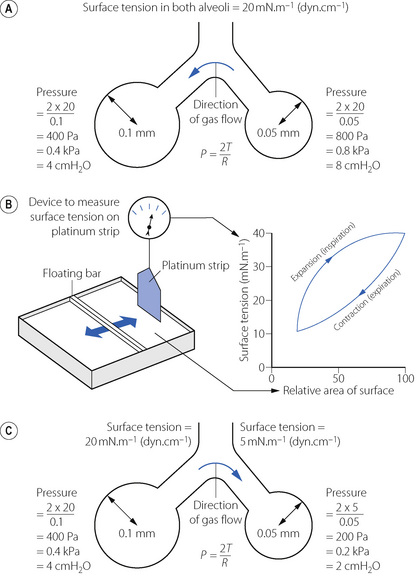
Fig. 3.1 Surface tension and alveolar transmural pressure. (A) Pressure relations in two alveoli of different size but with the same surface tension of their lining fluids. (B) The changes in surface tension in relation to the area of the alveolar lining film. (C) Pressure relations of two alveoli of different size when allowance is made for the probable changes in surface tension.
The alveolus on the right of Figure 3.1A has a radius of only 0.05 mm and the Laplace equation indicates that, if the surface tension of the alveolus is the same, its pressure should be double the pressure in the left-hand alveolus. Thus gas would tend to flow from smaller alveoli into larger alveoli and the lung would be unstable which, of course, is not the case. Similarly, the retractive forces of the alveolar lining fluid would increase at low lung volumes and decrease at high lung volumes, which is exactly the reverse of what is observed. These paradoxes were clear to von Neergaard and he concluded that the surface tension of the alveolar lining fluid must be considerably less than would be expected from the properties of simple liquids and, furthermore, that its value must be variable. Observations 30 years later confirmed this when alveolar extracts were shown to have a surface tension much lower than water and which varied in proportion to the area of the interface.1 Figure 3.1B shows an experiment in which a floating bar is moved in a trough containing an alveolar extract. As the bar is moved to the right, the surface film is concentrated and the surface tension changes as shown in the graph on the right of the figure. During expansion, the surface tension increases to 40 mN.m−1, a value which is close to that of plasma but, during contraction, the surface tension falls to 19 mN.m−1, a lower value than any other body fluid. The course of the relationship between pressure and area is different during expansion and contraction, and a loop is described.
The consequences of these changes are very important. In contrast to a bubble of soap solution, the pressure within an alveolus tends to decrease as the radius of curvature is decreased. This is illustrated in Figure 3.1C where the right-hand alveolus has a smaller diameter and a much lower surface tension than the left-hand alveolus. Gas tends to flow from the larger to the smaller alveolus and stability is maintained.
The Alveolar Surfactant
The low surface tension of the alveolar lining fluid and its dependence on alveolar radius are due to the presence of a surface-active material known as the surfactant.2 Some 90% of surfactant consists of lipids, the remainder being proteins and small amounts of carbohydrate. Most of the lipid is phospholipid, of which 70–80% is dipalmitoyl phosphatidyl choline (DPPC), the main constituent responsible for the effect on surface tension. The fatty acids are hydrophobic and generally straight, lying parallel to each other and projecting into the gas phase. The other end of the molecule is hydrophilic and lies within the alveolar lining fluid. The molecule is thus confined to the surface where, being detergents, they lower surface tension in proportion to the concentration at the interface.
Around 10% of surfactant obtained from bronchio-alveolar lavage is protein, most of which are contaminating serum proteins such as albumin and globulin. Approximately 2% of surfactant by weight consists of surfactant proteins (SP), of which there are four types labelled A–D.3,4 SP-B and SP-C are small proteins that are vital to the stabilisation of the surfactant mono-layer (see below); a congenital lack of SP-B results in severe and progressive respiratory failure.4,5 SP-A, and to a lesser extent SP-D, are involved in the control of surfactant release and possibly in preventing pulmonary infection (see below).6
Synthesis of surfactant. Surfactant is both formed in and liberated from the alveolar epithelial type II cell (page 23). The lamellar bodies (see Figure 2.10) contain stored surfactant that is released into the alveolus by exocytosis in response to high volume lung inflation, increased ventilation rate or endocrine stimulation. After release surfactant initially forms areas of a lattice structure termed tubular myelin, which is then reorganised into mono- or multi-layered surface films. This conversion into the functionally active form of surfactant is believed to be critically dependent on surfactant proteins B and C (see below).4,6 The alveolar half life of surfactant is 15–30 hours with most of its components being recycled by type II alveolar cells. Surfactant protein-A is intimately involved in controlling the surfactant present in the alveolus with type II alveolar cells having SP-A surface receptors, stimulation of which exerts a negative feedback on surfactant secretion and increases re-uptake of surfactant components into the cell.
Action of surfactant. To maintain the stability of alveoli as shown in Figure 3.1, surfactant must alter the surface tension in the alveoli as their size varies with inspiration and expiration. A simple explanation of how this occurs is that during expiration, as the surface area of the alveolus diminishes, the surfactant molecules are packed more densely and so exert a greater effect on the surface tension, which then decreases as shown in Figure 3.1b. In reality, the situation is considerably more complex, and at present poorly elucidated.4 The classical explanation, referred to as the ‘squeeze out’ hypothesis, is that as a surfactant monolayer is compressed, the less stable phospholipids are squeezed out of the layer, increasing the amount of stable DPPC molecules which have the greatest effect in reducing surface tension.7 Surfactant phospholipid is also known to exist in vivo in both monolayer and multilayer forms,3 and it is possible that in some areas of the alveoli the surfactant layer alternates between these two forms as alveolar size changes during the respiratory cycle. This aspect of surfactant function is entirely dependent on the presence of SP-B, a small hydrophobic protein, which can be incorporated into a phospho-lipid monolayer, and SP-C, a larger protein with a hydrophobic central portion allowing it to span a lipid bilayer.4 When alveolar size reduces and the surface film is compressed, SP-B molecules may be squeezed out of the lipid layer so changing its surface properties, while SP-C may serve to stabilise bilayers of lipid to act as a reservoir from which the surface film re-forms when alveolar size increases.
Other effects of surfactant. Pulmonary transudation is also affected by surface forces. Surface tension causes the pressure within the alveolar lining fluid to be less than the alveolar pressure. Since the pulmonary capillary pressure in most of the lung is greater than the alveolar pressure (page 420), both factors encourage transudation, a tendency that is checked by the oncotic pressure of the plasma proteins. Thus the surfactant, by reducing surface tension, diminishes one component of the pressure gradient and helps to prevent transudation.
Surfactant also plays an important part in the immunology of the lung.2,8,9 The lipid component of surfactant has anti-oxidant activity, so may attenuate lung damage from a variety of causes, and also suppresses some groups of lymphocytes so theoretically protecting the lungs from auto-immune damage. In-vitro studies have shown that SP-A or SP-D can bind to a wide range of pulmonary pathogens including viruses, bacteria, fungi, Pneumocystis carinii, and Mycobacterium tuberculosis. Acting via specific surface receptors, both SP-A and SP-D activate alveolar neutrophils and macrophages, and enhance the phagocytic actions of the latter during lung inflammation.9
Alternative Models to Explain Lung Recoil
Treating surfactant-lined alveoli as bubbles that obey Laplace’s law has aided the understanding of lung recoil in health and disease for many decades (page 243). This ‘bubble model’ of alveolar stability is not universally accepted,10,11 and evidence is mounting that the real situation is more complex. Arguments against the bubble model include:
 in theory, differing surface tensions in adjacent alveoli cannot occur if the liquid lining the alveoli is connected by a continuous liquid layer when surfactant layers are compressed at 37°C multilayered ‘rafts’ of dry surfactant form, though inclusion of surfactant proteins reduces this physico-chemical change alveoli are not shaped like perfect spheres with a single entrance point – they are variable polyhedrons with convex bulges in their walls where pulmonary capillaries bulge into them (Figure 2.7).
Two quite different alternative models have been proposed:
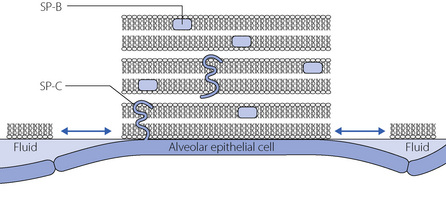
Fig. 3.2 Morphological model of alveolar surfactant. Multilayered, less wettable, ‘rafts’ of surfactant are interspersed with fluid pools. Surfactant proteins lie within (SP-B) or across (SP-C) the lipid bilayers, facilitating the formation and dispersion of the rafts with each breath to modify the surface forces within the alveolus.
(Reproduced with permission from Webster NR, Galley HF. Anaesthesia Science. Oxford: Blackwell Publishing, 2006.)
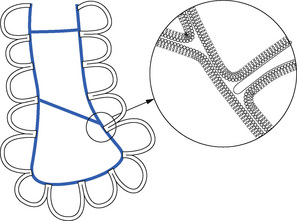
Fig. 3.3 Scarpelli’s ‘foam’ model of alveolar structure.14 Surfactant (blue) lines the alveoli, and forms films that span both the alveolar openings and the alveolar ducts. Inset: detail of the surfactant layer showing connection between phospholipid monolayer and bilayer (not to scale).
More research is clearly needed to either confirm or refute these models. It would therefore be premature to consign the well-established bubble model of alveolar recoil to the history books, but physiologists should be aware that cracks have begun to appear in a longstanding physiological concept.
The Transmural Pressure Gradient and Intrathoracic Pressure
The transmural pressure gradient is the difference between intrathoracic (or ‘intrapleural’) and alveolar pressure. The pressure within an alveolus is always greater than the pressure to the surrounding interstitial tissue except when the volume has been reduced to zero. With increasing lung volume, the transmural pressure gradient steadily increases as shown for the whole lung in Figure 3.4. If an appreciable pneumothorax is present, the pressure gradient from alveolus to pleural cavity provides a measure of the overall transmural pressure gradient. Otherwise, the oesophageal pressure may be used to indicate the pleural pressure, but there are conceptual and technical difficulties. The technical difficulties are considered at the end of this chapter while some of the conceptual difficulties are indicated in Figure 3.5.
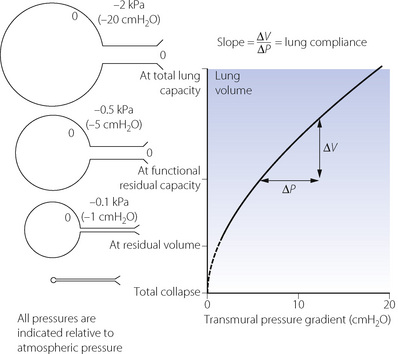
Fig. 3.4 Relationship between lung volume and the difference in pressure between the alveoli and the intrathoracic space (transmural pressure gradient). The relationship is almost linear over the normal tidal volume range. The calibre of small air passages decreases in parallel with alveolar volume. Airways begin to close at the closing capacity and there is widespread airway closure at residual volume. Values in the diagram relate to the upright position and to decreasing pressure. The opening pressure of a closed alveolus is not shown.
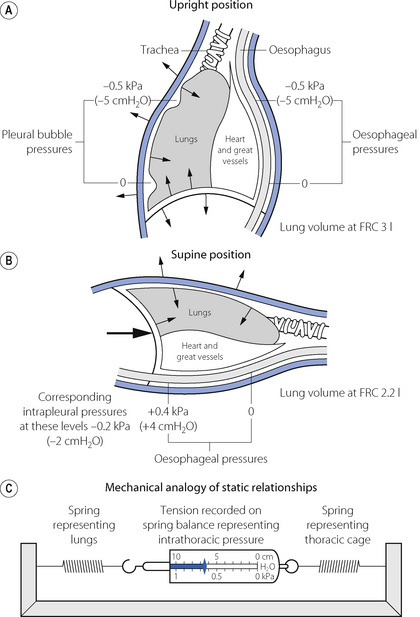
Fig. 3.5 Intrathoracic pressures: static relationships in the resting end-expiratory position. The lung volume corresponds to the functional residual capacity (FRC). The figures in (A) and (B) indicate the pressure relative to ambient (atmospheric). The arrows show the direction of elastic forces. The heavy arrow in (B) indicates displacement by the abdominal viscera. In (C) the tension in the two springs is the same and will be indicated on the spring balance. In the supine position: (1) the FRC is reduced; (2) the intrathoracic pressure is raised; (3) the weight of the heart raises the oesophageal pressure above the intrapleural pressure.
The alveoli in the upper part of the lung have a larger volume than those in the dependent part except at total lung capacity. The greater degree of expansion of the alveoli in the upper part results in a greater transmural pressure gradient, which decreases steadily down the lung at about 0.1 kPa (or 1 cmH2O) per 3 cm of vertical height; such a difference is indicated in Figure 3.5A. Since the pleural cavity is normally empty, it is not strictly correct to speak of an intrapleural pressure and, furthermore, it would not be constant throughout the pleural ‘cavity’. One should think rather of the relationship shown in Figure 3.4 as applying to various horizontal strata of the lung, each with its own volume and therefore its own transmural pressure gradient on which its own ‘intrapleural’ pressure would depend. The transmural pressure gradient has an important influence on many aspects of pulmonary function and so its horizontal stratification confers a regional difference on many features of pulmonary function, including airway closure, ventilation/perfusion ratios, and therefore gas exchange. These matters are considered in detail in the appropriate chapters of this book.
At first sight it might be thought that the subatmospheric intrapleural pressure would result in the accumulation of gas evolved from solution in blood and tissues. In fact the total of the partial pressures of gases dissolved in blood, and therefore tissues, is always less than one atmosphere (see Table 26.2), and this factor keeps the pleural cavity free of gas.
Time Dependence of Pulmonary Elastic Behaviour
If an excised lung is rapidly inflated and then held at the new volume, the inflation pressure falls exponentially from its initial value to reach a lower level that is attained after a few seconds. This also occurs in the intact subject, and is readily observed during an inspiratory pause in a patient receiving artificial ventilation (page 39). It is broadly true to say that the volume change divided by the initial change in transmural pressure gradient corresponds to the dynamic compliance while the volume change divided by the ultimate change in transmural pressure gradient (i.e. measured after it has become steady) corresponds to the static compliance. Static compliance will thus be greater than the dynamic compliance by an amount determined by the degree of time dependence in the elastic behaviour of a particular lung. The respiratory frequency has been shown to influence dynamic pulmonary compliance in the normal subject but frequency dependence is much more pronounced in the presence of pulmonary disease.
Hysteresis. If the lungs are slowly inflated and then slowly deflated, the pressure/volume curve for static points during inflation differs from that obtained during deflation. The two curves form a loop, which becomes progressively broader as the tidal volume is increased (Figure 3.6). Expressed in words, the loop in Figure 3.6 means that rather more than the expected pressure is required during inflation and rather less than the expected recoil pressure is available during deflation. This resembles the behaviour of perished rubber or poly-vinyl chloride, both of which are reluctant to accept deformation under stress but, once deformed, are again reluctant to assume their original shape. This phenomenon is present to a greater or lesser extent in all elastic bodies and is known as elastic hysteresis.
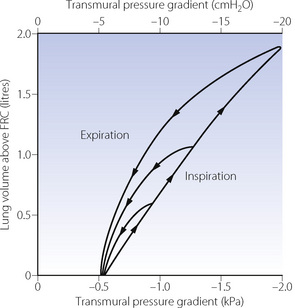
Fig. 3.6 Static plot of lung volume against transmural pressure gradient (intra-oesophageal pressure relative to atmospheric at zero air flow). Note that inspiratory and expiratory curves form a loop that gets wider the greater the tidal volume. These loops are typical of elastic hysteresis. For a particular lung volume, the elastic recoil of the lung during expiration is always less than the distending transmural pressure gradient required during inspiration at the same lung volume.
Causes of Time Dependence of Pulmonary Elastic Behaviour
There are many possible explanations of the time dependence of pulmonary elastic behaviour, the relative importance of which may vary in different circumstances.
Changes in surfactant activity. It has been explained above that the surface tension of the alveolar lining fluid is greater at larger lung volume and also during inspiration than at the same lung volume during expiration (Figure 3.1B). This is probably the most important cause of the observed hysteresis in the intact lung (Figure 3.6).
Stress relaxation. If a spring is pulled out to a fixed increase in its length, the resultant tension is maximal at first and then declines exponentially to a constant value. This is an inherent property of elastic bodies, known as stress relaxation. Thoracic tissues display stress relaxation and these ‘visco-elastic’ properties contribute significantly to the difference between static and dynamic compliance as well as forming a component of pulmonary resistance (page 46). The crinkled structure of collagen in the lung is likely to favour stress relaxation and excised strips of human lung show stress relaxation when stretched.
Redistribution of gas. In a lung consisting of functional units with identical time constants* of inflation, the distribution of gas should be independent of the rate of inflation, and there should be no redistribution when the lungs are held inflated. However, if different parts of the lungs have different time constants, the distribution of inspired gas will be dependent on the rate of inflation and redistribution (‘pendelluft’) will occur when inflation is held. This problem is discussed in greater detail on page 121 but for the time being we can distinguish ‘fast’ and ‘slow’ alveoli (the term ‘alveoli’ here referring to functional units rather than the anatomical entity). The ‘fast’ alveolus has a low airway resistance and/or low compliance (or both) while the ‘slow’ alveolus has a high airway resistance and/or a high compliance (Figure 3.7B). These properties give the fast alveolus a shorter time constant and are preferentially filled during a short inflation. This preferential filling of alveoli with low compliance gives an overall higher pulmonary transmural pressure gradient. A slow or sustained inflation permits increased distribution of gas to slow alveoli and so tends to distribute gas in accord with the compliance of the different functional units. There should then be a lower overall transmural pressure and no redistribution of gas when inflation is held. The extreme difference between fast and slow alveoli shown in Figure 3.7B applies to diseased lungs and no such differences exist in normal lungs. Gas redistribution is therefore unlikely to be a major factor in healthy subjects, but it can be important in patients with airways disease.
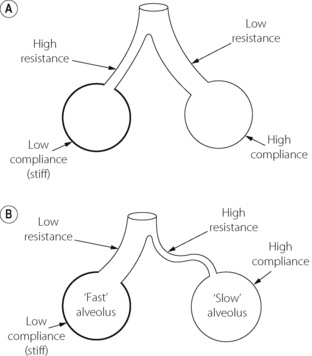
Fig. 3.7 Schematic diagrams of alveoli to illustrate conditions under which static and dynamic compliance may differ. (A) Represents a theoretically ideal state in which there is a reciprocal relationship between resistance and compliance resulting in gas flow being preferentially delivered to the most compliant regions, regardless of the state of inflation. Static and dynamic compliance are equal. This situation is probably never realised even in the normal subject. (B) Illustrates a state that is typical of many patients with respiratory disease. The alveoli can conveniently be divided into ‘fast’ and ‘slow’ groups. The direct relationship between compliance and resistance results in inspired gas being preferentially delivered to the stiff alveoli if the rate of inflation is rapid. An end-inspiratory pause then permits redistribution from the fast alveoli to the slow alveoli.
Recruitment of alveoli. Below a certain lung volume, some alveoli tend to close and only reopen at a considerably greater lung volume and in response to a much higher transmural pressure gradient than that at which they closed. Recruitment of closed alveoli appears at first sight to be a plausible explanation of all the time-dependent phenomena described above, but there are two reasons why this is unlikely. First, the pressure required for reopening a closed unit is very high and is unlikely to be achieved during normal breathing. Secondly, there is no histological evidence for collapsed alveoli in normal lungs at functional residual capacity. In the presence of pathological lung collapse, a sustained deep inflation may well cause re-expansion and an increased compliance, e.g. during anaesthesia (page 336). Cyclical opening and closing of alveoli during a normal respiratory cycle is unlikely in normal lungs but does occur in injured lungs (page 482).
Factors Affecting Lung Compliance
Lung volume. It is important to remember that compliance is related to lung volume. This factor may be excluded by relating compliance to FRC to yield the specific compliance (i.e. compliance/FRC), which in humans is almost constant for both sexes and all ages down to neonatal. The relationship between compliance and lung volume is true not only within an individual lung but also between species. Larger animal species have thicker alveolar septae containing increased amounts of collagen and elastin resulting in larger alveolar diameters,16 so reducing the pressure needed to expand them. An elephant therefore has larger alveoli and so a higher compliance than a mouse.
Posture. Lung volume, and therefore compliance, changes with posture (page 37). There are however problems in the measurement of intrapleural pressure in the supine position and when this is taken into account it seems unlikely that changes of posture have any significant effect on the specific compliance.
Pulmonary blood volume. The pulmonary blood vessels probably make an appreciable contribution to the stiffness of the lung. Pulmonary venous congestion from whatever cause is associated with reduced compliance.
Age. One would have expected age to influence the elasticity of the lung as of other tissues in the body. However, no correlation has ever been found between age and compliance, even after allowing for predicted changes in lung volume. This accords with the concept of lung ‘elasticity’ being largely determined by surface forces.
Bronchial smooth muscle tone. Animal studies17 have shown that an infusion of methacholine sufficient to result in a doubling of airway resistance decreases dynamic compliance by 50%. The airways might contribute to overall compliance or, alternatively, bronchoconstriction could enhance time-dependence and so reduce dynamic, but perhaps not static compliance (Figure 3.7).
Disease. Important changes in lung pressure/volume relationships are found in some lung diseases, and these are described in the relevant chapters in Part 3.
Elastic Recoil of the Thoracic Cage
The thoracic cage comprises the ribcage and the diaphragm. Each is a muscular structure and can be considered as an elastic structure only when the muscles are relaxed, and that is not easy to achieve except under the conditions of paralysis. Relaxation curves have been prepared relating pressure and volumes in the supposedly relaxed subject, but it is now doubted whether total relaxation was ever achieved. For example, in the supine position the diaphragm is not fully relaxed at the end of expiration but maintains a resting tone to prevent the abdominal contents pushing the diaphragm cephalad.
Compliance of the thoracic cage is defined as change in lung volume per unit change in the pressure gradient between atmosphere and the intra-pleural space. The units are the same as for pulmonary compliance. The measurement is seldom made but the value is of the order of 2 l.kPa−1 (200 ml.cmH2O−1).
Factors Influencing Compliance of the Thoracic Cage
Anatomical factors include the ribs and the state of ossification of the costal cartilages. Obesity and even pathological skin conditions may have an appreciable effect. In particular, scarring of the skin overlying the front of the chest may result from scalding in children and this may embarrass the breathing.
In terms of compliance, a relaxed diaphragm simply transmits pressure from the abdomen that may be increased in obesity and abdominal distension. Posture clearly has a major effect and this is considered below in relation to FRC. Compared with the supine position, thoracic cage compliance is 30% greater in the seated subject and the total static compliance of the respiratory system is reduced by 60% in the prone position due to the diminished elasticity of the ribcage and diaphragm when prone.
Pressure/Volume Relationships of the Lung Plus Thoracic Cage
Compliance is analogous to electrical capacitance, and in the respiratory system the compliances of lungs and thoracic cage are in series. Therefore the total compliance of the system obeys the same relationship as for capacitances in series, in which reciprocals are added to obtain the reciprocal of the total value, thus:
typical static values (l.kPa−1) for the supine paralysed patient being:

Instead of compliance, we may consider its reciprocal, elastance. The relationship is then much simpler:
corresponding values (kPa.l−1) are then:

Relationship between Alveolar, Intrathoracic and Ambient Pressures
At all times the alveolar/ambient pressure gradient is the sum of the alveolar/intrathoracic (or transmural) and intrathoracic/ambient pressure gradients. This relationship is independent of whether the patient is breathing spontaneously or being ventilated by intermittent positive pressure. Actual values depend on compliances, lung volume and posture and typical values are shown for the upright conscious relaxed subject in Figure 3.8. The values in the illustration are static and relate to conditions when no gas is flowing.
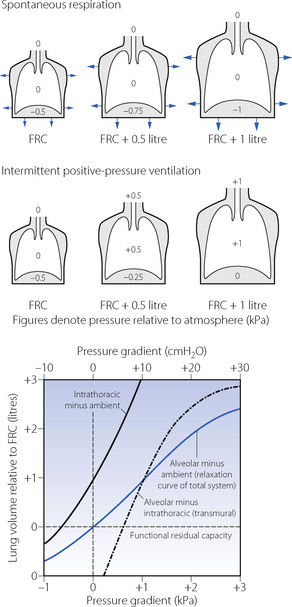
Fig. 3.8 Static pressure/volume relations for the intact thorax for the conscious subject in the upright position. The transmural pressure gradient bears the same relationship to lung volume during both intermittent positive pressure ventilation and spontaneous breathing. The intrathoracic-to-ambient pressure difference, however, differs in the two types of ventilation due to muscle action during spontaneous respiration. At all times: alveolar/ambient pressure difference = alveolar/intrathoracic pressure difference + intrathoracic/ambient pressure difference (due attention being paid to the sign of the pressure difference).
Lung Volumes
Certain lung volumes, particularly the FRC, are determined by elastic forces. This is therefore a convenient point at which to consider the various lung volumes and their subdivision (Figure 3.9).
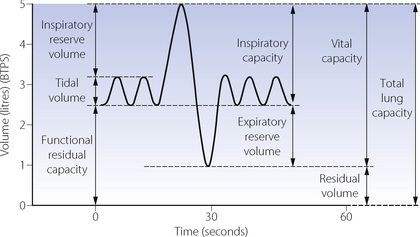
Fig. 3.9 Static lung volumes of Dr Nunn in 1990. The ‘spirometer curve’ indicates the lung volumes that can be measured by simple spirometry. These are tidal volume, inspiratory reserve volume, inspiratory capacity, expiratory reserve volume and vital capacity. The residual volume, total lung capacity and functional residual capacity cannot be measured by observation of a spirometer without further elaboration of methods. BTPS, body temperature and pressure, saturated.
Total lung capacity (TLC). This is the volume of gas in the lungs at the end of a maximal inspiration. TLC is achieved when the maximal force generated by the inspiratory muscles is balanced by the forces opposing expansion. It is rather surprising that expiratory muscles are also contracting strongly at the end of a maximal inspiration.
Residual volume (RV). This is the volume remaining after a maximal expiration. In the young, RV is governed by the balance between the maximal force generated by expiratory muscles and the elastic forces opposing reduction of lung volume. However, in older subjects closure of small airways may prevent further expiration.
Functional residual capacity. This is the lung volume at the end of a normal expiration.
Within the framework of TLC, RV and FRC, the other capacities and volumes shown in Figure 3.9 are self-explanatory.
Factors Affecting the FRC
So many factors affect the FRC that they require a special section of this chapter. The actual volume of the FRC has particular importance because of its relationship to the closing capacity (see below).
Sex. For the same body height, females have an FRC about 10% less than males.
Age. FRC increases slightly with age, increasing by around 16 ml per year.
Body size. FRC is linearly related to height. Obesity causes a marked reduction in FRC compared with lean subjects of the same height.
Taking these factors into account equations can be used to calculate a normal value for FRC in any individual, for example in white male adults aged between 25–65 years:18
Where FRC is in litres, height in meters, age in years, and BMI (body mass index) in kg.m−2.
Diaphragmatic muscle tone. FRC has in the past been considered to be simply the volume at which there is a balance between the elastic forces represented by the inward retraction of the lungs and the outward expansion of the thoracic cage. However, as explained above, it now appears that residual end-expiratory muscle tone is a major factor in the supine position, maintaining the FRC about 400 ml above the volume in the totally relaxed subject, which in practice means paralysed during anaesthesia.
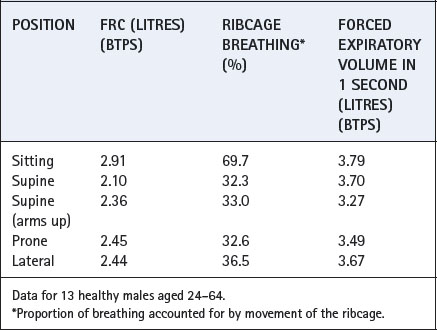
Posture. Figures 3.5 and 3.10 show the reduction in FRC in the supine position, which may be attributed to the increased pressure of the abdominal contents on the diaphragm. Values of FRC in these figures and Table 3.1 are typical for a subject of 1.68–1.70 m height, and reported mean differences between supine and upright positions range from 500 to 1000 ml. Values for FRC in other positions are shown in Table 3.1.
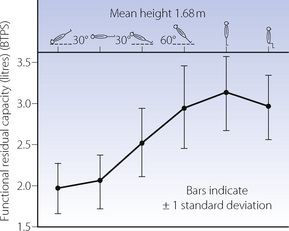
Fig. 3.10 Studies by Dr Nunn and his co-workers of the functional residual capacity in various body positions.
Table 3.1 Effect of posture on some aspects of respiratory function19
Lung disease. The FRC will be reduced by increased elastic recoil of the lungs, thoracic cage or both. Possible causes include lung fibrosis, pleural thickening, kyphoscoliosis, obesity and scarring of the thorax following burns. Conversely, elastic recoil of the lungs is diminished in emphysema and asthma and the FRC is usually increased (Chapter 28). This is beneficial since airway resistance decreases as the lung volume increases.
FRC in Relation to Closing Capacity
In Chapter 4 it is explained how reduction in lung volume below a certain level results in airway closure with relative or total underventilation in the dependent parts of the lung. The lung volume below which this effect becomes apparent is known as the closing capacity (CC). With increasing age, CC rises until it equals FRC at around 70–75 years in the upright position but only 44 in the supine position (Figure 3.11). This is a major factor in the decrease of arterial Po2 with age (page 194).
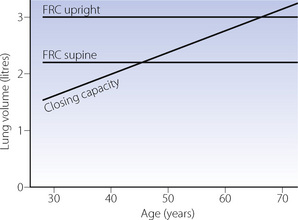
Fig. 3.11 Functional residual capacity and closing capacity as a function of age.
(Data from reference 20.)
Principles of Measurement of Compliance
Compliance is measured as the change in lung volume divided by the corresponding change in the appropriate pressure gradient, there being no gas flow when the two measurements are made. For lung compliance the appropriate pressure gradient is alveolar/intrapleural (or intrathoracic) and for the total compliance alveolar/ambient. Measurement of compliance of the thoracic cage is seldom undertaken but the appropriate pressure gradient would then be intrapleural/ambient, measured when the respiratory muscles are totally relaxed.
Volume may be measured with a spirometer, a body plethysmograph or by integration of a flow rate obtained from a pneumotachogram. Points of zero air flow are best indicated by a pneumotachogram. Static pressures can be measured with a simple water manometer but electrical transducers are now more usual. Intrathoracic pressure is normally measured as oesophageal pressure which, in the upright subject, is different at different levels. The pressure rises as the balloon descends, the change being roughly in accord with the specific gravity of the lung (0.3 g.ml−1). It is convention to measure the pressure 32–35 cm beyond the nares, the highest point at which the measurement is free from artefacts due to mouth pressure and tracheal and neck movements. Alveolar pressure equals mouth pressure when no gas is flowing: it cannot be measured directly.
Static compliance. In the conscious subject, a known volume of air is inhaled from FRC and the subject then relaxes against a closed airway. The various pressure gradients are then measured and compared with the resting values at FRC. It is, in fact, very difficult to ensure that the respiratory muscles are relaxed, but the measurement of lung compliance is valid since the static alveolar/intrathoracic pressure difference is unaffected by any muscle activity.
In the paralysed subject there are no difficulties about muscular relaxation and it is very easy to measure static compliance of the whole respiratory system simply using recordings of airway pressure and respiratory volumes. However, due to the uncertainties about interpretation of the oesophageal pressure in the supine position (Figure 3.5), there is usually some uncertainty about the pulmonary compliance. For static compliance it is therefore easier to measure lung compliance in the upright position, and total compliance in the anaesthetised paralysed patient who will usually be in the supine position.
Dynamic compliance. These measurements are made during rhythmic breathing, but compliance is calculated from pressure and volume measurements made when no gas is flowing, usually at end-inspiratory and end-expiratory ‘no-flow’ points. The usual method involves creation of a pressure–volume loop by displaying simultaneously as x and y coordinates the required pressure gradient and the respired volume. In the resultant loop, as in Figure 3.12A, the ‘no-flow’ points are where the trace is horizontal and the dynamic compliance is the slope of the line joining these points.
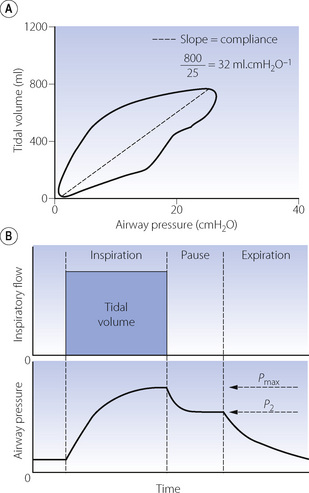
Fig. 3.12 Automated measurement of compliance during intermittent positive pressure ventilation. (A) Dynamic compliance. Simultaneous measurement of tidal volume and airway pressure creates a pressure/volume loop. End-expiratory and end-inspiratory ‘no-flow’ points occur when the trace is horizontal. At this point, airway pressure and alveolar pressure are equal, so the pressure gradient is the difference between alveolar and atmospheric pressure. Total respiratory system compliance is therefore the slope of the line between these points. Note that in this patient compliance is markedly reduced. (B) Static compliance. Following an end-inspiratory pause the plateau pressure is recorded (P2) and along with tidal volume the static compliance easily derived. This manoeuvre also provides an assessment of respiratory system resistance by recording the pressure drop (Pmax − P2) and the inspiratory flow immediately before the inspiratory pause (see page 57).
Automated Measurement of Compliance
In a spontaneously breathing awake patient lung compliance measurement is difficult because of the requirement to place an oesophageal balloon. However, in anaesthetised patients or those patients receiving intermittent positive pressure ventilation (IPPV) in intensive care the measurement of compliance is considerably easier. Many ventilators and anaesthetic monitoring systems now routinely measure airway pressure and tidal volume. This enables a pressure volume loop to be displayed (Figure 3.12A), from which the dynamic compliance of the respiratory system may be calculated on a continuous breath-by-breath basis. When no gas is flowing during IPPV (at the end of inspiration and expiration) the airway pressure equals alveolar pressure. At this point, the airway pressure recorded by the ventilator therefore equals the difference between alveolar and atmospheric pressure, allowing derivation of the total compliance.
Some ventilators will also measure static compliance. The ventilator will inflate the lung with the patient’s usual tidal volume and then pause at end-inspiration for between 0.5 and 2 seconds, until the airway pressure falls to a plateau lasting 300 msec (Figure 3.12B). Static compliance is then calculated from the volume delivered and pressure recorded during the plateau and may be easily compared with dynamic compliance.
Principles of Measurement of Lung Volumes
Vital capacity, tidal volume, inspiratory reserve and expiratory reserve can all be measured with a simple spirometer (see Figure 3.9). Total lung capacity, FRC and RV all contain a fraction (the RV) that cannot be measured by simple spirometry. However, if one of these volumes is measured (most commonly the FRC), the others may easily be derived.
Measurement of FRC21
Three techniques are available. The first employs nitrogen wash-out by breathing 100% oxygen. Total quantity of nitrogen eliminated is measured as the product of the expired volume collected and the concentration of nitrogen. If, for example, 4 l of nitrogen are collected and the initial alveolar nitrogen concentration was 80%, then the initial lung volume was 5 l.
The second method uses the wash-in of a tracer gas such as helium. If, for example, 50 ml of helium are introduced into the lungs and the helium concentration is then found to be 1%, the lung volume is 5 l. Helium is used for this method because of its low solubility in blood. For the technique to be accurate the measurement must be made rapidly or helium dissolving in the tissues and blood will introduce errors.
The third method uses the body plethysmograph. The subject is totally contained within a gas-tight box and he attempts to breathe against an occluded airway. Changes in alveolar pressure are recorded at the mouth and compared with the small changes in lung volume, derived from pressure changes within the plethysmograph. Application of Boyle’s law then permits calculation of lung volume.
The last method is the only technique for FRC measurement that includes gas trapped within the lung distal to closed airways.
References
1. Brown ES, Johnson RP, Clements JA. Pulmonary surface tension. J Appl Physiol. 1959;14:717-720.
2. Hamm H, Kroegel C, Hohlfeld J. Surfactant: a review of its functions and relevance in adult respiratory disorders. Respir Med. 1996;90:251-270.
*3. Whitsett JA, Weaver TE. Hydrophobic surfactant proteins in lung function and disease. N Engl J Med. 2002;347:2141-2148.
*4. Weaver TE, Conkright JJ. Functions of surfactant proteins B and C. Annu Rev Physiol. 2001;63:555-578.
5. Whitsett J. Hereditary disorders of surfactant homeostasis cause acute and chronic lung disease in infancy. Thorax. 2008;63:295-296.
6. Hawgood S, Poulain FR. The pulmonary collectins and surfactant metabolism. Annu Rev Physiol. 2001;63:495-519.
*7. Zuo YY, Possmayer F. How does pulmonary surfactant reduce surface tension to very low values? J Appl Physiol. 2007;102:1733-1734.
8. Jain D, Atochina-Vasserman EN, Tomer Y, Kadire H, Beers MF. Surfactant protein D protects against acute hyperoxic lung injury. Am J Respir Crit Care Med. 2008;178:805-813.
9. Janssen WJ, McPhillips KA, Dickinson MG, et al. Surfactant proteins A and D suppress alveolar macrophage phagocytosis via interaction with SIRPa. Am J Respir Crit Care Med. 2008;178:158-167.
10. Dorrington KL, Young JD. Development of the concept of a liquid pulmonary alveolar lining layer. Br J Anaesth. 2001;86:614-617.
*11. Scarpelli EM, Hills BA. Opposing views on the alveolar surface, alveolar models, and the role of surfactant. J Appl Physiol. 2000;89:408-412.
12. Hills BA. What forces keep the airspaces of the lung dry? Thorax. 1982;37:713-717.
13. Hills BA. An alternative view of the role(s) of surfactant and the alveolar model. J Appl Physiol. 1999;87:1567-1583.
14. Scarpelli EM. The alveolar surface network: A new anatomy and its physiological significance. Anat Rec. 1998;251:491-527.
15. Pal SK, Lechuga J, Drikakis D. On the controversy of the alveolar structure: a molecular dynamics study. Br J Anaes. 2008;100:578P.
16. Mercer RE, Russell ML, Crapo JD. Alveolar septal structure in different species. J Appl Physiol. 1994;77:1060-1066.
17. Mitzner W, Blosser S, Yager D, Wagner E. Effect of bronchial smooth muscle contraction on lung compliance. J Appl Physiol. 1992;72:158-167.
18. Cotes JE, Chinn DJ, Miller MR. Lung function. Physiology, measurement and application in medicine. Oxford: Blackwell Publishing; 2006.
19. Lumb AB, Nunn JF. Respiratory function and ribcage contribution to ventilation in body positions commonly used during anesthesia. Anesth Analg. 1991;73:422-426.
20. Leblanc P, Ruff F, Milic-Emili J. Effects of age and body position on ‘airway closure’ in man. J Appl Physiol. 1970;28:448-453.
21. Wanger J, Clausen JL, Coates A, et al. Standardisation of the measurement of lung volumes. Eur Respir J. 2005;26:511-522.