Chapter 22 Anaesthesia
 All anaesthetic drugs reduce ventilation and impair the ventilatory response to both hypercapnia and hypoxia. Upper airway muscle function is inhibited by anaesthesia leading to airway obstruction, usually at the level of the soft palate. Functional residual capacity is reduced within a few minutes of induction of anaesthesia as a result of altered respiratory muscle activity causing changes to the shape and volume of the thoracic cavity.
Only 12 years after the first successful public demonstration of general anaesthesia in 1846, John Snow reported the pronounced changes that occur in respiration during the inhalation of chloroform.1 Subsequent observations have confirmed that anaesthesia has profound effects on the respiratory system. However, these effects are diverse and highly specific, some aspects of respiratory function being profoundly modified while others are scarcely affected at all.
Control of Breathing2
Unstimulated Ventilation
It is well known that anaesthesia diminishes pulmonary ventilation, and hypercapnia is commonplace if spontaneous breathing is preserved. Reduced minute volume is due partly to a reduction in metabolic demand but mainly to interference with the chemical control of breathing, in particular a reduced sensitivity to CO2 as described below. In an uncomplicated anaesthetic there should not be sufficient resistance to breathing to affect the minute volume. However, the minute volume may be greatly decreased if there is respiratory obstruction.
At lower concentrations of inhaled anaesthetics, minute volume may remain unchanged, but smaller tidal volumes with higher respiratory frequency often occur resulting in reduced alveolar ventilation and an increase in Pco2. With higher concentrations of anaesthetic, breathing becomes slower and spontaneous minute volume may decrease to very low levels, particularly in the absence of surgical stimulation. This will inevitably result in hypercapnia, and end-expiratory Pco2 commonly rises to 10 kPa (75 mmHg). Clearly there is no limit to the rise that may occur if the anaesthetist is prepared to tolerate gross hypoventilation.
There are anaesthetists in many parts of the world who do not believe that temporary hypercapnia during anaesthesia is harmful to a healthy patient. Many hundreds of millions of patients must have been subjected to this transient physiological trespass since 1846 and there seems to be no convincing evidence of harm resulting from it – except perhaps increased surgical bleeding. In other parts of the world the departure from physiological normality is regarded with concern and it is usual either to assist spontaneous respiration by manual compression of the reservoir bag or, more commonly, to paralyse and ventilate artificially as a routine.
Quite different conditions apply during anaesthesia with artificial ventilation. The minute volume can then be set at any level that seems appropriate to the anaesthetist, and in the past there was a tendency to hyperventilate patients, resulting in hypocapnia. Now that monitoring of end-expiratory Pco2 is routine artificial ventilation can be adjusted to maintain the target Pco2 selected by the anaesthetist.
Effect on Pco2/Ventilation Response Curve
Progressive increases in the alveolar concentration of all inhalational anaesthetic agents decrease the slope of the Pco2/ventilation response curve and, at deep levels of anaesthesia, there may be no response at all to Pco2. Furthermore, the anaesthetised patient, as opposed to the awake subject, always becomes apnoeic if the Pco2 is reduced below this intercept, which is known as the apnoeic threshold Pco2 (page 70). In Figure 22.1, the flat curve rising to the left represents the starting points for various Pco2/ventilation response curves. Without added carbon dioxide in the inspired gas, deepening anaesthesia is associated with a decreasing ventilation and a rising Pco2, points moving progressively down and to the right. At intervals along this curve are shown Pco2/ventilation response curves resulting from adding carbon dioxide to the inspired gas.
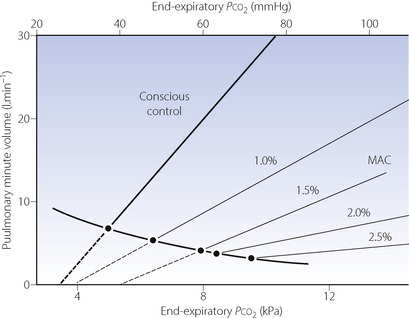
Fig. 22.1 Displacement of the Pco2/ventilation response curve with different end-expiratory concentrations of halothane. The curve sloping down to the right indicates the pathway of Pco2 and ventilation change resulting from depression without the challenge of exogenous carbon dioxide. The broken lines indicate extrapolation to apnoeic threshold Pco2. MAC; minimum alveolar concentration. The curves have been constructed from the data of reference 3.
At equivalent depth of anaesthesia, currently available inhaled anaesthetics depress the ventilatory response to Pco2 by a similar amount. This is conveniently shown by plotting the slope of the Pco2/ventilation response curve against equi-anaesthetic concentrations of different anaesthetics (Figure 22.2), shown as multiples of minimum alveolar concentration (MAC), although the validity of using MAC multiples in this way has been questioned. The currently used halogenated agents do not differ greatly from one another but diethyl ether is exceptional in having little effect up to 1 MAC. With low doses of inhaled anaesthetics (= 0.2 MAC) there is almost no depression of the hypercapnic ventilatory response,4 in contrast to the response to hypoxia described below.
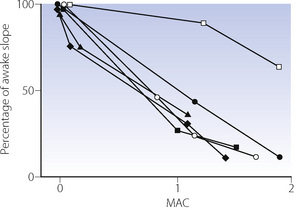
Fig. 22.2 Relative depression of the ventilatory response to CO2 by different inhalational anaesthetics as a function of minimum alveolar concentration (MAC).  , halothane;
  , enflurane; , isoflurane; ♦, sevoflurane;
  , desflurane;
  , diethylether.
(Data from references 5, 6 and 7.)
Surgical stimulation antagonises the effect of anaesthesia on the Pco2/ventilation response curve (Figure 22.3). It may easily be observed that in a spontaneously breathing patient a surgical incision increases the ventilation whatever the depth of anaesthesia. During prolonged anaesthesia without surgical stimulation, there is no progressive change in the response curve up to 3 hours. With the exception of ketamine, intravenous anaesthetics have similar effects on ventilation to the inhalational anaesthetics.
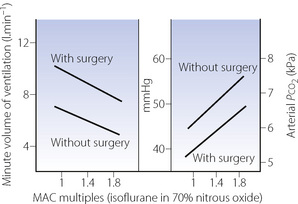
Fig. 22.3 Respiratory depression by isoflurane with and without surgery at different multiples of minimum alveolar concentration (MAC) required for anaesthesia.
(Data from reference 8.)
Effect on Po2/Ventilation Response Curve9,10
The normal relationship between Po2 and ventilation has been described on pages 71 et seq. It was long believed that this reflex was the ultima moriens and, unlike the Pco2/ventilation response curve, unaffected by anaesthesia. This doctrine was a source of comfort to many generations of anaesthetists in the past. Little attention was given to the observation of Gordh in 1945 that ether anaesthesia nearly abolished the ventilatory response to hypoxaemia while the response to carbon dioxide was still present.11
Over 30 years later, halothane anaesthesia was shown to reduce the acute hypoxic ventilatory response (AHVR) in humans.12 Shortly afterwards in 1978, Knill & Gelb13 showed that not only was the hypoxic response affected by inhalational anaesthetics but it was also, in fact, exquisitely sensitive (Figure 22.4). Hypoxic drive was markedly attenuated at 0.1 MAC, a level of anaesthesia that would not be reached for a considerable time during recovery from anaesthesia. Similar effects were found with all the currently used inhalational agents,9 and with the intravenous anaesthetic propofol.14
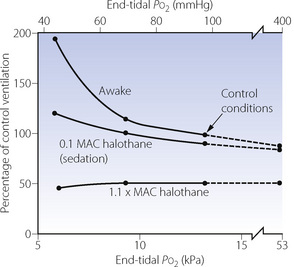
Fig. 22.4 Effect of halothane anaesthesia on the ventilatory response to hypoxia. The data shown in this figure have now been challenged; see text for details.
(After reference 13.)
These findings were widely accepted for some years, until a study by Temp et al15 in 1992 showed that AHVR was only diminished in hypercapnic conditions. This study initiated a great deal of further research. A summary of the findings of these and many other studies are shown in Figure 22.5. The most notable feature of these results is their diversity, with, for example, different studies of similar concentrations of isoflurane, particularly at sedative levels, resulting in completely opposite results. However, for the other agents there does seem to be a generally dose-dependent depression of the hypoxic ventilatory response, though at 0.1 MAC considerable variation remains. There are many possible explanations for these results, mostly relating to methodological differences between studies:
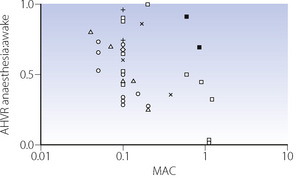
Fig. 22.5 Summary of studies of the acute hypoxic ventilatory response (AHVR) and inhalational anaesthesia or sedation. The ordinate is the ratio of the increase in minute volume with hypoxia during anaesthesia or sedation and the awake (control) response. Thus a ratio of unity represents no depression of the response and zero represents a completely abolished response. All studies were performed under isocapnic conditions except the two solid squares which used poikilocapnia. See text for details. [], halothane; [ ], enflurane; [], isoflurane; [
 ], sevoflurane; [×], nitrous oxide; [+], desflurane.
Anaesthetic agent. Differences between anaesthetic agents in their effects on AHVR are not obvious from Figure 22.5. However, a recent quantitative review of 37 studies did find differences, with the least depression of the response by low-dose sevoflurane, progressively increasing depression by isoflurane and enflurane, with halothane having the greatest effect.9
Subject stimulation. The degree of arousal of subjects is known to affect the AHVR. Studies of hypoxic response at ‘sedative’ levels of anaesthesia (0.2 MAC or less) have differed in the amount of stimulation provided, with some forcing the subjects to remain awake15 and others leaving subjects undisturbed. One study comparing awake and asleep subjects with 0.1 MAC isoflurane found no depression of the hypoxic response in the awake group.16 However, the same review described in the previous paragraph did find subject stimulation to be a significant factor in determining the degree of depression of AHVR, and that this effect may be influenced by the specific anaesthetic agent used.9
Hypoxic challenge. The rate of onset, degree and duration of hypoxia will all affect the ventilatory response, which is normally biphasic with hypoxic ventilatory decline (HVD) occurring a few minutes after the onset of hypoxia (see Figure 5.6). Some studies used rapid ‘step’ changes into hypoxic conditions,17 whilst others used a ‘ramp’ onset of hypoxia over 8–10 min.18 In the latter situation, the response under study will be a combination of AHVR and HVD.15 These differences do not seem to be of practical importance. One study addressing different patterns of hypoxic onset on AHVR found no difference between the two,19 and a recent review did not find the hypoxic stimulus to be a major factor.9 Hypoxic ventilatory decline seems to be uninfluenced by anaesthesia.15,20
Subject selection. The magnitude of the AHVR differs greatly between individuals (page 72). Some studies have been performed using only subjects found to have a ‘brisk’ ventilatory response to hypoxia,17 and these results cannot therefore be extrapolated to a broader range of patients.
Carbon dioxide concentration may be maintained at normal, pre-hypoxic, levels (isocapnia) or allowed to find its own level (poikilocapnia). This has a large effect in the awake subject, with the hypoxic response being greatly attenuated during poikilocapnia (see Figure 5.6). During anaesthesia with up to 0.85 MAC isoflurane, the hypoxic ventilatory response during poikilocapnia is essentially maintained;21 that is, the increase in ventilation with hypoxic challenge is the same when asleep as when awake. This has led to the suggestion that anaesthesia has less effect on the hypoxic ventilatory response itself, but may reduce the normally additive interaction between the ventilatory responses to hypoxia and hypercapnia (see Figure 5.7).15,21
It is generally agreed that the effect of anaesthetics on AHVR is on the peripheral chemoreceptors, possibly exclusively so at sedative levels.22 Anaesthesia also impairs the ventilatory response to doxapram, which acts on the peripheral chemo-receptors (page 78).13
Implications of the Depression of AHVR by Anaesthetic Agents
There are four important practical implications of the attenuation of AHVR by anaesthesia:
Recent uncertainty about the effect of subanaesthetic concentrations on AHVR has cast doubt on the validity of extrapolating the results of earlier studies to patients recovering from anaesthesia. The degree of stimulation of the patient is likely to affect their AHVR response, which will therefore be affected by many factors such as pain control and the amount of activity in their surroundings. A patient should behave like a poikilocapnic subject, and so depression of AHVR will be minimal.9,21 Finally, patients recovering from an anaesthetic will frequently be hypercapnic secondary to opioid administration, sometimes compounded by airway obstruction. Under these circumstances the ventilatory response to the combination of hypoxia and hypercapnia is almost certainly reduced to less than that seen when awake.
There is little doubt that more research is needed to understand the complex effects of anaesthesia on ventilatory responses.9,10,23 Though recent work may have cast some doubt on the earlier studies of Knill et al13 (Figure 22.4), there remains plenty of evidence that a sleeping patient in the recovery room is at risk of failing to mount a suitable ventilatory response to hypoxia.
Pattern of Contraction of Respiratory Muscles
One of the most remarkable examples of the specificity of anaesthetic actions is on the muscles associated with respiration. Many of these effects could hardly have been predicted but, nevertheless, have great clinical importance and underlie many of the secondary effects described later in this chapter.
The Pharynx
Anaesthesia usually causes obstruction of the pharyngeal airway unless measures are taken for its protection. Figure 22.6 shows changes in the sagittal geometry of the pharynx immediately after induction of anaesthesia with thiopentone in the supine position.24 The soft palate falls against the posterior pharyngeal wall, occluding the nasopharynx in almost every patient, presumably due to interference with the action of some or all of tensor palati, palatoglossus or palatopharyngeus (page 83). Similar findings are also reported using magnetic resonance imaging, when the mean anteroposterior diameter of the pharynx at the level of the soft palate decreased from 6.6 mm when awake to 2.7 mm during propofol anaesthesia.25 Radiographic studies have shown considerable posterior movement of tongue and epiglottis, but usually not sufficient to occlude the oral or hypopharyngeal airway (Figure 22.6). In animals, there is marked interference with genioglossus activity during anaesthesia,26 and human observations have shown that thiopentone decreases the electromyographic (EMG) activity of genioglossus and the strap muscles.27 Nevertheless, Nandi et al24 showed that the posterior movement of the palate was not caused by pressure from the tongue.
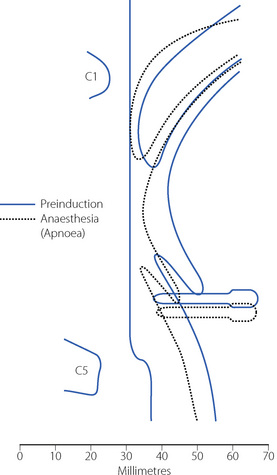
Fig. 22.6 Median sagittal section of the pharynx to show changes between the conscious state (continuous lines) and following induction of anaesthesia (broken lines). The most consistent change was occlusion of the nasopharynx.
(Reproduced from reference 24 by permission of the Editor of the British Journal of Anaesthesia and Oxford University Press.)
Secondary changes occur when the patient attempts to breathe. Upstream obstruction then often causes major passive downstream collapse of the entire pharynx (Figure 22.7), a mechanism with features in common with the sleep apnoea hypo-pnoea syndrome (page 271). This secondary collapse of the pharynx is due to interference with the normal action of pharyngeal dilator muscles, particularly genioglossus. The epiglottis may be involved in hypopharyngeal obstruction during anaesthesia,28 and posterior movement is clearly seen in Figures 22.6 and 22.7.
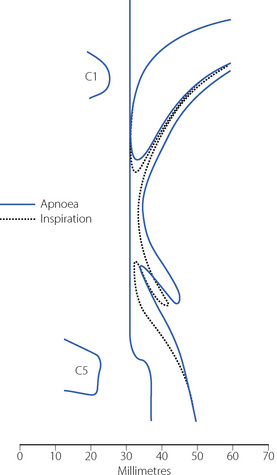
Fig. 22.7 Median sagittal section of the pharynx during anaesthesia to show changes between the apnoeic state (continuous lines, corresponding to the broken lines in Figure 22.6) and following attempted inspiration (broken lines). Upstream obstruction in the nasopharynx results in downstream collapse of the oro- and hypopharynx.
(Reproduced from reference 24 by permission of the Editor of the British Journal of Anaesthesia and Oxford University Press.)
Protection of the pharyngeal airway. Extension of the neck moves the origin of genioglossus anteriorly by 1–2 cm and usually clears the hypopharyngeal airway.29 Protrusion of the mandible, originally proposed by Heiberg in 1874,30 moves the origin of genioglossus still further forward. The use of a pharyngeal airway, such as that of Guedel, is frequently helpful, but the tip may become lodged in the valecula, or the tongue may be pushed downwards and backwards to obstruct the tip of the airway.31 Developed by Brain in 1983,32 the laryngeal mask airway provides an airtight seal around the laryngeal perimeter allowing spontaneous ventilation. Use of a laryngeal mask does not prevent regurgitated gastric contents gaining access to the larynx, and with high airway pressures inspired gas may pass into the oesophagus or stomach during intermittent positive pressure ventilation (IPPV). For the most reliable maintenance of airway patency a tracheal tube is used, which requires the use of either ‘deep’ anaesthesia or muscle relaxants.
The Inspiratory Muscles2
John Snow’s early observations of respiration during anaesthesia describe that a decrease in thoracic respiratory excursion may be used as a sign of deepening anaesthesia. The effect was first quantified by Miller in 192533 and more precisely related to depth of anaesthesia with halothane in 1979.34 Selective depression of some inspiratory ribcage muscles does occur. Electromyography of the para-sternal intercostal muscles in humans shows their activity to be consistently abolished by 1 MAC of anaesthesia, and absent in some subjects at just 0.2 MAC.35,36 Thiopentone decreases the EMG activity of sternothyroid, sternohyoid and the scalene muscles.27 In contrast, diaphragmatic function seems to be well preserved during anaesthesia, particularly phasic EMG activity during inspiration. This combination of changes in muscle activity commonly gives rise to paradoxical inspiratory movements whereby diaphragmatic contraction causes expansion of the lower ribcage and abdomen whilst the upper ribcage is drawn in due to the negative intrathoracic pressure and a lack of support from upper ribcage respiratory muscles. This pattern of breathing is seen commonly in children, who have a more compliant chest wall than adults, and in adults when respiratory resistance is increased causing a greater fall in intrathoracic pressure. Some studies have, however, found no reduction in ribcage movement with, for example, isoflurane at 1 MAC37 or ketamine.38 It is possible that changes in spinal curvature during anaesthesia have caused earlier studies of ribcage movement to overestimate the changes.35,39 Also, spontaneous ventilation via a tracheal tube is associated with greater airway resistance than other methods such as a laryngeal mask, which may contribute to less ribcage expansion during anaesthesia.40 Thus earlier descriptions of selective depression of ribcage movement should not be regarded as an invariable feature of anaesthesia with spontaneous ventilation, particularly at the depth of anaesthesia used clinically and with a low-resistance, unobstructed airway.
The resting position and dimensions of the ribcage and diaphragm during anaesthesia are described below.
The Expiratory Muscles41
General anaesthesia causes expiratory phasic activity of the abdominal muscles, which are normally silent in the conscious supine subject. Anaesthetic agents, opioids and hypercapnia are all involved in stimulating the expiratory muscle activity. This activity begins in some subjects at only 0.2 MAC of halothane,35 and is very difficult to abolish as long as spontaneous breathing continues.42 Activation of expiratory muscles seems to serve no useful purpose and does not appear to have any significant effect on the change in functional residual capacity.43
Respiratory muscle co-ordination often becomes disturbed during anaesthesia with spontaneous ventilation.37,40 Paradoxical movements between the upper and lower chest wall, and the chest and abdominal muscles, are accompanied by changes in respiratory timing between inspiratory and expiratory muscle groups. These are believed to originate in selective effects of anaesthesia on different respiratory neuronal groups in the central pattern generator,36 and are more marked when airway resistance is higher.40 The most usual pattern seen is a phase delay between abdominal and ribcage movement as illustrated in Figure 22.8.
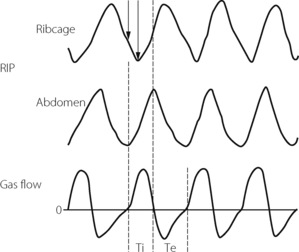
Fig. 22.8 Respiratory inductance plethysmography (RIP) tracings of ribcage and abdominal movements during 1.5 MAC halothane anaesthesia, and the accompanying respiratory gas flows. Note the phase delay between abdominal and ribcage movements, indicated by solid arrows, which in the example shown is approximately 30% of the inspiratory time. Ti, inspiratory time; Te, expiratory time.
(After reference 44 with permission of the authors and the publishers of Anesthesiology.)
Change in Functional Residual Capacity
Bergman in 1963 was the first to report a decrease of functional residual capacity (FRC) during anaesthesia.45 The reduction in FRC is now known to have the following characteristics:43,46,47
FRC is reduced during anaesthesia with all anaesthetic drugs that have been investigated, by a mean value of about 16–20% of the awake FRC in the supine position. However, there is considerable individual variation and changes range from about +19% to −50%. FRC is reduced immediately on induction of anaesthesia, reaches its final value within the first few minutes, and does not seem to fall progressively throughout anaesthesia. It does not return to normal until some hours after the end of anaesthesia.The Cause of the Reduction in FRC48
There is general agreement that three factors may contribute to the reduced FRC, as follows.
Chest shape. Earlier studies that measured anteroposterior and lateral diameters, or the circumference, of the external chest wall gave conflicting results regarding changes in internal chest volume with anaesthesia. However, the introduction of fast computed tomography (CT) scanners led to the conclusion that there is a reduction in the cross-sectional area of the rib cage corresponding to a decrease in lung volume of about 200 ml.49,50 A dynamic spatial reconstructor (DSR) technique allows scans of half the chest to be obtained in just 0.3 s, following which a three-dimensional picture of all chest structures can be generated and analysed.35 This has confirmed that changes in chest wall shape account for a reduction in FRC of about 200 ml. There is less agreement about why the chest wall changes shape, possible explanations including the changes in respiratory muscle activity already described, diaphragmatic position and activity, or spinal curvature.
Diaphragm position. In the conscious subject in the supine position there is evidence of residual end-expiratory tone in the diaphragm,51 which prevents the weight of the viscera pushing the diaphragm too far into the chest in the supine position. This diaphragmatic end-expiratory tone may be lost during anaesthesia. Such a change would result in the diaphragm moving cephalad during anaesthesia, which was reported in early studies.50,52 However, other investigators found no consistent cephalad movement of the diaphragm during anaesthesia. Studies using DSR and fast computed tomography have provided good evidence that diaphragm shape alters during anaesthesia.48,53 Although there is a large variation between subjects, these studies have consistently shown a cephalad movement of the dependent regions of the diaphragm, with little or no movement of the non-dependent regions.35 One study found a significantly greater cephalad shift of the diaphragm in patients who were paralysed,53 though this had not been observed in earlier studies. The change in FRC that can be ascribed to changes in diaphragm shape is on average less than 30 ml.35 A summary of the changes in chest wall and diaphragm positions during anaesthesia is shown in Figure 22.9.
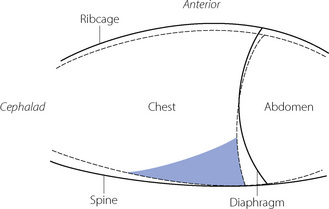
Fig. 22.9 Schematic diagram showing a mid-sagittal section of the chest wall and diaphragm awake (solid line) and during anaesthesia (dashed line). Note the reduction in rib cage volume, increased spinal curvature and change in diaphragmatic position. The shaded area shows where atelectasis usually occurs during anaesthesia.
Thoracic blood volume. A shift of blood from the peripheral circulation into the chest during anaesthesia has been postulated as a cause of reduced FRC,43 and one CT study seemed to demonstrate this.54 However, this observation has not been confirmed,35,50,55 and is currently regarded as an unlikely contributory factor to the reduced FRC.
Atelectasis During Anaesthesia48
‘Miliary atelectasis’ during anaesthesia was first proposed by Bendixen et al in 1963 as an explanation of the increased alveolar/arterial Po2 difference during anaesthesia.56 Conventional radiography, however, failed to show any appreciable areas of collapse, presumably due to most atelectasis being behind the diaphragm on anteroposterior radiographs (see below). Hedenstierna’s group in Sweden were the first to demonstrate pulmonary opacities on CT scans of subjects during anaesthesia. These opacities usually occurred in the dependent areas of lung just above the diaphragm and were termed ‘compression atelectasis’ (Figure 22.10). Their extent correlated very strongly with the calculated intra-pulmonary shunt, and animal studies showed that the areas of opacity had a typical histological appearance of collapsed lung.55
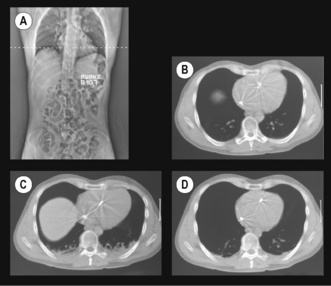
Fig. 22.10 Computed tomography of transverse sections of the thoracic cage (supine position) at the level shown in the scout view (A). (B) Control (awake) view. (C) Anaesthesia with zero end-expiratory pressure. Note the development of atelectasis in the dependent region of lung and some ascent of the right dome of the diaphragm. (D) The same patient with positive end-expiratory pressure, which reduces the amount of atelectasis.
(Scans (A) and (B) are reproduced from reference 57 with the permission of the authors and the editors and publishers of Acta Anesthesiologica Scandanavica. I am indebted to the authors for supplying the other two scans.)
Atelectasis occurs in between 75% and 90% of healthy individuals having general anaesthesia with muscle paralysis.47,58 It occurs more commonly in children59 because of their compliant chest wall, but is unrelated to age in adults. Atelectasis is most easily quantified from a single CT scan slice, taken immediately above the dome of the right diaphragm, and expressed as the percentage of the cross-sectional area containing atelectasis. The percentage of atelectasis during anaesthesia recorded in this way seems small, usually around 3%, but the atelectatic areas contain many more alveoli per unit volume than aerated lung, and this 3% of cross-sectional area equates to around 10% of lung tissue.60
Causes of Atelectasis
There are three mechanisms involved, all closely interrelated, and it is likely that all three are involved in the formation of atelectasis in vivo.
Airway closure as a result of the reduced FRC may lead to atelectasis. In the supine position, the expiratory reserve volume has a mean value of approximately 1 litre in males and 600 ml in females. Therefore, the reduction in FRC following the induction of anaesthesia will bring the lung volume close to residual volume. This will tend to reduce the end-expiratory lung volume below the closing capacity (CC), particularly in older patients (see Figure 3.11), and so result in airway closure and collapse of lung. Pulmonary atelectasis can easily be demonstrated in conscious subjects who voluntarily breathe oxygen close to residual volume,61 and Figure 22.11 shows the effect on arterial Po2 of simulating the reduction in FRC that occurs during anaesthesia. Even if lung collapse does not occur, for example in younger patients, the airway narrowing caused by reduced lung volume creates areas with low ventilation/perfusion  ratios that contribute to impaired gas exchange.62
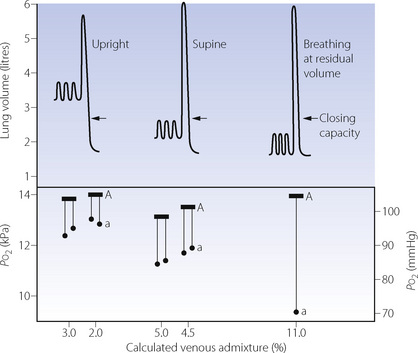
Fig. 22.11 Changes in tidal excursion relative to vital capacity in Dr Nunn when aged 45; arrows indicate the closing capacity. Ideal alveolar (A) Po2 is shown by the horizontal bar and arterial (a) Po2 by the black circles. Venous admixture was calculated on the assumption of an arterial/mixed venous oxygen content difference of 5 ml.dl−1.
(Reproduced from reference 63 by permission of the Editors of Acta Anaesthesiologica Scandanavica.)
An important aspect of this problem is whether CC remains constant during anaesthesia or whether it changes with FRC. Earlier studies by Hedenstierna and colleagues suggested that CC remained constant.64 However, two other studies provided convincing evidence that FRC and CC are both reduced in parallel following the induction of anaesthesia.65,66 It is possible that bronchodilatation caused by the anaesthetic counteracts the reduction in airway calibre that would be expected to result from the reduction in FRC (see below). The results of the last two studies suggest that there should be no increased tendency towards airway closure during anaesthesia, but this is clearly at variance with Hedenstierna’s work.62
Compression atelectasis may occur because of changes in chest wall and diaphragm position, which lead to the transmission of high intra-abdominal pressure to the chest and compression of areas of lung. As shown in Figure 22.9 the predominantly caudal distribution of atelectasis also points to a role for changes in the position of the dependent regions of the diaphragm.
Absorption atelectasis67 develops when an airway becomes partially or totally closed and the gas contained within the pulmonary units distal to the airway is absorbed into the blood. Absorption of gas does not in itself cause atelectasis, but in effect accelerates collapse should airway closure occur from either of the preceding mechanisms. The rapid uptake of oxygen into the blood makes an important contribution to the development of absorption atelectasis (see below). The role of absorption in anaesthesia induced atelectasis is disputed.67
Prevention of Atelectasis68
Recognition of atelectasis during anaesthesia has led to great interest in ways to prevent its occurrence. Several interesting findings have emerged.
Inspired oxygen concentration. Administration of high concentrations of oxygen during anaesthesia would be expected to promote atelectasis, and there is increasing evidence for this at a variety of stages during a general anaesthetic.
Preoxygenation. An  of 1.0 immediately prior to induction of anaesthesia leads to significantly more atelectasis than in patients with an
  of 0.3 or 0.21 during induction.69,70 The crucial
  for worsening atelectasis seems to be above 0.6, as a study comparing an
  of 1.0, 0.8 or 0.6 found cross-sectional areas of atelectasis on CT scans following induction of 5.6%, 1.3% and 0.2% respectively.71 Maintenance. Following re-expansion of atelectasis during anaesthesia (see below), a high inspired oxygen concentration causes a more rapid recurrence of atelectasis.72,73 However, a study comparing an
  of 0.8 or 0.3 in nitrogen throughout anaesthesia and the early post-operative period did not find any differences in oxygenation post-operatively.74 Before extubation. Use of a
  of 1.0 before removal of the tracheal tube at the completion of surgery is associated with more CT-demonstrated atelectasis in the immediate post-operative period.75
Using 100% inspired oxygen before, during and at the conclusion of a general anaesthetic seems to be associated with greater severity of pulmonary atelectasis. These observations have led to the suggestion that it is time to challenge the routine use of 100% oxygen during anaesthesia.76,77 Anaesthetists use 100% oxygen before induction and extubation to provide a longer time period before hypoxia occurs should there be difficulty in maintaining a patent airway. However, this safety period will be shortened only slightly by preoxygenating with an FiO2 of 0.8, the use of which may significantly reduce the amount of atelectasis that occurs.71
Nitrous oxide. Mathematical modelling of the rate at which absorption atelectasis occurs suggests that using N2O rather than N2 with oxygen is unimportant.78 Looking at diffusion of gases into and out of a closed lung unit, this model finds that the diffusion of N2O into the lung unit from the mixed venous blood is faster than the diffusion of N2 out of the lung unit, so its volume is maintained and collapse prevented. The in vivo situation is clearly more complex, and clinical studies of N2O have given conflicting results.79,80 Partial pressures of N2O in lung units and blood are rarely in a steady state, and the time at which lung units become closed will vary, so causing unpredictable effects of N2O on atelectasis (page 432).
Positive airway pressures. Application of a tight fitting face mask to the patient before induction allows the use of continuous positive airways pressure (CPAP) before the patient is asleep, and positive end expiratory pressure (PEEP) after induction. Using CPAP before induction may increase patient anxiety, but low levels of CPAP (6 cmH2O) have been shown to abolish the formation of atelectasis81 and also prolong the time taken for oxygen saturation to fall to 90% during the apnoea that normally follows induction of anaesthesia.82
During maintenance of anaesthesia moderate levels of PEEP (10 cmH2O) prevent the occurrence of atelectasis following a re-expansion manoeuvre (see below),83 but much higher levels are needed to re-expand existing atelectasis.
Re-Expansion of Atelectasis
Two methods have been described to re-expand collapsed areas of lung, and these are shown in Figure 22.12.
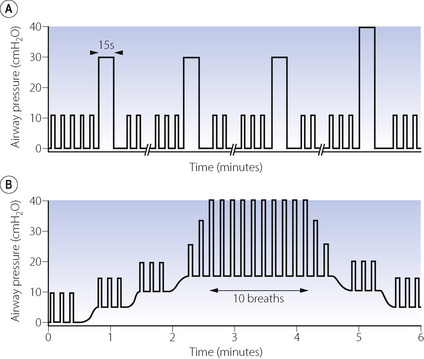
Fig. 22.12 Schematic representation of manoeuvres to re-expand collapsed lung during anaesthesia. (A) Vital capacity manoeuvre involving three large breaths sufficient to achieve airway pressures of 30 cmH2O followed by a single breath to 40 cmH2O, each sustained for 15 seconds. The breaks on the abscissa represent 3–5 minutes of intermittent positive pressure ventilation with normal tidal volume. (B) Positive end-expiratory pressure (PEEP) and large tidal volumes showing progressive application of PEEP up to 15 cmH2O, followed by increased tidal volume until a peak airway pressure of 40 cmH2O or tidal volume of 18 ml.kg−1 is achieved, which is then maintained for 10 breaths.
(After references 84 and 85 by permission of the authors and Oxford University Press.)
Vital capacity manoeuvres. The first technique reported to re-expand atelectasis consisted of a series of hyperinflation manoeuvres using three breaths to an airway pressure of 30 cmH2O followed by a final breath to 40 cmH2O, each sustained for 15 seconds (Figure 22.12A).84 Between these large breaths normal IPPV is continued for 3–5 minutes. Computerised tomography assessment during this manoeuvre shows that the first hyperinflation of 30 cmH2O reduces the area of atelectasis by half, and the subsequent inflations to 30 cmH2O have little additional effect, but the final breath to 40 cmH2O completely re-expands the atelectasis. Subsequent work by the same group showed that the inflation pressure of 40 cmH2O did not need to be sustained for 15 seconds, with half of the atelectasis re-expanded after only 2 seconds, and all the atelectasis re-expanded after 7–8 seconds in three quarters of patients.86
PEEP. High levels of PEEP are required to re-expand atelectasis. Also, resolution of atelectasis is not complete and collapse recurs within minutes when PEEP is discontinued.87 In addition, high levels of PEEP cause significant changes to  relationships within the lung and so may not improve oxygenation of the patient. Increasing levels of PEEP are more useful if used in conjunction with large tidal volumes. One proposed technique involves increasing PEEP levels to 15 cmH2O, and then tidal volume is increased until peak airway pressures of 40 cmH2O are achieved (Figure 22.12B).85 This study did not use CT assessment but inferred re-expansion of atelectasis from improved arterial Po2.
In both these techniques for re-expansion of atelectasis, airway pressures reach 40 cmH2O. An airway pressure this high is not without risk during anaesthesia, including the possibility of cardiovascular disturbances and pulmonary barotrauma (Chapter 32). In a similar fashion to PEEP, these recruitment manoeuvres reduce intrapulmonary shunt, but increase  mismatch such that there is often only a small improvement in oxygenation (see below).84,85
Respiratory Mechanics88
Calibre of the Lower Airways89
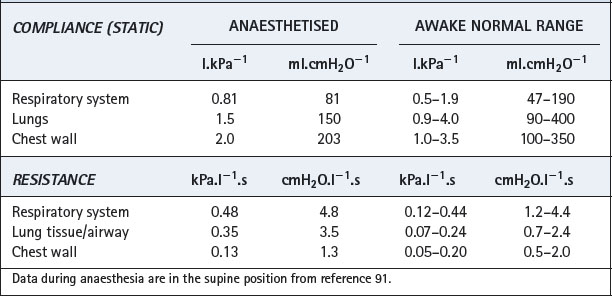
Effect of reduced FRC. Figures 4.5 and 22.13 both show the hyperbolic relationship between lung volume and airway resistance. Figure 22.13 clearly shows that the curve is steep in the region of FRC in the supine position and therefore the reduction in FRC that occurs during anaesthesia might be expected to result in a marked increase in airway resistance. However, most anaesthetics are broncho-dilators, as outlined in the following paragraphs, and, at least with halothane, this effect almost exactly offsets the effect of reduction in lung volume.90 Thus total respiratory system resistance during anaesthesia is only slightly greater than in the awake supine subject, most of the change occurring in the lung/airway components rather than the chest wall (Table 22.1).91 As would be expected, resistance increases with increasing flow rate and decreases with increasing inflation volume during anaesthesia.92
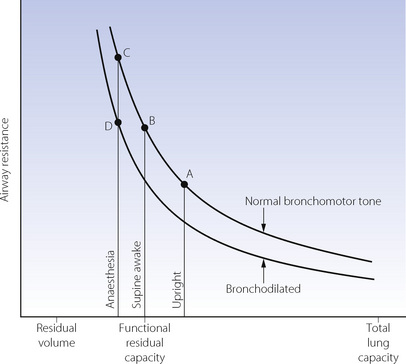
Fig. 22.13 Airway resistance as a function of lung volume with normal bronchomotor tone and when bronchodilated. A = upright and awake; B = supine and awake; C = supine and anaesthetised without bronchodilatation; D = supine, anaesthetised and with the degree of bronchodilatation that normally occurs during anaesthesia. Note that the airway resistance is similar at B and D, bronchodilatation approximately compensating for the decrease in FRC.
Inhalational anaesthetics. All inhalational anaesthetics investigated have shown bronchodilator effects. Suppression of airway vagal reflexes, direct relaxation of airway smooth muscle93 and inhibition of release of bronchoconstrictor mediators combine to cause an increase in airway conductance. In clinical concentrations, halothane reduces the amount of acetylcholine released from nerve terminals in response to nerve stimulation,94 and suppresses the increase in both airway and tissue resistance following vagal stimulation.90 This appears to be more important than the direct effect of clinical concentrations of halothane on airway smooth muscle or histamine release from mast cells.89
Intravenous anaesthetics have similar effects to the inhalational anaesthetics. Their direct effects on smooth muscle are mostly weak in comparison with inhaled agents, and in clinical practice their ability to attenuate neural reflex bronchoconstriction predominates.
Other Sites of Increased Airway Resistance
Breathing systems. Excessive resistance or obstruction may arise in apparatus such as breathing systems, valves, connectors and tracheal tubes. The tubes may be kinked, the lumen blocked or the cuff may herniate and obstruct the lower end, which may also abut against the carina or the side wall of the trachea. A reduction in diameter of a tracheal tube greatly increases its resistance, the pattern of flow being intermediate between laminar and turbulent for the conditions shown in Figure 22.14. Resistance imposed by a laryngeal mask airway is less than that of a corresponding size of tracheal tube.95
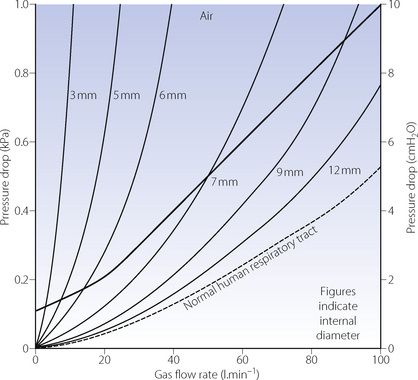
Fig. 22.14 Flow rate/pressure drop plots of a range of tracheal tubes, with their connectors and catheter mounts. The heavy line is the author’s suggested upper limit of acceptable resistance for an adult. Pressure drop does not quite increase according to the fourth power of the radius because the catheter mount offered the same resistance throughout the range of tubes. With 70% N2O/30% O2, the pressure drop is about 40% greater for the same gas flow rate when flow is turbulent, but little different when the flow is chiefly laminar.
The pharynx and larynx. The pharynx is commonly obstructed during anaesthesia by the mechanisms described earlier in this chapter, unless active steps are taken to preserve patency. Reflex laryngospasm is still possible at depths of anaesthesia that suppress other airway protective reflexes. In most cases the spasm eventually resolves spontaneously, but it may be improved by application of CPAP or terminated by neuromuscular blockade.
Compliance
Total respiratory system compliance is reduced during anaesthesia to a figure approaching the lower end of the normal range (Table 22.1).91 Both static and dynamic measurements (page 38) are reduced compared with the awake state.92 Compliance seems to be reduced very early in anaesthesia and the change is not progressive.
Figure 22.15 summarises the effect of anaesthesia on the pressure/volume relationships of the lung and chest wall. The diagram shows the major differences between the conscious state and anaesthesia. There are only minor differences between anaesthesia with and without paralysis. The left-hand section shows the relationship for the whole respiratory system comprising lungs plus chest wall. The curves obtained during anaesthesia clearly show the reduction in FRC (lung volume with zero pressure gradient from alveoli to ambient). Application of a positive pressure as high as 30 cmH2O (3 kPa) to the airways expands the lungs to barely 70% of the preoperative total lung capacity, which implies a reduced overall compliance. Table 22.1 and the two sections on the right of Figure 22.15 show that the major changes are in the lung rather than the chest wall.
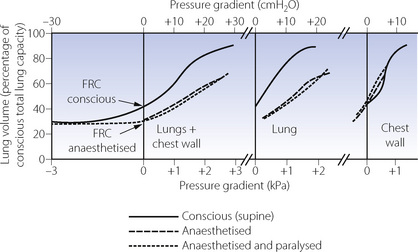
Fig. 22.15 Pressure/volume relationships before and after the induction of anaesthesia and paralysis. The first section shows the relationship for the respiratory system (lungs and chest wall). The second and third sections represent the lungs and the chest wall respectively. There are only insignificant differences between observations during anaesthesia with and without paralysis. There are, however, major differences in pressure volume relationships of the lung and total respiratory system following the induction of anaesthesia. Arrows indicate the FRC, which, during anaesthesia, is only slightly greater than the residual volume.
(After reference 96.)
The cause of this observed reduction in lung compliance has been difficult to explain. There is no convincing evidence that anaesthesia affects pulmonary surfactant in humans at clinically used concentrations. A more likely explanation is that the reduced lung compliance is simply the consequence of breathing at reduced lung volume. Strapping the chest of volunteers, thereby decreasing their lung volume, results in a decrease in pulmonary compliance that can be restored to normal by taking a maximal inspiration.97 This suggests that pulmonary atelectasis is the explanation, and that ventilation with normal tidal volumes to a smaller lung volume will inevitably reduce the lung compliance.
Gas Exchange
Every factor influencing gas exchange may be altered during anaesthesia, and many of the changes must be considered as normal features of the anaesthetised state. These ‘normal’ changes usually pose no threat to the patient, since their effects can easily be overcome by such simple means as increasing the concentration of oxygen in the inspired gas and the minute volume. The ‘normal’ changes may be contrasted with a range of pathological alterations in gas exchange that may arise during anaesthesia from such circumstances as airway obstruction, apnoea, bronchospasm or pneumothorax. These may be life threatening and require urgent action for their correction.
The major changes that adversely affect gas exchange during anaesthesia are reduced minute volume of ventilation (described above), increased dead space and shunt (considered in terms of the three compartment model described on page 126 and in Figure 8.8) and altered distribution of ventilation and perfusion in relation to ventilation/perfusion  ratios.
Dead Space (see page 128)
The increase in physiological dead space during anaesthesia was first observed in 1958.98 With allowance for the apparatus dead space of the tracheal tube and its connections, the dead space/tidal volume ratio from carina downwards averages 32% during anaesthesia with either spontaneous or artificial ventilation.99 This is approximately equal to the ratio for the normal conscious subject including trachea, pharynx and mouth (approximately 70 ml). Physiological dead space equals the sum of its anatomical and alveolar components, and the sub-carinal anatomical dead space is not normally increased. Therefore, the increase in sub-carinal physiological dead space during anaesthesia must be in the alveolar component.
Anatomical dead space. In the study of Nunn & Hill99 (Figure 22.16), sub-carinal anatomical dead space was always significantly less than physiological, reaching a maximum of about 70 ml at tidal volumes above 350 ml. This roughly accords with the expected geometric dimensions of the lower respiratory tract. At smaller tidal volumes, the anatomical dead space was less than the expected geometric volume. Values of less than 30 ml were recorded in some patients with tidal volumes of less than 250 ml. This is attributed to axial streaming and the mixing effect of the heart beat, and is clearly an important and beneficial factor in patients with depressed breathing.
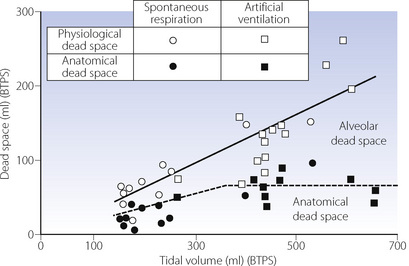
Fig. 22.16 Data and regression lines for physiological and anatomical dead space (the difference indicating alveolar dead space) as a function of tidal volume. There were no significant differences between anaesthesia with and without paralysis. Note the range over which physiological dead space appeared to be a constant fraction of tidal volume. Anatomical dead space was constant above a tidal volume of 350 ml, resulting in increased alveolar dead space.
(After reference 99 by permission of the Editor and publishers of the Journal of Applied Physiology.)
Alveolar dead space increases with tidal volume so that the sum of anatomical and alveolar (= physiological) dead space remains about 32% of tidal volume (Figure 22.16). The cause of the increase in alveolar dead space during uncomplicated general anaesthesia is not immediately obvious. There is no evidence that it is due to pulmonary hypotension causing development of a zone 1 (page 105) and the reduced vertical height of the lung in the supine position would mitigate against this. The alternative explanation is maldistribution with overventilation of relatively underperfused alveoli. Studies of ventilation/perfusion relationships outlined below give some support to this view, but such patterns of maldistribution have not invariably been observed during anaesthesia.
Apparatus dead space. Use of a tracheal tube or laryngeal mask airway (LMA) will bypass much of the normal anatomical dead space arising in the mouth and pharynx. However, for practical purposes the apparatus dead space of the tracheal tube or LMA100 and their connections must be included for the purpose of calculating alveolar ventilation during anaesthesia. The total dead space then increases to about 50% of tidal volume (Figure 22.17). When using a facemask, it is necessary to add the volume of the mask and its connections to the physiological dead space, which now also includes trachea, pharynx and mouth. The total dead space then amounts to about two-thirds of the tidal volume.101 Thus, a seemingly adequate minute volume of 6 l.min−1 may be expected to result in an alveolar ventilation of only 2 l.min−1, which would almost inevitably result in hypercapnia.
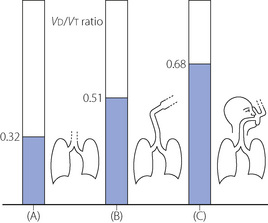
Fig. 22.17 Physiological plus apparatus dead space (where applicable) as a fraction of tidal volume in anaesthetised patients: (A) from carina downwards; (B) including tracheal tube or laryngeal mask airway and connector; and (C) including upper airway, facemask and connector.
Compensation for increased dead space may be made by increasing the minute volume to maintain the alveolar ventilation. In artificially ventilated anaesthetised patients the problem hardly exists. The patient may have a large dead space, but the high minute volumes that are usually selected provide more than adequate compensation. Thus the alveolar ventilation is almost always greater than necessary for carbon dioxide homoeostasis. With monitoring of end-expiratory Pco2, there is seldom any difficulty in maintaining a normal value. However, the existence of an alveolar dead space means that the arterial Pco2 during anaesthesia is usually 0.5–1 kPa (3.8–7.5 mmHg) greater than the end-expiratory Pco2.
In the case of the hypoventilating patient who is allowed to breathe spontaneously during anaesthesia, the reduction in dead space at smaller tidal volumes shown in Figure 22.16 prevents some of the alveolar hypoventilation that would be expected if the volume of the dead space remained constant. This, together with the reduced metabolic rate, results in the hypercapnia being much less than the values for minute volume sometimes observed during anaesthesia might lead one to expect. No doubt, over the years, many patients have owed their lives to these factors.
Shunt
Magnitude of the change during anaesthesia. In the conscious healthy subject, the shunt or venous admixture amounts to only 1–2% of cardiac output (page 133). This results in an alveolar/arterial Po2 gradient of less than 1 kPa (7.5 mmHg) in the young healthy subject breathing air, but the gradient increases with age and lung disease. During anaesthesia, the alveolar/arterial Po2 difference is usually increased to a value that corresponds to an average shunt of about 10%. Formal measurements of pulmonary venous admixture, taking into account the mixed venous oxygen content, have also been made and these concur with shunts being of the order of 10%. This provides an acceptable basis for predicting arterial Po2 during an uncomplicated anaesthetic and it also permits calculation of the concentration of oxygen in the inspired gas that will provide an acceptable arterial Po2. Some 30–40% inspired oxygen is usually adequate in an uncomplicated anaesthetic.
The cause of the venous admixture during anaesthesia. About half of the observed venous admixture is true shunt through the areas of atelectasis described above. There is a very strong correlation between the shunt (measured as perfusion of alveoli with a  ratio of less than 0.005) and the area or volume of atelectasis seen on CT scans.47,49 Studies using isotope techniques have demonstrated intrapulmonary shunting in the same areas of lung where atelectasis is seen on CT scans.102 However, the venous admixture during anaesthesia also contains components due to dispersion of the
  distribution, and to perfusion of alveoli with low
  ratios (0.005–0.1).
Ventilation/Perfusion Relationships103
The three-compartment model of the lung (page 126) provides a definition of lung function in terms of dead space and shunt, parameters that are easily measured, reproducible and provide a basis for corrective therapy. Nevertheless, it does not pretend to provide a true picture of what is going on in the lung. A far more sophisticated approach is provided by the analysis of the distribution of pulmonary ventilation and perfusion in terms of  ratios by the multiple inert gas elimination technique (page 126), and studies during anaesthesia have been reported.49,62,103
During general anaesthesia and paralysis both ventilation and perfusion are found to be distributed to a wider range of  ratios than when awake (Figure 22.18).69,104 Other studies have also found substantial
  mismatch during anaesthesia and paralysis, with ventilation being preferentially distributed to ventral areas and vice versa for perfusion.102 In the healthy young subject shown in Figure 22.18, the true intrapulmonary shunt had a mean value of less than 1% during anaesthesia, but the alveolar/arterial Po2 gradient was slightly increased and this was attributed to the increased spread of the distribution of perfusion to areas of poorer ventilation (lower
  ratio). Anatomical dead space was reduced, largely because of tracheal intubation, but alveolar dead space was increased, partly due to increased spread of distribution of ventilation to areas of poorer perfusion (higher
  ratio).
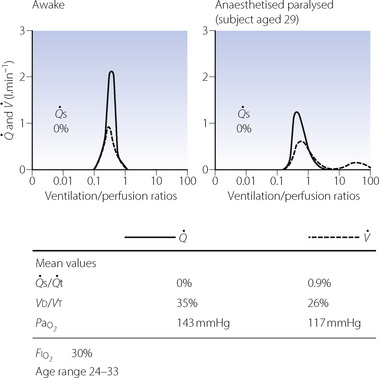
Fig. 22.18 Distribution of ventilation and perfusion as a function of ventilation/perfusion ratios in the awake and anaesthetised paralysed subject.
(Adapted from reference 104 and reproduced from reference 105 by permission of the publishers.)
Effect of age on  ratios during anaesthesia. Inawake subjects, increasing age causes a widening of the distribution of
  ratios, and the distribution widens still further with anaesthesia.49 It would thus be expected that intrapulmonary shunt during anaesthesia would also increase with age, but studies of this effect have produced conflicting results. One study involving typical surgical patients with ages ranging from 37 to 64 found that the true intrapulmonary shunt was increased during anaesthesia.106 However, the shunt calculated from the alveolar/arterial Po2 gradient according to the three-compartment lung model would be larger still, and the difference would be due to perfusion of areas of low
  ratio. A second study of elderly patients (mean age 60) who all had some deterioration in pulmonary function showed wide variations in pulmonary shunt.107 The results of this study can most easily be appreciated by considering the patients in three groups (Figure 22.19). In the first, there was only a small increase in the true shunt following the induction of anaesthesia but there appeared a ‘shelf’ of perfusion of regions with very low
  ratios in the range 0.01–0.1. In the second group, this ‘shelf’ was less prominent but there was a substantial increase in true shunt. Finally, in the third group, there was both a ‘shelf’ and an increase in true shunt. All of these changes are compatible with a decrease in FRC below closing capacity.
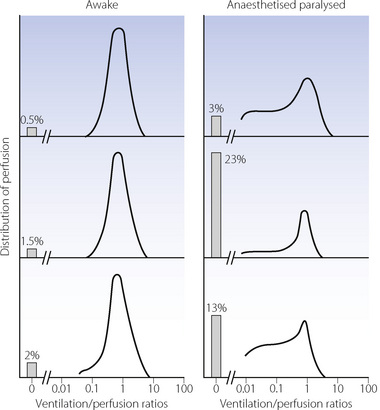
Fig. 22.19 Changes in pulmonary perfusion as a function of ventilation/perfusion ratios following induction of anaesthesia in elderly patients. Numbers to the left of each block indicate the shunt.
(Adapted from reference 107 and reproduced from reference 105 by permission of the publishers.)
Finally, a study by Gunnarsson et al49 involved 45 patients of age range 23–69 years. They reached the surprising conclusion that atelectasis (as seen with CT) and true intrapulmonary shunt (determined by multiple inert gas elimination technique as alveoli with  ratio less than 0.005) did not relate to age. However, both were substantially increased during anaesthesia and correlated with each other. It is difficult to reconcile the lack of correlation between age and shunt with the striking differences seen in previous studies. Nevertheless, this study confirmed the enhanced decline in arterial Po2 with increasing age during anaesthesia, and venous admixture (calculated as for the three-compartment model) was increased significantly from a mean value of 5.5% of cardiac output before anaesthesia, to 9.2% during anaesthesia. Venous admixture increased steeply with age (0.17% per year), and this was attributed to an age-dependent increase in the spread of
  ratios (Figure 22.20) and to greater perfusion of alveoli with low
  ratios (0.005–0.1).
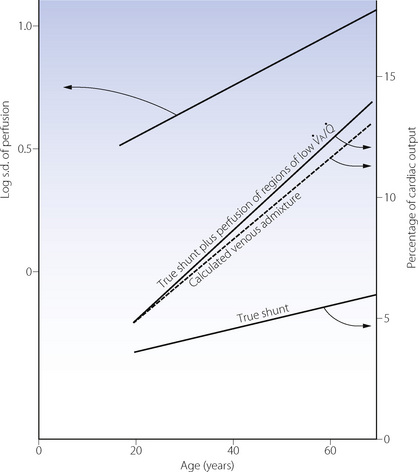
Fig. 22.20 Age-dependence of various factors influencing alveolar/arterial Po2 difference during anaesthesia.49 The logarithm of standard deviation of distribution of perfusion is significantly greater during anaesthesia (shown) than when awake (not shown) and has a significant regression against age under both circumstances. True shunt is significantly increased almost tenfold compared with before anaesthesia, but the correlation with age is not significant. Perfusion of areas of poorly ventilated regions (0.005 <  < 0.1) was significantly increased compared with before anaesthesia and correlated with age in both circumstances. Venous admixture here refers to the value obtained from the shunt equation (page 132) and agrees well with the sum of shunt and perfusion of regions of low
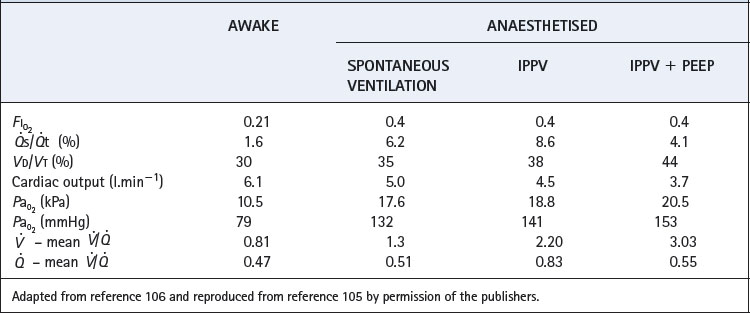
Effect of PEEP. It has long been known that, in contrast to the situation in intensive care, PEEP often does little to improve the arterial Po2 during anaesthesia.108 There are two reasons why PEEP is not associated with improved oxygenation. First, the decrease in cardiac output associated with PEEP reduces the saturation of the blood traversing the remaining shunt and so reduces arterial Po2.106 Secondly, PEEP increases ventilation of alveoli with high  ratio, so further increasing overall
  mismatch. The essential difference from the patient undergoing critical care is probably the lack of protection of intrathoracic blood vessels from raised airway pressure that is afforded by stiff lungs in most patients requiring critical care.
Other factors affecting ratio during anaesthesia. Hypoxic pulmonary vasoconstriction (HPV) contributes to maintaining a normal
  ratio by reducing perfusion to underventilated alveoli (pages 108). Inhalational anaesthetics inhibit HPV (page 346) and so in theory may worsen
  mismatch during anaesthesia. There is some evidence from animal studies that this is the case,103 and one human study of anaesthesia with intravenous barbiturates, which are believed to have less effect on HPV, demonstrated only a small amount of intrapulmonary shunting.109 High concentrations of inspired oxygen will inhibit HPV by maintaining alveolar Po2 at a high level even in poorly ventilated alveoli. Some work has shown that lower inspired oxygen concentrations during anaesthesia (30%) are associated with less
  scatter than when breathing 100% oxygen.69
Summary
These studies of  relationships during anaesthesia complement one another and give us greatly increased insight into the effect of anaesthesia on gas exchange. We are now in a position to summarise the effect of anaesthesia on gas exchange as follows:
Uniformity of distribution of ventilation and perfusion is decreased by anaesthesia. The magnitude of the change is age-related and may be affected by the inspired oxygen concentration and anaesthetic agents used. The increase in alveolar dead space appears to be due to increased distribution of ventilation to areas of high (but not usually infinite)  ratios. Venous admixture is increased in anaesthesia to a mean value of about 10%, but the change is markedly affected by age, being minimal in the young. The increased venous admixture during anaesthesia is due partly to an increase in true intrapulmonary shunt (due to atelectasis), and partly to increased distribution of perfusion to areas of low (but not zero)
  ratios. The latter component increases with age. The major differences are between the awake and the anaesthetised states. Paralysis and artificial ventilation do not greatly alter the parameters of gas exchange in spite of the different spatial distribution of ventilation. Both PEEP and lung hyperinflation manoeuvres reduce the shunt, but the beneficial effect on arterial Po2 is offset by greater
  mismatch and a decrease in cardiac output which reduces the mixed venous oxygen content.
Typical values for the various factors discussed are shown in Table 22.2.
Other Effects of General Anaesthesia on the Respiratory System
Response to Added Resistance
The preceding sections would lead one to expect that anaesthesia would cause grave impairment of the ability of a patient to increase their work of breathing in the face of added resistance. Surprisingly, this is not the case and anaesthetised patients preserve a remarkable ability to overcome added resistance.110,111 The anaesthetised patient responds to inspiratory loading in two phases. First, there is an instant augmentation of the force of contraction of the inspiratory muscles, mainly the diaphragm, during the first loaded breath.51 Detection of the inspiratory resistance may be mediated by either airway or lung receptors, and is only slightly inhibited by anaesthesia.112 The second response is much slower and overshoots when the loading is removed, and the time course suggests that this is mediated by an increase in Pco2.110 In combination, these two mechanisms enable the anaesthetised patient to achieve good compensation with inspiratory loading up to about 0.8 kPa (8 cmH2O). Even more remarkable is the preservation of the elaborate response to expiratory resistance (see Figure 4.10), with a large increase in minute volume occurring with expiratory resistive loading during enflurane anaesthesia.113
Hypoxic Pulmonary Vasoconstriction114,115
The contribution to  mismatch of disturbed HPV during anaesthesia has already been described above, but the effects of anaesthesia on HPV merit further discussion. Early animal studies using isolated lungs found that several inhalational anaesthetics inhibit HPV, but no such effect was found with intravenous anaesthetics. Although in vitro studies gave clear evidence that inhalational anaesthetics depressed HPV, in vivo studies were inconsistent. One cause of this inconsistency was found to be the concomitant depression of cardiac output by inhalational anaesthetics.114 In Chapter 7 it was explained how hypoxia influences pulmonary vascular resistance not only by the alveolar Po2 but also, in part, by the mixed venous Po2. A reduction in cardiac output must decrease the mixed venous Po2 if oxygen consumption remains unchanged, and this would intensify pulmonary vasoconstriction. Thus, on the one hand, an inhalational anaesthetic will inhibit HPV by direct action while, on the other hand, it may intensify HPV by reducing mixed venous Po2 as a result of decreasing cardiac output. Thus most investigators’ results are consistent with the view that inhalational anaesthetics depress HPV provided that allowance is made for the effect of concomitant changes of cardiac output.114 An example of when HPV may be relevant in clinical anaesthesia is during one-lung ventilation which is described on page 498.
Special Conditions Arising during Anaesthesia
One-lung ventilation during anaesthesia is described on page 498.
Obesity
Obese patients already have a small FRC when supine, and the further reduction with anaesthesia results in an exponential decrease in FRC during anaesthesia with increasing body mass index.116 Similarly, with increasing obesity there is a greater fall in lung compliance and increase in lung resistance under anaesthesia.116 Obese patients develop larger amounts of atelectasis during anaesthesia, and re-expansion manoeuvres as described above are particularly effective in these patients, often leading to a sustained improvement in oxygenation.73,84 Although PEEP may not be particularly useful in preventing the respiratory changes with anaesthesia in non-obese subjects, in morbidly obese patients (BMI = 40 kg m−2) modest levels of PEEP (10 cmH2O) improve elastance and oxygenation.117,118
Patient Position
Lateral. In Chapter 8 it was explained that, in the lateral position, there is preferential distribution of inspired gas to the lower lung (see Table 8.1) and this accords approximately with the distribution of pulmonary blood flow. This favourable distribution of inspired gas is disturbed by anaesthesia whether respiration is spontaneous or artificial in the paralysed patient, with preferential ventilation of the non-dependent (upper) lung and continued preferential perfusion of the dependent lung. This predictably leads to a greater spread of  ratios and a further fall in Po2 compared with the supine position.119 Atelectasis seen on CT scanning forms only in the dependent lung, but the overall amount of atelectasis and the intrapulmonary shunt are similar to that seen when anaesthetised and paralysed when supine (see page 499 and Figure 33.3).119
Prone. A patient anaesthetised in the prone position should have the upper chest and pelvis supported, to allow free movement of the abdomen and lower chest. In subjects anaesthetised and paralysed in this position, respiratory mechanics are only minimally affected, and both FRC and arterial Po2 are greater than when supine.91 A study using the DSR showed that with anaesthesia in the prone position, motion of non-dependent areas of the diaphragm predominates, leading the authors to suggest a difference in the anatomical structure between dorsal and ventral areas of the diaphragm.120 Other explanations for improved oxygenation when prone include more uniform lung perfusion and less ventilation of, or atelectasis formation in, dependent areas of lung that are reduced in volume by the presence of the mediastinum and heart.91
Laparoscopic Surgery121,122
In comparison with open surgery, the benefits of many laparoscopic procedures are now well established and have led to an expansion in the number of surgical procedures carried out via laparoscopy. As confidence in, and understanding of, the technique improves, procedures become more complex, more prolonged, and are attempted in less fit patients.
Absorption of gas from the peritoneal cavity depends on the partial pressure of gas present and its solubility in peritoneal tissue. Gas mixtures are rarely used, so the partial pressure is normally equal to the insufflation pressure. Insoluble gases such as helium or nitrogen would be absorbed to a much smaller extent, but would also be more disastrous during the rare complication of gas embolus. Air, oxygen and nitrous oxide all support combustion so prevent the use of diathermy which is fundamental to laparoscopic surgery. Thus carbon dioxide remains the usual gas used for the erroneously named ‘pneumoperitoneum’. Laparoscopic operations involve the insufflation of CO2 into the peritoneum to a pressure of 10–15 mmHg, and normally also involve positioning the patient head-up (for upper abdominal surgery) or head-down (for lower abdominal and pelvic procedures). These procedures have two adverse effects on respiration.
Respiratory mechanics. In addition to the changes already described for general anaesthesia, the increased intra-abdominal pressure during laparoscopy causes further restriction of the diaphragm and lower chest wall. Respiratory system compliance is significantly reduced,121 sometimes accompanied by increased airway resistance, particularly in obese patients.123 An increase in airway pressures invariably occurs. The head-up position may alleviate some of these changes, but patients in the head-down position during laparoscopy have a further cause for substantially reduced compliance. In healthy patients, these significant changes in respiratory system mechanics have only a small effect on  distribution. A study of nine healthy patients using MIGET to characterise
  ratios found only a transient reduction in pulmonary shunt and no significant changes in alveolar dead space or in areas of abnormally high or low
  ratios.124
Carbon dioxide absorption.125 Transperitoneal absorption of CO2 into the blood begins within a few minutes of commencing a laparoscopic procedure, and is estimated to be 30–50 ml.min−1. If ventilation remains unchanged, this will quickly increase arterial Pco2, and CO2 will begin diffusing into the medium and slow compartments of the body’s huge CO2 stores (see page 170 and Figure 10.10). After a prolonged procedure, with elevated  , hypercapnia may be present for many hours post-operatively as the CO2 stores empty.121 Unfortunately, this is a period when the patient is no longer receiving artificial ventilation and is recovering from a general anaesthetic and so may struggle to meet the increased ventilatory requirement. Increasing the minute volume during surgery should allow the maintenance of a normal
  to prevent this scenario developing. In patients who are obese or have respiratory disease, the changes in compliance described previously will further impair the excretion of CO2 and require an even larger minute volume. End-tidal CO2 monitoring may be used to estimate the required ventilation, but in many patients
  disturbances mean that there may be a large, and unpredictable, end-tidal to arterial Pco2 gradient,121 and measurement of
  may be required.
Regional Anaesthesia
Epidural or spinal anaesthesia may be expected to influence the respiratory system, either by a central effect of drugs absorbed from the spinal canal or by affecting the pattern or strength of contraction of respiratory muscle groups.126 These affects are generally small, but of great importance in view of the tendency to use regional anaesthetic techniques in patients with respiratory disease or in obstetric practice when respiratory function is already abnormal (Chapter 14).
Control of Breathing
Thoracic epidural anaesthesia may cause a small reduction in resting tidal volume as a result of reduced rib cage movement.127,128 Predictably this does not occur following lumbar epidural anaesthesia.129 Studies of hypercapnic and hypoxic ventilatory responses during epidural anaesthesia have produced conflicting results. Thoracic anaesthesia may reduce the ventilatory response to hyper-capnia by inhibition of intercostal muscle activity. Lumbar epidurals have been reported to increased the response to hypercapnia,127,130 which is believed to be stimulated by anxiety (the study was performed immediately prior to surgery),127 or because of a direct stimulant effect of lignocaine on the respiratory centre.130 The acute hypoxic ventilatory response is unaffected by thoracic epidural anaesthesia, but lumbar epidurals may increase ventilation in response to hypoxia by a poorly understood mechanism.127,128
Respiratory muscle function has been extensively studied using EMGs and the DSR during high lumbar (block up to T1 dermatome) epidural anaesthesia,131 and confirmed the reduced contribution of the rib cage to resting ventilation. Functional residual capacity was increased by 300 ml as a result of both caudad movement of the diaphragm and reduced thoracic blood volume. In spite of these changes, most respiratory function measurements remain essentially unchanged during epidural anaesthesia with only small changes in forced vital capacity and peak expiratory flow rate.132 The situation is quite different in late pregnancy, when regional anaesthesia is commonly employed. Significant reductions in forced vital capacity and peak expiratory flow have been reported after spinal anaesthesia,133 with lesser changes following epidural anaesthesia.134 Peak expiratory pressure, a measure of abdominal muscle activity, was also decreased after lumbar epidural for Caesarean section, particularly when bupivacaine was used.135
Oxygenation during epidural anaesthesia is largely unaffected. In a study by Hedenstierna’s group, lumbar epidural anaesthesia produced no changes in  relationships or pulmonary shunt, and no CT evidence of atelectasis except in one subject with a higher than normal body mass index in the lithotomy position.136
Respiratory Function in the Postoperative Period137
Early Post-Anaesthetic Recovery
In the first few minutes of recovery, alveolar Po2 may be reduced by elimination of nitrous oxide, which dilutes alveolar oxygen (diffusion hypoxia) and carbon dioxide, but this effect is usually transient. Hypoxia is very common during transfer to the recovery room when monitoring is often interrupted.138 Airway obstruction, often associated with residual muscle paralysis, is a common potential cause of hypoxia shortly after anaesthesia. This may be compounded by the residual effects of anaesthetic agents on ventilatory control that have been described above. Both reduced FRC and the increased alveolar/arterial Po2 gradient observed during anaesthesia usually return to normal during the first few hours after minor operations.
Late Postoperative Respiratory Changes
Following major surgery, the restoration of a normal alveolar/arterial Po2 gradient may take several days, and episodes of hypoxia are common. There are several contributory factors.
Lung volume and atelectasis. There is a continued reduction in FRC, usually reaching its lowest value 1–2 days postoperatively, before slowly returning to normal values within a week.139 Reduction of the FRC is greatest in patients having surgery near the diaphragm, that is, upper abdominal or thoracic incisions,140 but is less following laparoscopic surgery in the upper abdomen.141 Atelectasis seen on CT scans during anaesthesia persists for at least 24 hours in patients having major surgery.142 The effects of these changes on  relationships and oxygenation will be similar to those seen during anaesthesia, but the provision of adequate inspired oxygen concentration is now far less reliable.
Effort-dependent lung function tests such as forced vital capacity, forced expiratory volume in one second and peak expiratory flow rate are all reduced significantly following surgery, particularly if pain control is inadequate. Laparoscopic surgery is again associated with lesser, but still significant, reductions in lung function, and the degree of change is again related to the site of surgery.139
Respiratory muscles.143 Diaphragmatic dysfunction is a term that has been used to describe changes in the pattern of contraction of respiratory muscles in patients following major surgery. Impairment of diaphragmatic contraction is believed to result from reflex inhibition of phrenic nerve output in response to surgical trauma. Changes are independent of the level of pain control, and are only improved by thoracic epidural which is believed to result in neural blockade of the inhibitory reflex.139 The existence of diaphragmatic dysfunction has been challenged, mainly on the grounds that methods used to study diaphragm function are largely indirect, and greatly affected by changes in other respiratory muscle groups.143 For example, there are well described increases in expiratory abdominal muscle activity following surgery144 that may be interpreted as changes in diaphragm activity.
Sputum retention occurs in many patients following surgery. General anaesthesia, particularly with a tracheal tube, causes impairment of mucociliary transport in the airways,145 an effect that may persist into the postoperative period. This, coupled with reduced FRC, residual atelectasis and an ineffective cough, is likely to contribute to the development of chest infections including pneumonia. Many of these factors are more pronounced in smokers, who are known to be more susceptible to chest complications following major surgery (page 320).
References
1. Snow J. On Chloroform and Other Anaesthetics: Their Action and Administration. London: Churchill; 1858.
2. Nunn JF. Effects of anaesthesia on respiration. Br J Anaesth.. 1990;65:54-62.
3. Munson ES, Larson CP, Babad AA, Regan MJ, Buechel DR, Eger EI. The effects of halothane, fluroxene and cyclopropane on ventilation: a comparative study in man. Anesthesiology. 1966;27:716-728.
4. Pandit JJ. Effect of low dose inhaled anaesthetic agents on the ventilatory response to carbon dioxide in humans: a quantitative review. Anaesthesia. 2005;60:461-469.
5. Eger EI. Isoflurane: a review. Anesthesiology. 1981;55:559-576.
6. Lockhart SH, Rampil IJ, Yasuda N, Eger EI, Weiskopf RB. Depression of ventilation by desflurane in humans. Anesthesiology. 1991;74:484-488.
7. Doi M, Ikeda K. Respiratory effects of sevoflurane. Anesth Analg.. 1987;66:241-244.
8. Eger EI, Dolan WM, Stevens WC, Miller RD, Way WL. Surgical stimulation antagonises the respiratory depression produced by Forane. Anesthesiology. 1972;36:544-549.
*9. Pandit JJ. The variable effect of low-dose volatile anaesthetics on the acute ventilatory response to hypoxia in humans: a quantitative review. Anaesthesia. 2002;57:632-643.
*10. Dahan A, Teppema LJ. Influence of anaesthesia and analgesia on the control of breathing. Br J Anaesth.. 2003;91:40-49.
11. Gordh T. Postural circulatory and respiratory changes during ether and intravenous anesthesia. Acta Chir Scand.. 1945;92(Suppl 102):26.
12. Duffin J, Triscott A, Whitwam JG. The effect of halothane and thiopentone on ventilatory responses mediated by the peripheral chemoreceptors in man. Br J Anaesth.. 1976;48:975-981.
13. Knill RL, Gelb AW. Ventilatory responses to hypoxia and hypercapnia during halothane sedation and anesthesia in man. Anesthesiology. 1978;49:244-251.
14. Nagyova B, Dorrington KL, Gill EW, Robbins PA. Comparison of the effects of sub-hypnotic concentrations of propofol and halothane on the acute ventilatory response to hypoxia. Br J Anaesth.. 1995;75:713-718.
15. Temp JA, Henson LC, Ward DS. Does a subanaesthetic concentration of isoflurane blunt the ventilatory response to hypoxia. Anesthesiology. 1992;77:1116-1124.
16. van den Elsen MJLJ, Dahan A, Berkenbosch A, DeGoede J, van Kleef JW, Olievier ICW. Does subanesthetic isoflurane affect the ventilatory response to acute isocapnic hypoxia in healthy volunteers. Anesthesiology. 1994;81:860-867.
17. Young CH, Drummond GB, Warren PM. Effect of a sub-anaesthetic concentration of halothane on the ventilatory response to sustained hypoxia in healthy humans. Br J Anaesth.. 1993;71:642-647.
18. Knill RL, Kieraszewicz HT, Dodgson BG, Clement JL. Chemical regulation of ventilation during isoflurane sedation and anaesthesia in humans. Can Anaes Soc J. 1983;30:607-614.
19. Temp JA, Henson LC, Ward DS. Effect of a subanesthetic minimum alveolar concentration of isoflurane on two tests of the hypoxic ventilatory response. Anesthesiology. 1994;80:739-750.
20. Nagyova B, Dorrington KL, Poulin MJ, Robbins PA. Influence of 0.2 minimum alveolar concentration of enflurane on the ventilatory response to sustained hypoxia in humans. Br J Anaesth.. 1997;78:707-713.
21. Sjögren D, Sollevi A, Ebberyd A, Lindahl SGE. Isoflurane anesthesia (0.6 MAC) and hypoxic ventilatory response in humans. Acta Anaesthesiol Scand.. 1995;39:17-22.
22. van den Elsen M, Sarton E, Teppema L, Berkenbosch A, Dahan A. Influence of 0.1 minimum alveolar concentration of sevoflurane, desflurane and isoflurane on dynamic ventilatory response to hypercapnia in humans. Br J Anaesth.. 1998;80:174-182.
23. Robotham JL. Do low dose inhalational anesthetic agents alter ventilatory control. Anesthesiology. 1994;80:723-726.
24. Nandi PR, Charlesworth CH, Taylor SJ, Nunn JF, Dorè CJ. Effect of general anaesthesia on the pharynx. Br J Anaesth.. 1991;66:157-162.
25. Mathru M, Esch O, Lang J, et al. Magnetic resonance imaging of the upper airway. Effects of propofol anesthesia and nasal continuous positive airway pressure in humans. Anesthesiology. 1996;84:273-279.
26. Ochiai R, Guthrie RD, Motoyama EK. Effects of varying concentrations of halothane on the activity of the genioglossus, intercostals, and diaphragm in cats: an electromyographic study. Anesthesiology. 1989;70:812-816.
27. Drummond GB. Influence of thiopentone on upper airway muscles. Br J Anaesth.. 1989;63:12-21.
28. Boidin MP. Airway patency in the unconscious patient. Br J Anaesth.. 1985;57:306-310.
29. Morikawa S, Safar P, DeCarlo J. Influence of the head-jaw position upon upper airway patency. Anesthesiology. 1961;22:265-270.
30. Heiberg J. A new expedient in administering chloroform. Medical Times and Gazette; 10 Jan 1874, p36
31. Marsh AM, Nunn JF, Taylor SJ, Charlesworth CH. Airway obstruction associated with the use of the Guedel airway. Br J Anaesth.. 1991;67:517-523.
32. Brain AIJ. The laryngeal mask: a new concept in airway management. Br J Anaesth.. 1983;55:801-805.
33. Miller AH. Ascending respiratory paralysis under general anaesthesia. JAMA. 1925;84:201-202.
34. Jones JG, Faithfull D, Jordan C, Minty B. Rib cage movement during halothane anaesthesia in man. Br J Anaesth.. 1979;51:399-407.
35. Warner DO, Warner MA, Ritman EL. Human chest wall function while awake and during halothane anesthesia: I Quiet breathing. Anesthesiology. 1995;82:6-19.
36. Warner DO, Warner MA, Joyner MJ, Ritman EL. The effect of nitrous oxide on chest wall function in humans and \dogs. Anesth Analg.. 1998;86:1058-1064.
37. Lumb AB, Petros AJ, Nunn JF. Rib cage contribution to resting and carbon dioxide stimulated ventilation during 1 MAC isoflurane anaesthesia. Br J Anaesth.. 1991;67:712-721.
38. Mankikian B, Cantineau JP, Sartene R, Clergue F, Viars P. Ventilatory pattern and chest wall mechanics during ketamine anesthesia in humans. Anesthesiology. 1986;65:492-499.
39. Morton CPJ, Drummond GB. Change in chest wall dimensions on induction of anaesthesia: a reappraisal. Br J Anaesth.. 1994;73:135-139.
40. Reigner J, Ameur MB, Ecoffey C. Spontaneous ventilation with halothane in children: A comparative study between endotracheal tube and laryngeal mask airway. Anesthesiology. 1995;83:674-678.
41. Drummond GB. The abdominal muscles in anaesthesia and after surgery. Br J Anaesth.. 2003;91:73-80.
42. Kaul SU, Heath JR, Nunn JF. Factors influencing the development of expiratory muscle activity during anaesthesia. Br J Anaesth.. 1973;45:1013-1018.
43. Hewlett AM, Hulands GH, Nunn JF, Heath JR. Functional residual capacity. II: Spontaneous respiration. Br J Anaesth.. 1974;46:486-494.
44. Fourcade HE, Larson CP, Hickey RF, Bahlman SH, Eger EI. Effects of time on ventilation during halothane and cyclopropane anesthesia. Anesthesiology. 1972;36:83-88.
45. Bergman NA. Distribution of inspired gas during anesthesia and artificial ventilation. J Appl Physiol. 1963;18:1085-1089.
46. Rutherford JS, Logan MR, Drummond GB. Changes in end-expiratory lung volume on induction of anaesthesia with thiopentone or propofol. Br J Anaesth. 1994;73:579-582.
47. Warner DO, Warner MA, Ritman EL. Atelectasis and chest wall shape during halothane anesthesia. Anesthesiology. 1996;85:49-59.
*48. Duggan M, Kavanagh BP. Pulmonary atelectasis. A pathogenic perioperative entity. Anesthesiology. 2005;102:838-854.
49. Gunnarsson L, Tokics L, Gustavsson H, Hedenstierna G. Influence of age on atelectasis formation and gas exchange impairment during general anaesthesia. Br J Anaesth.. 1991;66:423-432.
50. Hedenstierna G, Strandberg A, Brismar B, Lundquist H, Svensson L, Tokics L. Functional residual capacity, thoracoabdominal dimensions and central blood volume during general anesthesia with muscle paralysis and mechanical ventilation. Anesthesiology. 1985;62:247-254.
51. Muller N, Volgyesi G, Becker L, Bryan MH, Bryan AC. Diaphragmatic muscle tone. J Appl Physiol.. 1979;47:279-284.
52. Froese AB, Bryan AC. Effects of anesthesia and paralysis on diaphragmatic mechanics in man. Anesthesiology. 1974;41:242-255.
53. Reber A, Nylund U, Hedenstierna G. Position and shape of the diaphragm: implications for atelectasis formation. Anaesthesia. 1998;53:1054-1061.
54. Krayer S, Rehder K, Beck KC, Cameron PD, Didier EP, Hoffman EA. Quantification of thoracic volumes by three-dimensional imaging. J Appl Physiol.. 1987;62:591-598.
55. Hedenstierna G, Lundquist H, Undh B, et al. Pulmonary densities during anaesthesia. Eur Respir J. 1989;2:528-532.
56. Bendixen HH, Hedley-Whyte J, Laver MB. Impaired oxygenation in surgical patients during general anesthesia with controlled ventilation. N Engl J Med.. 1963;269:991-996.
57. Hedenstierna G, Tokics L, Strandberg A, Lundquist H, Brismar B. Correlation of gas exchange impairment to development of atelectasis during anaesthesia and muscle paralysis. Acta Anaesthesiol Scand.. 1986;30:183-191.
58. Lundquist H, Hedenstierna G, Strandberg A, Tokics L, Brismar B. CT-Assessment of dependent lung densities in man during general anaesthesia. Acta Radiol.. 1995;36:626-632.
59. Serafini G, Cornara G, Cavalloro F, et al. Pulmonary atelectasis during paediatric anaesthesia: CT evaluation and effect of positive end-expiratory pressure (PEEP). Paediatr Anaesth.. 1999;9:225-228.
60. Hedenstierna G. Invited editorial on “Kinetics of absorption atelectasis during anaesthesia: a mathematical model”. J Appl Physiol.. 1999;86:1114-1115.
61. Nunn JF, Williams IP, Jones JG, Hewlett AM, Hulands GH, Minty BD. Detection and reversal of pulmonary absorption collapse. Br J Anaesth.. 1978;50:91-100.
62. Rothen HU, Sporre B, Engberg G, Wegenius G, Hedenstierna G. Airway closure, atelectasis and gas exchange during general anaesthesia. Br J Anaesth.. 1998;81:681-686.
63. Nunn JF. Measurement of closing volume. Acta Anaesthiol Scand Supp.. 1978;70:154-160.
64. Hedenstierna G, McCarthy G, Bergström M. Airway closure during mechanical ventilation. Anesthesiology. 1976;44:114-123.
65. Juno P, Marsh M, Knopp TJ, Rehder K. Closing capacity in awake and anesthetized-paralyzed man. J Appl Physiol.. 1978;44:238-244.
66. Bergman NA, Tien YK. Contribution of the closure of pulmonary units to impaired oxygenation during anesthesia. Anesthesiology. 1983;59:395-401.
67. Joyce CJ, Baker AB. What is the role of absorption atelectasis in the genesis of perioperative pulmonary collapse? Anaesth Intensive Care. 1995;23:691-696.
68. Magnusson L, Spahn DR. New concepts of atelectasis during general anaesthesia. Br J Anaesth.. 2003;91:61-72.
69. Rothen HU, Sporre B, Engberg G, Wegenius G, Reber A, Hedenstierna G. Prevention of atelectasis during general anaesthesia. Lancet. 1996;345:1387-1391.
70. Reber A, Engberg G, Wegenius G, Hedenstierna G. Lung aeration: The effect of pre-oxygenation and hyperoxygenation during total intravenous anaesthesia. Anaesthesia. 1996;51:733-737.
71. Edmark L, Kostova-Aherdan K, Enlund M, Hedenstierna G. Optimal oxygen concentration during induction of general anesthesia. Anesthesiology. 2003;98:28-33.
72. Rothen HU, Sporre B, Engberg G, Wegenius G, Högman M, Hedenstierna G. Influence of gas composition on recurrence of atelectasis after a reexpansion maneuvre during general anesthesia. Anesthesiology. 1995;82:832-842.
73. Rothen HU, Sporre HU, Engberg G, Wegenius G, Hedenstierna G. Reexpansion of atelectasis during general anaesthesia may have a prolonged effect. Acta Anaesthesiol Scand.. 1995;39:118-125.
74. Akça O, Podolsky A, Eisenhuber E, et al. Comparable postoperative pulmonary atelectasis in patients given 30% or 80% oxygen during and 2 hours after colon resection. Anesthesiology. 1999;91:991-998.
*75. Benoit Z, Wicky S, Fischer J-F, et al. The effect of increased FIo2 before tracheal extubation on postoperative atelectasis. Anesth Analg.. 2002;95:1777-1781.
76. Lindahl SGE, Mure M. Dosing oxygen: A tricky matter or a piece of cake? Anesth Analg.. 2002;95:1472-1473.
77. Lumb AB. Just a little oxygen to breathe as you go off to sleep … is it always a good idea? Br J Anaesth.. 2007;99:769-771.
78. Joyce CJ, Williams AB. Kinetics of absorption atelectasis during anaesthesia: a mathematical model. J Appl Physiol.. 1999;86:1116-1125.
79. Agarwal A, Singh PK, Dhiraj S, Pandey CM, Singh U. Oxygen in air (FIo2 0.4) improves gas exchange in young healthy patients during general anesthesia. Can J Anesth. 2002;49:1040-1043.
80. Gunnarson L, Strandberg Å, Brismar B, Tokics L, Lundquist H, Hedenstierna G. Atelectasis and gas exchange impairment during enflurane/nitrous oxide anaesthesia. Acta Anaesthesiol Scand.. 1989;33:629-637.
81. Rusca M, Proietti S, Schnyder P, et al. Prevention of atelectasis formation during induction of general anesthesia. Anesth Analg.. 2003;97:1835-1839.
82. Herriger A, Frascarolo P, Spahn DR, Magnusson L. The effect of positive airway pressure during pre-oxygenation and induction of anaesthesia upon duration of non-hypoxic apnoea. Anaesthesia. 2004;59:243-247.
83. Neumann P, Rothen HU, Berglund JE, Valtysson J, Magnusson A, Hedenstierna G. Positive end-expiratory pressure prevents atelectasis during general anaesthesia even in the presence of a high inspired oxygen concentration. Acta Anaesthesiol Scand.. 1999;43:295-301.
84. Rothen HU, Sporre B, Engberg G, Wegenius G, Hedenstierna G. Re-expansion of atelectasis during general anaesthesia: a computed tomography study. Br J Anaesth.. 1993;71:788-795.
85. Tusman G, Böhm SH, Vazquez de Anda GF, do Campo JL, Lachmann B. ‘Alveolar recruitment strategy’ improves arterial oxygenation during general anaesthesia. Br J Anaesth.. 1999;82:8-13.
*86. Rothen HU, Neumann P, Berglund JE, Valtysson J, Magnusson A, Hedenstierna G. Dynamics of re-expansion of atelectasis during general anaesthesia. Br J Anaesth.. 1999;82:551-556.
87. Hedenstierna G, Tokics L, Lundquist H, Andersson T, Strandberg A, Brismar B. Phrenic nerve stimulation during halothane anaesthesia. Effects on atelectasis. Anesthesiology. 1994;80:751-760.
88. Milic-Emili J, Robatto FM, Bates JHT. Respiratory mechanics in anaesthesia. Br J Anaesth.. 1990;65:4-12.
89. Hirshman CA, Bergman NA. Factors influencing intrapulmonary airway calibre during anaesthesia. Br J Anaesth.. 1990;65:30-42.
90. Joyner MJ, Warner DO, Rehder K. Halothane changes the relationships between lung resistances and lung volume. Anesthesiology. 1992;76:229-235.
91. Pelosi P, Croci M, Calappi E, et al. The prone position during general anesthesia minimally affects respiratory mechanics while improving functional residual capacity and increasing oxygen tension. Anesth Analg.. 1995;80:955-960.
92. D’Angelo E, Robatto FM, Calderini E, et al. Pulmonary and chest wall mechanics in anesthetized paralyzed humans. J Appl Physiol.. 1991;70:2602-2610.
93. Yamakage M. Effects of anaesthetic agents on airway smooth muscle. Br J Anaesth.. 2002;88:624-627.
94. Korenaga S, Takeda K, Ito Y. Differential effects of halothane on airway nerves and muscle. Anesthesiology. 1984;60:309-318.
95. Bhatt SB, Kendall AP, Lin ES, Oh TE. Resistance and additional inspiratory work imposed by the laryngeal mask airway: a comparison with tracheal tubes. Anaesthesia. 1992;47:343-347.
96. Westbrook PR, Stubbs SE, Sessler AD, Rehder K, Hyatt RE. Effects of anesthesia and muscle paralysis on respiratory mechanics in normal man. J Appl Physiol.. 1973;34:81-86.
97. Scheidt M, Hyatt RE, Rehder K. Effects of rib cage or abdominal restriction on lung mechanics. J Appl Physiol.. 1981;51:1115-1121.
98. Campbell EJM, Nunn JF, Peckett BW. A comparison of artificial ventilation and spontaneous respiration with particular reference to ventilation-blood-flow relationships. Br J Anaesth.. 1958;30:166-175.
99. Nunn JF, Hill DW. Respiratory dead space and arterial to end-tidal CO2 tension difference in anesthetized man. J Appl Physiol.. 1960;15:383-389.
100. Casati A, Fanelli G, Torri G. Physiological dead space/tidal volume ratio during face mask, laryngeal mask, and cuffed oropharyngeal airway spontaneous ventilation. J Clin Anesth.. 1998;10:652-655.
101. Kain ML, Panday J, Nunn JF. The effect of intubation on the dead space during halothane anaesthesia. Br J Anaesth.. 1969;41:94-102.
102. Tokics L, Hedenstierna G, Svensson L, et al.  distribution and correlation to atelectasis in anesthetized paralyzed humans. J Appl Physiol.. 1996;81:1822-1833.
103. Hedenstierna G. Contribution of the multiple inert gas elimination technique to pulmonary medicine 6: Ventilation-perfusion relationships during anaesthesia. Thorax. 1995;50:85-91.
104. Rehder K, Knopp TJ, Sessler AD, Didier EP. Ventilation-perfusion relationship in young healthy awake and anesthetized-paralyzed man. J Appl Physiol.. 1979;47:745-753.
105. Nunn JF. Oxygen – friend and foe. J R Soc Med.. 1985;78:618-622.
106. Bindslev L, Hedenstierna G, Santesson J, Gottlieb I, Carvallhas A. Ventilation-perfusion distribution during inhalation anaesthesia. Acta Anaesthesiol Scand.. 1981;25:360-371.
107. Dueck R, Young I, Clausen J, Wagner PD. Altered distribution of pulmonary ventilation and blood flow following induction of inhalational anesthesia. Anesthesiology. 1980;52:113-125.
108. Nunn JF, Bergman NA, Coleman AJ. Factors influencing the arterial oxygen tension during anaesthesia with artificial ventilation. Br J Anaesth.. 1965;37:898-914.
109. Anjou-Lindskog E, Broman L, Broman M, Holmgren A, Settergren G, Öhqvist G. Effects of intravenous anesthesia on VA/Q distribution: a study performed during ventilation with air and with 50% oxygen, supine and in the lateral position. Anesthesiology. 1985;62:485-492.
110. Nunn JF, Ezi-Ashi TI. The respiratory effects of resistance to breathing in anesthetized man. Anesthesiology. 1961;22:174-185.
111. Moote CA, Knill RL, Clement J. Ventilatory compensation for continuous inspiratory resistive and elastic loads during halothane anesthesia in humans. Anesthesiology. 1986;64:582-589.
112. Drummond GB, Cullen JP. Detection of inspiratory resistive loads after anaesthesia for minor surgery. Br J Anaesth.. 1997;78:308-310.
113. Isono S, Nishino T, Sugimori K, Misuguchi T. Respiratory effects of expiratory flow-resistive loading in conscious and anesthetized humans. Anesth Analg.. 1990;70:594-599.
114. Marshall BE, Marshall C. Anesthesia and the pulmonary circulation. In: Covino BG, Fozzard HA, Rehder K, Strichartz G, editors. Effects of Anesthesia. Bethesda, Md: American Physiological Society, 1985.
115. Eisenkraft JB. Effects of anaesthetics on the pulmonary circulation. Br J Anaesth.. 1990;65:63-78.
116. Pelosi P, Croci M, Ravagnan I, et al. The effects of body mass on lung volumes, respiratory mechanics, and gas exchange during anesthesia. Anesth Analg.. 1998;87:654-660.
117. Pelosi P, Ravagnan I, Giurati G, et al. Positive end-expiratory pressure improves respiratory function in obese but not in normal subjects during anaesthesia and paralysis. Anesthesiol.. 1999;91:1221-1231.
118. Yoshino J, Akata T, Takahashi S. Intraoperative changes in arterial oxygenation during volume-controlled mechanical ventilation in modestly obese patients undergoing laparotomies with general anesthesia. Acta Anaesthesiol Scand.. 2003;47:742-750.
119. Klingstedt C, Hedenstierna G, Baehrendtz S, et al. Ventilation-perfusion relationships and atelectasis formation in the supine and lateral positions during conventional mechanical and differential ventilation. Acta Anaesthesiol Scand.. 1990;34:421-429.
120. Krayer S, Rehder K, Vettermann J, Didier P, Ritman EL. Position and motion of the human diaphragm during anesthesia-paralysis. Anesthesiology. 1989;70:891-898.
121. Cardiopulmonary physiology and pathophysiology as a consequence of laparoscopic surgery. Chest 1996; 110: 810–15.
122. O’Malley C, Cunningham AJ. Physiologic changes during laparoscopy. Anesthesiol Clin North America. 2001;19:1-19.
123. Sprung J, Whalley DG, Falcone T, Warner DO, Hubmayr RD, Hammel J. The impact of morbid obesity, pneumoperitoneum, and posture on respiratory system mechanics and oxygenation during laparoscopy. Anesth Analg.. 2002;94:1345-1350.
124. Andersson L, Lagerstrand L, Thörne A, Sollevi A, Brodin L-Å, Odeberg-Wernerman S. Effect of CO2 pneumoperitoneum on ventilation-perfusion relationships during laparoscopic cholecystectomy. Acta Anaesthesiol Scand.. 2002;46:552-560.
125. Kazama T, Ikeda K, Kato T, Kikura M. Carbon dioxide output in laparoscopic cholecystectomy. Br J Anaesth.. 1996;76:530-535.
126. Veering BT, Cousins MJ. Cardiovascular and pulmonary effects of epidural anaesthesia. Anesth Int Care. 2000;28:620-635.
127. Sakura S, Saito Y, Kosaka Y. The effects of epidural anesthesia on ventilatory response to hypercapnia and hypoxia in elderly patients. Anesth Analg.. 1996;82:306-311.
128. Sakura S, Saito Y, Kosaka Y. Effect of extradural anaesthesia on the ventilatory response to hypoxaemia. Anaesthesia. 1993;48:205-209.
129. Sakura S, Saito Y, Kosaka Y. Effect of lumbar epidural anesthesia on ventilatory response to hypercapnia in young and elderly patients. J Clin Anesth.. 1993;5:109-113.
130. Labaille T, Clergue F, Samii K, Ecoffey C, Berdeaux A. Ventilatory response to CO2 following intravenous and epidural lidocaine. Anesthesiology. 1985;63:179-185.
131. Warner DO, Warner MA, Ritman EL. Human chest wall function during epidural anesthesia. Anesthesiology. 1996;85:761-773.
132. Moir DD. Ventilatory function during epidural analgesia. Br J Anaesth.. 1963;35:3-7.
133. Kelly MC, Fitzpatrick KTJ, Hill DA. Respiratory effects of spinal anaesthesia for Caesarean section. Anaesthesia. 1996;51:1120-1122.
134. Gamil M. Serial peak expiratory flow rates in mothers during caesarean section under extradural anaesthesia. Br J Anaesth.. 1989;62:415-418.
135. Yun E, Topulos GP, Body SC, Datta S, Bader AM. Pulmonary function changes during epidural anesthesia for Cesarean delivery. Anesth Analg.. 1996;82:750-753.
136. Reber A, Bein T, Högman M, Khan ZP, Nilsson S, Hedenstierna G. Lung aeration and pulmonary gas exchange during lumbar epidural anaesthesia and in the lithotomy position in elderly patients. Anaesthesia. 1998;53:854-861.
137. Jones JG, Sapsford DJ, Wheatley RG. Postoperative hypoxaemia: mechanisms and time course. Anaesthesia. 1990;45:566-573.
138. Moller JT, Johannessen NW, Berg H, Espersen K, Larsen LE. Hypoxaemia during anaesthesia – an observer study. Br J Anaesth.. 1991;66:437-444.
139. Liu S, Carpenter RL, Neal JM. Epidural anesthesia and analgesia: their role in postoperative outcome. Anesthesiology. 1995;82:1474-1506.
140. McKeague H, Cunningham AJ. Postoperative respiratory dysfunction: is the site of surgery crucial. Br J Anaesth.. 1997;79:415-416.
141. Couture JD, Chartrand D, Gagner M, Bellemare F. Diaphragmatic and abdominal muscle activity after endoscopic cholecystectomy. Anesth Analg.. 1994;78:733-739.
142. Strandberg A, Tokics L, Brismar B, Lundquist H, Hedenstierna G. Atelectasis during anaesthesia and in the postoperative period. Acta Anaesthesiol Scand.. 1986;30:154-158.
143. Drummond GB. Diaphragmatic dysfunction: an outmoded concept. Br J Anaesth.. 1998;80:277-280.
144. Nimmo AF, Drummond GB. Respiratory mechanics after abdominal surgery measured with continuous analysis of pressure, flow and volume signals. Br J Anaesth.. 1996;77:317-326.
145. Keller C, Brimacombe J. Bronchial mucus transport velocity in paralyzed anesthetized patients: a comparison of the laryngeal mask airway and cuffed tracheal tube. Anesth Analg.. 1998;86:1280-1282.