Chapter 4 Respiratory system resistance
 Gas flow in the airway is a mixture of laminar and turbulent flow, becoming more laminar in smaller airways. Respiratory system resistance is a combination of resistance to gas flow in the airways and resistance to deformation of tissues of both the lung and chest wall.
Elastic resistance, which occurs when no gas is flowing, results from only two of the numerous causes of impedance to inflation of the lung (listed in the previous chapter). This chapter considers the remaining components, which together are referred to as non-elastic resistance or respiratory system resistance. Most non-elastic resistance is provided by frictional resistance to airflow and thoracic tissue deformation (both lung and chest wall), with small contributions from the inertia of gas and tissue, and compression of intrathoracic gas.1 Unlike elastic resistance, work performed against non-elastic resistance is not stored as potential energy (and therefore recoverable), but is lost and dissipated as heat.
Physical Principles of Gas Flow and Resistance
Gas flows from a region of high pressure to one of lower pressure. The rate at which it does so is a function of the pressure difference and the resistance to gas flow, thus being analogous to the flow of an electrical current (Figure 4.1). The precise relationship between pressure difference and flow rate depends on the nature of the flow which may be laminar, turbulent or a mixture of the two. It is useful to consider laminar and turbulent flow as two separate entities but mixed patterns of flow usually occur in the respiratory tract. With a number of important caveats, similar basic considerations apply to the flow of liquids through tubes, which is considered in Chapter 7.
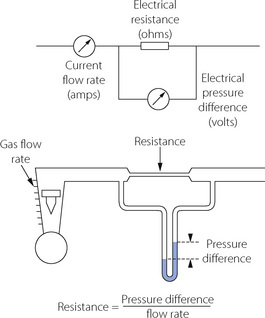
Fig. 4.1 Electrical analogy of gas flow. Resistance is pressure difference per unit flow rate. Resistance to gas flow is analogous to electrical resistance (provided that flow is laminar). Gas flow corresponds to electrical current (amps); gas pressure to potential difference (volts); gas flow resistance to electrical resistance (ohms); and Poiseuille’s law corresponds to Ohm’s law.
Laminar Flow
With laminar flow, gas flows along a straight unbranched tube as a series of concentric cylinders that slide over one another, with the peripheral cylinder stationary and the central cylinder moving fastest, the advancing cone forming a parabola (Figure 4.2A).
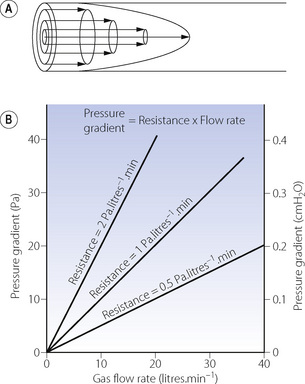
Fig. 4.2 Laminar flow. (A) In laminar flow gas moves along a straight tube as a series of concentric cylinders of gas with the central cylinder moving fastest and the outside cylinder theoretically stationary. This gives rise to a ‘cone front’ of gas velocity across the tube. (B) The linear relationship between gas flow rate and pressure gradient. The slope of the lines indicates the resistance (1 Pa = 0.01 cmH2O).
The advancing cone front means that some fresh gas will reach the end of a tube while the volume entering the tube is still less than the volume of the tube. In the context of the respiratory tract, this is to say that there may be significant alveolar ventilation when the tidal volume is less than the volume of the airways (the anatomical dead space), a fact that is very relevant to high frequency ventilation (page 473). For the same reason, laminar flow is relatively inefficient for purging the contents of a tube.
In theory, gas adjacent to the tube wall is stationary, so friction between fluid and the tube wall is negligible. The physical characteristics of the airway or vessel wall should therefore not affect resistance to laminar flow. Similarly, the composition of gas sampled from the periphery of a tube during laminar flow may not be representative of the gas advancing down the centre of the tube. To complicate matters further, laminar flow requires a critical length of tubing before the characteristic advancing cone pattern can be established. This is known as the entrance length and is related to the diameter of the tube and the Reynolds’ number of the fluid (see below).
Quantitative relationships. With laminar flow the gas flow rate is directly proportional to the pressure gradient along the tube (Figure 4.2B), the constant being thus defined as resistance to gas flow:

In a straight unbranched tube, the Hagen–Poiseuille equation allows gas flow to be quantified:
By combining these two equations:
In this equation the fourth power of the radius of the tube explains the critical importance of narrowing of air passages. With constant tube dimensions, viscosity is the only property of a gas that is relevant under conditions of laminar flow. Helium has a low density but a viscosity close to that of air and will not therefore improve gas flow if the flow is laminar (page 46).
In the Hagen–Poiseuille equation, the units must be coherent. In CGS units, dyn.cm−2 (pressure), ml.s−1 (flow) and cm (length and radius) are compatible with the unit of poise for viscosity (dyn.sec.cm−2). In SI units, with pressure in kilopascals, the unit of viscosity is newton second.metre−2 (see Appendix A). However, in practice it is still customary to express gas pressure in cmH2O and flow in l.s−1. Resistance therefore continues to usually be expressed as cmH2O per litre per second (cmH2O.l−1.s).
Turbulent Flow
High flow rates, particularly through branched or irregular tubes, result in a breakdown of the orderly flow of gas described above. An irregular movement is superimposed on the general progression along the tube (Figure 4.3A), with a square front replacing the cone front of laminar flow. Turbulent flow is almost invariably present when high resistance to gas flow is a problem.
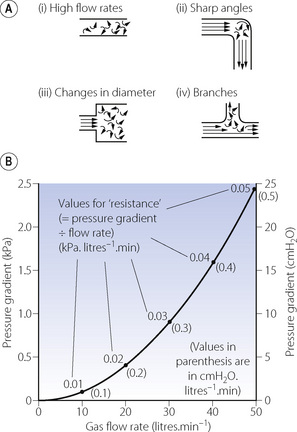
Fig. 4.3 Turbulent flow. (A) Four circumstances under which gas flow tends to be turbulent. (B) The square law relationship between gas flow rate and pressure gradient when flow is turbulent. Note that the value for ‘resistance’, calculated as for laminar flow, is quite meaningless during turbulent flow.
The square front means that no fresh gas can reach the end of a tube until the amount of gas entering the tube is almost equal to the volume of the tube. Turbulent flow is more effective than laminar flow in purging the contents of a tube, and also provides the best conditions for drawing a representative sample of gas from the periphery of a tube. Frictional forces between the tube wall and fluid become more important in turbulent flow.
Quantitative relationships. The relationship between driving pressure and flow rate differs from the relationship described above for laminar flow in three important respects:
The square law relating driving pressure and flow rate is shown in Figure 4.3B. Resistance, defined as pressure gradient divided by flow rate, is not constant as in laminar flow but increases in proportion to the flow rate. Units such as cmH2O.l−1.s should therefore be used only when flow is entirely laminar. The following methods of quantification of ‘resistance’ should be used when flow is totally or partially turbulent.

k1 contains the factors of the Hagen–Poiseuille equation and represents the laminar flow component while k2 includes factors in the corresponding equation for turbulent flow. Mead & Agostoni2 summarised studies of normal human subjects in the following equation:

In this equation n has a value ranging from 1 with purely laminar flow, to 2 with purely turbulent flow, the value of n being a useful indication of the nature of the flow. The constants for the normal human respiratory tract are:

Reynolds’ Number
In the case of long straight unbranched tubes, the nature of the gas flow may be predicted from the value of Reynolds’ number, which is a non-dimensional quantity derived from the following expression:
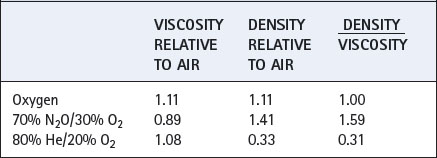
The property of the gas that affects Reynolds’ number is the ratio of density to viscosity. When Reynolds’ number is less than 2000, flow is predominantly laminar, whereas above a value of 4000, flow is mainly turbulent.3 Between these values, both types of flow coexist. Reynolds’ number also affects the entrance length, that is the distance required for laminar flow to become established, which is derived from:
Thus for gases with a low Reynolds’ number not only will resistance be less during turbulent flow but laminar flow will become established more quickly after bifurcations, corners and obstructions.
Values for some gas mixtures that a patient may inhale are shown relative to air in Table 4.1. Viscosities of respirable gases do not differ greatly but there may be very large differences in density.
Respiratory System Resistance
Airway Resistance
This results from frictional resistance in the airways. In the healthy subject, the small airways make only a small contribution to total airway resistance because their aggregate cross-sectional area increases to very large values after about the eighth generation (see Figure 2.4). Overall airway resistance is therefore dominated by the resistance of the larger airways.
Gas flow along pulmonary airways is very complex when compared to the theoretical tubes described above, and consists of a varying mixture of both laminar and turbulent flow. Both the velocity of gas flow and airway diameter (and therefore Reynolds’ number) decrease in successive airway generations from a maximum in the trachea to almost zero at the start of the pulmonary acinus (generation 15). In addition, there are frequent divisions with variable lengths of approximately straight airway between. Finally, in large diameter airways entrance length is normally greater than the length of the individual airway. As a result of these purely physical factors laminar flow cannot become established until approximately the 11th airway generation. Predominantly turbulent flow in the conducting airways has two practical implications. First, the physical characteristics of the airway lining will influence frictional resistance more with turbulent than with laminar flow, so changes in airway lining fluid consistency (page 218) will have a significant effect. Second, gas mixtures containing helium (low Reynolds’ number) are more beneficial in overcoming increased resistance in large airways and of less benefit in small airway disease such as asthma.
Tissue Resistance
In 1955 Mount identified a component of the work of breathing which he attributed to the resistance caused by tissue deformation.4 D’Angelo et al5 subsequently described how, in anaesthetised and paralysed subjects, the viscoelastic ‘tissue’ component of respiratory resistance may be measured.
Figure 4.4 shows the ‘spring and dashpot’ model, which D’Angelo et al5 used to illustrate this component of respiratory resistance. Dashpots here represent resistance, and springs elastance (reciprocal of compliance). Upward movement of the upper bar represents an increase in lung volume, caused by contraction of the inspiratory muscles or the application of inflation pressure as shown in the diagram. There is good evidence that, in humans, the left hand dashpot represents predominantly airway resistance. The spring in the middle represents the static elastance of the respiratory system. On the right there is a spring and dashpot arranged in series. With a rapid change in lung volume, the spring is extended while the piston is more slowly rising in the dashpot. In due course (approx 2–3 seconds) the spring returns to its original length and so ceases to exert any influence on pressure/volume relationships. This spring therefore represents the time dependent element of elastance. While it is still under tension at end-inspiration, the combined effect of the two springs results in a high elastance of which the reciprocal is the dynamic compliance. If inflation is held for a few seconds and movement of the piston through the right hand dashpot is completed, the right hand spring ceases to exert any tension and the total elastance is reduced to that caused by the spring in the middle. The reciprocal of this elastance is the static compliance, which is therefore greater than the dynamic compliance. D’Angelo et al5 stress that the system shown in Figure 4.4 is only a simplified scheme to which many further components could be added; nevertheless the model accords well with experimental findings.
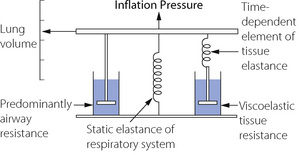
Fig. 4.4 The spring and dashpot model of D’Angelo et al.5 Inflation of the lungs is represented by the bar moving upwards. The springs represent elastance (reciprocal of compliance) and the dashpots resistance. The spring and dashpot in series on the right confers time dependence which is due to viscoelastic tissue resistance.
The time dependent change in compliance represented by the spring and dashpot in series could be due to many factors. Redistribution of gas makes only a negligible contribution in normal man, the major component being due to viscoelastic flow resistance in tissue.1,5 In anaesthetised healthy subjects tissue resistance is of the order of half of the respiratory system resistance,5 and seems to be largely unaffected by end-expiratory pressure or tidal volume.6 Tissue resistance originates from both lung and chest wall tissues with a significant proportion originating in the chest wall.6,7,8 The magnitude and importance of this component, particularly in lung disease, has often been underestimated and it is clearly important to distinguish airway resistance from that afforded by the total respiratory system. Separate measurement of tissue resistance is described below.
Inertance as a Component of Respiratory System Resistance
Respired gases, the lungs and the thoracic cage all have appreciable mass and therefore inertia, which must offer an impedance to change in direction of gas flow, analogous to electrical inductance. This component, termed inertance, is extremely difficult to measure, but inductance and inertance offer an impedance that increases with frequency. Therefore, although inertance is generally believed to benegligible at normal respiratory frequencies, it may become appreciable during high frequency ventilation (Chapter 32).
Factors Affecting Respiratory Resistance
In normal lungs respiratory resistance is controlled by changes in airway diameter mainly in small airways and bronchioles. This would be expected to alter only the airway component of respiratory resistance but animal studies suggest that contraction of bronchial smooth muscle also causes changes in tissue resistance. It is thought that airway constriction distorts the surrounding tissue sufficiently to alter its viscoelastic properties.9 Airway calibre may be reduced by either physical compression (due to a reversal of the normal transluminal pressure leading to airway collapse) or by contraction of the smooth muscle in the airway wall.
Volume-Related Airway Collapse
Effect of lung volume on resistance to breathing. Whenthe lung volume is reduced, there is a proportional reduction in the volume of all air-containing components, including the air passages. Thus, if other factors (such as bronchomotor tone) remain constant, airway resistance is an inverse function of lung volume (Figure 4.5) and there is a direct relationship between lung volume and the maximum expiratory flow rate that can be attained (see below). Quantifying airway diameter is difficult from these curves. It is therefore more convenient to refer to conductance, which is the reciprocal of resistance and usually expressed as litres per second per cmH2O. Specific airway conductance (sGaw) is the airway conductance relative to lung volume or the gradient of the line showing conductance as a function of lung volume (Figure 4.5). Because it takes into account the important effect of lung volume on airway resistance, it is a useful index of bronchomotor tone.
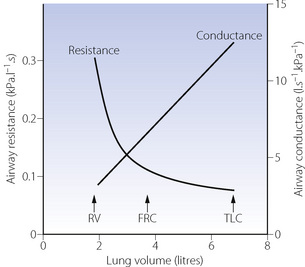
Fig. 4.5 Airway resistance and conductance as a function of lung volume (upright posture). The resistance curve is a hyperbola. Specific conductance (sGaw) is the gradient of the conductance line. RV, residual volume; FRC, functional residual capacity; TLC, total lung capacity.
Gas trapping. At low lung volumes, flow-related airway collapse (see below) occurs more readily because airway calibre and the transmural pressure are less. Expiratory airway collapse gives rise to a ‘valve’ effect and gas becomes trapped distal to the collapsed airway, leading to an increase in residual volume and FRC. Thus, in general, increasing lung volume reduces airway resistance and helps to prevent gas trapping. This is most conveniently achieved by the application of continuous positive airway pressure (CPAP) to the spontaneously breathing subject or positive end-expiratory pressure (PEEP) to the paralysed ventilated patient (Chapter 32). Many patients with obstructive airways disease acquire the habit of increasing their expiratory resistance by exhaling through pursed lips. Alternatively, premature termination of expiration keeps the lung volume above FRC (intrinsic PEEP, page 476). Both manoeuvres have the effect of enhancing airway transmural pressure gradient and so reducing airway resistance and preventing trapping.
The closing capacity.10,11 In addition to the overall effect on airway resistance shown in Figure 4.5, there are important regional differences. This is because the airways and alveoli in the dependent parts of the lungs are always smaller than those at the top of the lung, except at total lung capacity or at zero gravity when all are the same size. As the lung volume is reduced towards residual volume, there is a point at which dependent airways begin to close, and the lung volume at which this occurs is known as the closing capacity (CC). The alternative term, closing volume (CV), equals the closing capacity minus the residual volume (RV) (Figure 4.6). Closing capacity increases linearly with age and is less than FRC in young adults but increases to become equal to FRC at a mean age of 44 years in the supine position and 75 years in the upright position (see Figure 3.11). The closing capacity seems to be independent of body position but the FRC changes markedly with position (see Figure 3.10).
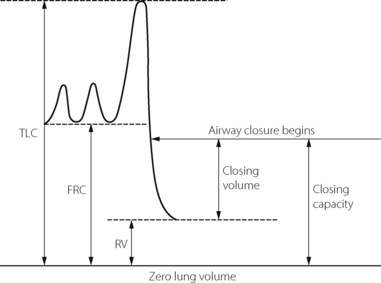
Fig. 4.6 Spirogram to illustrate the relationship between closing volume and closing capacity. This example would be in a young adult with closing capacity less than functional residual capacity (FRC). RV, residual volume; TLC, total lung capacity.
When the FRC is less than the closing capacity, some of the pulmonary blood flow will be distributed to alveoli with closed airways, usually in the dependent parts of the lungs. This will constitute a shunt (page 132), and must increase the alveolar/arterial Po2 gradient. If the alveolar Po2 remains the same, the arterial Po2 must be decreased. This can be seen when volunteers breathe below their FRC, and is particularly marked in older subjects who have a greater closing capacity. Shunting of blood through areas of the lung with closed airways is an important cause of decreasing arterial Po2 with increasing age (page 194) and changes of position (page 335). Reduction in FRC is closely related to the increased alveolar/arterial Po2 gradient seen during anaesthesia (page 334).
Flow-Related Airway Collapse
All the airways can be compressed by reversal of the normal transmural pressure gradient to a sufficiently high level. The cartilaginous airways have considerable structural resistance to collapse but even the trachea may be compressed with an external pressure in the range 5–7 kPa (50–70 cmH2O) or when the gas velocity through it becomes suitably high.12 Airways beyond generation 11 have no structural rigidity (see Table 2.1) and rely instead on the traction on their walls from elastic recoil of the lung tissue in which they are embedded. They can be collapsed by a reversed transmural pressure gradient that is considerably less than that which closes the cartilaginous airways.
Reversal of the transmural pressure gradient may be caused by high levels of air flow during expiration. During all phases of normal breathing, the pressure in the lumen of the air passages should always remain well above the subatmospheric pressure in the thorax, so the airways remain patent. During a maximal forced expiration, the intrathoracic pressure rises to well above atmospheric, resulting in high gas flow rates. Pressure drops as gas flows along the airways and there will therefore be a point at which airway pressure equals the intrathoracic pressure. At that point (the equal pressure point) the smaller air passages are held open only by the elastic recoil of the lung parenchyma in which they are embedded or, if it occurs in the larger airways, by their structural rigidity. Downstream of the equal pressure point, the transmural pressure gradient is reversed and at some point may overcome the forces holding the airways open, resulting in airway collapse. This effect is also influenced by lung volume (see above) and the equal pressure point moves progressively down towards the smaller airways as lung volume is decreased.
Flow related collapse is best demonstrated on a flow/volume plot. Figure 4.7 shows the normal relationship between lung volume on the abscissa and instantaneous respiratory flow rate on the ordinate. Time is not directly indicated. In part (A) of the figure the small loop shows a normal tidal excursion above FRC and with air flow rate either side of zero. Arrows show the direction of the trace. At the end of a maximal expiration the black square indicates residual volume. The lower part of the large curve then shows the course of a maximal inspiration to TLC (black circle). There follow four expiratory curves, each with different expiratory effort and each attaining a different peak expiratory flow rate. Within limits, the greater the effort, the greater is the resultant peak flow rate. However, all the expiratory curves terminate in a final common pathway, which is independent of effort. In this part of the curves, the flow rate is limited by airway collapse and the maximal air flow rate is governed by the lung volume (abscissa). The greater the effort the greater the degree of airway collapse and the resultant gas flow rate remains the same. Figure 4.7B shows the importance of a maximal inspiration before measurement of peak expiratory flow rate.
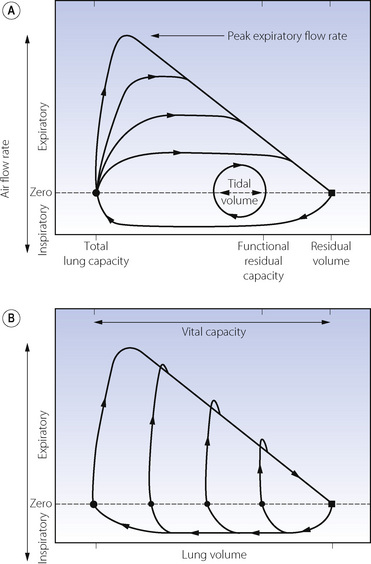
Fig. 4.7 Normal flow/volume curves. Instantaneous air flow rate (ordinate) is plotted against lung volume (abscissa). (A) The normal tidal excursion is shown as the small loop. In addition, expiration from total lung capacity at four levels of expiratory effort are shown. Within limits, peak expiratory flow rate is dependent on effort but, during the latter part of expiration, all curves converge on an effort-independent section where flow rate is limited by airway collapse. (B) The effect of forced expirations from different lung volumes. The pips above the effort-independent section probably represent air expelled from collapsed airways.
Muscular Control of Airway Diameter
Small airways are the site of most of the important causes of obstruction in a range of pathological conditions described in Chapter 28. Four pathways are involved in controlling muscle tone in small bronchi and bronchioles:
These may conveniently be considered as discrete mechanisms but in practice there is considerable interaction between them, particularly in disease. Neural control is the most important in normal lung, with direct stimulation and humoral control contributing under some circumstances. Cellular mechanisms, particularly mast cells, have little influence under normal conditions but are important in airway disease (Chapter 28).
Neural Pathways13,14
Parasympathetic system.3 This system is of major importance in the control of bronchomotor tone and when activated can completely obliterate the lumen of small airways.13 Both afferent and efferent fibres travel to the lung in the vagus nerve with efferent ganglia in the walls of small bronchi. Afferents arise from receptors under the tight junctions of the bronchial epithelium and respond either to noxious stimuli acting directly on the receptors (see below) or from cytokines released by cellular mechanisms such as mast cell degranulation. Efferent nerves release acetylcholine (ACh), which acts at M3 muscarinic receptors to cause contraction of bronchial smooth muscle, whilst also stimulating M2 pre-junctional muscarinic receptors to exert negative feedback on ACh release.3 A complex series of second messengers is involved in bringing about smooth muscle contraction in response to ACh (see below). Stimulation of any part of the reflex arc results in bronchoconstriction. Some degree of resting tone is normally present14 and may therefore permit some degree of bronchodilation when vagal tone is reduced in a similar fashion to vagal control of heart rate.
Sympathetic system. In contrast to the parasympathetic system, the sympathetic system is poorly represented in the lung and not yet proven to be of major importance in humans. Indeed it appears unlikely that there is any direct sympathetic innervation of the airway smooth muscle, although there may be an inhibitory effect on cholinergic neurotransmission in some species.
Non-cholinergic parasympathetic nerves.14,15 The airways are provided with a third autonomic control which is neither adrenergic nor cholinergic. This is the only potential bronchodilator nervous pathway in man, though the exact role of these nerves in humans remains uncertain. The efferent fibres run in the vagus nerve and pass to the smooth muscle of the airway where they cause slow (several minutes) and prolonged relaxation of bronchi. The neurotransmitter is vasoactive intestinal peptide (VIP), which produces airway smooth muscle relaxation by promoting the production of nitric oxide (NO). How NO brings about smooth muscle relaxation in the airway is not as fully understood as its effect on vascular smooth muscle. It seems likely that NO has its effect without having to cross the cell membrane by some form of cell surface interaction that produces activation of guanylate cyclase to produce cyclic GMP and muscle relaxation.16 Resting airway tone does involve bronchodilation by NO, but whether this is from local cellular production of NO or non-cholinergic parasympathetic nerves and VIP-mediated release of NO is not clear.13
Humoral Control3,17
In spite of the minimal significance of sympathetic innervation, bronchial smooth muscle has plentiful β2-adrenergic receptors, which are highly sensitive to circulating adrenaline, and once again act via complex second messenger systems described below.18 Basal levels of adrenaline probably do not contribute to bronchial muscle tone, but this mechanism is brought into play during exercise or during the sympathetic ‘stress response’. There are a few α-adrenergic receptors which are bronchoconstrictor but unlikely to be of clinical significance.
Physical and Chemical Effects
Direct stimulation of the respiratory epithelium activates the parasympathetic reflex described above causing bronchoconstriction. Physical factors known to produce bronchoconstriction include mechanical stimulation of the upper air passages by laryngoscopy and the presence of foreign bodies in the trachea or bronchi. Inhalation of particulate matter, an aerosol of water or just cold air may cause bronchoconstriction, the latter being used as a simple provocation test. Many chemical stimuli result in bronchoconstriction including liquids with low pH such as gastric acid and gases such as sulphur dioxide, ammonia, ozone and nitrogen dioxide.
Local Cellular Mechanisms
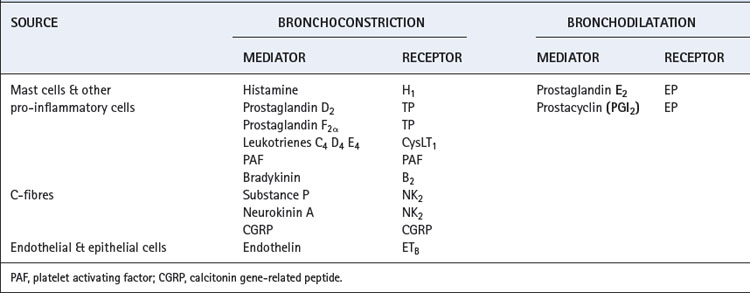
Inflammatory cells in the lung include mast cells, eosinophils, neutrophils, macrophages and lymphocytes and the role of these cells in lung infection and inflammation is described in Chapters 28, 30 and 31. These inflammatory cells are all stimulated by a variety of pathogens, but some may also be activated by the direct physical factors described in the previous paragraph. Once activated, cytokine production causes amplification of the response, and a variety of mediators are released that can cause bronchoconstriction (Table 4.2). These mediators are produced in normal individuals, but patients with airway disease are usually ‘hyper-responsive’ and so develop symptoms of bronchospasm more easily.
Drug Effects on Airway Smooth Muscle
β2 Agonists
Non-specific β-adrenoreceptor agonists (e.g. isoprenaline) were the first bronchodilator drugs to be widely used for treating asthma. However, cardiac effects from β1 receptor stimulation in the heart were believed to be responsible for an increase in mortality during acute asthma, and the development of β2 specific drugs (e.g. salbutamol, terbutaline) soon followed. Later, long-acting β2-agonists (e.g. salmeterol) were developed and are now widely used for treating asthma. The therapeutic effect of β2-agonists is more complex than simple relaxation of airway smooth muscle as they are also known to inhibit the secretion of inflammatory cytokines and most of the bronchoconstrictor mediators shown in Table 4.2,21 and even to increase surfactant release.22 Controversy associated with β2-agonists still continues today – their effect on inflammatory cells and ability to down-regulate β2 receptors are both potentially harmful,23 and concerns now exist about the mortality of some groups of patients taking long-acting β2-agonists.24 These observations have contributed to the gradual move away from β2-agonists in asthma therapy (page 409).
The β>2 receptor. The molecular basis of the functional characteristics of the β adrenoceptor are now clearly elucidated.25 It contains 413 amino acids and has seven transmembrane helices (Figure 4.8). The agonist binding site is within this hydrophobic core of the protein, which sits within the lipid bilayer of the cell membrane. This affects the interaction of drugs at the binding site in that more lipophilic drugs form a depot in the lipid bilayer from which they can repeatedly interact with the binding site of the receptor, producing a much longer duration of action than hydrophilic drugs. Receptors exist in either activated or inactivated form, the former state occurring when the 3rd intracellular loop (Figure 4.8) is bound to GTP and the α-subunit of the Gs-protein. β2 receptor agonists probably do not induce a significant conformational change in the protein structure but simply stabilise the activated form allowing this to predominate.
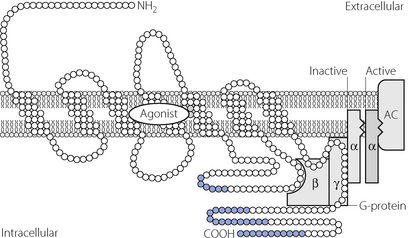
Fig. 4.8 Molecular mechanisms of β2-adrenoceptor stimulation. The receptor exists in activated and inactivated states according to whether or not the α subunit of the G-protein is bound to adenyl cyclase (AC). The agonist binds to three amino acid residues on the third and fifth transmembrane domains, and by doing so stabilises the receptor G-protein complex in the activated state. The intracellular C-terminal region of the protein (blue) is the area susceptible to phosphorylation by intracellular kinases causing inactivation of the receptor and down-regulation.
Activation of the G-protein by the β2 receptor in turn activates adenylate cyclase to convert adenosine triphosphate to cyclic adenosine monophosphate (cAMP).25 Cyclic-AMP causes relaxation of the muscle cell by inhibition of calcium release from intracellular stores and probably also activates protein kinase A to phosphorylate some of the regulatory proteins involved in the actin–myosin interaction.
Two β2 receptor genes are present in humans, with a total of 18 polymorphisms described,26 giving rise to a large number of possible phenotypes. Studies of these phenotypes continue, with some clinical differences being observed between individuals,25 but the contribution that different β2 receptor phenotypes make to the overall prevalence of asthma appears to be minimal.26,27
Phosphodiesterase Inhibitors28
After its production following β2 receptor stimulation, cAMP is rapidly hydrolysed by the intracellular enzyme phosphodiesterase (PDE), inhibition of which will therefore prolong the smooth muscle relaxant effect of β2 receptor stimulation. Seven subgroups of PDE have now been identified, with subgroups PDE3 and PDE4 occurring in airway smooth muscle, but the PDE inhibitors currently used in asthma such as theophylline are non-specific for the different subgroups.19 This lack of specificity of currently used PDE inhibitors accounts for their wide ranging side effects, which continue to limit their therapeutic use.
Anticholinergic Drugs
The ACh receptor. Stimulation of M3 ACh receptors also activates a G-protein, characterised as Gq. This in turn activates phospholipase C to stimulate the production of inositol triphosphate (IP3), which then binds to sarcoplasmic reticulum receptors causing release of calcium from intracellular stores. The elevation of intracellular calcium activates myosin light chain kinase, which phosphorylates part of the myosin chain to activate myosin ATPase and initiate crossbridging between actin and myosin.19 IP3 is converted into the inactive inositol diphosphate by IP3 kinase. Tachykinin, histamine and leukotriene receptors responsible for broncho-constriction from other mediators (Table 4.2) act by a very similar mechanism, being linked to G-protein–phospholipase C complexes, which lead to IP3 formation.29
There are now believed to be many molecular interactions between the IP3 and cAMP signalling pathways. Activation of phospholipase C by protein Gq also liberates intracellular diacylglycerol that activates another membrane-bound enzyme protein kinase C. This enzyme is able to phosphorylate a variety of proteins including G-proteins and the β2 receptor itself (Figure 4.8) causing uncoupling of the receptor from the G-protein and down-regulation of the transduction pathway.19,25
Anticholinergic drugs used in the airway are classified into short acting (e.g. ipratropium) or long acting (e.g. tiotropium) types. They are more useful in treating chronic obstructive pulmonary disease than asthma (Chapter 28), because only in the former disease is increased parasympathetic activity thought to contribute to symptoms. These drugs have similar binding affinities for both M2 and M3 receptors, giving rise to opposing effects on the degree of stimulation of airway smooth muscle. Differences in relative numbers of M2 and M3 receptors between individuals and in different disease states13 will therefore explain the variability in response seen with inhaled anticholinergic drugs.
Leukotriene Antagonists30
Even in non-asthmatic individuals, leukotrienes are potent bronchoconstrictors, so the therapeutic potential of leukotriene antagonists has been extensively investigated. Activation of phospholipase A2 by inflammatory cells initiates the pathway, which ultimately produces three leukotrienes (Table 4.2, Figure 4.9). In the lung, these all act via a single receptor (CysLT1) on airway smooth muscle cells to cause contraction via the G-protein–IP3 system described above. Leukotrienes have a wide range of activities apart from bronchoconstriction, in particular amplification of the inflammatory response by chemotaxis of eosinophils.
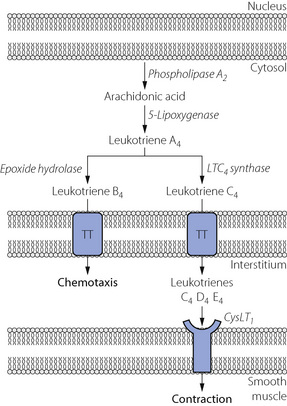
Fig. 4.9 The leukotriene pathway in the lung. Inflammatory mediators stimulate phospholipase A2 to produce arachidonic acid from the phospholipid of the nuclear membrane. Leukotrienes B4 and C4 leave the cell via a specific transmembrane transporter (TT) protein. Non-specific peptidases in the interstitium convert leukotriene C4 into D4 and E4, all of which stimulate the CysLT1 receptor to cause intense broncho-constriction.
(After reference 30.)
As may be predicted from their actions, antagonists of the CysLT1 receptor (e.g. montelukast, zafirlukast) are not effective in treating acute bronchoconstriction, but are useful in situations when the leukotriene pathway has been activated by stimulation of inflammatory cells. They are therefore most likely to be of benefit in prevention of bronchospasm in chronic asthma, but their place in asthma therapy remains uncertain.
Compensation for Increased Resistance to Breathing
In animals, very little compensation for resistive loading occurs until Pco2 increases, which stimulates ventilation and overcomes the resistance. In humans the response is more complex.
Inspiratory resistance. The normal response to increased inspiratory resistance is increased inspiratory muscle effort with little change in the FRC. Accessory muscles may be brought into play according to the degree of resistance.
There are two principal mechanisms of compensation for increased inspiratory resistance. The first operates immediately and even during the first breath in which resistance is applied. It seems probable that the muscle spindles indicate that the inspiratory muscles have failed to shorten by the intended amount and their afferent discharge then augments the activity in the motoneurone pool of the anterior horn. This is the typical servo operation of the spindle system with which the intercostal muscles are richly endowed (page 89). This reflex, mediated at the spinal level, is preserved during general anaesthesia (page 345).
In awake humans, the spinal response is accompanied by a further stimulus to ventilation mediated in suprapontine areas of the brain, possibly in the cerebral cortex.31 This ‘behavioural’ response defends ventilation even in the face of significant inspiratory loading, preventing any change in Pco2. If the response does indeed depend on cortical activity, this would explain why resistive loading during physiological sleep can be problematic (Chapter 16).
Expiratory resistance. Expiration against a pressure of up to 1 kPa (10 cmH2O) does not usually result in activation of the expiratory muscles in conscious or anaesthetised subjects. The additional work to overcome this resistance is, in fact, performed by the inspiratory muscles. The subject augments his inspiratory force until he achieves a lung volume (FRC) at which the additional elastic recoil is sufficient to overcome the expiratory resistance (Figure 4.10). The mechanism for resetting the FRC at a higher level probably requires accommodation of the intrafusal fibres of the spindles to allow for an altered length of diaphragmatic muscle fibres due to the obstructed expiration. This would reset the developed inspiratory tension in accord with the increased FRC.32 The conscious subject normally uses his expiratory muscles to overcome expiratory pressures in excess of about 1 kPa (10 cmH2O).
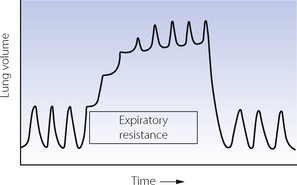
Fig. 4.10 Spirogram showing the response of an anaesthetised patient to the sudden imposition of an expiratory resistance. Note that there is an immediate augmentation of the force of contraction of the inspiratory muscles. This continues with successive breaths until the elastic recoil is sufficient to overcome the expiratory resistance.32
Patients show a remarkable capacity to compensate for acutely increased resistance such that arterial Pco2 is usually normal. However, the efficiency of these mechanisms in maintaining alveolar ventilation carries severe physiological consequences. In common with other muscles, the respiratory muscles can become fatigued and this is a major factor in the onset of respiratory failure. A raised Pco2 in a patient with increased respiratory resistance is therefore always serious. Also, intrathoracic pressure will rise during acutely increased expiratory resistance and so impede venous return and reduce cardiac output (page 479) to the point that syncope may occur.
Principles of Measurement of Respiratory Resistance and Closing Capacity
Respiratory System Resistance
Resistance is determined by the simultaneous measurement of gas flow rate and the driving pressure gradient. In the case of the respiratory tract, the difficulty centres around the measurement of the pressure gradient between mouth and alveolus. Problems also arise because of varying nomenclature and different methods for measuring different components of respiratory system resistance (Table 4.3).33,34 In all cases, apparatus resistance must be measured separately and subtracted from the value obtained in the subject.
Table 4.3 Components of respiratory system resistance33
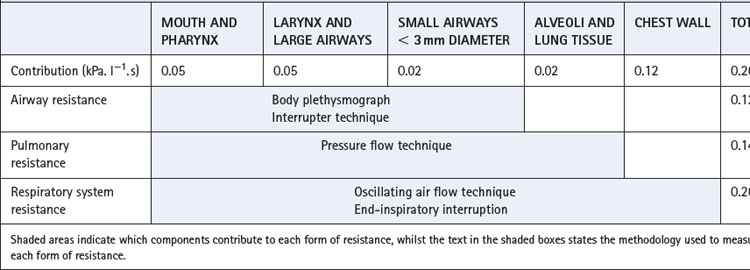
Normal values for total respiratory system resistance are variable because of the large changes with lung volume and methodological differences, but typical values for a healthy male subject are shown in Table 4.3.
Pressure–flow technique. In Chapter 3 it was shown how simultaneous measurement of tidal volume and intrathoracic (oesophageal) pressure yielded the dynamic compliance of the lung (see Figure 3.12). For this purpose, pressures were selected at the times of zero air flow when pressures were uninfluenced by air flow resistance. The same apparatus may be employed for the determination of flow resistance by subtracting the pressure component used in overcoming elastic forces (Figure 4.11). The shaded areas in the pressure trace indicate the components of the pressure required to overcome flow resistance and these may be related to the concurrent gas flow rates.
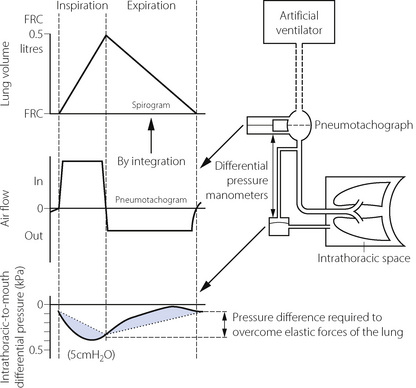
Fig. 4.11 The measurement of pulmonary resistance and dynamic compliance by simultaneous measurement of air flow and intrathoracic-to-mouth differential pressure. The spirogram is conveniently obtained by integration of the pneumotachogram. In the pressure trace, the dotted line shows the pressure changes that would be expected in a hypothetical patient with no pulmonary resistance. Compliance is derived as shown in Figure 3.12. Pulmonary resistance is derived as the difference between the measured pressure differential and that which is required for elastic forces (shaded area) compared with the flow rate shown in the pneumotachograph. Note that the pneumotachogram is a much more sensitive indicator of the no-flow points than the spirogram.
Alternatively, the intrathoracic to mouth pressure gradient and respired volume may be displayed as x and y coordinates of a loop. Figure 3.12 showed how dynamic compliance could be derived from the no-flow points of such a loop. The area of the loop is a function of the work performed against flow resistance.
The use of an oesophageal balloon makes the method a little invasive, but it does allow continuous measurement of resistance. By measuring intrathoracic pressure, the chest wall component of resistance is excluded so providing a measure of pulmonary resistance, which is airways resistance plus the lung component of tissue resistance.
Oscillating air flow. In this technique, a high frequency oscillating air flow is applied to the airways, with measurement of the resultant pressure and air flow changes. By application of alternating current theory it is possible to derive a continuous measurement of airway resistance.35 The technique measures total respiratory resistance, and may be used throughout a vital capacity manoeuvre and so to display resistance as a function of lung volume and derive specific airway conductance.
The body plethysmograph. During inspiration, alveolar pressure falls below ambient as a function of airway resistance and the alveolar gas expands in accord with Boyle’s law. The increased displacement of the body is then recorded as an increase in pressure in the body plethysmograph. Airway resistance may be derived directly from measurements of air flow and pressure changes, and the method requires the subject to perform either a ‘panting’ respiratory manoeuvre or to breathe with a small tidal volume. Despite these requirements plethysmography is generally non-invasive and allows FRC to be measured at the same time,33 but results for airway resistance may be inconsistent.36
The interrupter technique. A single manometer may be used to measure both mouth and alveolar pressure if the air passages distal to the manometer are momentarily interrupted with a shutter. The method is based on the assumption that, while the airway is interrupted, the mouth pressure comes to equal the alveolar pressure. Resistance is then determined from the relationship between flow rate (measured before interruption) and the pressure difference between mouth (measured before interruption) and alveoli (measured at the end of the interruption). Interruption duration must be short enough to avoid disturbing the subject’s breathing pattern but long enough to allow equilibration of pressure along the airway. In practice, interruption is for 50–100 ms occurring repeatedly throughout the respiratory cycle. The technique is adequate for measuring resistance in normal lungs but it is doubtful if equilibration occurs fully in subjects with diseased airways. The interrupter method measures airway resistance and excludes tissue resistance.
End-inspiratory interruption. This method is now widely used for measuring the tissue component of respiratory system resistance.5-837 The method may only be used in anaesthetised paralysed subjects receiving artificial ventilation with accurate control of the respiratory cycle. Following a constant flow inflation of the lung, the airway is occluded for 0.5–3 s before a passive exhalation occurs. To prevent artefacts during the inspiratory pause, numerous successive breaths may be averaged.7 Figure 4.12 shows the changes in gas flow, transpulmonary pressure (Pl), oesophageal pressure and lung volume averaged over 33 breaths. Immediately before occlusion, Pl reaches a value of Pmax, which is governed by both elastic and non-elastic resistance. The fall in pressure following occlusion is biphasic. Immediately after airway occlusion, the Pl falls rapidly to P1 and Pmax − P1 is referred to as interrupter resistance and believed to reflect airway resistance as in the interrupter method already described.
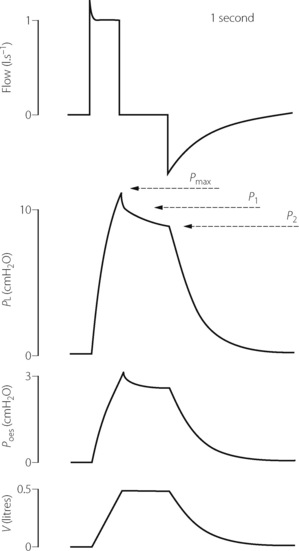
Fig. 4.12 End-inspiratory interruption method of measuring resistance. Following a constant flow positive pressure breath, there is an end-inspiratory pause of almost one second before passive exhalation. The peak airway pressure (Pmax) falls initially very quickly to P1 and thereafter more slowly to a plateau P2. Tissue resistance, airway resistance and total resistance can then all be calculated (see text for details). In this example, showing the average of 33 consecutive breaths, both transpulmonary (tracheal minus oesophageal) pressure and oesophageal pressure relative to atmosphere have been measured, allowing lung and chest wall components of tissue resistance to be calculated separately. Flow, airway flow rate; Pl, transpulmonary pressure; Poes, oesophageal pressure; V, change in lung volume.
(After reference 7.)
In the second phase, a slower decay in pressure occurs from P1 to P2, which represents the loss of the time-dependent element of tissue compliance (due to visco-elastic behaviour) and therefore represents tissue resistance:
In practice, the pressure signal may be converted into digital form and computer analysis calculates the three pressures.7
Where these pressures are recorded determines which component of tissue resistance is measured. In Figure 4.12, transpulmonary pressure (tracheal minus oesophageal pressure) is recorded so allowing calculation of the tissue resistance of the lung alone. Oesophageal pressure is also recorded, so allowing calculation of the thoracic cage component of tissue resistance.
Finally, measurement of tracheal to atmospheric pressure gradient allows calculation of total respiratory resistance:
This technique is utilised by the current generation of ventilators to calculate respiratory system resistance. The same static respiratory manoeuvre described in the previous chapter for calculation of static compliance (Figure 3.12B) also allows measurement of Pmax and P2 from which respiratory system resistance is calculated (Figure 4.12).
Measurement of Closing Capacity10,33
This is perhaps the most convenient place to outline the measurement of closing capacity. It is the maximal lung volume at which airway closure can be detected in the dependent parts of the lungs (page 48). The measurement is made during expiration and is based on having different concentrations of a tracer gas in the upper and lower parts of the lung. This may be achieved by inspiration of a bolus of tracer gas at the commencement of an inspiration from residual volume, at which time airways are closed in the dependent part of the lungs (Figure 4.13). The tracer gas will then be preferentially distributed to the upper parts of the lungs. After a maximal inspiration to total lung capacity, the patient slowly exhales while the concentration of the tracer gas is measured at the mouth. When lung volume reaches the closing capacity and airways begin to close in the dependent parts, the concentration of the tracer gas will rise (phase IV) above the alveolar plateau (phase III). Suitable tracers are 133Xe or 100% oxygen (measured as a fall in nitrogen concentration). The technique can be undertaken in the conscious subject who performs the ventilatory manoeuvres spontaneously or in the paralysed subject in whom ventilation is artificially controlled.
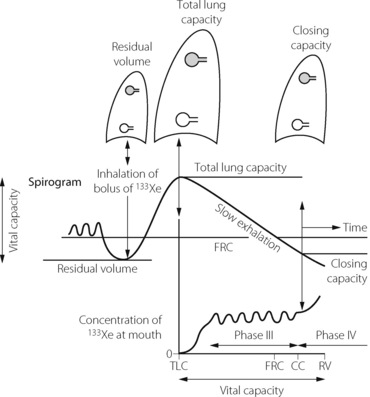
Fig. 4.13 Measurement of closing capacity by the use of a tracer gas such as 133Xe. The bolus of tracer gas is inhaled near residual volume and, due to airway closure, is distributed only to those alveoli whose air passages are still open (shown shaded in the diagram). During expiration, the concentration of the tracer gas becomes constant after the dead space is washed out. This plateau (phase III) gives way to a rising concentration of tracer gas (phase IV) when there is closure of airways leading to alveoli which did not receive the tracer gas.
References
*1. Milic-Emili J, Robatto FM, Bates JHT. Respiratory mechanics in anaesthesia. Br J Anaesth. 1990;65:4-12.
2. Mead J, Agostini E. Dynamics of Breathing. Handbook of Physiology, Section 3 1964:1:1.
3. Burwell DR, Jones JG. The airways and anaesthesia – 1: Anatomy, physiology and fluid mechanics. Anaesthesia. 1996;51:849-857.
4. Mount LE. The ventilation flow-resistance and compliance of rat lungs. J Physiol. 1955;127:157-167.
5. D’Angelo E, Calderini E, Torri G, Robatto FM, Bonon D, Milic-Emili J. Respiratory mechanics in anaesthetised paralysed humans: effects of flow, volume and time. J Appl Physiol. 1989;67:2556-2564.
6. D’Angelo E, Tavola M, Milic-Emili J. Volume and time dependence of respiratory system mechanics in normal anaesthetised paralysed humans. Eur Respir J. 2000;16:665-672.
7. D’Angelo E, Prandi E, Tavola M, Calderini E, Milic-Emili J. Chest wall interrupter resistance in anaesthetised paralysed humans. J Appl Physiol. 1994;77:883-887.
*8. D’Angelo E, Robatto FM, Calderini E, et al. Pulmonary and chest wall mechanics in anaesthetised paralysed humans. J Appl Physiol. 1991;70:2602-2610.
9. Kimmel E, Seri M, Fredberg JJ. Lung tissue resistance and hysteretic modelling of lung parenchyma. J Appl Physiol. 1995;79:461-466.
*10. Milic-Emili J, Torchio R, D’Angelo E. Closing volume: a reappraisal (1967–2007). Eur J Appl Physiol. 2007;99:567-583.
11. Drummond GB, Milic-Emili J. Forty years of closing volume. Br J Anaesth. 2007;99:772-774.
12. Aljuri N, Venegas JG, Freitag L. Viscoelasticity of the trachea and its effects on flow limitation. J Appl Physiol. 2006;100:384-389.
13. Canning BJ, Fischer A. Neural regulation of airway smooth muscle tone. Respir Physiol. 2001;125:113-127.
*14. Canning BJ. Reflex regulation of airway smooth muscle tone. J Appl Physiol. 2006;101:971-985.
15. Widdicombe JG. Autonomic regulation: i-NANC/e-NANC. Am J Respir Crit Care Med. 1998;158:S171-S175.
16. Drazen JM, Gaston B, Shore SA. Chemical regulation of pulmonary airway tone. Annu Rev Physiol. 1995;57:151-170.
17. Thomson NC, Dagg KD, Ramsay SG. Humoral control of airway tone. Thorax. 1996;51:461-464.
18. Hakonarson H, Grunstein MM. Regulation of second messengers associated with airway smooth muscle contraction and relaxation. Am J Respir Crit Care Med. 1998;158:S115-S122.
*19. Barnes PJ. Pharmacology of airway smooth muscle. Am J Respir Crit Care Med. 1998;158:S123-S132.
20. Thirstrup S. Control of airway smooth muscle tone. I – Electrophysiology and contractile mediators. Respir Med. 2000;94:328-336.
21. Barnes PJ. Effect of β-agonists on inflammatory cells. J Allergy Clin Immunol. 1999;104:S10-S17.
22. Enhorning G. Surfactant in airway disease. Chest. 2008;133:975-980.
23. Bernstein IL. β2-agonists: Déjà vu all over again. The second generation controversy. Chest. 2002;122:763-765.
24. O’Byrne PM, Ädelroth E. β2 déjà vu. Chest. 2006;129:3-5.
*25. Johnson M. The β-adrenoceptor. Am J Respir Crit Care Med. 1998;158:S146-S153.
26. Hall IP, Sayers I. Pharmacogenetics and asthma: false hope or new dawn? Eur Respir J. 2007;29:1239-1245.
27. Wjst M. β2-adrenoreceptor polymorphisms and asthma. Lancet. 2006;368:710-711.
28. Barnes PJ. Theophylline. New perspectives for an old drug. Am J Respir Crit Care Med. 2003;167:813-818.
29. Reynolds PN, Holmes MD, Scicchitano R. Role of tachykinins in bronchial hyper-responsiveness. Clin Exp Pharmacol Physiol. 1997;24:273-280.
30. Drazen JM, Isreal E, O’Byrne PM. Treatment of asthma with drugs modifying the leukotriene pathway. N Engl J Med. 1999;340:197-206.
31. Raux M, Straus C, Redolfi S, et al. Electroencephalographic evidence for pre-motor cortex activation during inspiratory loading in humans. J Physiol. 2007;578:569-578.
32. Nunn JF, Ezi-Ashi TI. The respiratory effects of resistance to breathing in anaesthetised man. Anesthesiology. 1961;22:174-185.
33. Cotes JE, Chinn DJ, Miller MR. Lung function. Physiology, measurement and application in medicine. Oxford: Blackwell Publishing; 2006.
34. Phagoo SB, Watson RA, Silverman M, Pride NB. Comparison of four methods of assessing airflow resistance before and after induced airway narrowing. J Appl Physiol. 1995;79:518-525.
35. Goldman M, Knudson RJ, Mead J, Paterson N, Schwaber JR, Wohl ME. A simplified measurement of respiratory resistance by forced oscillation. J Appl Physiol. 1970;28:113-116.
36. Bar-Yishay E. Whole-body plethysmography. The human factor. Chest. 2009;135:1412-1414.
37. Jonson B, Beydon L, Brauer K, Mansson C, Valind S, Grytzell H. Mechanics of the respiratory system in healthy anesthetised humans with an emphasis on viscoelastic properties. J Appl Physiol. 1993;75:132-140.