Chapter 32 Respiratory support and artificial ventilation
 Non-invasive ventilation may be used to increase airway pressure and support a failing respiratory system without the need for tracheal intubation or tracheostomy. Intermittent positive pressure ventilation can be delivered by a variety of different techniques, many of which are coordinated with the patient’s own respiratory efforts. Positive end-expiratory pressure increases the functional residual capacity, reduces airway resistance and may prevent or reverse lung collapse. Any increase in mean intra-thoracic pressure, as seen during positive pressure ventilation, impairs venous return, increases pulmonary vascular resistance and so reduces cardiac output.
The previous five chapters have outlined the numerous ways in which the respiratory system may fail to achieve its primary objective of gas exchange. This chapter describes the various techniques available to replace, either partially or totally, the gas exchange function of the respiratory system.
Respiratory support is required when there is impaired action of the patient’s respiratory muscles or a severe dysfunction of the mechanics of breathing. It may also be used to improve oxygenation of arterial blood even when Pco2 is within normal limits. Artificial ventilation is defined as the provision of the minute volume of respiration by external forces. For most clinical applications, current practice has moved more towards respiratory ‘support’ or ‘assist’ in which the patient’s breathing is assisted, but not entirely replaced, by a variety of techniques described throughout this chapter. Provision of the whole minute ventilation by artificial means is now only seen during anaesthesia with paralysis and in the most critically ill patients.
Non-Invasive Ventilation1,2
Non-invasive ventilation is defined as respiratory support without establishing a tracheal airway. It may be achieved by either negative pressure ventilation, or positive pressure ventilation via a mask or similar device.
Negative Pressure Ventilation3
This requires the application of subatmospheric pressure to the trunk. It was first reported in 19294 and widely used for the following 30 years during polio epidemics. Enthusiasm for the technique has fluctuated since, but there continues to be interest in negative pressure ventilation for a small group of patients.5
Animal studies comparing negative and positive pressure ventilation show that lung perfusion is the same with both modes, but that ventilation is more evenly distributed and oxygenation better with negative pressure ventilation.6 Negative pressure ventilation continues to have a place in the management of respiratory failure due to neuromuscular disorders,3 central apnoeas,1 or in paediatric intensive care.5
Cabinet ventilators, often referred to as an ‘iron lung’, require the whole body except the head to be encased in a cabinet with an airtight seal around the neck. An intermittent negative pressure is then applied in the tank, causing inspiration, with passive expiration as normal. A superimposed continuous negative pressure may also be applied, which provides the negative pressure equivalent of positive end-expiratory pressure (PEEP). In terms of the airway-to-ambient pressure gradient cabinet ventilators are identical in principle to positive pressure ventilation, with similar effects on cardiovascular and respiratory physiology. Collapse of the extrathoracic upper airway during inspiration may occur, particularly during sleep. Vomiting or regurgitation of gastric contents exposes the patient to the danger of aspiration during the inspiratory phase, and fatalities have occurred under particularly distressing circumstances.
Cuirass and jacket ventilators are a simplified form of cabinet ventilators in which the application of subatmospheric pressure is confined to the trunk or anterior abdominal wall. Function depends on a good airtight seal. They are less efficient than cabinet ventilators and suffer from the same disadvantages. However, they are much more convenient to use and may be useful to supplement inadequate spontaneous breathing.
Hayek oscillator is a form of cuirass that encircles the trunk and allows high frequency ventilation (see below) with a continuous negative pressure.7 It facilitates a wide range of tidal volumes, and some degree of control of the functional residual capacity (FRC). It may be used during surgery on the airway so avoiding the need for any form of tracheal tube.8
Non-Invasive Positive Pressure Ventilation1,2
Positive pressure ventilation may be delivered using soft masks that fit over the mouth and nose, the nose only, or with a clear plastic helmet over the entire head (sealed around the neck). Most ventilator systems used are pressure generators and so are ‘leak tolerant’; that is, flow automatically increases to compensate for a pressure drop due to gas leakage. With nasal ventilation, positive pressure in the nasopharynx normally displaces the soft palate anteriorly against the tongue, thus preventing escape of gas through the mouth. Adverse effects of nasal ventilation include eye irritation, conjunctivitis and facial skin necrosis. Helmet systems avoid these complications, but have a volume of around 10 litres which inevitably causes some rebreathing making hypercapnia a potential problem. The high volume in the helmet also results in a time delay when changing the pressure in the helmet to support ventilation or when sensing a spontaneous breath with pressure changes (see below).9
Techniques of ventilation are similar to invasive artificial ventilation. Ventilator modes that use patient triggering are better tolerated than controlled ventilation, particularly in awake patients, but both techniques are used. Pressure controlled ventilation or pressure support ventilation (PSV, see below) are commonly used, as is continuous positive airway pressure (CPAP). In bilevel positive airway pressure (bilevel PAP) the ventilator pressure steps between two preset values for inspiration and expiration, and, except for the terminology used to describe the pressures, is the same as PSV with CPAP.1
Ventilation may be provided continually during acute respiratory problems, or only at night for long-term respiratory disease.10 The use of nasal CPAP for treating the sleep apnoea hypopnoea syndrome has been described on page 275. In this case, benefit occurs simply be displacing the soft palate away from the posterior pharyngeal wall. Benefit in other respiratory diseases is more difficult to explain, but possible mechanisms include:2
 delivery of a higher inspired oxygen concentration by the use of a tight fitting facemask (page 206)
Clinical applications.2,11 NIV is now advocated for the treatment of acute respiratory failure from numerous causes, though outcome evidence supporting its use is variable as follows:
Chronic obstructive pulmonary disease (COPD) exacerbations (page 409). NIV is now first line treatment for this situation, and improves survival, reduces the need for invasive ventilation and reduces the length of hospital stay. The case for long-term treatment of COPD remains controversial, with some benefits in some sub-groups only.12 Cardiogenic pulmonary oedema may be successfully treated with NIV, reducing the need for tracheal intubation and improving mortality.13 The mechanism of this beneficial effect is explained on page 480. Acute lung injury (ALI). NIV instituted early in the course of ALI (Chapter 31) may reduce the need for tracheal intubation and improve gas exchange,14,15 but the evidence for improved survival is currently inconclusive.11Intermittent Positive Pressure Ventilation (IPPV)
Phases of the Respiratory Cycle
Inspiration. During IPPV, the mouth (or airway) pressure is intermittently raised above ambient pressure. The inspired gas then flows into the lungs in accord with the resistance and compliance of the respiratory system. If inspiration is slow, the distribution is governed mainly by regional compliance. If inspiration is fast, there is preferential ventilation of parts of the lungs with short time constants (Figure 3.7). Different temporal patterns of pressure may be applied, as discussed below.
Expiration. During IPPV, expiration results from allowing mouth pressure to fall to ambient. Expiration is then passive, and differs from expiration during spontaneous breathing in which diaphragm muscle tone is gradually reduced (page 63). Expiration may be impeded by the application of PEEP. In the past, expiration was sometimes accelerated by the application of a subatmospheric pressure, termed negative end-expiratory pressure (NEEP), though this technique is no longer used. Expiration to ambient pressure is termed zero end-expiratory pressure (ZEEP).
If the inflating pressure is maintained for several seconds, the resulting tidal volume will be indicated by the following relationship:
Thus, for example, a sustained inflation pressure of 10 cmH2O with a static compliance of 0.5 l.kPa−1 (50 ml.cmH2O−1) would result in a lung volume 500 ml above functional residual capacity (FRC).
Time Course of Inflation and Deflation
Equilibration according to the above equation usually takes several seconds. When the airway pressure is raised during inspiration, it is opposed by the two forms of impedance – the elastic resistance of lungs and chest wall (Chapter 3) and resistance to air flow (Chapter 4). At any instant, the inflation pressure equals the sum of the pressures required to overcome these two forms of impedance. The pressure required to overcome elastic resistance equals the lung volume above FRC divided by the total (dynamic) compliance, while the pressure required to overcome air flow resistance equals the air flow resistance multiplied by the instantaneous flow rate.
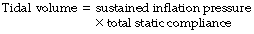
The effect of applying a constant pressure (or square wave inflation) is shown in Figure 32.1. The two components of the inflation pressure vary during the course of inspiration while their sum remains constant. The component overcoming air flow resistance is maximal at first and declines exponentially with air flow as inflation proceeds. The component overcoming elastic resistance increases with the lung volume. With normal respiratory mechanics in the unconscious patient, the change in lung volume should be 95% complete in about 1.5 seconds, as in Figure 32.1.
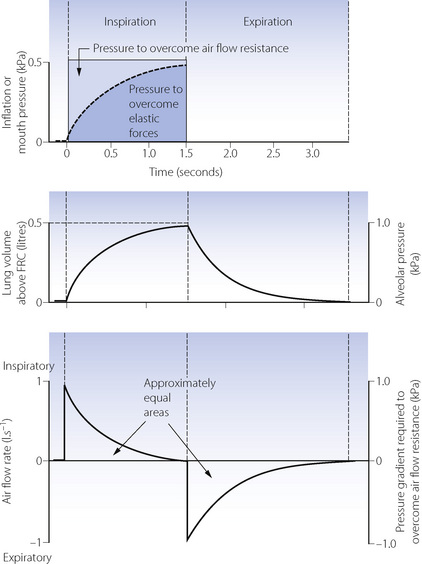
Fig. 32.1 Artificial ventilation by intermittent application of a constant pressure (square wave) followed by passive expiration. Inspiratory and expiratory flow rates are both exponential. Assuming that air flow resistance is constant, it follows that flow rate and pressure gradient required to overcome resistance may be shown on the same graph. Lung volume and alveolar pressure may be shown on the same graph if compliance is constant. Values are typical for an anaesthetised supine paralysed patient: total dynamic compliance, 0.5 l.kPa−1 (50 ml.cmH2O−1); pulmonary resistance 0.3 kPa.l−1.s (3 cmH2O.l−1.s); apparatus resistance 0.7 kPa.l−1.s (7 cmH2O.l−1.s); total resistance, 1 kPa.l−1.s (10 cmH2O.l−1.s); time constant, 0.5 s.
The approach of the lung volume to its equilibrium value is according to an exponential function of the wash-in type (see Appendix E). The time constant, which is the time required for inflation to 63% of the equilibrium value, equals the product of resistance and compliance. Normal values for an unconscious patient are as follows:


or

The time constant is the time that would be required to reach equilibrium if the initial inspiratory flow rate were maintained. It is sometimes more convenient to use the half-time, which is 0.69 times the time constant. The inflation curve is shown in full with further mathematical detail in Appendix E.
It is normal practice for the inspiratory phase to be terminated after 1 or 2 seconds at which time the lung volume will still be increasing. Inflation pressure is not then the sole arbiter of tidal volume but must be considered in relation to the duration of the inspiratory phase.
If expiration is passive and mouth pressure remains at ambient, the driving force is the elevation of alveolar pressure above ambient, caused by elastic recoil of lungs and chest wall. This pressure is dissipated in overcoming air flow resistance during expiration. In Figure 32.1, during expiration the alveolar pressure (proportional to the lung volume above FRC) is directly proportional to expiratory flow rate, and all three quantities decline according to a wash-out exponential function with a time constant which is again equal to the product of compliance and resistance.
The Effect of Changes in Inflation Pressure, Resistance and Compliance
The heavy line in Figure 32.2 shows the inflation curve for the normal parameters of an unconscious paralysed patient as listed in Table 32.1. These are the same values that were considered above. The basic curve is a single exponential approaching a lung volume 0.5 litre above FRC with a time constant of 0.5 seconds.
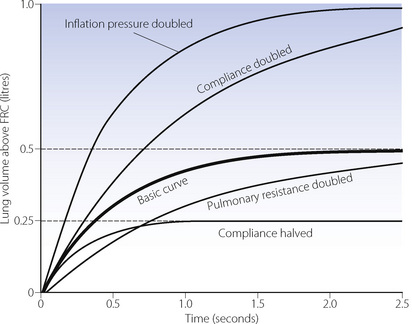
Fig. 32.2 Effect of changes in various factors on the rate of inflation of the lungs. Fixed relationships: final tidal volume achieved = inflation pressure × compliance; time constant = compliance × resistance. (See also Table 32.1.)
Table 32.1 Parameters for inflation curves shown in Figure 32.2
Changes in inflation pressure do not alter the time constant of inflation, but directly influence the amount of air introduced into the lungs in a given number of time constants. In Figure 32.2, each point on the curve labelled ‘inflation pressure doubled’ is twice the height of the corresponding point on the basic curve for the same time.
Effect of changes in compliance and resistance. If the compliance is doubled, the equilibrium tidal volume is also doubled. However, the time constant (product of compliance and resistance) is also doubled and therefore the equilibrium volume is approached more slowly (Figure 32.2). Conversely, if the compliance is halved, the equilibrium tidal volume is also halved and so is the time constant.
Changes in resistance have a direct effect on the time constant of inflation but do not affect the equilibrium tidal volume. Thus the effect of an increased resistance on tidal volume is through the reduction in inspiratory flow rate. Within limits, this can be counteracted by prolonging inspiration or by increasing the inflation pressure and the degree of overpressure (explained below). The effects, shown in Figure 32.2, apply not only to the whole lung but also to regions that may have different compliances, resistances and time constants (page 121).
Overpressure. Increasing the inflation pressure has a major effect on the time required to achieve a particular lung volume above FRC. In Figure 32.3, the lung characteristics are the same as for the basic curve in Figure 32.2. If the required tidal volume is 475 ml, this is achieved in 1.5 seconds with an inflation pressure of 10 cmH2O. However, the same lung volume is achieved in only 0.3 seconds by doubling the inflation pressure. The application of a pressure that, if sustained, would give a tidal volume higher than that which is intended, is known as overpressure; it is used extensively to increase the inspiratory flow rate and so to shorten the inspiratory phase. The use of a subatmospheric pressure to increase the rate of passive expiration is similar in principle but is complicated by airway trapping (Figure 32.3B).
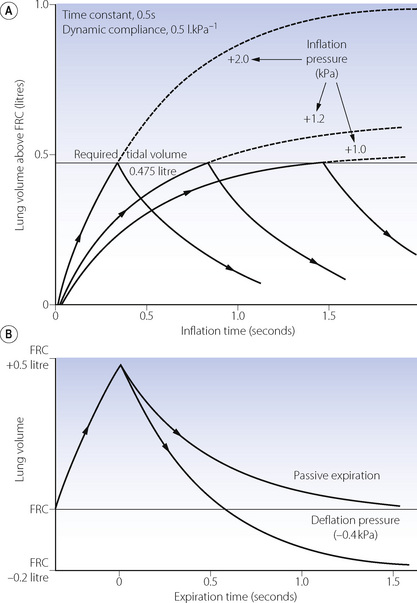
Fig. 32.3 (A) How the duration of inflation may be shortened by the use of overpressure. Inflation curves are shown for +2 kPa (+20 cmH2O) (equilibrium 1 litre), +1.2 kPa (+12 cmH2O) (equilibrium 0.6 litre) and +1 kPa (+10 cmH2O) (equilibrium 0.5 litre). With a required tidal volume of 0.475 litre note the big reduction in duration of inflation needed when the inflation pressure is increased from 1 to 2 kPa (10 to 20 cmH2O). (B) How expiration is influenced by the use of a subatmospheric pressure or ‘negative phase’. Expiration may be terminated at the FRC after 0.6 s, or may be prolonged, in which case the lung volume will fall to 0.2 litre below FRC.
Deviations from true exponential character of expiration. It is helpful to assume that the patterns of air flow described above are exponential in character, as this greatly assists our understanding of the situation. However, there are many reasons why air flow should not be strictly exponential in character. Air flow is normally partly turbulent (see Chapter 4) and therefore resistance cannot be considered as a constant. Furthermore, as expiration proceeds, the calibre of the air passages decreases and there is also a transition to more laminar flow as the instantaneous flow rate decreases. Approximation to a single exponential function is nevertheless good enough for many practical purposes.
Alternative Patterns of Application of Inflation Pressure
Constant pressure or square wave inflation has been considered above because it is the easiest for mathematical analysis. There are, however, an almost infinite number of pressure profiles that may be applied for IPPV. There is no very convincing evidence of the superiority of one over the other, except that distribution of inspired gas is improved if there is a prolongation of the period during which the applied pressure is maximal. This permits better ventilation of the ‘slow’ alveoli and is not very important in patients with relatively healthy lungs.
Constant flow rate ventilators are extensively used, and Figure 32.4 shows pressure, volume and flow changes in a manner analogous to Figure 32.1.
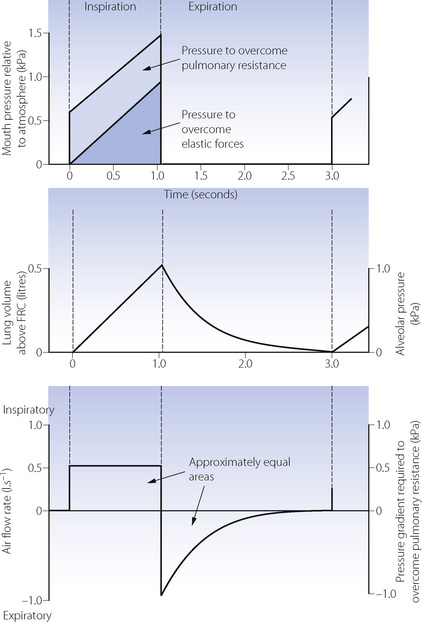
Fig. 32.4 Artificial ventilation by intermittent application of a constant-flow, with passive expiration. Note that inspiratory flow rate is constant. Assuming that pulmonary resistance is constant, it follows that a constant amount of the inflation pressure is required to overcome flow resistance. Lung volume and alveolar pressure may be shown on the same graph if compliance is constant. Values are typical for an anaesthetised supine paralysed patient: total dynamic compliance, 0.5 l.kPa−1 (50 ml.cmH2O−1); pulmonary resistance 0.3 kPa.l−1.s (3 cmH2O.l−1.s); apparatus resistance 0.7 kPa.l−1.s (7 cmH2O.l−1.s); total resistance, 1 kPa.l−1.s (10 cmH2O.l−1.s); time constant, 0.5 s.
Control of Duration of Inspiration
Three methods are in general use.
Limitations on inspiratory duration. Whatever the means of cycling, it is possible to add a limitation on inspiratory duration, usually as a safety precaution. For example, a pressure limitation can be added to a time-cycled or a volume-cycled ventilator. This can either function as a pressure relief valve or it can terminate the inspiratory phase.
The Inspiratory to Expiratory (I:E) Ratio
For a given minute volume of ventilation, it is possible to vary within wide limits the duration of inspiration and expiration and the ratio between the two. A common pattern is about 1 second for inspiration, followed by 2–4 seconds for expiration (I:E ratio 1:2–1:4), giving respiratory frequencies in the range 12–20 breaths per minute. The problem is whether changes from this pattern confer any appreciable benefit in terms of gas exchange. Reduction of the inspiratory time to less than 1 second may cause an increase in dead space, but there is no evidence that the duration of inspiration (in the range 0.5–3 seconds) has any appreciable effect on the alveolar/arterial Po2 gradient. Thus the accepted view seems to be that 1 second is a reasonable minimal time for inspiration.
Inverse I:E ratio ventilation has the effect of increasing the mean lung volume and so may be expected to achieve some of the advantages of PEEP as considered below. It may be achieved either by slowing the inspiratory flow rate (shallow ramp) or by holding the lung volume at the end of inspiration (inspiratory pause), the latter seeming to be more logical. I:E ratios as high as 4:1 have been used but 2:1 is generally preferable. The degree of inverse I:E ratio used is limited by the cardiovascular disturbances seen with the technique (see below) and the time available for expiration. If the latter is unduly curtailed, FRC will be increased, generating so-called ‘intrinsic-PEEP’ (see below).
Gas redistribution during an inspiratory hold reduces the dead space (page 130) and so results in a lower Pco2 for the same minute volume. This permits the use of a lower peak inflation pressure.
Interaction of Ventilator Controls
The usual controls that are provided on an artificial ventilator are drawn from the following list:
It will be found that the maximum possible number of independent controls is three. A setting of any three on this list will determine the values for all the remaining variables. Opinion is divided on which of these controls the clinician likes to operate directly. With the advent of electronically controlled ventilators many of these controls may be altered by the user, while the remainder are simultaneously displayed allowing the user to immediately see the effect of the changes being made.
Clinical Use of IPPV
The previous section classifies ventilators according to the method of gas flow generation – for example, constant flow or constant pressure generators – based on the mechanism by which the ventilator worked. Most ventilators in clinical use in the developed world are now electronically controlled. These allow accurate control of gas pressure and flow throughout the ventilator circuit, and can normally perform as either flow or pressure generators, usually with a variety of inspiratory flow patterns. In addition, they have given rise to a whole host of previously impossible ventilatory techniques, a majority of which are dependent on the ventilator responding appropriately to the patient’s own respiratory efforts.
Interactions Between Patient and Ventilator
For many years there have been ventilators in which the inspiratory phase could be triggered with a spontaneous breath, and mechanical ventilators could be modified to facilitate a mandatory minute volume of ventilation, as described below. Electronic ventilators continuously monitor tidal volume, whether generated by the patient (spontaneous breath) or artificially (ventilator breath). With this information available it is a simple task to achieve, by electronic means, a predetermined minute volume, number of breaths, etc. by introducing extra ventilator breaths when necessary. The challenge for ventilator design in recent years has been the speed and sensitivity with which ventilators can sense, and respond to, the patient’s own respiratory efforts in order to synchronise ventilator and spontaneous breaths. Without this synchronisation, a patient with any reasonable spontaneous respiratory effort begins to ‘fight’ against the ventilator18 leading to discomfort, poor gas exchange and cardiovascular disturbance.
There are two ways by which a ventilator may detect the onset of a spontaneous breath.19
Pressure sensing. At the onset of a respiratory effort, the patient will generate a reduction in pressure within the circuit, which may be detected in the ventilator. This pressure wave travels through the circuit at approximately the speed of sound, and so reaches the ventilator within 12 ms, following which the pressure sensor must respond, and flow into the circuit be increased to facilitate inspiration. Overall, these events take approximately 100 ms to occur, which is undetectable by the patient. The pressure drop required to trigger inspiration is now always measured relative to circuit (not atmospheric) pressure, to allow the use of CPAP during ventilation. The time taken to trigger the ventilator increases with decreased sensitivity settings – that is, when a greater pressure drop is required for triggering. Pressure triggering is also affected by the circuit compliance, which is a function of the circuit volume and the stiffness of the tubing.
Flow sensing. Detection of inspiratory flow may trigger a ventilator breath or some type of respiratory assist (see below). Most current intensive care ventilators provide a continuous base flow around the ventilator circuit of 2–20 l.min−1. Any difference between ventilator inflow and outflow represents the patient’s respiration. Flow triggering occurs in approximately 80 ms, irrespective of the sensitivity setting. A high base flow provides adequate inspiratory flow for the patient at the start of inspiration and the flow rate is increased when the ventilator is triggered. Flow sensing can also detect the end of inspiration, and is used in pressure support ventilation (see below).
Ventilatory Modes in Common Use
In addition to control mode ventilation (CMV), there are now a range of ventilation patterns. Many of these are essentially the same but have different nomenclature owing to their development by rival ventilator manufacturers. Those in common use are described below and shown graphically in Figure 32.5.
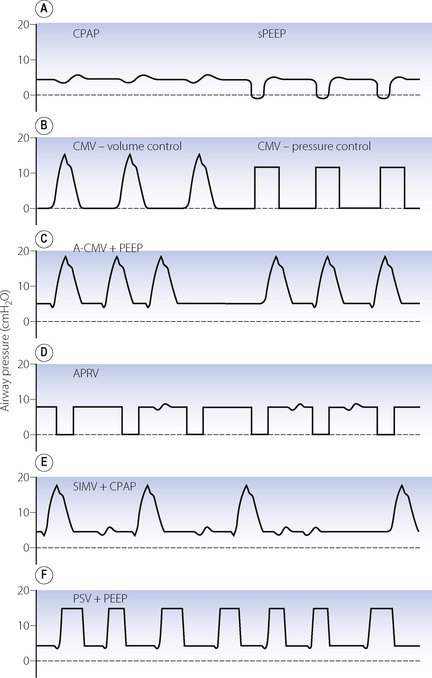
Fig. 32.5 Airway pressure during a variety of commonly used modes of ventilation. (A) CPAP, continuous positive airway pressure and sPEEP, true positive end-expiratory pressure applied during spontaneous breathing. (B) CMV, control mode ventilation showing volume and pressure-controlled inspiration. (C) A-CMV, assist-control mode ventilation where breaths are triggered by a fall in circuit pressure. When apnoea occurs, ventilator breaths occur without triggering. (D) APRV, airway pressure release ventilation with an upper airway pressure (Phigh) of 8 cmH2O and simultaneous spontaneous breathing. (E) SIMV, synchronised intermittent mandatory ventilation, as for A-CMV except that spontaneous breathing can occur between ventilator breaths. (F) PSV, pressure support ventilation in which pressure-controlled breaths are triggered by the patient, who also controls the duration of each breath. In practice, many ventilators allow combinations of these modes, such as SIMV, PSV and PEEP together.
Mandatory minute volume (MMV). Introduced in the 1970s, this was a simple technique for controlling the volume of artificial ventilation so that the total of spontaneous and artificial ventilation did not fall below a preset value. If the patient was able to achieve the preset level of MMV ventilator breaths did not occur. Achievement of the preset MMV by a rapid, shallow respiratory pattern commonly seen in intensive care patients was a major disadvantage of MMV. Electronic ventilators allow MMV to be used, and can co-ordinate the mandatory breaths with patient respiration to a greater degree than the original mechanical technique, including varying both the inspiratory pressure and timing to suit individual patient requirements.20
Assist-control ventilation or synchronised IPPV (Figure 32.5C). This was one of the earlier ventilatory modes that depended on patient triggering of ventilator breaths. It is essentially the same as volume preset IPPV except that breaths are triggered by the patient, normally as a result of reduced circuit pressure. A maximum time delay between breaths is incorporated, following which a breath will be generated by the ventilator if spontaneous triggering has ceased. There is no provision for spontaneous breathing between ventilator breaths.
Airway pressure release ventilation (Figure 32.5D).21 This ventilation mode differs significantly from all other forms of positive pressure ventilation and is essentially the reverse of IPPV. It consists of maintaining the breathing system at an upper airway pressure level (Phigh), which is intermittently released to a lower airway pressure level (Plow), causing the patient to exhale to FRC. The pattern of the imposed breaths is similar to that of reversed I:E ratio. The patient is able to breathe spontaneously throughout the entire respiratory cycle, but most of the time this will be during Phigh when inspiration will start from a lung volume greater than FRC. Artificial breaths are thus within the conventional tidal range set by his FRC, while spontaneous inspirations are usually within his inspiratory reserve. More frequent and longer periods at Plow lead to a greater minute volume, and so improved elimination of carbon dioxide, and a lower mean airway pressure, but are also associated with greater likelihood of pulmonary collapse in injured lungs and, as a consequence, worsening of oxygenation.
Synchronised intermittent mandatory ventilation (SIMV) (Figure 32.5E). Intermittent mandatory ventilation was introduced in the 1970s, followed a few years later by the ability to synchronise ventilator breaths with the patient’s own respiratory effort as described above. The essential feature of SIMV is to allow the patient to take a spontaneous breath between artificial breaths. This confers three major advantages. First, a spontaneous inspiration is not obstructed by a closed inspiratory valve and this helps to prevent the patient fighting the ventilator. The second advantage is the facilitation of weaning, which is considered below. Thirdly, the patient is able to breathe spontaneously at any time during prolonged ventilation; this may prevent respiratory muscle atrophy and helps to reduce the mean intrathoracic pressure. Most ventilators now provide SIMV as a normal feature with either pressure or volume controlled breaths and it is used extensively, often in conjunction with pressure support ventilation (see below).
Pressure support ventilation (PSV) (Figure 32.5F).22 In this system a spontaneous inspiration triggers a rapid flow of gas that increases until airway pressure reaches a preselected level. Flow sensing by the ventilator is also then able to detect when the spontaneous inspiration ends, at which point the pressure support ceases, and expiration occurs. The purpose is not to provide a prescribed tidal volume, but to assist the patient in making an inspiration of a pattern that lies largely within his own control. The level of support may be increased until the pressure is sufficient to provide the full tidal volume (maximal pressure support) and may be gradually reduced as the patient’s ventilatory capacity improves. The amount of pressure support provided does seem to be inversely related to the work of breathing.
High Frequency Ventilation23
High frequency ventilation may be classified into the following three categories:
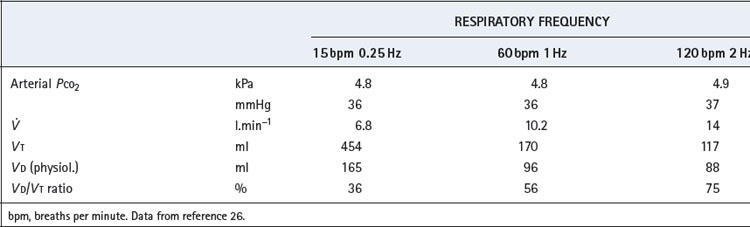
The relationship between tidal volume and dead space during high frequency ventilation is crucial to an understanding of the technique. It is useless to infer values for tidal volume and dead space from measurements made under other circumstances and yet it is very difficult to make direct measurements of these variables under the actual conditions of high frequency ventilation, especially in humans. A study of anaesthetised subjects during HFPPV up to frequencies of 2 Hz, maintained arterial Pco2 approximately constant at about 5 kPa (37.5 mmHg).26 As frequency increased from conventional ventilation at 15 breaths.min−1 to HFPPV at 2 Hz it was necessary to double the minute volume (Table 32.2). The actual volume of the physiological dead space decreased with decreasing tidal volume to reach a minimal value of about 90 ml at 1 Hz. However, the normal proportionality between dead space and tidal volume (page 130) was not maintained. Dead space/tidal volume ratio increased from 37% at 15 breaths.min−1 to 75% at 2 Hz, which explains the requirement for the increased minute volume. The situation is more complex at higher frequencies. One study found that tidal volumes of at least 100 ml were still required at frequencies of 15 Hz, corresponding to an applied minute volume of 90 l.min−1, which would indicate a dead space/tidal volume ratio of over 90%.27 There are severe technical difficulties in the measurement of the actual delivered tidal volumes which, though undoubtedly less than the pump settings, are probably much larger than the external movements of the thorax would suggest.
End-expiratory pressure is inevitably raised at high frequencies because the duration of expiration will be inadequate for passive exhalation to FRC, the time constant of the normal respiratory system being about 0.5 second (see above). Therefore, the use of respiratory frequencies above about 2 Hz will usually result in ‘intrinsic’ PEEP, and hence an increased end-expiratory lung volume, which is likely to be a major factor promoting favourable gas exchange.
Gas mixing and streaming is likely to be modified at high frequencies. The sudden reversals of flow direction are likely to set up eddies that blur the boundary between dead space and alveolar gas, thus improving the efficiency of ventilation. It has been suggested that such ‘enhanced diffusion’ or ‘augmented dispersion’ plays a major role in gas exchange during HFOV.25,27 Air passages dilated by intrinsic PEEP may contribute to this effect. Furthermore, cardiac mixing of gases becomes relatively more important at small tidal volumes.28
The clinical indications for high frequency ventilation remain unclear. The techniques have been used mainly for weaning from artificial ventilation in adults and for respiratory support in babies.24 There is also agreement on its special role for patients with bronchopleural fistula and the technique is particularly convenient when there is no airtight junction between ventilator and the tracheobronchial tree, during surgery on the airway for example (page 491). There is no doubt that effective gas exchange is usually possible with high frequency ventilation but clinical advantages over conventional artificial ventilation are less clear. Randomised trials generally failed to demonstrate any significant advantage over conventional methods of ventilation.29 Although there are enthusiasts, others believe that it is merely a technique in search of an application. Of the various techniques described, HFOV is currently the most popular in intensive care units, with renewed interest in its use for patients with severe ALI (Chapter 31). Use of HFOV can maintain a reasonably high mean airway pressure to prevent lung collapse whilst still allowing adequate ventilation without high peak airway pressures that may cause overdistension of alveoli.25
Weaning30,31
Weaning describes the process by which artificial ventilation is gradually withdrawn and the patient returned to normal respiration. In practice it is useful to think of two stages: the withdrawal of respiratory support and the removal of any artificial airway, usually a tracheal tube or tracheostomy. Only the first of these stages is considered here.
Predicting successful weaning. Before weaning can be attempted, the balance between ventilatory load and capacity must be favourable. Extra demands on the respiratory system may originate from increased oxygen consumption, commonly as a result of sepsis, but also occasionally from thyrotoxicosis, convulsions or shivering. Reduced respiratory system compliance or increased airway resistance also impose additional loads on the respiratory system. The capacity of the respiratory system to wean depends on having, first, adequate ventilation perfusion matching and, secondly, low intrapulmonary shunt and respiratory dead space. Finally, good respiratory muscle function must be achieved (page 92), including correction of any metabolic disturbance and provision of adequate blood supply to the muscles; that is, the patient must have reasonable cardiovascular function. Numerous different measurements of lung function have been reported to predict successful weaning from ventilatory support. Some of the more widely accepted ones are shown in Table 32.3.
Table 32.3 Measurements of lung function used to assess suitability for weaning from artificial ventilation
| MEASUREMENT | VALUE FOR SUCCESSFUL WEANING |
|---|---|
| Measured on ventilator: | |
| Pao2 : Fio2 ratio | > 20 (Pao2 in kPa) or 150 (Pao2 in mmHg) |
| Resting minute volume | < 10 l.min−1 |
| Negative inspiratory force | −20 to −30 cmH2O |
| Pimax | −15 to −30 cmH2O |
| P0.1/Pimax | > 0.3 |
| CROP score | ≥ 13 ml.breath−1.min |
| Measured during brief period of spontaneous breathing: | |
| Respiratory rate | < 30 breaths.min−1 |
| Tidal volume | > 4–6 ml.kg−1 |
| Respiratory rate : tidal volume ratio | > 60 breaths.l−1 |
| RVR score | ≤ 105 breaths.min−l.l−1 |
Pimax, maximal inspiratory pressure; P0.1, mouth occlusion pressure 0.1 s after the onset of inspiration; CROP and RVR score, see text for details.
(After references 32 and 33.)
No single variable is a reliable indicator of success, with most having very low predictive values. This has led to the development of more complex scoring systems, which include the Compliance, Rate, Oxygenation, Pressure (CROP) score, calculated as:

(Crs, respiratory system compliance; Pimax maximum inspiratory pressure).
Rate:volume ratio (RVR) score is respiratory rate (breaths.min−1) divided by tidal volume (litres) measured over one minute without artificial ventilation.
A CROP score of ≥13 ml.breath−1.min−1 or a RVR score ≤105 breath.min−1.l−1 are both reasonable predictors of successful weaning.33
Techniques for weaning. Recent guidelines suggest that once these predictors indicate that discontinuation of ventilation may be possible, a spontaneous breathing trial should be used.30,31 During this trial, which should last approximately 30 minutes, the patient breathes spontaneously with only minimal respiratory support, and is closely observed to ensure that respiratory pattern, patient comfort, gas exchange and cardiovascular stability are all acceptable. If this trial of spontaneous breathing fails, appropriate degrees of ventilatory support should be recommenced, and a further trial of spontaneous breathing performed at 24-hour intervals if the predictors of successful weaning remain satisfactory.
Ventilation strategies to use between trials of spontaneous breathing focus on gradual withdrawal of respiratory support using the techniques described above. Control mode ventilation is usually replaced by either SIMV or A-CMV until the patient has established adequate respiratory effort, following which the number of ventilator breaths can be gradually reduced. Whilst breathing via an artificial airway, some respiratory support is normally required, and this is most commonly provided with PSV, the level of which can again be reduced gradually.
It is important to not place excessive reliance on modern ventilator systems to wean patients from ventilatory support. Close attention must also be paid to nutrition, psychological care such as establishment of normal night:day sleep patterns, and the use of non-invasive ventilation (page 464) following early extubation. Protocols for weaning are now widely used to ensure all these aspects are addressed, but some patients will still remain ventilated for many weeks and specialist units now exist to care for these challenging patients.34
Positive End-Expiratory Pressure
A great variety of pathological conditions, as well as general anaesthesia, result in a decrease in FRC. The deleterious effect of this on gas exchange has been considered elsewhere (page 342) and it is reasonable to consider increasing the FRC by the application of PEEP, first described by Hill et al in 1965.35
Expiratory pressure can be raised during both artificial ventilation and spontaneous breathing, and both forms are best considered together. The terminology is confusing and this chapter adheres to the definitions illustrated in Figure 32.6. Note in particular sPEEP in which a patient inhales spontaneously from ambient pressure but exhales against PEEP. This involves the subject in a considerable amount of additional work of breathing because he must raise his entire minute volume to the level of PEEP that is applied. This is undesirable and CPAP is much to be preferred to sPEEP.
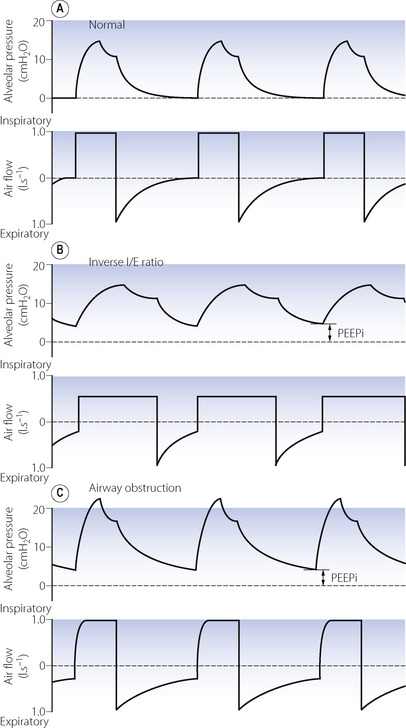
Fig. 32.6 Pressure and flow curves demonstrating generation of intrinsic positive end-expiratory pressure (PEEPi). (A) Normal ventilation with both alveolar pressure and airway flow returning to zero before the next breath. (B) Inverse I:E ratio ventilation. Although the decline in pressure and flow is normal, there is insufficient time for complete expiration to occur. (C) Airway obstruction. Expiratory time is normal, but the decline in pressure and flow is retarded to such an extent that expiration is again incomplete.
True CPAP is more difficult to achieve than sPEEP. Biased demand valves may be used but usually result in a pronounced dip in inspiratory pressure, increasing the total work of breathing. The simplest approach is a T-piece with a high fresh gas flow venting through a PEEP valve at the expiratory limb throughout the respiratory phase. Electronic ventilators produce CPAP in a similar fashion by circulating high flows of gas around the ventilator circuit at the required positive pressure.
PEEP may be achieved by many techniques. The simplest is to exhale through a preset depth of water but more convenient methods are spring-loaded valves or diaphragms pressed down by gas, a column of water or a spring. It is also possible to use venturis and fans opposing the direction of expiratory gas flow.
Intrinsic PEEP18
If a passive expiration is terminated before the lung volume has returned to FRC, there will be residual end-expiratory raised alveolar pressure variously known as dynamic hyperinflation, auto PEEP or intrinsic PEEP (PEEPi).36 The elevated alveolar pressure will not be transmitted back to the ventilator pressure sensors, so PEEPi may go undetected,37 but simple methods to measure it have been described.36 Artificial ventilation with inverse I:E ratio may result in PEEPi, but it is more commonly a result of increased expiratory flow resistance due to airway disease or retention of mucous, or from the tracheal tube (Figure 32.6). Eventually, alveolar pressure and lung volume increase sufficiently to cause reductions in both lung compliance and airway resistance (pages 32 and 47); expiratory flow rate then increases and so the degree of PEEPi stabilises.
At first sight PEEPi may be perceived as beneficial – for example, leading to increased FRC and alveolar recruitment – and it is likely that improved gas exchange seen with inverse I:E ratio results, at least in part, from this mechanism. However, the first hazard of PEEPi is its variability. Small changes in airway resistance, for example with mucous retention, can lead to rapid increases in the level of PEEPi. The cardiovascular consequences of PEEPi are significant (see below), and have been described as ‘applying a tourniquet to the right heart’.37 Finally, the presence of PEEPi will impede the ability of the patient to trigger ventilators by necessitating a greater fall in alveolar pressure to initiate respiratory support.18
Application of external PEEP will, to some extent, attenuate the generation of PEEPi by maintaining airway patency in late expiration and so improving expiratory flow.
Physiological Effects of Positive Pressure Ventilation
A positive pressure in the chest cavity is a significant physiological insult that normally occurs only transiently with coughing, straining, etc., although the pressure achieved in these situations may be very high. Most physiological effects of IPPV are related to the mean pressure throughout the whole respiratory cycle, which is in turn influenced by a large number of ventilatory settings such as mode of ventilation, tidal volume, respiratory rate and I:E ratio. PEEP results in large increases in mean intrathoracic pressure. For example, IPPV in a patient with normal lungs using 10 breaths of 10 ml.kg−1 and an I:E ratio of 1:2 will generate mean airway pressures of approximately 5 cmH2O. Addition of a modest 5 cmH2O of PEEP will therefore double the mean airway pressure, and thus the physiological insult associated with IPPV. For this reason, much research into the physiological effects of artificial ventilation has focused on PEEP.
Respiratory Effects38
Artificial ventilation effectively rests the respiratory muscles, and the effect of this on muscle function is described on page 92.
Distribution of ventilation. Intermittent positive pressure ventilation results in a spatial pattern of distribution that is determined by inflation pressure, regional compliance and time constants. Based on external measurements the anatomical pattern of distribution of inspired gas is different from that of spontaneous breathing, there being a relatively greater expansion of the rib cage.39 However, with spontaneous breathing regional differences in ventilation are small in the supine position (page 120), and in spite of the altered ribcage motion changes in regional ventilation with IPPV in patients with normal lungs are probably minimal.40 This is not the case in patients with ALI, in whom the spatial distribution of gas becomes very abnormal with areas of collapse and over-inflated lung developing.39 Application of PEEP increases lung volume and, at high levels, re-expands collapsed alveoli, which changes the compliance of dependent lung regions and so improves ventilation of these areas.
Apparatus dead space. Positive pressure ventilation, whether invasive or non-invasive, requires the provision of an airtight connection to the patient’s airway. This inevitably involves the addition of some apparatus dead space. With orotracheal and tracheostomy tubes much of the normal anatomical dead space (page 129) is bypassed, such that overall anatomical dead space may be unchanged or reduced. With non-invasive ventilation using facemasks, apparatus dead space may be substantial. Ventilator tubing used to deliver IPPV is normally corrugated, and expands longitudinally with each inspiration. For an average ventilator circuit, this expansion may amount to 2–3 ml per cmH2O of positive pressure, and this volume will constitute dead space ventilation.
Physiological dead space. In normal lungs during anaesthesia, IPPV alone seems to have little effect on the Vd/Vt ratio compared with the value obtained with spontaneous breathing.39 There is a slight widening of the distribution of  ratios (page 126) mostly as a result of a reduction in pulmonary blood flow from depression of cardiac output (see below). These changes are normally not sufficient to alter gas exchange. The acute application of moderate amounts of PEEP causes only a slight increase in Vd/Vt ratio.41
The alveolar component of physiological dead space may be increased by ventilation in patients with lung injury, or when mean intrathoracic pressure is high such as with significant amounts of PEEP. Under the latter conditions, lung volume is increased to such an extent that not only does cardiac output fall but pulmonary vascular resistance rises as well (see Figure 7.4).42 Perfusion to over-expanded alveoli is reduced and areas of lung with high  ratios develop, which constitute alveolar dead space. In healthy lungs, this effect is not seen until PEEP levels exceed 10–15 cmH2O.41 However, with IPPV in ALI overdistension occurs in the relatively small number of functional alveoli (page 457), and local perfusion to these lung units is likely to be impeded.
Lung volume. IPPV and ZEEP will have no effect on FRC. However, with PEEP, end-expiratory alveolar pressure will equal the level of applied PEEP and this will reset the FRC in accord with the pressure/volume curve of the respiratory system (see Figure 3.8). For example, PEEP of 10 cmH2O will increase FRC by 500 ml in a patient with a compliance of 0.5 l.kPa−1 (50 ml.cmH2O−1). In many patients this may be expected to raise the tidal range above the closing capacity (page 48) and so reduce pulmonary collapse. Prevention of alveolar collapse is probably the greatest single advantage of PEEP. It will also reduce airway resistance according to the inverse relationship between lung volume and airway resistance (see Figure 4.5). It may also change the relative compliance of the upper and lower parts of the lung (Figure 32.7), thereby improving the ventilation of the dependent overperfused parts of the lung.
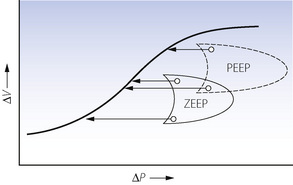
Fig. 32.7 Effect of positive end-expiratory pressure (PEEP) on the relationship between regional pressure and volume in the lung (supine position). Note that compliance is greater in the upper part of the lung with zero end-expiratory pressure (ZEEP) and in the lower part of the lung with PEEP, which thus improves ventilation in the dependent zone of the lung.
(Diagram kindly supplied by Professor J. Gareth Jones.)
Arterial Po2. Neither IPPV nor PEEP improve arterial oxygenation appreciably in patients with healthy lungs. During anaesthesia, it has been repeatedly observed that PEEP does little to improve arterial oxygenation in healthy patients. Pulmonary shunting is decreased, but the accompanying decrease in cardiac output reduces the mixed venous oxygen saturation, which counteracts the effect of a reduction in the shunt, resulting in minimal increase in arterial Po2.41 There is however no doubt that positive pressure ventilation improves arterial Po2 in a wide range of pathological situations. In most cases, the improvement in Po2 relates to the mean airway pressure achieved, and, as described above, PEEP provides an easy way of elevating airway pressures. Re-expansion of collapsed lung units, improved ventilation of alveoli with low  ratios, and redistribution of extravascular lung water will all contribute to the observed improvement in oxygenation. The use of PEEP for prevention of atelectasis in anaesthesia is described on page 336, whilst its contribution to the treatment of pulmonary oedema and acute lung injury are described on pages 424 and 457 respectively.
The Valsalva Effect
It has long been known that an increase in intrathoracic pressure has complex circulatory effects, characterised as the Valsalva effect, which is the circulatory response to a subject increasing his airway pressure to about 5 kPa (50 cmH2O) against a closed glottis for about 30 seconds. The normal response is in four parts (Figure 32.8A). Initially the raised intrathoracic pressure alters the base line for circulatory pressures and the arterial pressure (measured relative to atmosphere) is consequently increased (phase 1). At the same time, ventricular filling is decreased by the adverse pressure gradient from peripheral veins to the ventricle in diastole, and cardiac output therefore decreases. The consequent decline in arterial pressure in phase 2 is normally mitigated by three factors – tachycardia, increased systemic vascular resistance (afterload) and an increase in peripheral venous pressure, which tends to restore the venous return. As a result of these compensations, the arterial pressure normally settles to a value fairly close to the level before starting the Valsalva manoeuvre. When the intrathoracic pressure is restored to normal, there is an immediate decrease in arterial pressure due to the altered base line. Simultaneously the venous return improves and therefore the cardiac output increases within a few seconds. However, the arteriolar bed remains constricted temporarily, and there is therefore a transient overshoot of arterial pressure.
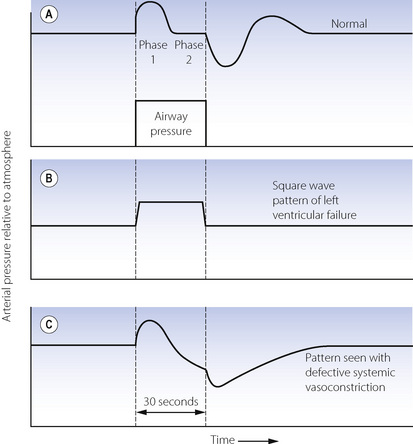
Fig. 32.8 Qualitative changes in mean arterial blood pressure during a Valsalva manoeuvre as seen in the normal subject and for two abnormal responses. See text for explanation of the changes.
Figure 32.8B shows the abnormal ‘square wave’ pattern that occurs with raised end-diastolic pressure or left ventricular failure or both. The initial increase in arterial pressure (phase 1) occurs normally, but the decline in pressure in phase 2 is missing because the output of the congested heart is not usually limited by end-diastolic pressure. Because the cardiac output is unchanged, there is no increase in pulse rate or systemic vascular resistance. Therefore there is no overshoot of pressure when the intra-thoracic pressure is restored to normal.
Figure 32.8C shows a different abnormal pattern, which may be seen with defective systemic vasoconstriction (e.g. autonomic neuropathy or a spinal anaesthetic). Phase 1 is normal, but in phase 2, the decreased cardiac output is not accompanied by an increase in systemic vascular resistance and the arterial pressure therefore continues to decline. The normal overshoot is replaced by a slow recovery of arterial pressure as the cardiac output returns to control values.
Cardiovascular Effects of Positive Pressure Ventilation43,44
Initially there was great reluctance to use PEEP, partly because of the well-known Valsalva effect, and partly because of the circulatory hazard that had been described in the classic paper of Cournand and his colleagues in 1948.45 Not many papers in this field have two Nobel prize winners amongst their authors. The cardiovascular effects of IPPV and PEEP continue to cause problems in clinical practice, and after another half century of investigation, the effects remain incompletely elucidated.
Cardiac output.43 Bindslev et al41 reported a progressive decrease in cardiac output with IPPV and PEEP in anaesthetised patients without pulmonary pathology. Compared with when anaesthetised and breathing spontaneously, cardiac output was reduced by 10% with IPPV and ZEEP, 18% with 9 cmH2O of PEEP, and 36% with 16 cmH2O of PEEP. Another study, this time in patients with severe acute lung injury, also demonstrated a progressive reduction in cardiac output for PEEP in the range 5–30 cmH2O, but the effect was partially reversed by blood volume expansion (Figure 32.9).
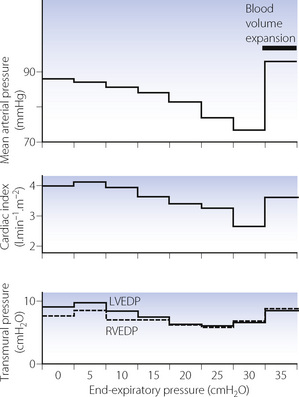
Fig. 32.9 Cardiovascular responses as a function of positive end-expiratory pressure (PEEP) in patients with acute lung injury. Left and right ventricular end-diastolic pressure (LVEDP and RVEDP) were measured relative to intrapleural pressure.
(Drawn from data of reference 46 and reproduced from reference 47 by permission of the publishers of International Anesthesiology Clinics.)
There is general agreement that the main cause of the reduction in cardiac output is obstruction to filling of the right atrium, caused by the elevated intrathoracic pressure. With spontaneous respiration, the negative intrathoracic pressure during inspiration draws blood into the chest from the major veins, known as the ‘thoracic pump’. Positive intrathoracic pressure abolishes this effect and also imposes a further reduction in driving pressure for flow between extra- and intrathoracic vessels. Reduced right ventricle (RV) filling pressures quickly lead to reduced left ventricle (LV) filling, and cardiac output falls.48 These changes will clearly be more pronounced with hypovolaemia. Paradoxically, this physiological response may be utilised to treat hypovolaemia by imposing an inspiratory resistance to further reduce the negative inspiratory pressure and improve venous return.49
A second cause for reduced cardiac output may come into play with high airway pressures, moderate PEEP, or lung hyperinflation such as occurs with PEEPi. As described above, increasing lung volume leads to elevated pulmonary vascular resistance, which will cause an increase in RV volume.42 There is now good evidence that dilation of the RV has profound effects on LV function, preventing adequate LV filling and reducing LV compliance, both of which lead to a fall in cardiac output.43 Contractility of the LV is not thought to change with positive intrathoracic pressure. Interactions of some of the factors by which PEEP may influence cardiac output and systemic arterial pressure are shown in Figure 32.10.
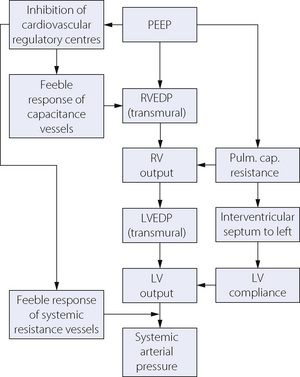
Fig. 32.10 Summary of the possible cardiovascular effects of positive end-expiratory pressure (PEEP). See text for full explanation. RVEDP and LVEDP, right and left ventricular end-diastolic pressure; RV and LV, right and left ventricle.
Oxygen flux. In many patients with pulmonary disease, PEEP tends to improve the arterial Po2 while decreasing the cardiac output. As PEEP is increased the oxygen delivery (the product of cardiac output and arterial oxygen content; page 202) tends to rise to a maximum and then falls. Assuming that a normal or high oxygen flux is desirable, use of IPPV or PEEP therefore requires optimisation of cardiac output with fluid replacement (see Figure 32.9) or with positive inotropes, and this is now routine practice in critical care units.
Arterial blood pressure. Figure 32.9 shows the decline in mean arterial pressure closely following the change in cardiac output with increasing PEEP. Although there was some increase in systemic vascular resistance, this was only about half that required for maintenance of the arterial pressure in the face of the declining cardiac output.
Interpretation of vascular pressures. Atrial pressures are normally measured relative to atmospheric pressure. With positive pressure ventilation, atrial pressures tend to be increased relative to atmospheric. However, relative to intrathoracic pressure, they are reduced at higher levels of PEEP (Figure 32.9). It is the transmural pressure gradient and not the level relative to atmosphere that is relevant to cardiac filling.44
Transmission of airway pressure to other intrathoracic structures. The intrapleural pressure is protected from the level of PEEP by the transmural pressure gradient of the lungs. Animal studies have shown that reduced pulmonary compliance is the main factor governing the transmission of airway pressure to other thoracic structures. With reduced compliance the effect of mean intrathoracic pressure on cardiac output is greatly reduced.48 Patients with diseased lungs tend to have reduced pulmonary compliance, which limits the rise in intrapleural pressure (Figure 32.11). Therefore, their cardiovascular systems are better protected against the adverse effects of IPPV and PEEP.
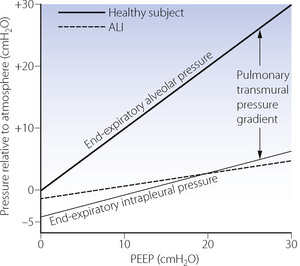
Fig. 32.11 End-expiratory alveolar and intrapleural pressures as a function of positive end-expiratory pressure (PEEP). The lower unbroken line shows intrapleural pressure in the relaxed healthy subject. The broken line shows values of intrapleural pressure in patients with acute lung injury taken from reference 46. Absolute values of pressure probably reflect experimental technique and cannot be compared between studies.
(Reproduced from reference 47 by permission of the publishers of International Anesthesiology Clinics.)
Haemodynamic response in heart failure. The cardiovascular responses described thus far apply only to patients with normal cardiac function, and, like the Valsalva response, are very different in patients with raised ventricular end-diastolic pressure with or without ventricular failure.44 Reduction of venous return to an overloaded and failing right heart will return the RV to a more favourable section of its Frank–Starling curve (see Figure 29.3) and so improve its function. Reducing RV end-diastolic volume will overcome some of the adverse ventricular interactions that occur in heart failure and so also improve LV function. These factors almost certainly contribute to the success of CPAP in the treatment of cardiogenic pulmonary oedema (page 424).
Other Physiological Effects
Renal effects. Patients receiving prolonged IPPV tend to become oedematous. Protein depletion and inappropriate fluid loading may be factors but there is also evidence that PEEP itself reduces glomerular filtration.50 Arterial pressure tends to be reduced as described above, while central venous pressure is raised. Therefore, the pressure gradient between renal artery and vein is reduced and this has a direct effect on renal blood flow. In addition, PEEP causes elevated levels of antidiuretic hormone, possibly due to activation of left atrial receptors, although this is insufficient to fully explain the changes in urinary flow rate.
Pulmonary neutrophil retention. Neutrophils have a diameter close to that of a pulmonary capillary, and this is important in slowing their transit time through the lung to facilitate margination for pulmonary defence mechanisms (page 435). Any reduction in pulmonary capillary diameter may therefore be expected to increase pulmonary neutrophil retention, which has indeed been demonstrated in humans following a Valsalva manoeuvre51 or with the application of PEEP.52 If the neutrophils trapped in this way have already been activated, for example following cardiopulmonary bypass, then lung injury may occur.
Ventilator-Associated Lung Injury53,54
The first description of the potential harm that artificial ventilation may cause to the lungs was published in 1745 by John Fothergill.55,56 Following the successful resuscitation of a patient using expired air respiration rather than bellows, which were fashionable at the time, Fothergill wrote that:
the lungs of one man may bear, without injury, as great a force as those of another man can exert; which by the bellows cannot always be determin’d.
Artificial ventilation may damage normal lungs only after prolonged ventilation with high airway pressures or large tidal volumes, and is rarely a problem in clinical practice. However, in abnormal lungs such as during acute lung injury (Chapter 31) VALI may contribute not only to further lung damage, but also to multisystem organ failure affecting other body systems.57
Barotrauma
A sustained increase in the transmural pressure gradient can damage the lung. The commonest forms of barotrauma attributable to artificial ventilation with or without PEEP are subcutaneous emphysema, pneumomediastinum and pneumothorax. Pulmonary barotrauma probably starts as disruption of the alveolar membrane, with air entering the interstitial space and tracking along the bronchovascular bundles into the mediastinum, from which it can reach the peritoneum, the pleural cavity or the subcutaneous tissues. Radiological demonstration of pulmonary interstitial gas may provide an early warning of barotrauma.
A second form of barotrauma is bronchiolectasis,58 which describes gross dilatation of terminal and respiratory bronchioles which used to be commonly seen at autopsy in patients following prolonged artificial ventilation. The development of bronchiolectasis was increased by high PEEP levels, high peak airway pressures, large tidal volumes and the duration of artificial ventilation. The condition of bronchiolectasis appears to be analogous to bronchopulmonary dysplasia described in infants ventilated for respiratory distress syndrome.59 Hopefully, modern ventilators and ventilatory strategies mean that this condition is now unlikely to develop.
Volutrauma55
Many animal studies have demonstrated pulmonary oedema following artificial ventilation with high inflation pressures. In one of these studies, lung damage with high inflation pressures was attenuated by restricting chest movement to prevent over-distension of the lungs, indicating that alveolar size rather than pressure was responsible for lung injury.60 Termed volutrauma, this is now believed to contribute significantly to lung damage in patients with acute lung injury, in whom only a small proportion of alveoli may receive the entire tidal volume (page 457).
This form of VALI most commonly manifests itself as interstitial or alveolar pulmonary oedema. There are several possible underlying mechanisms, all of which are closely inter-related.
Alveolar distension causes permeability pulmonary oedema (page 423).53 With extreme lung distension in animal studies this occurs quickly and probably results from direct trauma to alveolar structures. Recent work on lung cell cultures in vitro has revealed some of the mechanisms of this cellular trauma.61 Severe stretching of the cells can induce apoptosis, provoke the release of inflammatory cytokines, or damage tight junctions between cells or the plasma membrane. Stretch frequency is also an important determinant of the damage done, supporting the inclination towards slower respiratory rates in injured lungs. In larger animals and humans, the permeability changes occur slowly (several hours) and are likely to result from the alterations in surfactant and inflammatory mediators described below rather than widespread cellular damage.
Airway trauma occurs with repeated closure and reopening of small airways with each breath, and has been termed atelectrauma. Eventually, mucosal oedema will develop and the airways become progressively more difficult to open until collapse occurs. Recruitment of lung units with positive pressure ventilation has beneficial effects on gas exchange, and so encourages the use of higher pressures and volumes to recruit more airways, leading to further VALI.
Surfactant function is affected by artificial ventilation. Animal studies have demonstrated that surfactant release is increased by artificial ventilation, but there is also ample evidence that surfactant function is reduced.53 Cyclical closure of airways during expiration causes surfactant to be drawn from the alveoli into the airway,62 whilst alveolar proteins seen with permeability oedema inactivate surfactant (page 456). The resultant increase in alveolar surface tension will not only affect lung compliance but may also increase local microvascular permeability and encourage alveolar collapse.
Lung inflammation occurs with VALI. Termed biotrauma, this includes a pro-inflammatory response to ventilation that is independent of any infection present, and also includes activation of immunological and coagulation systems, and cellular growth and apoptotic pathways.54 Pulmonary neutrophils are implicated in biotrauma and their migration into lung tissue has been described above. Once activated – for example, by stretching as described above or by exposure to the alveolar basement membrane – inflammatory mediators will contribute to permeability oedema and further loss of surfactant function.
Prevention of VALI
PEEP. In spite of its contribution to mean airway pressure, animal studies show that modest amounts of PEEP are helpful in reducing VALI.63 Reduction of interstitial oedema, prevention of cyclical airway closure, and preservation of surfactant function are all possible mechanisms for this effect. Determination of an acceptable level of PEEP in injured lungs is discussed on page 457.
Tidal volume and airway pressure should be minimised as far as possible. Plateau pressure is the ventilator measurement that equates most closely to the degree of alveolar distension. It is currently recommended that in patients with normal chest wall compliance the plateau pressure should not be allowed to exceed 35 cmH2O.64
A ‘protective’ ventilation strategy that combines these requirements is described on page 457, and its use in the clinical setting to reduce VALI is now widely accepted.
Artificial Ventilation for Resuscitation
Until about 1960, artificial ventilation was usually attempted by application of mechanical forces directly to the trunk. Methods were based on the rescuer manipulating the trunk and arms of the victim to achieve changes in lung volume which, when performed in sequence could produce some degree of pulmonary ventilation. These methods, which undoubtedly saved many lives in the past, are now largely obsolete.
Expired Air Ventilation65
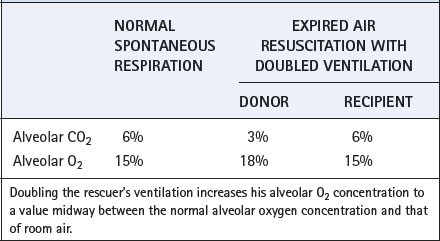
Recognition of the inadequacy of the manual methods of artificial ventilation led directly to a radical new approach to artificial ventilation in an emergency. Around 1960 there was vigorous re-examination of the concept of the rescuer’s expired air being used for inflation of the victim’s lungs.
At first sight, it might appear that expired air would not be a suitable inspired air for the victim. However, if the rescuer doubles his ventilation he is able to breathe for two. If neither party had any respiratory dead space, the simple relationship shown in Table 32.4 would apply. In fact, the rescuer’s dead space improves the situation. At the start of inflation, the rescuer’s dead space is filled with fresh air and this is the first gas to enter the victim’s lungs. If the rescuer’s dead space is artificially increased by apparatus dead space, this will improve the freshness of the air that the victim receives and will also reduce the likelihood of hypocapnia in the rescuer.
Expired air ventilation has now displaced the manual methods in all except the most unusual circumstances and its success depends on the following factors:
In ‘out-of-hospital’ cardiac arrest situations bystanders are reluctant to attempt cardiopulmonary resuscitation (CPR), usually from an unjustified fear of infection, to such an extent that CPR is attempted in less than a third of victims.67,68 This has led to several studies of the contribution made by expired-air ventilation in this situation, comparing standard CPR with chest compressions alone. For the first few minutes after a witnessed cardiac arrest, oxygen stores in the blood and lungs may obviate the need for artificial ventilation until trained personnel and equipment arrive. The trials so far have found no difference in outcomes between the groups receiving ventilation or not,67 and recent recommendations are that for witnessed, out-of-hospital, collapse expired air ventilation is not necessary until help arrives. It is hoped that if avoiding the requirement for ventilation encourages more bystanders to intervene by providing cardiac compressions alone then overall survival may be improved.68
Extrapulmonary Gas Exchange
The development of an artificial lung remains only a distant possibility,69,70 but techniques for short-term replacement of lung function or more prolonged partial respiratory support have existed for many years. Extracorporeal gas exchangers were first developed for cardiac surgery to facilitate cardiopulmonary bypass and so allow surgery on a motionless heart. Subsequently the use of extracorporeal, and more recently intracorporeal, gas exchange was extended into the treatment of respiratory failure.
Factors in Design71
The lungs of an adult have an interface between blood and gas of the order of 126 m2. It is not possible to achieve this in an artificial substitute, and artificial lungs can be considered to have a very low ‘diffusing capacity’. Nevertheless, they function satisfactorily within limits for many reasons.
Factors favouring performance
The real lung is adapted for maximal exercise, while patients requiring extrapulmonary gas exchange are usually close to basal metabolic rate or less if hypothermia is used, for example during cardiac surgery. Under resting conditions at sea level, there is an enormous reserve in the capacity of the lung to achieve equilibrium between pulmonary capillary blood and alveolar gas (see Figure 9.2). Therefore, a subnormal diffusing capacity does not necessarily result in arterial hypoxaemia. It is possible to operate an artificial lung with an ‘alveolar’ oxygen concentration in excess of 90%, compared with 14% for real alveolar gas under normal circumstances. This greatly increases the oxygen transfer for a given ‘diffusing capacity’ of the artificial lung. The ‘capillary transit time’ of an artificial lung can be increased beyond the 0.75 second in the real lung. This facilitates the approach of blood Po2 to ‘alveolar’ Po2 (see Figure 9.2). It is possible to use countercurrent flow between gas and blood. This does not occur in the lungs of mammals although it is used in the gills of fishes.Carbon dioxide exchanges much more readily than oxygen because of its greater blood and lipid solubility. Therefore, in general, elimination of carbon dioxide does not present a major problem and the limiting factor of an artificial lung is oxygenation.
Unfavourable factors
Against these favourable design considerations, there are certain advantages of the real lung – apart from its very large surface area – that are difficult to emulate in an artificial lung.
The pulmonary capillaries have a diameter close to that of a red blood cell (RBC). Therefore, each RBC is brought into very close contact with the alveolar gas (see Figure 2.7). The diffusion distance for artificial lungs is considerably greater and this problem is considered further below.Bubble oxygenators
By breaking up the gas stream into small bubbles, it is possible to achieve very large surface areas of interface. However, the smaller the bubbles, the greater the tendency for them to remain in suspension when the blood is returned to the patient. This is dangerous during cardiopulmonary bypass because of the direct access of the blood to the systemic circulation. With a mean RBC transit time of 1–2 seconds and an oxygen concentration of more than 90%, bubble oxygenators achieve an acceptable outflow blood Po2 with blood flow rates up to about 6 l.min−1. The Pco2 of the outflowing blood must be controlled by admixture of carbon dioxide with the inflowing oxygen in the gas phase.
Cellular and protein damage (see below) at the blood–gas interface occurs in bubble oxygenators. This is not considered to have significant clinical effects during short term use, as for example with cardiac surgery, but may become significant when used for prolonged periods in the treatment of respiratory failure.71
Membrane oxygenators
Diffusion properties. Unlike their predecessors, currently available membranes offer little resistance to the diffusion of oxygen and carbon dioxide. At 25–50 μm thick, artificial membranes are several times thicker than the active side of the alveolar/capillary membrane (Figure 2.8), but they contain small (< 1 μm) pores, which increase gas transfer substantially. The hydrophobic nature of the membrane material prevents water entering the pores and in normal use membranes can withstand a hydrostatic pressure gradient of the order of normal arterial blood pressure. Over time the pores tend to fill with protein which slowly reduces the membrane efficiency.
Gas diffusion within the blood presents a considerable barrier to efficiency of membrane oxygenators. Slow diffusion of gases through plasma is now thought to limit gas transfer in normal lung, in which the RBC is almost in contact with the capillary wall (page 148). Streamline flow through much wider channels in a membrane oxygenator tends to result in a stream of RBCs remaining at a distance from the interface. It has been estimated that in membrane oxygenators the diffusion path for oxygen is about 25 times further than in lung. Much thought has been devoted to the creation of turbulent flow to counteract this effect by ‘mixing’ the blood. Unfortunately, this inevitably leads to a greater degree of cell damage (see below) and increased resistance to flow through the oxygenator.
Biocompatibility. Adsorption of proteins, particularly albumin, onto the membrane reduces platelet, neutrophil and complement activation (see below), and this technique may be used to ‘prime’ oxygenators before use. Attempts to mimic endothelial cell properties have led to the production of membranes with heparin bonded to the surface, which also reduces activation of most of the processes described below.
Damage to Blood
Damage due to oxygenators is probably far less than that which results from surgical suction in removing blood from the operative site and, during cardiac surgery, this factor outweighs any differences attributable to the type of oxygenator. However, during prolonged extracorporeal oxygenation for respiratory failure, the influence of the type of oxygenator becomes important, and membrane oxygenators are then clearly superior to bubble oxygenators.
Protein denaturation. Contact between blood and either gas bubbles or synthetic surfaces results in protein denaturation, and synthetic surfaces become coated with a layer of protein. With membrane oxygenators this tends to be self-limiting, and the protein products remain bound to the membrane. Bubble oxygenators cause a continuous and progressive loss of protein, including the release of denatured proteins into the circulation where they may have biological effects.
Complement activation. Complement activation occurs when blood comes into contact with any artificial surface and complement C5a is known to be formed after cardiopulmonary bypass surgery.
RBCs. Shear forces, resulting from turbulence or foaming, may cause shortened survival or actual destruction of RBCs. However, without surgical suction, damage to RBCs with membrane oxygenators remains within reasonable limits for many days.
Leukocytes and platelets. Counts of these elements are usually reduced by an amount in excess of the changes attributable to haemodilution. Platelets are lost by adhesion and aggregation, and following cardiac surgery postoperative counts are commonly about half the preoperative value. Neutrophil activation may occur within the extracorporeal circuit leading to pathological effects in distant organs.
Coagulation. No oxygenator can function without causing coagulation of the blood. Anticoagulation is therefore a sine qua non of the technique and heparin is usually employed for this purpose. Heparin-bonded components have significantly reduced the systemic anticoagulant requirement and allowed more prolonged use of circuits, but coagulopathy remains the most common complication of extracorporeal circulation.72
Systems for Extrapulmonary Gas Exchange73
Cardiopulmonary bypass for cardiac surgery remains the most common situation in which patients are exposed to extrapulmonary gas exchange. The duration of such exposure is normally very short, and causes few physiological disturbances postoperatively. Providing longer term respiratory support is much less common, and also considerably more difficult, but three techniques exist.
Extracorporeal membrane oxygenation (ECMO).74 A traditional ECMO system requires continuous blood flow from the patient to a reservoir system, from which a pump propels blood through an oxygenator and a heat exchanger back to the patient. Venovenous ECMO is acceptable for treatment of respiratory failure, and may be instituted via percutaneous venous catheters. If circulatory support is also required, then venoarterial ECMO is used, which normally requires surgical access to the vessels. A typical adult ECMO circuit provides 7 m2 of membrane for oxygenation using 100% oxygen, with blood flows of approximately 2–4 l.min−1. The technique is only available in specialised centres, so in recent years ECMO systems have been developed for use whilst transporting the patient to the ECMO facilities.75
Technological improvements in the design of ECMO circuits have allowed the development of a simplified system referred to as pumpless extracorporeal lung assist (pECLA). In pECLA arterial and venous cannulae are connected to a small membrane oxygenator and the patient’s own blood pressure drives blood flow through the system.76,77 The surface area of the pECLA device is about 1.3 m2, and blood flows of 1.0–2.5 l.min−1 occur across one side of the membrane and about 10 l.min−1 of oxygen is passed across the other side. As the name implies, pECLA systems are too small to entirely replace the gas exchange function of the lungs, but it can provide valuable respiratory support in a much less invasive fashion than traditional ECMO. As would be expected, oxygenation with pECLA is less effective than CO2 removal, with average values for oxygen transfer of 41.7 ml.min−1 compared with 148.0 ml.min−1 for CO2.78
Extracorporeal carbon dioxide removal (ECCO2R). A different approach to artificial gas exchange was attempted by Gattinoni et al.79 An ECMO system was used only to remove carbon dioxide, and oxygenation maintained by a modification of apnoeic mass movement oxygenation (page 172). The lungs were either kept motionless or were ventilated two to three times per minute.
The technique depended on two important differences between the exchange of carbon dioxide and oxygen. First, membrane oxygenators remove carbon dioxide some 10–20 times more effectively than they take up oxygen. Second, the normal arterial oxygen content (20 ml.dl−1) is very close to the maximum oxygen capacity, even with 100% oxygen in the gas phase (22 ml.dl−1). Therefore, there is little scope for superoxygenation of a fraction of the cardiac output to compensate for a larger fraction of the cardiac output in which oxygenation does not take place. In contrast, the normal mixed venous carbon dioxide content is 52 ml.dl−1 compared with an arterial carbon dioxide content of 48 ml.dl−1. There is therefore ample scope for removing a larger than normal fraction of carbon dioxide from a part of the cardiac output to compensate for the remaining fraction that does not undergo any removal of carbon dioxide. It is therefore possible to maintain carbon dioxide homoeostasis by diversion of only a small fraction of the cardiac output through an extracorporeal membrane oxygenator.79 Despite this advantage, ECCO2R was never a widely adopted technique and no improvements in survival were found.
Intravascular oxygenators (IVOX).80 Siting the gas exchange membrane within the patient’s own circulation obviates the need for any extracorporeal circulation. In return, the size of the gas exchange surface is severely limited, and the blood flow around the membrane no longer controlled. However, the development of a heparin-bonded hollow fibre oxygenator suitable for use in humans promoted interest in the technique. The device is inserted via surgical exposure of the femoral vein until it lies throughout the length of both inferior and superior vena cavae, through the right atrium. An IVOX device comes in different sizes between 40–50 cm long with 600–1100 fibres through which oxygen flows, providing a surface area of 0.21–0.52 m2 for gas exchange.81 Blood flow in the vena cavae is thought to be mostly laminar, even with the IVOX in place, and gas exchange is again therefore limited by diffusion within the blood.80 The available membrane surface area with IVOX is such that total extrapulmonary gas exchange is currently impossible, and the technique is suitable only for partial respiratory support.
IVOX does allow some improvement in ventilator settings, which should alleviate the risk of lung trauma. Outcome studies are awaited, but it is unlikely that the modest improvement in gas exchange seen with current systems will have significant effects.82
Clinical Applications83
Neonates and infants.73,74 Acute respiratory failure in neonates and infants results from a variety of causes such as meconium aspiration syndrome, congenital diaphragmatic hernia, acute respiratory distress syndrome and a variety of infections. ECMO is indicated for treatment of acute respiratory failure of such severity that predicted survival is less than 20%. Though survival varies with the aetiology, there is general agreement that ECMO improves outcome substantially in infants, with some centres achieving survival figures of almost 80%.74 Complications of ECMO are, however, numerous. Vascular access in infants is difficult, and venoarterial ECMO using the carotid and jugular vessels is often required, though venovenous ECMO with a double lumen cannula is now widely used. In either case, cerebral blood flow may be affected during ECMO and as result a significant number of ECMO treated infants develop cerebral damage, which in some infants causes long term disability.74,84 Improvements in other therapies, including artificial ventilation, for these very sick patients have led to a progressive reduction in the number treated with ECMO.83
Adults.85 Extrapulmonary gas exchange is occasionally used as a therapeutic ‘bridge’ in patients waiting for lung transplantation, but its main indication is for management of severe acute lung injury (Chapter 30). Ventilator-associated lung injury as a result of artificial ventilation (page 481) contributes to respiratory failure in severe ALI, and the prospect of using extrapulmonary gas exchange to facilitate ‘lung rest’ is attractive.
Unfortunately, the significant benefits of ECMO use in infants have not been found in adults, and its place in treatment remains controversial.83,86 The invasive nature of extrapulmonary gas exchange and the serious potential complications mean that ECMO is used only in the most severely ill patients. Even in specialist centres, recruitment of enough patients for randomised trials is difficult, and units have tended to simply publish results of uncontrolled case series, though further clinical trials are in progress.
Current interest in pECLA has led to its use in a variety of circumstances to reduce arterial Pco2 to acceptable levels in artificially ventilated patients.87 Perhaps the latest technique for partial lung replacement will succeed in the adult clinical environment where its predecessors have mostly failed.
References
1. Hillberg RE, Johnson DC. Noninvasive ventilation. N Engl J Med.. 1997;337:1746-1752.
2. Mehta S, Hill NS. Noninvasive ventilation. Am J Respir Crit Care Med.. 2001;163:540-577.
3. Hill NS. Clinical applications of body ventilators. Chest. 1986;90:897-905.
4. Drinker P, Shore LA. An apparatus for the prolonged administration of artificial respiration. J Clin Invest.. 1929;7:229-247.
5. Thomson A. The role of negative pressure ventilation. Arch Dis Child. 1997;77:454-458.
6. Grasso F, Engelberts D, Helm E, et al. Negative-pressure ventilation: Better oxygenation and less lung injury. Am J Respir Crit Care Med.. 2008;177:412-418.
7. Petros AJ, Fernando SSD, Shenoy VS, Al-Saady NM. The Hayek oscillator. Nomograms for tidal volume and minute ventilation using external high frequency oscillation. Anaesthesia. 1995;50:601-606.
8. Dilkes MG, McNeill JM, Hill AC, Monks PS, McKelvie P, Hollamby RG. The Hayek oscillator: a new method of ventilation in microlaryngeal surgery. Ann Otol Rhinol Laryngol.. 1993;102:455-458.
9. Chiumello D. Is the helmet different than the face mask in delivering noninvasive ventilation? Chest. 2006;129:1402-1403.
10. Claman DM, Pipier A, Sanders MH, Stiller RA, Votteri BA. Nocturnal noninvasive positive pressure ventilatory assistance. Chest. 1996;110:1581-1588.
*11. Ambrosino N, Vagheggini G. Noninvasive positive pressure ventilation in the acute care setting: where are we? Eur Respir J. 2008;31:874-886.
12. Kolodziej MA, Jensen L, Rowe B, Sin D. Systematic review of noninvasive positive pressure ventilation in severe stable COPD. Eur Respir J. 2007;30:293-306.
13. Peter JV, Moran JL, Phillips-Hughes J, Graham P, Bersten AD. Effect of non-invasive positive pressure ventilation (NIPPV) on mortality in patients with acute cardiogenic pulmonary oedema: a meta-analysis. Lancet. 2006;367:1155-1163.
14. Antonelli M, Conti G, Esquinas A, et al. A multiple-center survey on the use in clinical practice of noninvasive ventilation as a first-line intervention for acute respiratory distress syndrome. Crit Care Med.. 2007;35:18-25.
15. L'Her E, Deye N, Lellouche F, et al. Physiologic effects of noninvasive ventilation during acute lung injury. Am J Respir Crit Care Med.. 2005;172:1112-1118.
16. Burns KEA, Adhikari NKJ, Keenan SP, Meade M. Use of non-invasive ventilation to wean critically ill adults off invasive ventilation: meta-analysis and systematic review. BMJ. 2009;338:1305-1308.
17. El Solh AA, Aquilina A, Pineda L, Dhanvantri V, Grant B, Bouquin P. Noninvasive ventilation for prevention of post-extubation respiratory failure in obese patients. Eur Respir J. 2006;28:588-595.
18. Rossi A, Appendini L. Wasted efforts and dyssynchrony: is the patient-ventilator battle back? Intensive Care Med.. 1995;21:867-870.
19. Sassoon CSH, Gruer SE. Characteristics of the ventilator pressure- and flow-trigger variables. Intensive Care Med.. 1995;21:159-168.
20. Dongelmans DA, Veelo DP, Bindels A, et al. Determinants of tidal volumes with adaptive support ventilation: a multicenter observational study. Anesth Analg.. 2008;107:932-937.
21. Neumann P, Golisch W, Strohmeyer A, Buscher H, Burchardi H, Sydow M. Influence of different release times on spontaneous breathing pattern during airway pressure release ventilation. Intensive Care Med.. 2002;28:1742-1749.
22. Dekel B, Segal E, Perel A. Pressure support ventilation. Arch Intern Med.. 1996;156:369-373.
23. Smith BE. High frequency ventilation: past, present and future? Br J Anaesth.. 1990;65:130-138.
24. Bouchut J-C, Godard J, Claris O. High-frequency oscillatory ventilation. Anesthesiology. 2004;100:1007-1012.
25. Chan KPW, Stewart TE, Mehta S. High-frequency oscillatory ventilation for adult patients with ARDS. Chest. 2007;131:1907-1916.
26. Chakrabarti MK, Gordon G, Whitwam JG. Relationship between tidal volume and deadspace during high frequency ventilation. Br J Anaesth.. 1986;58:11-17.
27. Butler WJ, Bohn DJ, Bryan AC, Froese AB. Ventilation by high-frequency oscillation in humans. Anesth Analg.. 1980;59:577-584.
28. Nunn JF, Hill DW. Respiratory dead space and arterial to end-tidal CO2 tension difference in anesthetized man. J Appl Physiol.. 1960;15:383-389.
29. Hurst JM, Branson RD, Davis K, Barrette RR, Adams KS. Comparison of conventional mechanical ventilation and high-frequency ventilation. A prospective randomized trial in patients with respiratory failure. Ann Surg.. 1990;211:486-491.
30. MacIntyre N. Discontinuing mechanical ventilator support. Chest. 2007;132:1049-1056.
*31. Boles J-M, Bion J, Connors A, et al. Weaning from mechanical ventilation. Eur Respir J. 2007;29:1033-1056.
*32. MacIntyre NR, Cook DJ, Ely EW, et al. Evidence-based guidelines for weaning and discontinuing ventilatory support. A collective task force facilitated by the American College of Chest Physicians; the American Association of Respiratory Care; and the American College of Critical Care Medicine. Chest. 2001;120:375S-395S.
33. Yang KL, Tobin MJ. A prospective study of indexes predicting the outcome of trials of weaning from mechanical ventilation. N Engl J Med.. 1991;324:1445-1450.
34. Simonds AK. Streamlining weaning: protocols and weaning units. Thorax. 2005;60:175-177.
35. Hill JD, Main FB, Osborn JJ, Gerbode F. Correct use of respirator on cardiac patient after operation. Arch Surg.. 1965;91:775-778.
36. Gottfried SB, Reissman H, Ranieri M. A simple method for the measurement of intrinsic end-expiratory pressure during controlled and assisted modes of mechanical ventilation. Crit Care Med.. 1992;20:621-629.
37. Conacher ID. Dynamic hyperinflation – the anaesthetist applying a tourniquet to the right heart. Br J Anaesth.. 1998;81:116-117.
*38. Soni N, Williams P. Positive pressure ventilation: what is the real cost? Br J Anaesth.. 2008;101:446-457.
39. Vellody VPS, Nassery M, Balasaraswathi K, Goldberg NB, Sharp JT. Compliances of human rib cage and diaphragm-abdomen pathways in relaxed versus paralyzed states. Am Rev Respir Dis.. 1978;118:479-491.
40. Hulands GH, Greene R, Iliff LD, Nunn JF. Influence of anaesthesia on the regional distribution of perfusion and ventilation in the lung. Clin Sci.. 1970;38:451-460.
41. Bindslev LG, Hedenstierna G, Santesson J, Gottlieb I, Carvallhas A. Ventilation-perfusion distribution during inhalational anaesthesia. Acta Anaesthesiol Scand.. 1981;25:360-371.
42. Biondi JW, Schulman DS, Soufer R, et al. The effect of incremental positive end-expiratory pressure on right ventricular hemodynamics and ejection fraction. Anesth Analg.. 1988;67:144-151.
*43. Pinsky MR. The hemodynamic consequences of mechanical ventilation: an evolving story. Intensive Care Med.. 1997;23:493-503.
44. Tyberg JV, Grant DA, Kingma I, et al. Effects of positive intrathoracic pressure on pulmonary and systemic hemodynamics. Respir Physiol.. 2000;119:163-171.
45. Cournand A, Motley HL, Werko L, Richards DW. Physiological studies of the effects of intermittent positive pressure breathing on cardiac output in man. Am J Physiol.. 1948;152:162-174.
46. Jardin F, Farcot J-C, Boisante L, Curien N, Margairaz A, Bourdarias J-P. Influence of positive end-expiratory pressure on left ventricular performance. N Engl J Med.. 1981;304:387-392.
47. Nunn JF. Positive end-expiratory pressure. Int Anaesthesiol Clin.. 1984;22:149-164.
48. Mitaka C, Nagura T, Sakanishi N, Tsunoda Y, Amaha K. Two-dimensional echocardiographic evaluation of inferior vena cava, right ventricle, and left ventricle during positive-pressure ventilation with varying levels of positive end-expiratory pressure. Crit Care Med.. 1989;17:205-210.
49. Ryan KL, Cooke WH, Rickards CA, Lurie KG, Convertino VA. Breathing through an inspiratory threshold device improves stroke volume during central hypovolemia in humans. J Appl Physiol.. 2008;104:1402-1409.
50. Marquez JM, Douglas ME, Downs JB, et al. Renal function and cardiovascular responses during positive airway pressure. Anesthesiology. 1979;50:393-398.
51. Markos J, Hooper RO, Kavanagh-Gray D, Wiggs BR, Hogg JC. Effect of raised alveolar pressure on leukocyte retention in the human lung. J Appl Physiol.. 1990;69:214-221.
52. Loick HM, Wendt M, Rötker J, Theissen JL. Ventilation with positive end-expiratory airway pressure causes leukocyte retention in human lung. J Appl Physiol.. 1993;75:301-306.
53. Dreyfuss D, Saumon G. Ventilator-induced lung injury: lessons from experimental studies. Am J Respir Crit Care Med.. 1998;157:294-323.
*54. Oeckler RA, Hubmayr RD. Ventilator-associated lung injury: a search for better therapeutic targets. Eur Respir J. 2007;30:1216-1226.
55. Slutsky AS. Lung injury caused by mechanical ventilation. Chest. 1999;116(supp):9S-15S.
56. Fothergill J. Observations on a case published in the last volume of the medical essays, & c. of recovering a man dead in appearance, by distending the lungs with air. Philos Trans R Soc Lond.. 1745;43:275-281.
57. Slutsky AS, Tremblay LN. Multiple system organ failure – is mechanical ventilation a contributing factor. Am J Respir Crit Care Med.. 1998;157:1721-1725.
58. Slavin G, Nunn JF, Crow J, Doré CJ. Bronchiolectasis – a complication of artificial ventilation. BMJ. 1982;285:931-934.
59. Taghizadeh A, Reynolds EOR. Pathogenesis of bronchopulmonary dysplasia following hyaline membrane disease. Am J Pathol.. 1976;82:241-264.
60. Dreyfuss D, Soler P, Basset G, Saumon G. High inflation pressure pulmonary edema. Respective effects of high airway pressure, high tidal volume and positive end-expiratory pressure. Am Rev Respir Dis.. 1988;137:1159-1964.
61. Trepat X, Farré R. Alveolar permeability and stretch: too far, too fast. Eur Respir J. 2008;32:826-828.
62. Faridy EE. Effect of ventilation on movement of surfactant in airways. Respir Physiol.. 1976;27:323-334.
63. Hooper J. Advances in mechanical ventilation. Can J Anaesth.. 1998;45:R149-R154.
64. Slutsky AS. Consensus conference on mechanical ventilation – January 28–30, 1993 at Northbrook, Illinois, USA. Intensive Care Med. 1994; 20: 64–79.
65. Wenzel V, Idris AH, Dörges V, et al. The respiratory system during resuscitation: a review of the history, risk of infection during assisted ventilation, respiratory mechanics, and ventilation strategies for patients with an unprotected airway. Resuscitation. 2001;49:123-134.
66. Thierbach AR, Wolcke BB, Krummenauer F, Kunde M, Jänig C, Dick WF. Artificial ventilation for basic life support leads to hyperventilation in first aid providers. Resuscitation. 2003;57:269-277.
67. SOS-KANTO study group. Cardiopulmonary resuscitation by bystanders with chest compression only (SOS-KANTO): an observational study. Lancet. 2007;369:920-926.
68. Soar J, Nolan JP. Cardiopulmonary resuscitation for out of hospital cardiac arrest. BMJ. 2008;336:782-783.
69. Jack D. Artificial lungs on the way – but don’t hold your breath. Lancet. 1997;349:260.
70. Zwischenberger JB, Alpard SK. Artificial lungs: a new inspiration. Perfusion. 2002;17:253-268.
71. Wegner JA. Oxygenator anatomy and function. J Cardiothorac Vasc Anaesth.. 1997;11:275-281.
72. Briegel J, Hummel T, Lenhart A, Heyduck M, Schelling G, Haller M. Complications during long-term extracorporeal lung assist (ECLA). Acta Anaesthesiol Scand Suppl.. 1996;109:121-122.
73. Walker G, Liddell M, Davis C. Extracorporeal life support – state of the art. Paediatr Respir Rev.. 2003;4:147-152.
74. Cook LN. Update on extracorporeal membrane oxygenation. Paediatr Respir Rev.. 2004;5(supp A):S329-S337.
75. Rossaint R, Pappert D, Gerlach H, Lewandowski K, Keh D, Falke K. Extracorporeal membrane oxygenation for transport of hypoxaemic patients with severe ARDS. Br J Anaes.. 1997;78:241-246.
76. Hoeper MM, Welte T. Extracorporeal lung assist: more than kicking a dead horse? Eur Respir J. 2008;32:1431-1432.
*77. Bein T, Weber F, Philipp A, et al. A new pumpless extracorporeal interventional lung assist in critical hypoxemia/hypercapnia. Crit Care Med.. 2006;34:1372-1377.
78. Müller T, Lubnow M, Philipp A, et al. Extracorporeal pumpless interventional lung assist in clinical practice: determinants of efficacy. Eur Respir J. 2009;33:551-558.
79. Gattinoni L, Pesenti A, Rossi GP, et al. Treatment of acute respiratory failure with low-frequency positive-pressure ventilation and extracorporeal removal of CO2. Lancet. 1980;2:292-294.
80. Bidani A, Zwischenberger JB, Cardenas V. Intracorporeal gas exchange: current status and future development. Intensive Care Med.. 1996;22:91-93.
81. Conrad SA, Eggerstedt JM, Grier LR, Morris VF, Romero MD. Intravenacaval membrane oxygenation and carbon dioxide removal in severe acute respiratory failure. Chest. 1995;107:1689-1697.
82. Peek GJ, Firmin RK. Extracorporeal membrane oxygenation, a favourable outcome? Br J Anaesth.. 1997;78:235-236.
83. Schuerer DJE, Kolovos NS, Boyd KV, Coopersmith CM. Extracorporeal membrane oxygenation. Current clinical practice, coding, and reimbursement. Chest. 2008;134:179-184.
84. Field D, Davis C, Elbourne D, Grant A, Johnson A, Macrea D. UK laborative randomised trial of neonatal extracorporeal membrane oxygenation, UK Collaborative ECMO Trial Group. Lancet, 348. 1996: 75-82.
85. Lewandowski K. Extracorporeal membrane oxygenation for severe acute respiratory failure. Crit Care. 2000;4:156-168.
86. Lennartz H. Extracorporeal lung assist in ARDS: history and state of the art. Acta Anaesthesiol Scand Suppl.. 1996;109:114-116.
87. Hammell C, Forrest M, Barrett P. Clinical experience with a pumpless extracorporeal lung assist device. Anesthesia. 2008;63:1241-1244.