STRUCTURE AND FUNCTION OF THE CARDIOVASCULAR AND LYMPHATIC SYSTEMS


The function of the circulatory system is to deliver oxygen, nutrients, and other substances to all the body’s cells and to remove the waste products of cellular metabolism. Delivery and removal are achieved by a complex array of tubing—the blood vessels—connected to a pump—the heart. The heart pumps blood continuously through the blood vessels with cooperation from other systems, particularly the nervous and endocrine systems, which are intrinsic regulators of the heart and blood vessels. Nutrients and oxygen are supplied by the digestive and respiratory systems; gaseous wastes of cellular metabolism are blown off by the lungs; and other wastes are removed by the kidneys.
Of critical importance is the role of the vascular endothelium. It is a multifunctional organ whose health is essential to normal vascular physiology and whose dysfunction is an important factor in the pathogenesis of vascular disease.
CIRCULATORY SYSTEM
The heart pumps blood through two separate circulatory systems, one to the lungs and one to all other parts of the body. Structures on the right side of the heart, or right heart, pump blood through the lungs. (This system, termed the pulmonary circulation, is described in Chapter 32.) The left side of the heart, or left heart, sends blood throughout the systemic circulation, which supplies all of the body except the lungs (Figure 29-1). These two systems are serially connected, thus the output of one becomes the input of the other.
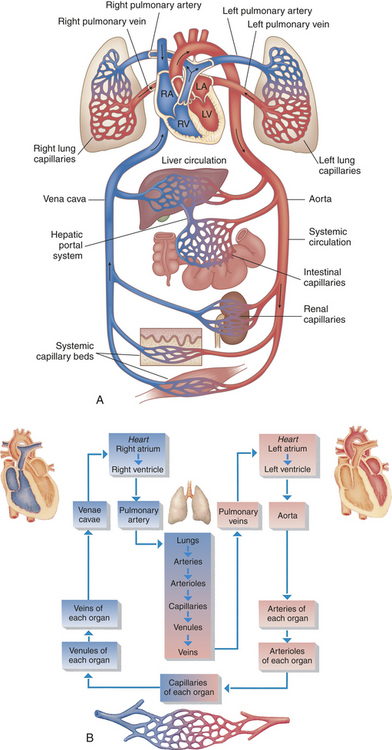
Figure 29-1 Diagram showing serially connected pulmonary and systemic circulatory systems and how to trace the flow of blood. A, Right heart chambers propel unoxygenated blood through the pulmonary circulation, and the left heart propels oxygenated blood through the systemic circulation. B, The direction of blood flow begins at the left ventricle of the heart, flows to the arteries, arterioles, capillaries of each body organ, venules, veins, right atrium, right ventricle, pulmonary artery, lung capillaries, pulmonary veins, left atrium, and then goes back to the left ventricle. RA, Right atrium; RV, right ventricle; LA, left atrium, LV, left ventricle. (B from Thibodeau GA, Patton KT: Anatomy & physiology, ed 5, St Louis, 2003, Mosby.)
Arteries carry blood from the heart to all parts of the body, where they branch into even smaller vessels until they become a fine meshwork of capillaries. Capillaries allow the closest contact and exchange between the blood and the interstitial space, or interstitium—the environment in which the cells live. Veins channel blood from capillaries in all parts of the body back to the heart. The plasma passes through the walls of the capillaries into the interstitial space. This fluid eventually is returned to the cardiovascular system by vessels of the lymphatic system.
THE HEART
The adult heart weighs less than 1 pound and is about the size of a fist. It lies obliquely (diagonally) in the mediastinum, an area above the diaphragm and between the lungs. The heart of a normal woman is smaller and lighter than that of a normal man.
Heart structures can be categorized by function:
1. Structural support of heart tissues and circulation of pulmonary and systemic blood through the heart. This category includes the heart wall and fibrous skeleton, which enclose and support the heart and divide it into four chambers; the valves that direct flow through the chambers; and the great vessels that conduct blood to and from the heart.
2. Maintenance of heart cells. This category comprises vessels of the coronary circulation—the arteries and veins that serve the metabolic needs of all the heart cells—and the lymphatic vessels of the heart.
3. Stimulation and control of heart action. Among these structures are the nerves and specialized muscle cells that direct the rhythmic contraction and relaxation of the heart muscles, propelling blood throughout the pulmonary and systemic circulatory system.
Structures That Direct Circulation Through the Heart
The heart wall has three layers—the pericardium, myocardium, and endocardium. The pericardium is a double-walled membranous sac that encloses the heart (Figure 29-2). The pericardium has several functions. It (1) prevents displacement of the heart during gravitational acceleration or deceleration, (2) is a physical barrier that protects the heart against infection and inflammation from the lungs and pleural space, and (3) contains pain receptors and mechanoreceptors that can elicit reflex changes in blood pressure and heart rate. The outer layer of the pericardium, the parietal pericardium, is composed of a surface layer of mesothelium over a thin layer of connective tissue. The visceral pericardium, or epicardium, is the inner layer of the pericardium. At one point the visceral pericardium folds back and becomes continuous with the parietal pericardium, allowing the large vessels to enter and leave the heart without breaching the pericardial layers.
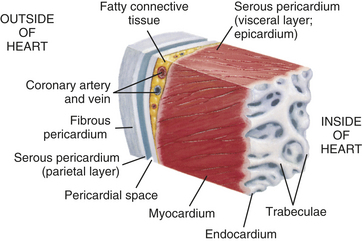
Figure 29-2 Wall of the heart. This section of the heart wall shows the fibrous pericardium, the parietal and visceral layers of the serous pericardium (with the pericardial space between them), the myocardium, and the endocardium. Note the fatty connective tissue between the visceral layer of the serous pericardium (epicardium) and the myocardium. Note also that the endocardium covers beamlike projections of myocardial muscle tissue, called trabeculae. (From Thibodeau GA, Patton KT: Anatomy & physiology, ed 5, St Louis, 2003, Mosby.)
The visceral and parietal pericardia are separated by a fluid-containing space called the pericardial cavity. The pericardial fluid (10 to 30 ml), which is secreted by cells of the mesothelium, lubricates the membranes that line the pericardial cavity, enabling them to slide over one another with a minimum of friction as the heart beats. The amount and character of the pericardial fluid are altered by inflammation of the pericardium (see Chapter 30).
The thickest layer of the heart wall, the myocardium, is composed of cardiac muscle and is anchored to the heart’s fibrous skeleton. The thickness of the myocardium varies tremendously from one heart chamber to another. Thickness is related to the amount of resistance the muscle must overcome to pump blood from the different chambers. The internal lining of the myocardium is composed of connective tissue and a layer of squamous cells called the endocardium (see Figure 29-2). The endocardial lining of the heart is continuous with the endothelium that lines all the arteries, veins, and capillaries of the body, creating a continuous, closed circulatory system.
Chambers of the Heart
The heart has four chambers: the right atrium, left atrium, right ventricle, and left ventricle. (Blood flow through these chambers is illustrated in Figure 29-3.) The atria are smaller than the ventricles and have thinner walls. The wall of the right atrium is about 2 mm thick, and the wall of the left atrium is about 3 to 5 mm thick. The ventricles have a thicker myocardial layer and make up much of the bulk of the heart. The wall of the right ventricle is about 3 to 5 mm thick, and that of the left ventricle, the most muscular chamber, is about 13 to 15 mm. The ventricles are formed by a continuum of muscle fibers that take origin from the fibrous skeleton at the base of the heart (chiefly around the aortic orifice).
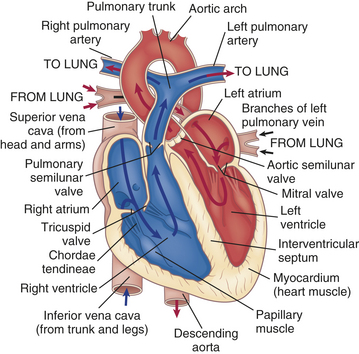
Figure 29-3 Structures that direct blood flow through the heart. Arrows indicate path of blood flow through chambers, valves, and major vessels.
The myocardial thickness of each cardiac chamber depends on the amount of pressure or resistance it must overcome to eject blood. The two atria have the thinnest walls because they are low-pressure chambers that serve as storage units and conduits for blood that is emptied into the ventricles. Normally, there is little resistance to flow from the atria to the ventricles. The ventricles, on the other hand, must propel blood all the way through the pulmonary or systemic circulation. The ventricular myocardium also must be strong enough to pump against pressures in the pulmonary or systemic vessels. The mean pulmonary capillary pressure, which is the major force favoring movement of fluid out of the pulmonary capillaries into the interstitium, is only 15 mmHg. By comparison, the mean arterial pressure is about 92 mmHg. Pressure is greatest in the systemic circulation, driven by the left ventricle; the left ventricle’s myocardium is several times thicker than that of the right ventricle.
The right ventricle is shaped like a crescent, or triangle, enabling it to function like a bellows and efficiently eject large volumes of blood through a very small valve into the low-pressure pulmonary system. The left ventricle is larger and bullet shaped, helping it to eject blood through a relatively large valve opening into the high-pressure systemic circulation.
The ventricles are structurally more complex than the atria. Each ventricle contains muscle fibers that divide it roughly into an inflow tract, which receives blood from the atrium, and an outflow tract, which sends blood to the circulation (see Figure 29-3).
Normally blood does not flow between the chambers of the right side of the heart and the chambers of the left side of the heart. The adult right and left sides of the heart are separated by an intact septal membrane. The atria are separated by the interatrial septum, and the ventricles by the interventricular septum. The interventricular septum is an extension of the fibrous skeleton of the heart. Indentations of the endocardium form valves that separate the atria from the ventricles and the ventricles from the aorta and pulmonary arteries.
Fibrous Skeleton of the Heart
Four rings of dense fibrous connective tissue provide a firm anchorage for the attachments of the atrial and ventricular musculature, as well as the valvular tissue. The fibrous rings are adjacent and form a central, fibrous supporting structure collectively termed the anuli fibrosi cordis.
Valves of the Heart
One-way blood flow through the heart is ensured by the four heart valves. During ventricular relaxation the two atrioventricular valves open and blood flows from the higher-pressure atria to the relaxed ventricles. With increasing ventricular pressure these valves close and prevent backflow into the atria as the ventricles contract. The semilunar valves of the heart open when intraventricular pressure exceeds aortic and pulmonary pressures and blood flows out of the ventricles and into the pulmonary and systemic circulations. After ventricular contraction and ejection, intraventricular pressure falls and the pulmonic and aortic semilunar valves close, preventing backflow into the right and left ventricles (Figure 29-4; see also Figure 29-3).
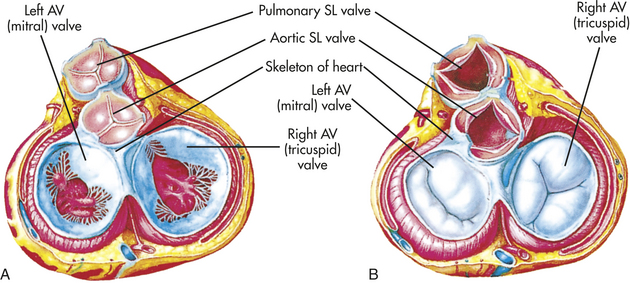
Figure 29-4 Structure of the heart valves. A, The heart valves in this drawing are depicted as viewed from above (looking down into the heart). Note that the semilunar (SL) valves are closed and the atrioventricular (AV) valves are open, as when the atria are contracting. B, Similar to A except that the semilunar valves are closed and the AV valves are open, as when the ventricles are contracting. (From Thibodeau GA, Patton KT: Anatomy & physiology, ed 5, St Louis, 2003, Mosby.)
The atrioventricular (AV) (tricuspid and mitral) valve openings are guarded by flaps of tissue called leaflets or cusps that are attached to the papillary muscles by the chordae tendineae (see Figure 29-3). The papillary muscles are extensions of the myocardium that pull the cusps together and downward at the onset of ventricular contraction, thus preventing their backward expulsion into the atria (see p. 1096 for a description of pressure changes and valvular function).
The right AV valve is called the tricuspid valve because it has three cusps. The tricuspid opening (orifice) has the largest diameter of all the heart valves. The left AV valve is a bicuspid (two cusps) valve called the mitral valve. The mitral valve resembles a cone-shaped funnel that extends into the cusps, which are connected by a fibrous tissue called the commissure. The anterior cusp of the mitral valve is continuous with supporting tissues of the aortic semilunar valve cusps and the left coronary valve cusps. (The coronary circulation is described on p. 1096.) Thus damage to this continuous tissue can alter function of the aortic as well as the mitral valves.
The tricuspid and mitral valves function as a unit because the atrium, fibrous rings, valvular tissue, chordae tendineae, papillary muscles, and ventricular walls are connected. Collectively, these six structures are known as the mitral and tricuspid complex. Damage to any one of the complex’s six components can alter function significantly.
Blood leaves the right ventricle through the pulmonic semilunar valve, and it leaves the left ventricle through the aortic semilunar valve (see Figures 29-3 and 29-4). The pulmonic and aortic semilunar valves have three cup-shaped cusps that arise from the fibrous skeleton. The pulmonic cusps are slightly thinner than the aortic cusps. The lower edges of each cusp are suspended from the root of the pulmonary artery or aorta, with the upper valve edges freely projecting into the vessel lumen. When the ventricles contract, the cusps behave like one-way swinging doors. The force of the blood propels the cusps outward against the vessel wall. When the ventricles relax, blood fills the cusps and causes their free edges to meet in the middle of the vessel, closing the valve and preventing any backflow.
Great Vessels
Blood moves in and out of the heart through several large vessels (see Figure 29-3). The right heart receives venous blood from the systemic circulation through the superior vena cava and the inferior vena cava, which enter the right atrium. Blood leaves the right ventricle and enters the pulmonary circulation through the pulmonary artery. The pulmonary artery divides into right and left pulmonary arteries to transport unoxygenated blood from the right heart to the right and left lungs. The pulmonary arteries branch further into the pulmonary capillary bed, where oxygen and carbon dioxide exchange occurs.
The four pulmonary veins, two from the right lung and two from the left lung, carry oxygenated blood from the lungs to the left side of the heart. The oxygenated blood moves through the left atrium and ventricle and out into the aorta, which delivers it to systemic vessels that supply the body.
Blood Flow During the Cardiac Cycle
The pumping action of the heart consists of contraction and relaxation of the myocardial layer of the heart wall. Each ventricular contraction and the relaxation that follows it constitute one cardiac cycle. (Blood flow through the heart during a single cardiac cycle is illustrated in Figure 29-5.) During relaxation, termed diastole, blood fills the ventricles. The contraction that follows, termed systole, propels the blood out of the ventricles and into the circulation. Contraction of the left ventricle is slightly earlier than contraction of the right ventricle.
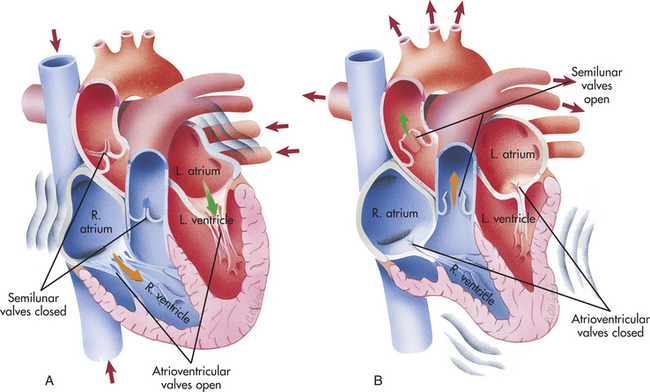
Figure 29-5 Chambers and valves of the heart. These illustrations depict the action of the heart chambers and valves when the atria contract (A), and when the ventricles contract (B). (From Thibodeau GA, Patton KT: Anatomy & physiology, ed 5, St Louis, 2003, Mosby.)
During ventricular systole, blood from the veins of the systemic circulation enters the thin-walled right atrium from the superior vena cava and the inferior vena cava (see Figures 29-3 and 29-5). Venous blood from the coronary circulation enters the right atrium through the coronary sinus. The right atrium fills and distends, pushing open the right AV (tricuspid) valve. This permits blood to fill the right ventricle during ventricular diastole (sometimes called atrial systole). The same sequence of events occurs a split second earlier in the left heart. The four pulmonary veins, two from the right lung and two from the left lung, carry blood from the pulmonary circulation to the left atrium. As the left atrium fills, it pushes the cusps of the mitral valve open and blood flows into the left ventricle. Left atrial contraction, “atrial kick,” provides a significant increase of blood to the left ventricle. Filling of the right and left ventricles occurs during one period of diastole.
Five phases of the cardiac cycle can be identified (Figures 29-6 and 29-7):
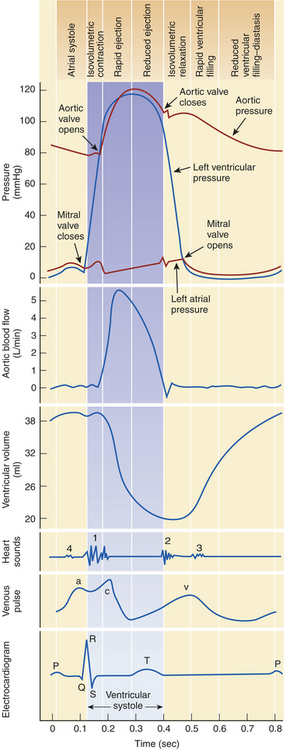
Figure 29-6 Composite chart of heart function. This chart is a composite of several diagrams of heart function (cardiac pumping cycle, blood pressure, blood flow, volume, heart sounds, venous pulse, and electrocardiogram [ECG]), all adjusted to the same time scale.
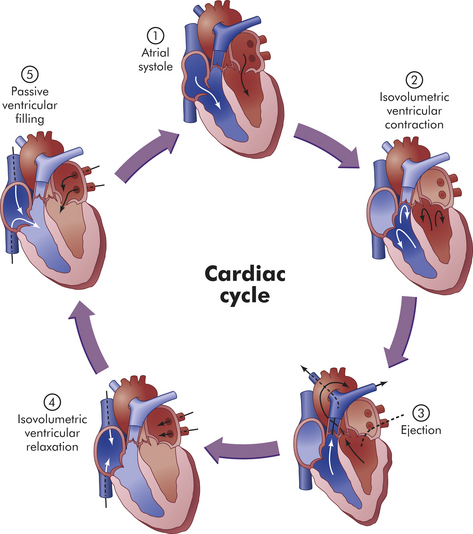
Figure 29-7 Phases of the cardiac cycle. 1, Atrial systole. 2, Isovolumetric ventricular contraction. Ventricular volume remains constant as pressure increases rapidly. 3, Ejection. 4, Isovolumetric ventricular relaxation. Both sets of valves are closed, and the ventricles are relaxing. 5, Passive ventricular filling. The atrioventricular (AV) valves are forced open, and the blood rushes into the relaxing ventricles. (From Thibodeau GA, Patton KT: Anatomy & physiology, ed 6, St Louis, 2007, Mosby.)
Phase 1: Atrial systole (ventricular diastole) begins with opening of the mitral and tricuspid valves and ventricular filling from the atria occurs. The ventricles fill rapidly in early diastole and again in late diastole when the atria contract.
Phase 2: Ventricular systole begins with “isovolumic contraction,” so-called because ventricular volume is constant; that is, the lengths of the muscle fibers remain relatively constant. Isovolumic contraction is the first detectable rise in ventricular pressure. Contraction pushes the AV valves shut. Their cusps bulge backward but are prevented from opening back into the atria by their anchors, the chordae tendineae (see Figure 29-3).
Phase 3: When ventricular pressure reaches that of the pulmonary artery and aorta, the semilunar valves open and ventricular ejection occurs. Intraventricular pressure and ventricular volume decrease rapidly.
Phase 4: With ventricular relaxation and decreased ventricular pressure, the aortic valve closes and “isovolumic relaxation” occurs.
Phase 5: When sufficient decreases exist in left ventricular pressure, the mitral valve opens and passive ventricular filling occurs.
As blood is pushed through the inflow and outflow tracts of the ventricles, it flows around the crista supraventricularis—the muscle that separates the inflow from the outflow tracts—and is mixed by passing through the strands of the trabeculae carneae.
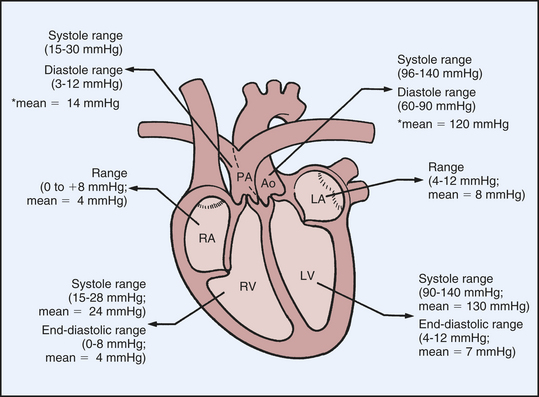
Normal Intracardiac Pressures
Normal intracardiac pressures are shown in Table 29-1 and Figures 29-6 and 29-8. Atrial pressure curves are composed of the a wave, which is generated by atrial contraction, and the v wave, which is an early diastolic peak caused by filling of the atrium from the peripheral veins. The x descent follows the a wave and is produced because of descent of the tricuspid valve ring and by the ejection of blood from both ventricles. The y descent follows the v wave and reflects the rapid flow of blood from the great veins and right atrium into the right ventricle. A small deflection, the c wave, occurs after the a wave in early systole and may represent bulging of the mitral valve into the left atrium during early systole. Ventricular pressures are illustrated by a peak systolic pressure and an end-diastolic pressure, which is the ventricular pressure immediately before the onset of systole. The minimal left ventricular pressure occurs in early diastole.
Table 29-1
| Mean (mmHg) | Range (mmHg) | |
| Right atrium | 4 | 0-8 |
| Right ventricle | ||
| Systolic | 24 | 15-28 |
| End-diastolic | 4 | 0-8 |
| Left atrium | 7 | 4-12 |
| Left ventricle | ||
| Systolic | 130 | 90-140 |
| End-diastolic | 7 | 4-12 |
Structures That Support Cardiac Metabolism: The Coronary Vessels
The blood within the heart chambers does not supply oxygen and other nutrients to the cells of the heart. Like all other organs, including the lungs, heart structures are nourished by vessels of the systemic circulation. The branch of the systemic circulation that supplies the heart is termed the coronary circulation and consists of coronary arteries, which receive blood through openings in the aorta, called the coronary ostia. The cardiac veins empty into the right atrium through another ostium, the opening of a large vein called the coronary sinus (Figure 29-9). (Regulation of the coronary circulation, which is similar to regulation of flow through systemic and pulmonary vessels, is described elsewhere.)
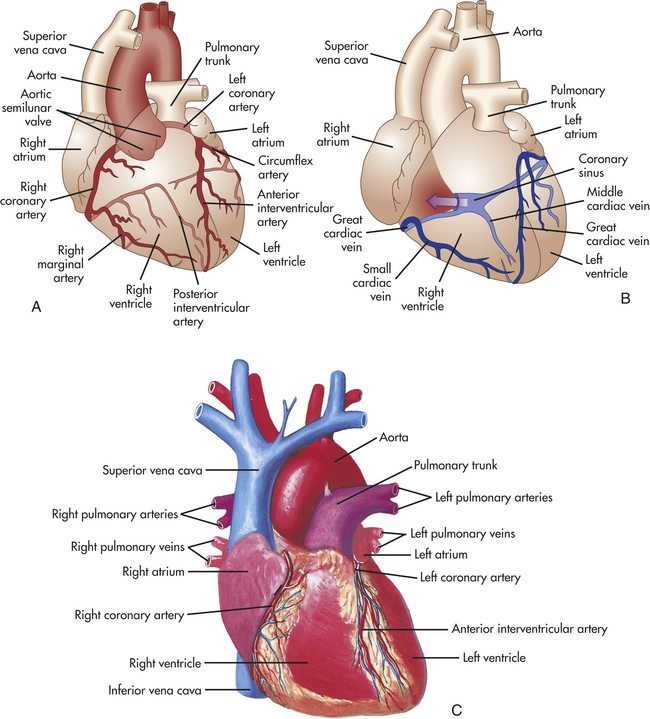
Figure 29-9 Coronary circulation. A, Arteries. B, Veins. Both A and B are anterior views of the heart. Vessels near the anterior surface are more darkly colored than vessels of the posterior surface seen through the heart. C, View of the anterior (sternocostal) surface. (A and B, modified from Thibodeau GA, Patton KT: Anatomy & physiology, ed 5, St Louis, 2003, Mosby. C, from Seeley RR, Stephens TD, Tate P: Anatomy & physiology, ed 3, St Louis, 1995, Mosby.)
Coronary Arteries
The major coronary arteries are the right coronary artery (RCA) and the left coronary artery (LCA) (see Figure 29-9). These arteries traverse the epicardium and branch several times. The right coronary artery has greater flow than the left in 50% of individuals, the left greater than the right in 20%, and equal flow in each in 30%.1 The pattern of branching through the visceral pericardium differs from heart to heart. The branches enter the myocardium and endocardium and branch further to become arterioles and then capillaries. Although the coronary arteries are smaller in women than men, this is attributable to differences in heart weight.
The left coronary artery arises from a single ostium (opening) behind the left cusp of the aortic semilunar valve. This artery ranges from a few millimeters to a few centimeters in length. It passes between the left atrial appendage and the pulmonary artery and generally divides into two branches—the left anterior descending artery and the circumflex artery. Other branches of the left main coronary artery are distributed diagonally across the free wall of the left ventricle.
The left anterior descending artery (LAD), also called the anterior interventricular artery, delivers blood to portions of the left and right ventricles and much of the interventricular septum. The left anterior descending artery travels down the anterior surface of the interventricular septum toward the apex of the heart.
The circumflex artery travels in a groove called the coronary sulcus, which separates the left atrium from the left ventricle, to the left border of the heart. It supplies blood to the left atrium and the lateral wall of the left ventricle. The circumflex artery often branches to the posterior surfaces of the left atrium and left ventricle (see Figure 29-9).
The right coronary artery originates from an ostium behind the right aortic cusp, travels behind the pulmonary artery, and extends around the right heart to the heart’s posterior surface, where it branches to the atrium and the ventricle. The three major branches of the right coronary artery include the conus, which supplies blood to the upper right ventricle; the right marginal branch, which traverses the right ventricle to the apex; and the posterior descending branch, which lies in the posterior interventricular sulcus and supplies smaller branches to both ventricles.
Collateral Arteries
The collateral arteries are really connections, or anastomoses, between two branches of the same coronary artery or connections of branches of the right coronary artery with branches of the left. They are particularly common within the interventricular and interatrial septa, at the apex of the heart, over the anterior surface of the right ventricle, and around the sinus node. The epicardium contains more collateral vessels than the endocardium.
The functional importance of the collateral circulation is that it protects the heart from ischemia. The collateral circulation is responsible for supplying blood and oxygen to the myocardium that has been deprived of oxygen following narrowing of a major coronary artery (coronary artery disease). Gradual coronary occlusion results in the growth of coronary collaterals. New collateral vessels are formed through two processes, arteriogenesis (new artery growth from preexisting arteries) and angiogenesis (growth of new capillaries within a tissue).2
The stimulus to collateral arteriogenesis is the shear stress caused by increased blood flow velocity that occurs close to the site of occlusion. Shear stress activates the endothelium of the preexisting arterioles and stimulates the production of growth factors and cytokines, including monocyte chemoattractant protein-1 (MCP-1) and vascular endothelial growth factor (VEGF).3 Monocytes/macrophages are called to the area of endothelial activation and release more growth factors and cytokines. Recent studies suggest that adequate monocyte numbers and function are critical to the growth of collaterals in individuals with coronary artery disease.3 As the collaterals begin to accept coronary flow, flow stress and pressure changes cause them to be restructured and remodeled.
Angiogenesis also is stimulated by numerous growth factors (VEGF, fibroblast growth factor [FGF]) and through the production of nitric oxide.2,4 Unfortunately, diabetes, which predisposes to coronary artery disease, also impedes collateral formation because of increased production of antiangiogenic factors such as endostatin and angiostatin.5 The presence of an effective collateral system has been shown to be protective in coronary artery disease, and an increased understanding of these processes has led to the use of angiogenic factors in the treatment of coronary artery disease that is not responsive to more conventional therapies.6
Coronary Capillaries
The heart has an extensive capillary network, with approximately 3300 capillaries per square millimeter (ca/mm2) or about one capillary per muscle cell (muscle fiber). Blood travels from the arteries to the arterioles and then into the capillaries, where exchange of oxygen and other nutrients takes place.
Alterations of the cardiac muscles dramatically affect blood flow in the capillaries. For example, in ventricular hypertrophy (enlargement of the ventricular myocardium), the capillary network does not expand along with muscle fiber size. Therefore, the same number of capillaries must now perfuse a larger area. This results in decreased exchange of oxygen and nutrients. At rest, the heart extracts 70% to 80% of the oxygen delivered to it and coronary blood flow is directly correlated with myocardial oxygen consumption.1
Coronary Veins and Lymphatic Vessels
After passing through the extensive capillary network, blood from the coronary arteries drains into the cardiac veins, which travel alongside the arteries. Most of the venous drainage of the heart occurs through veins in the visceral pericardium. The veins then feed into the great cardiac vein (see Figure 29-9) and coronary sinus on the posterior surface of the heart, between the atria and ventricles, in the coronary sulcus. Venous coronary blood empties into the right atrium from the coronary sinus. Blood from the left ventricular walls generally is drained through the coronary sinus and its tributaries, which together form the largest system of coronary veins. The great cardiac vein primarily drains the anterior surface of the heart. The posterior vein of the left ventricle, the largest on the posterior surface of the heart, branches from the coronary sinus and accompanies the circumflex artery.
The myocardium has an extensive system of lymphatic vessels. With cardiac contraction the lymphatic vessels drain fluid to lymph nodes in the anterior mediastinum that eventually empty into the superior vena cava. The lymphatics are important for protecting the myocardium against injury. (The lymphatic vessels are described on p. 1131.)
Structures That Control Heart Action
The continuous, rhythmic repetition of the cardiac cycle (systole and diastole) depends on the transmission of electrical impulses, termed cardiac action potentials, through the myocardium. (Action potentials are described in Chapters 1 and 3.) As an electrical impulse passes from cell to cell (fiber to fiber) in the myocardium, it stimulates the fibers to shorten. Shortening causes muscular contraction, or systole. After the action potential passes, the fibers relax and return to their resting length, causing diastole. The muscle fibers of the myocardium are uniquely joined so that action potentials pass from cell to cell very rapidly and efficiently. Therefore, an action potential generated in one part of the myocardium passes almost simultaneously through all its contiguous fibers, causing rapid contraction.
The myocardium differs from other muscle tissues in that it contains its own conduction system—specialized cells that enable it to generate and transmit action potentials without stimulation from the nervous system (Figure 29-10). These cells are concentrated at certain sites in the myocardium called nodes. Although the heart is innervated by the autonomic nervous system (sympathetic and parasympathetic fibers), neural impulses are not needed to maintain the cardiac cycle. Thus the heart will beat in the absence of any nervous connection. The cardiac cycle is stimulated by the nodes of specialized cells and “fine-tuned” as needed by the autonomic fibers. The sympathetic and parasympathetic nerves affect the speed of the cardiac cycle (heart rate, or beats per minute) and the diameter of the coronary vessels (Figure 29-11). The sympathetic nervous system increases heart rate and conduction through the nodes, the parasympathetic nervous system slows heart rate and prolongs intranodal conduction time, and both systems cause coronary vasodilation.7
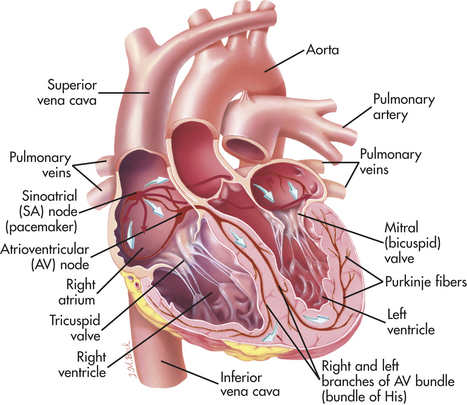
Figure 29-10 Conduction system of the heart. Specialized cardiac muscle cells in the wall of the heart rapidly conduct an electrical impulse throughout the myocardium. The signal is initiated by the SA node (pacemaker) and spreads to the rest of the atrial myocardium and to the AV node. The AV node then initiates a signal that is conducted through the ventricular myocardium by way of the AV bundle (of His) and Purkinje fibers. (Modified from Thibodeau GA, Patton KT: Anatomy & physiology, ed 5, St Louis, 2003, Mosby.)
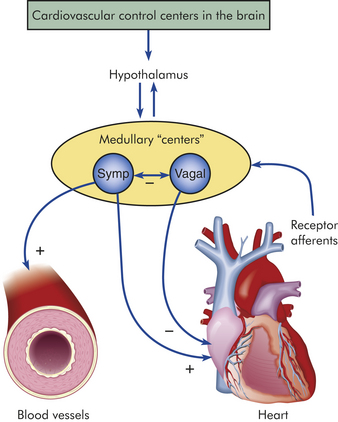
Figure 29-11 Autonomic innervation of cardiovascular system. +, Activation; −, inhibition; symp, sympathetic.
Heart action is also influenced by substances delivered to the myocardium in coronary blood. Nutrients and oxygen are needed for cellular survival and normal function, and hormones and biochemicals affect the strength and duration of myocardial contraction and the degree and duration of myocardial relaxation. Normal or appropriate function depends on the availability of these substances, which is why coronary artery disease can seriously disrupt heart function.
Conduction System
Normally electrical impulses arise in the sinoatrial (SA) node (SA node, sinus node), which is often called the pacemaker of the heart. The SA node is located at the junction of the right atrium and superior vena cava, just above the tricuspid valve (see Figure 29-10). The SA node lies only 1 mm or less beneath the visceral pericardium, making it vulnerable to injury and disease, especially pericardial inflammation. The SA node is nourished by the sinus node artery, which passes through the center of the node. Numerous autonomic nerve endings are within the node. The SA node is heavily innervated by both sympathetic and parasympathetic nerve fibers.7 The SA node’s P cells, so-called because they are pale and primitive appearing, are assumed to be the site of impulse formation.
In the resting adult the SA node generates about 75 action potentials per minute. Each one travels rapidly from cell to cell and through special pathways in the atrial myocardium, causing both atria to contract, beginning systole. Ventricular contraction is delayed because the fibrous skeleton of the heart interrupts cell-to-cell transmission of the electrical impulses. The action potential is transmitted from the atrial to the ventricular myocardium through fibers of the conduction system, traveling first to the atrioventricular (AV) node then to the bundle of His (atrioventricular bundle, common bundle), and finally through the bundle branches of the interventricular septum to Purkinje fibers in the heart wall (see Figure 29-10).
The AV node is well situated for mediating conduction between the atria and ventricles. It is located in the right atrial wall above the tricuspid valve and anterior to the ostium of the coronary sinus. There is much variation from one heart to another in the size and length of the AV node fibers. Generally the AV node is thicker and shorter and has fewer P cells than the SA node. Behind the AV node are numerous autonomic parasympathetic ganglia. (The nervous systems are described in Chapter 14.) These ganglia may serve as receptors for the vagus nerve and cause slowing of impulse conduction through the AV node.1
Conducting fibers from the AV node converge to form the bundle of His. The bundle of His, which is triangular shaped, lies within the posterior border of the interventricular septum. The two lower ends of the triangle give rise to the right and left bundle branches. The right bundle branch (RBB) is thin and travels without much branching to the right ventricular apex. Because of its thinness and relative lack of branches, the RBB is susceptible to interruption by damage to the endocardium.
The left bundle branch (LBB) arises perpendicularly from the bundle of His and, in some hearts, divides into two branches, or fascicles. The left anterior bundle branch (LABB) passes the left anterior papillary muscle and the base of the left ventricle and crosses the aortic outflow tract. Damage to the aortic valve or the left ventricle can interrupt this branch. The left posterior bundle branch (LPBB) travels posteriorly, crossing the left ventricular inflow tract to the base of the left posterior papillary muscle. This branch spreads diffusely through the posterior inferior left ventricular wall. Blood flow through this portion of the left ventricle is relatively nonturbulent, so the LPBB is somewhat protected from injury caused by wear and tear. The Purkinje fibers are the terminal branches of the right and left bundle branches. They extend from the ventricular apices to the fibrous rings and penetrate the heart wall to the outer myocardium. P cells are found also among the Purkinje fibers.
Cardiac Excitation: From the SA node the impulse that begins systole spreads throughout the right atrium at a conduction velocity of about 1 m/second. Because impulses from the SA node arrive at the AV node very quickly, investigators have proposed that these nodes are connected by internodal pathways, called the anterior, middle, and posterior internodal pathways. These pathways consist of ordinary myocardial cells and specialized conducting fibers. The anterior interatrial myocardial band (or Bachmann bundle) conducts the impulse from the SA node to the left and right atria before entering the AV node and helps synchronize contractions of both atria. The middle and posterior internodal pathways connect the SA node directly with the AV node.
The action potential is delayed in the region of the AV node, possibly because of electrophysiologic differences in the cells that make up the AV region.7 The delay between atrial and ventricular excitation permits an additional boost to ventricular filling by atrial contraction (atrial kick). From the AV node the impulse travels from the AV bundle and through the bundle branches to the Purkinje fibers. Conduction velocities in the AV and Purkinje fibers are 2 to 4 m/second, the most rapid in the heart.
Ventricular activation occurs sequentially in three phases: (1) septal activation, (2) apical activation, and (3) basal (upper) and posterior activation. The first areas of the ventricles to be excited are portions of the interventricular septum. The septum is activated from both the RBB and the LBB, although the impulse travels from left to right. The extensive network of Purkinje fibers promotes the rapid spread of the impulse to the ventricular apices. Activation traverses the heart wall from the inside outward (from the endocardium to the epicardium; see Figure 29-2). The basal and posterior portions of the ventricles are the last to be activated. Deactivation, which begins in diastole, occurs in the opposite direction, spreading from the outside inward (epicardium to endocardium). All areas of the ventricle recover at about the same time.
Propagation of Cardiac Action Potentials: Electrical activation of the muscle cells, termed depolarization, is caused by the movement of electrically charged solutes (ions) across cardiac cell membranes. Deactivation, called repolarization, occurs the same way. (Movement of ions across cell membranes is described in Chapter 1; electrical activation of muscle cells is described in Chapter 41.)
Movement of ions into and out of the cell creates an electrical (voltage) difference across the cell membrane called the membrane potential. The resting membrane potential of myocardial cells is between −80 and −90 millivolts (mV), whereas the SA node is between −50 and −60 mV and the AV node is between −60 and −70 mV.7 During depolarization the inside of the cell becomes less negatively charged. In cardiac cells the difference between resting membrane potential (in millivolts) and the decreased negative charge caused by depolarization is the cardiac action potential. Table 29-2 summarizes the intracellular and extracellular ionic concentrations of cardiac muscle. The various phases of the cardiac action potential are related to changes in the permeability of the cell membrane, primarily to sodium and potassium. Threshold is the point at which the cell membrane’s selective permeability to sodium and potassium is temporarily disrupted, leading to depolarization. If the resting membrane potential becomes more negative due to a decrease in extracellular potassium concentration (hypokalemia), it is termed hyperpolarization.
Table 29-2
Intracellular and Extracellular Ion Concentrations in the Myocardium
| Ion | Intracellular Concentration | Extracellular Concentration |
| Sodium (Na+) | 15 mM | 145 mM |
| Potassium (K+) | 150 mM | 4 mM |
| Chloride (Cl−) | 5 mM | 120 mM |
| Calcium (Ca++) | 10−7 M | 2 mM |
Normal myocardial cell depolarization and repolarization occur in five phases (Figure 29-12). Phase 0 consists of depolarization. This phase lasts 1 to 2 milliseconds (ms) and represents rapid sodium entry into the cell. Phase 1 is early repolarization, in which calcium slowly enters the cell. Phase 2, also called the plateau, is a continuation of repolarization, with slow entry of calcium and sodium into the cell. Potassium is moved out of the cell during phase 3, with a return to resting membrane potential in phase 4. The time between action potentials corresponds to diastole. If the resting membrane potential becomes more negative, for example, with a decrease in extracellular potassium concentration (hypokalemia), it is termed hyperpolarization.
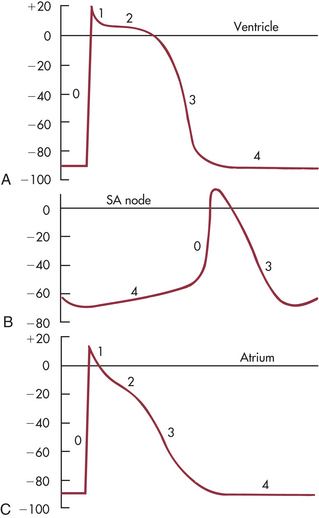
Figure 29-12 Cardiac action potentials. A, Ventricle. B, Sinoatrial (SA) node. C, Atrium. Sweep velocity in B is one half that in A or C. (Modified from Berne RM, Levy MN: Cardiovascular physiology, ed 8, St Louis, 2001, Mosby)
The phases of depolarization and repolarization occur somewhat differently in the SA and AV node cells, a difference that enables these cells to generate cardiac action potentials independently. The cells of the Purkinje fibers, atria, and ventricles begin with a negative resting membrane potential and proceed to a rapid upstroke, or depolarization (phase 0), a rapid early repolarization (phase 1), a plateau (phase 2), and a rapid later repolarization (phase 3) (see Figure 29-12, A, C). This fast inward current, mediated by sodium ions flowing through “fast channels” in the cell membrane, causes the rapid upstroke of the action potential in Purkinje fibers, atria, and ventricles. Cells of the SA and AV nodes begin with a less negative resting membrane potential, proceed to a slow upstroke (phase 0), and usually lack a plateau (phase 2) (see Figure 29-12, B). The slow inward current, mediated by calcium (transient and long-lasting channels) and sodium ions flowing through “slow channels” of the cell membrane, is responsible for the action potential of the SA node and the AV node. Hence, drugs that block calcium have profound effects on the slow inward current and can alter heart rate. Slow channel-blocking drugs, such as verapamil, are used to treat a variety of cardiovascular disorders.
A refractory period, during which no new cardiac action potential can be initiated by a stimulus, follows depolarization. This effective or absolute refractory period corresponds to the time needed for the reopening of channels that permit sodium and calcium influx (phase 0 through half of phase 3). A relative refractory period occurs near the end of repolarization, following the effective refractory period. During this time the membrane can be depolarized again but only by a greater than normal stimulus. Abnormal refractory periods as a result of disease can cause abnormal heart rhythms, or dysrhythmias, including ventricular fibrillation and cardiac arrest (see Chapter 30).
Normal Electrocardiogram: The genesis of the normal electrocardiogram is from electrical activity recorded by skin electrodes, that is, the sum of all cardiac action potentials (Figure 29-13). The P wave represents atrial depolarization. The PR interval is a measure of time from the onset of atrial activation to the onset of ventricular activation; it normally ranges from 0.12 to 0.20 second. The PR interval represents the time necessary to travel from the sinus node through the atrium, AV node, and His-Purkinje system to activate ventricular myocardial cells. The QRS complex represents the sum of all ventricular muscle cell depolarizations. The configuration and amplitude of the QRS complex vary considerably among individuals. The duration is normally between 0.06 and 0.10 second. During the ST interval the entire ventricular myocardium is depolarized. The QT interval is sometimes called the “electrical systole” of the ventricles. It lasts about 0.4 second, but it varies inversely with the heart rate.
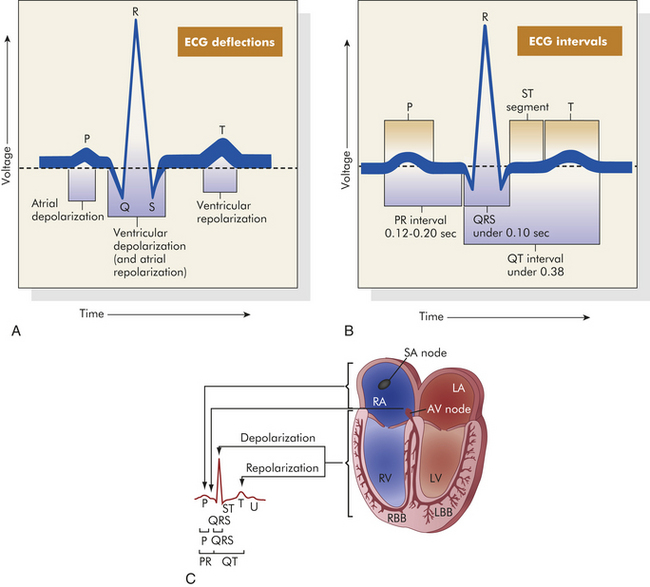
Figure 29-13 Electrocardiogram (ECG) and cardiac electrical activity. A, Normal ECG. Depolarization and repolarization. B, ECG intervals among P, QRS, and T waves. C, Schematic representation of ECG and its relationship to cardiac electrical activity. RA, right atrium; LA, left atrium; AV, atrioventricular; RV, right ventricle; LV, left ventricle; LBB, left bundle branch; RBB, right bundle branch. (A and B from Thibodeau GA, Patton KT: Anatomy & physiology, ed 5, St Louis, 2003, Mosby. C from Thibodeau GA: Anatomy & physiology, St Louis, 1987, Mosby.)
Automaticity: Automaticity, or the property of generating spontaneous depolarization to threshold, enables the SA and AV nodes to generate cardiac action potentials without any stimulus. Cells capable of spontaneous depolarization are called automatic cells. The automatic cells of the cardiac conduction system can stimulate the heart to beat even when the heart is removed from the body. Spontaneous depolarization is possible in automatic cells because the membrane potential does not “rest” during phase 4. Instead, it slowly creeps toward threshold during the diastolic phase of the cardiac cycle. Because threshold is approached during diastole, phase 4 in automatic cells is called diastolic depolarization. The electrical impulse normally begins in the SA node because its cells depolarize more rapidly than other automatic cells.
Rhythmicity: Rhythmicity is the regular generation of an action potential by the heart’s conduction system. The SA node sets the pace because normally it has the fastest rate, which is why it is called the natural pacemaker of the heart. The SA node depolarizes spontaneously 60 to 100 times per minute. If the SA node is damaged, the AV node will become the heart’s pacemaker at a rate of about 40 to 60 spontaneous depolarizations per minute. Purkinje fibers are capable of spontaneous depolarization but at a rate of only 30 to 40 beats/minute.
Cardiac Innervation
Although the heart’s nodes and conduction system generate cardiac action potentials independently, the autonomic nervous system influences the rate of impulse generation (firing), depolarization, and repolarization of the myocardium and the strength of atrial and ventricular contraction. Autonomic neural transmission produces changes in the heart and circulatory system faster than metabolic or humoral agents (see Figure 29-11). Speed is important, for example, in stimulating the heart to increase its pumping action during times of stress or fear, the so-called fight-or-flight response. Although increased delivery of oxygen, glucose, hormones, and other blood-borne factors sustains increased cardiac activity, the rapid initiation of increased activity depends on the sympathetic and parasympathetic fibers of the autonomic nervous system. (The autonomic nervous system is described and illustrated in Chapter 14.)
Sympathetic and Parasympathetic Nerves: Sympathetic and parasympathetic nerve fibers innervate all parts of the atria and ventricles and the SA and AV nodes. In general, sympathetic stimulation increases electrical conductivity and parasympathetic nerve activity, from vagal stimulation, slows conduction of action potentials through the heart.
Efferent sympathetic fibers originate in the thoracic spinal cord and branch into the superior middle and inferior cardiac nerves. They join at the cardiac plexus, a neural junction located at the root of the aorta in front of the trachea. Sympathetic nervous activity enhances myocardial performance. Catecholamines speed heart rate, shorten the conduction time through the AV node, and increase the rhythmicity of the AV pacemaker fibers. Neurally released norepinephrine or circulating catecholamines interact with β-adrenergic receptors on the cardiac cell membranes. The overall effect is an increased influx of Ca++ during the action potential plateau. The increased calcium increases the contractile strength of the heart.
The efferent parasympathetic fibers originate in the medulla oblongata and travel by way of the vagus nerves to join the sympathetic nerves in the cardiac plexus. Parasympathetic (vagal) activity causes the release of acetylcholine. Receptors for these neurotransmitters are found in the myocardium and coronary vessels of the heart. Acetylcholine decreases heart rate, slows conduction through the AV nodes, and can block cardiac action potentials transmitted from the atria.
Adrenergic Receptor Function: Sympathetic neural stimulation of the myocardium and coronary vessels depends on the presence of adrenergic receptors, which bind specifically with neurotransmitters of the sympathetic nervous system. (Receptor physiology is discussed in Chapter 1). The effects of sympathetic stimulation depend on whether (1) α- or β-adrenergic receptors are most plentiful on cells of the effector tissue and (2) the neurotransmitter is norepinephrine or epinephrine.
There are four types of adrenergic receptors: β1, β2, α1, and α2 (see Table 14-7). Overall, cardiovascular structures have more β than α receptors; therefore, effects mediated by the β receptors predominate. Epinephrine stimulates all four types of receptors strongly, whereas norepinephrine stimulates all four weakly or not at all.
The β1 receptors are found mostly in the heart, specifically the conduction system (AV and SA nodes, Purkinje fibers) and the atrial and ventricular myocardium. Norepinephrine and epinephrine, binding with β1 receptors, increase the rate of impulse generation (firing) and conduction and the strength of myocardial contraction during systole (positive inotropic effect). This enables the heart to pump more blood. Thus epinephrine and norepinephrine stimulate the heart.
The β2 receptors are found mostly on coronary arterioles and cause coronary vasodilation when stimulated by epinephrine. This opposes the vasoconstrictor activity of α1 receptor stimulation by norepinephrine (see following). When the sympathetic nervous system is activated, epinephrine-mediated β2 receptor stimulation combines with the production of vasodilatory metabolites from actively metabolizing myocytes to override the effect of norepinephrine.1 Thus sympathetic nervous system activation has the overall effect of increasing coronary blood flow. This activation supplies the hard-working myocardium with more oxygen and nutrients (see Table 14-7).
β3 receptors are also found in the myocardium and coronary vessels. In the heart, stimulation of these receptors opposes the effects of β1 receptor stimulation and decreases myocardial contractility (negative inotropic effect). Thus β3 receptors may provide a “safety mechanism” to prevent overstimulation of the heart by the sympathetic nervous system.8
As noted, norepinephrine binding with α1 receptors in the systemic and coronary arteries causes vasoconstriction. The α2 receptors are located mostly on the sympathetic ganglia and nerve terminals. The effect of norepinephrine on the α2 receptors is to inhibit release of more norepinephrine, which promotes vasodilation, thus providing another safety mechanism to prevent overactivity of the sympathetic nervous system. Dysfunction of adrenergic receptors can occur in many conditions (e.g., diabetes, hypertension) and has been implicated in the pathogenesis of many cardiac diseases, including heart failure, myocardial ischemia, and dysrhythmias.9–11
Myocardial Cells
The cells of cardiac muscle (the myocardium) and of skeletal muscle are nearly identical in structure, function, and microscopic appearance. (The properties of skeletal muscle are described in detail in Chapter 41.) Both types of muscle tissue are composed of long, narrow cells, called fibers, that contain basically the same structures: bundles of longitudinally arranged myofibrils; a nucleus (cardiac muscle) or many nuclei (skeletal muscle); mitochondria; an internal membrane system (the sarcoplasmic reticulum); cytoplasm (sarcoplasm); and a plasma membrane (the sarcolemma), which encloses the cell. Cardiac and skeletal muscle cells also have an “external” membrane system made up of transverse tubules (T tubules) formed by invaginations of the sarcolemma. The sarcoplasmic reticulum forms a network of channels that surround the muscle fiber.
The microscopic appearance of cardiac and skeletal muscle is somewhat similar as well (see Chapter 1, Table 1-8). Because the myofibrils in both types of fibers are made up of alternating light and dark bands of protein, the fibers appear striped, or striated. The dark and light bands of the myofibrils make up longitudinal repeating units called sarcomeres. The length of the sarcomeres, normally between 1.6 and 2.2 mm, is important because it determines the limits of myocardial stretch at the end of diastole and subsequently the force of contraction during systole.
Cardiac muscle differs from skeletal muscle in several respects that reflect heart function. Cardiac cells are arranged in branching networks throughout the myocardium, whereas skeletal muscle cells tend to be arranged in parallel throughout the length of the muscle. Cardiac fibers have only one nucleus, whereas skeletal muscle cells have many nuclei. Other differences enable cardiac fibers to (1) transmit action potentials quickly from cell to cell, (2) maintain high levels of energy synthesis, and (3) gain access to more ions, particularly sodium and potassium, in the extracellular environment.
Rapid transmission of electrical impulses from cardiac fiber to cardiac fiber is possible because the network of fibers is connected at specialized intercellular junctions called intercalated disks. Intercalated disks are thickened portions of the sarcolemma that enable electrical impulses to spread quickly in a continuous cell-to-cell (syncytial) fashion. The intercalated disks contain two junctions: desmosomes, which attach one cell to another; and gap junctions, which allow the electrical impulse to spread from cell to cell (see Chapter 1). Together these junctions provide a low-resistance pathway for impulse propagation.
Unlike skeletal muscle, the heart cannot rest and is in constant need of energy compounds, such as adenosine triphosphate (ATP). Therefore, the cytoplasm surrounding the bundles of myofibrils in each cardiac muscle cell contains a superabundance of mitochondria (25% of the cellular volume). Cardiac muscle cells have more mitochondria than skeletal muscle cells. The large numbers of mitochondria provide the necessary respiratory enzymes for aerobic metabolism and supply quantities of ATP sufficient for the constant action of the myocardium.
The third major difference between cardiac and skeletal muscle cells has to do with the T tubule system. Cardiac fibers contain more T tubules than skeletal muscle fibers. This gives each myofibril in the myocardium ready access to molecules it needs for the continuous transmission of action potentials, a process that involves transport of sodium and potassium through the walls of the T tubules. (The mechanisms by which sodium and potassium transport causes transmission of cardiac action potentials are described in Chapters 1 and 41.) Because the T tubule system is continuous with the extracellular space and the interstitial fluid, it facilitates the rapid transmission of electrical impulses from the surface of the sarcolemma to the myofibrils inside the fiber. This activates all the myofibrils of one fiber simultaneously. The sarcoplasmic reticulum is located around the myofibrils. When an action potential is transmitted through the T tubules, it induces the sarcoplasmic reticulum to release its stored calcium, which activates the contractile proteins, actin and myosin.
Actin, Myosin, and the Troponin-Tropomyosin Complex: The thick filaments of myosin constitute the central dark band called the anisotropic, or A, bands (Figure 29-14). The myosin molecule resembles a golf club with two large bulbous heads protruding from one end of a straight shaft (Figure 29-15). The bilobed heads contain an actin-binding site and a site of ATPase activity. A thick filament is composed of about 200 myosin molecules bundled together with the heads of the molecules (called cross-bridges) facing outward (see Figure 29-15).The actin molecules are part of the thin filaments (Figure 29-16). The light bands are called isotropic, or I, bands (see Figure 29-14). The thin filaments of actin appear light and extend from the Z line, a dense fibrous line that crosses the center of each I band. A sarcomere is the area from one dark Z line to an adjacent Z line with a length that varies from 1.6 to 2.2 mm. In the center of a sarcomere is the H zone, a somewhat less dense region. A thin, dark M line travels the center of the H zone. A single tropomyosin molecule (a relaxing protein) lies alongside seven actin molecules. Troponin, another relaxing protein, associates with the tropomyosin molecule, forming the troponin-tropomyosin complex (Figure 29-17). The troponin complex itself has three components. Troponin T aids in binding of the troponin complex to actin and tropomyosin; troponin I inhibits the ATPase of actomyosin; and troponin C contains binding sites for the calcium ions involved in contraction.
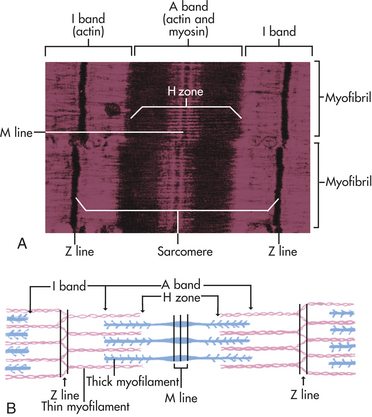
Figure 29-14 Sarcomere. A, Electron photomicrograph of sarcomere. B, Schematic of location and interaction of actin and myosin. (Modified from Thibodeau GA, Patton KT: Anatomy & physiology, ed 3, St Louis, 1996, Mosby.)
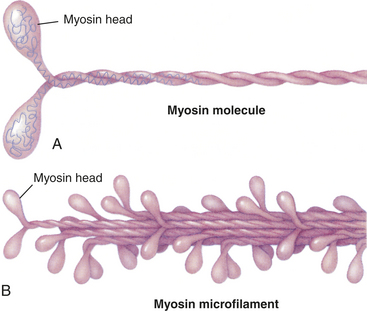
Figure 29-15 Structure of myosin. A, Each myosin molecule is a coil of two chains wrapped around one another. At the end of each chain is a globular region, much like a golf club, called the head. B, Myosin molecules usually are combined into filaments, which are stalks of myosin from which the heads protrude at regular intervals.
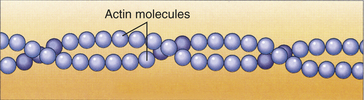
Figure 29-16 Actin microfilament. (From Raven RH, Johnson GB: Understanding biology, ed 3, Dubuque, IA, 1995, Brown.)
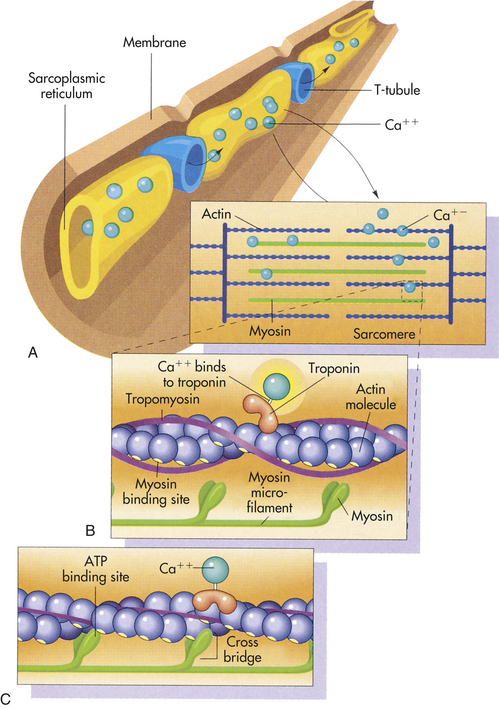
Figure 29-17 Myofilaments and mechanisms of muscle contraction. A, Thin and thick myofilaments. In resting muscle, calcium ions are stored in the sarcoplasmic reticulum. When an action potential reaches the muscle cell, the T tubules carry the action potential deep into the sarcoplasm. The action potential causes the sarcoplasmic reticulum to release the store of calcium ions. B, In resting muscle the myosin binding sites are covered by troponin and tropomyosin. The calcium ions released into the sarcoplasm as a result of action potential bind to the troponin. This binding causes the tropomyosin and troponin to move out of the way of the myosin binding sites, leaving the myosin heads free to bind to the actin microfilament. (From Raven PH, Johnson GB: Understanding biology, ed 3, Dubuque, IA, 1995, Brown.)
Myocardial Metabolism: Cardiac muscle, like other muscle tissue, depends on the constant production of ATP for energy. ATP is produced within the mitochondria mainly from glucose, fatty acids, and lactate. If the myocardium is inadequately perfused because of coronary artery disease, anaerobic metabolism becomes an essential source of energy (see Chapter 1). The energy produced by metabolic processes is used for muscle contraction and relaxation, electrical excitation, membrane transport, and synthesis of large molecules. Normally, the amount of ATP produced supplies sufficient energy to pump blood systemically.
Cardiac work often is expressed in terms of myocardial oxygen consumption ( ). Because oxidative metabolism is the main process of cardiac energy generation, the rate of correlates closely with total cardiac energy requirements. is determined by three major factors: (1) the amount of wall stress during systole, which can be estimated by measuring the systolic blood pressure; (2) the duration of systolic wall tension, which is measured indirectly by the heart rate; and (3) the contractile state of the myocardium, for which no clinical measurement exists.
The oxygen supply to the myocardium is delivered exclusively by the coronary arteries. From 70% to 75% of the oxygen from the coronary arteries is used immediately by cardiac muscle, leaving little oxygen in reserve. Therefore, increased energy needs can be met only by increasing coronary blood flow. Myocardial oxygen consumption can increase several-fold with exercise and decrease moderately under conditions such as hypotension and hypothermia. As myocardial metabolism and consumption of oxygen increases, the local concentration of local metabolic factors increases. One of these, adenosine, dilates coronary arterioles, increasing coronary blood flow.1
Myocardial Contraction and Relaxation
Myocardial contractility is a change in developed tension at a given resting fiber length. In functional terms, contractility is the ability of the heart muscle to shorten. On a molecular basis, thin filaments of actin slide over thick filaments of myosin, called the cross-bridge theory of muscle contraction. Anatomically, contraction occurs when the sarcomere shortens, causing adjacent Z lines to move closer together (Figure 29-18). The width of the A band, which contains the thick myosin filaments, is unchanged. The movement comes from the long sets of filaments. The degree of shortening of the muscle fibers depends on how much the thin filaments overlap the thick filaments. Maximal contraction occurs when the sarcomere length is 2.2 mm. At 2.2 mm the number of cross-bridge attachments between actin and myosin is maximal.
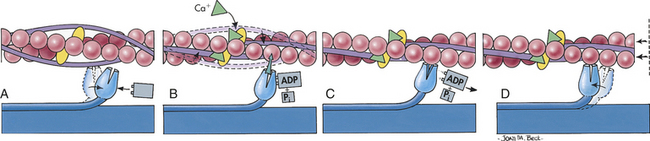
Figure 29-18 Cross-bridge theory of muscle contraction. A, Each myosin cross-bridge in the thick filament moves into a resting position after an adenosine triphosphate (ATP) molecule binds and transfers its energy. B, Calcium ions released from the sarcoplasmic reticulum bind to troponin in the thin filament, allowing tropomyosin to shift from its position blocking the active sites of actin molecules. C, Each myosin cross-bridge then binds to an active site on a thin filament, displacing the remnants of ATP hydrolysis—adenosine diphosphate (ADP) and inorganic phosphate (Pi). D, The release of stored energy from step A provides the force needed for each cross-bridge to move back to its original position, pulling actin along with it. Each cross-bridge will remain bound to actin until another ATP molecule binds to it and pulls it back into its resting position (A). (From Thibodeau GA, Patton KT: Anatomy & physiology, ed 4, St Louis, 1999, Mosby.)
Cross-Bridge Theory: The globular head-end of the myosin contains a binding site for actin and a separate enzymatic site that catalyzes the breakdown of ATP to adenosine diphosphate (ADP) and inorganic phosphate (Pi) (see Figure 29-18). This reaction releases the chemical energy stored in ATP. Magnesium is required for the binding of ATP to the myosin site. The splitting of ATP occurs on the myosin molecule before it attaches to actin, but the ADP and inorganic phosphate released remain bound to the active site on myosin. The chemical energy released is transferred to myosin (m), producing a high-energy form of myosin (M):
The binding of this high-energy form of myosin to actin through a cross-bridge releases the energy stored in myosin (e.g., ADP and Pi), producing the force necessary for movement of the cross-bridge. With the attachment of actin to myosin at the cross-bridge, the myosin head molecule undergoes a position change, exerting traction on the rest of the myosin bridge, causing the thin filaments to slide past the thick filaments (see Figure 29-18). During contraction each cross-bridge undergoes cycles of attachment, movement, and dissociation from the thin filaments.
Calcium and Excitation-Contraction Coupling: Excitation-contraction coupling is the process by which an action potential in the plasma membrane of the muscle fiber triggers the cycle of events leading to cross-bridge activity and contraction. Activation of this cycle depends on the availability of calcium.
Calcium is stored in the tubule system and the sarcoplasmic reticulum. It enters the myocardial cell from the interstitial fluid after electrical excitation, which increases the membrane permeability to calcium. Two types of calcium channels (L-type and T-type) are identified in cardiac tissues. The L-type, or long-lasting, channels are the predominant type of calcium channels and are the channels blocked by calcium channel–blocking drugs (verapamil, nifedipine, diltiazem). Their major effect is to decrease the strength of cardiac contraction. The T-type, or transient, channels are much less abundant in the heart and are not blocked by currently available calcium channel–blocking drugs, however, new types of T-type channel blockers are being developed.12 Calcium that enters the cell from the interstitial fluid triggers release of calcium from the storage sites. The storage sites most important for contraction are from the sarcoplasmic reticulum. Calcium from these sites diffuses toward the myofibrils, where it binds with troponin.
The calcium-troponin complex facilitates the contraction process. In the resting state, troponin I is bound to actin and the configuration of the tropomyosin molecule is such that it covers the sites where the myosin heads bind to actin. Thus interaction between actin and myosin is prevented. Calcium binding to troponin inhibits troponin C (which enhances troponin I–actin binding). This in turn causes tropomyosin to move away, thus uncovering the binding sites on the myosin heads. Myosin and actin can then form cross-bridges, and ATP can be dephosphorylated to ADP. Sliding of the thick and thin filaments can then occur, and the muscle contracts.
Myocardial Relaxation: Adequate relaxation is just as vital to optimal cardiac function as contraction, and calcium, troponin, and tropomyosin also facilitate relaxation. After contraction, free calcium ions are actively pumped out of the cell back into the interstitial fluid or reaccumulated in the sarcoplasmic reticulum and stored. Troponin releases its bound calcium. The tropomyosin complex blocks the active sites on the actin molecule, preventing cross-bridges with the myosin heads. Each tropomyosin molecule is held in this blocking position by a molecule of troponin. Troponin is bound to both tropomyosin and actin (see Figures 29-17, A, and 29-18).
Factors Affecting Cardiac Output
Cardiac output is the volume of blood flowing through either the systemic or the pulmonary circuit and is expressed in liters per minute. The cardiac output is determined by multiplying the heart rate (beats per minute) and the stroke volume (liters per beat). Normal cardiac output is about 5 L/minute for a resting adult. The ventricle does not eject all of the blood it contains; the amount ejected is called the ejection fraction or the stroke volume divided by the end-diastolic volume. The end-diastolic volume of the normal ventricle (VEDV) is about 70 to 80 ml/m2 and the normal ejection fraction of the resting heart is about 60% to 75%.
Four factors affect cardiac output directly: preload, afterload, myocardial contractility, and heart rate (Figure 29-19). Preload (pressure generated at the end of diastole) and afterload (resistance to ejection during systole) depend on the heart as well as the vascular system. Contractility and heart rate are characteristics of the cardiac tissue per se and are influenced by neural and humoral mechanisms. To understand the role of these factors in cardiac performance, it is first necessary to understand two physical laws that explain the mechanisms of heart action: the Frank-Starling law of the heart and Laplace’s law.
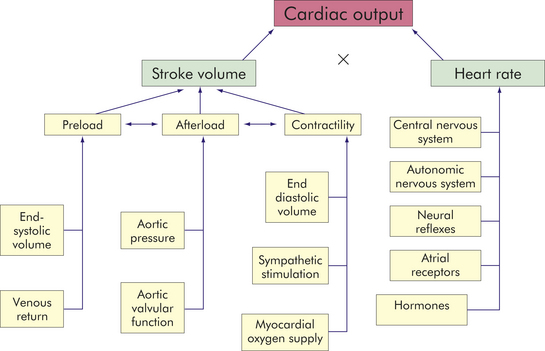
Figure 29-19 Factors affecting cardiac performance. Cardiac output, which is the amount of blood (in liters) ejected by the heart per minute, depends on heart rate (beats per minute) and stroke volume (milliliters of blood ejected during ventricular systole).
Frank-Starling Law of the Heart
Cardiac muscle, like other muscle, increases its strength of contraction when it is stretched. This relationship was described in 1914 by a British physiologist, Ernest Starling, who based his studies on the earlier work of a German physiologist, Otto Frank. In 1914 Starling wrote that “the output of any heart can be varied within wide limits by alterations of the venous inflow, and that within these limits it varies directly as the venous inflow. So long as the functional condition of the heart remains constant, the amount put out at each beat depends directly on the diastolic filling.”12a
The Frank-Starling law of the heart, or the length-tension relationship of cardiac muscle, relates resting sarcomere length, expressed as the volume of blood in the heart at the end of diastole, or end-diastolic volume, to tension generation, described as development of left ventricular pressure. Thus the volume of blood in the heart at the end of diastole (the length of its muscle fibers) is directly related to the force of contraction during the next systole. Although the change in pressure is related to volume of the ventricle and, consequently, to the length of the ventricular muscle fibers, it is common to use preload (i.e., filling pressure) as an index of ventricular volume. The length-tension mechanism is the major mechanism by which the normal right and left ventricles maintain equal minute outputs even though their stroke outputs may vary considerably during normal respiration. For example, changes in volume occur when an individual assumes a reclining position after being in a standing position; the volume of blood returning to the heart temporarily increases. The right ventricle stretches to accommodate this increase in volume and thereby increases its force of contraction. A larger stroke volume (i.e., the amount of blood ejected per beat) is pumped to the lungs, generating higher pressures. Pulmonary vascular pressure increases, causing a rise in the left ventricular filling pressure or preload. Left ventricular volume and pressure increase. The left ventricle pumps a larger stroke volume, and arterial vascular pressure rises.
The mechanical function of the heart is characterized by a number of length-tension curves (Figure 29-20). Factors that increase contractility (i.e., positive inotropic), such as sympathetic nerve stimulation, cause the heart to operate on a higher length-tension curve (curve A in Figure 29-20). A higher tension or increase in ventricular stroke volume is generated without a necessary change in left ventricular end-diastolic volume or fiber length. Heart failure (curve C in Figure 29-20) is characterized by a lower length-tension curve (see Chapter 30). The failing or dilated heart may not be able to use the Frank-Starling law of the heart because its fibers are already stretched beyond their optimal length. The failing heart responds to increased filling or stretch with a progressive decline in force of contraction. Thus at the same left ventricular end-diastolic volume as curves A and B (see Figure 29-20), the force of contraction of stroke volume is decreased.
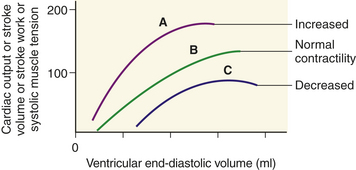
Figure 29-20 Frank-Starling law of the heart. Relationship between length and tension in the heart. End-diastolic volume determines end-diastolic length of ventricular muscle fibers and is proportional to tension generated during systole, as well as to cardiac output, stroke volume, and stroke work. A change in myocardial contractility causes the heart to perform on a different length-tension curve. A, Increased contractility; B, normal contractility; C, heart failure or decreased contractility. (See text.)
The cross-bridge theory partially accounts for the length-tension mechanism of cardiac muscle. According to the Frank-Starling law, the longer the initial resting length of the cardiac muscle fiber (optimal length is between 2.2 and 2.4 mm), the greater the strength of contraction. At 2.2 mm there is an optimal number of active cross-bridges between actin and myosin. If the fibers are stretched beyond 2.2 to 2.4 mm, the force of contraction decreases because actin and myosin become partially disengaged, disrupting many of the cross-bridges. Excessive stretching, to about 3.65 mm, causes actin and myosin to become completely disengaged and developed tension (force of contraction) to drop to zero. The relationship between stretch and contraction can be compared with that of a rubber band. To a certain point, the more the rubber band is stretched, the farther it will fly when one end is released; beyond that point, however, the rubber band will break.
Laplace’s Law
In Laplace’s law, wall tension is related directly to the product of intraventricular pressure and internal radius and inversely to the wall thickness. This relationship can be calculated by Laplace’s equation:
where T = wall tension, p = intraventricular pressure, r = internal radius of the sphere, and μm = wall thickness. In other words, the amount of tension generated in the wall of the ventricle (or any chamber or vessel) to produce a given intraventricular pressure depends on the size (radius and wall thickness) of the ventricle.
The law of Laplace is useful for understanding aneurysm formation, distensibility in blood vessels, and the effects of ventricular dilation on myocardial contraction. Dilation is an important factor in heart failure (see Chapter 30). With a dilated ventricle, myocardial fibers in the wall must develop greater tension to produce a given pressure within the ventricle. The disadvantage of dilation is that the increased force, or tension, in the myocardial fibers required to develop a given pressure inside a dilated ventricle results in a decrease in the rate of fiber shortening, thereby decreasing the ability of the ventricle to eject blood.
Preload
Left ventricular preload is the pressure generated in the left ventricle at the end of diastole, or left ventricular end-diastolic pressure (LVEDP). It is determined by left ventricular end-diastolic volume (LVEDV), according to the Frank-Starling law, which stretches the cardiac muscle fibers, which in turn develop tension, or force, for contraction. Preload is determined by two primary factors: (1) the amount of venous return to the ventricle and (2) the blood left in the ventricle after systole (end-systolic volume). End-systolic volume is dependent on the strength of ventricular contraction and the resistance to ventricular emptying. Within a physiologic range of muscle stretching (2.2 to 2.4 mm), increased preload increases cardiac output (volume of blood pumped per minute; see Figure 29-19). When preload exceeds the physiologic range, further muscle stretching causes a decline in cardiac output (see Frank-Starling law, p. 1109). In monitoring preload the clinician measures indexes of left ventricular end-diastolic pressure. Pressure changes are important because increased left ventricular filling pressures “back up” into the pulmonary circulation, where they force plasma out through vessel walls, causing fluid to accumulate in lung tissues (pulmonary edema; see Chapter 33). Treatment goals are to maintain an end-diastolic volume and pressure that will maintain or increase cardiac output.
Afterload
Left ventricular afterload is the resistance to ejection of blood from the left ventricle. Aortic systolic pressure is a good index of afterload. Low aortic pressures (decreased afterload) enable the heart to contract more rapidly, whereas high aortic pressures (increased afterload) slow contraction and cause higher workloads against which the heart must function so it can eject less blood. Pressure in the ventricle must exceed aortic pressure before blood can be pumped out during systole. Increased aortic pressure is usually the result of increased peripheral vascular resistance (PVR), also called total peripheral resistance (TPR). In individuals with hypertension, increased PVR means that afterload is chronically elevated resulting in increased ventricular workload and hypertrophy of the myocardium.
Myocardial Contractility
Stroke volume, or the volume of blood ejected during systole, depends on the force of contraction, which depends on myocardial contractility, or the degree of myocardial fiber shortening. Three major factors determine the force of contraction: (1) changes in the stretching of the ventricular myocardium caused by changes in ventricular volume (preload), (2) alterations in the sympathetic activation of the ventricles, and (3) adequacy of myocardial oxygen supply (see Figure 29-19). As discussed, increased blood flow from the veins into the heart distends the ventricle by increasing preload, which, within the physiologic range, increases the stroke volume and, subsequently, cardiac output.
Chemicals affecting contractility are called inotropic agents. The most important positive inotropic agents are epinephrine and norepinephrine released from the sympathetic nervous system. Other positive ionotropes include thyroid hormone and dopamine. The most important negative ionotropic agent is acetylcholine released from the vagus nerve. Many drugs have positive or negative ionotropic properties that can have profound effects on cardiac function.
Myocardial contractility also is affected by oxygen and carbon dioxide levels (tensions) in the coronary blood. With severe hypoxemia (arterial oxygen saturation less than 50%), contractility is decreased. With less severe hypoxemia (saturation more than 50%), contractility is stimulated. Moderate degrees of hypoxemia may increase contractility by enhancing the myocardial response to circulating catecholamines.1
Preload, afterload, and contractility all interact with one another to determine stroke volume and cardiac output. Changes in any one of these factors can result in deleterious effects on the others, resulting in heart failure (see Chapter 30).
Heart Rate
The average heart rate in healthy adults is about 70 beats/minute. The average heart rate is significantly greater in children. Heart rate diminishes by 10 to 20 beats/minute during sleep and can accelerate to more than 100 beats/minute during muscular activity or emotional excitement. In well-conditioned athletes at rest the heart rate is normally about 50 to 60 beats/minute. In highly trained or elite athletes the resting heart rate can be less than 50 beats/minute. The low resting heart rate is the result of increased vagal stimulation and lower sympathetic stimulation.
Highly trained athletes also have a greater stroke volume and lower peripheral resistance than they had before training. The lowered peripheral resistance is thought to be caused by an increase in the number of arterioles in skeletal muscle. The decrease in peripheral resistance increases the venous return. The slow heart rate (and therefore prolonged diastole) combined with the increased venous return results in a higher end-diastolic ventricular volume.1,7 The increased end-diastolic fiber length increases stroke volume, which helps compensate for the decreased heart rate so that cardiac output is maintained.
Neural factors, including neural reflexes, and hormonal and chemical factors influence the heart rate. Neural control is exerted by the central and autonomic nervous systems. Hormonal factors include the catecholamines norepinephrine and epinephrine, thyroid hormones, growth hormones, and pancreatic hormones. (Hormonal function is described in Chapter 20. Stimulation by the sympathetic nervous system increases the rhythmicity of the cardiac pacemaker (SA node), whereas the parasympathetic stimulation has an inhibiting effect.
Cardiovascular Control Centers in the Brain: The major cardiovascular control center is in the brainstem in the medulla with secondary areas in the hypothalamus, the cerebral cortex, the thalamus, and complex networks of exciting or inhibiting interneurons (connecting neurons) throughout the brain. The hypothalamic centers regulate cardiovascular responses to changes in temperature; the cerebral cortex centers adjust cardiac reaction to a variety of emotional states; and the medullary control center regulates heart rate and blood pressure (see p. 1122 for blood pressure regulation). The medullary neurons often are classified as cardiac and vasomotor (vasoconstrictor or vasodilator) centers; however, because these centers are not discrete anatomic areas and actually constitute diffuse networks of interneurons, it is preferable to call the entire area the cardiovascular control center.
The nerve fibers from the cardiovascular control center synapse with the autonomic neurons (see Chapter 14 and Table 14-7). When the parasympathetic nerves to the heart are stimulated, the sympathetic nerves to the heart, arterioles, and veins usually are inhibited. The opposite also is true: when the sympathetic nerves are stimulated, the parasympathetic nerves usually are inhibited. Because parasympathetic excitation and simultaneous sympathetic inhibition generally depress cardiac function (e.g., decrease the heart rate), these interneurons often are referred to as the cardioinhibitory center. Excitation occurs with parasympathetic inhibition and sympathetic stimulation, and these interneurons are collectively called the cardioexcitatory center. Therefore, heart rate can be slowed by two simultaneous events that begin in the cardiovascular control center: (1) inhibition of sympathetic stimulation of the SA node and (2) activation of parasympathetic stimulation of the SA node. Conversely, heart rate can be increased by activation of sympathetic nerves and inhibition of parasympathetic nerves.
The resting heart rate in healthy individuals is primarily under the control of parasympathetic stimulation. While the individual is at rest, parasympathetic effects from the vagus nerves override sympathetic effects in the SA node. Interruption of the vagus nerves causes significant tachycardia (abnormally fast heart rate) because the inhibitory parasympathetic influence is lost.
Neural Reflexes: Two important neural reflexes that affect heart rate and rhythm are the Bainbridge reflex and the baroreceptor reflex. The Bainbridge reflex causes changes in the heart rate after intravenous infusions of blood or other fluid13 (Figure 29-21). The changes in heart rate is thought to be caused by a reflex mediated by volume receptors in the atria that are innervated by the vagus nerves (volume receptors are thought to respond to increased plasma volume). The magnitude and direction of the change in heart rate depends on the initial heart rate. If the initial heart rate is slow, intravenous infusion usually accelerates it, but if the initial heart rate is rapid, infusions usually will slow it down.13 Contractility usually is not affected by the Bainbridge reflex.
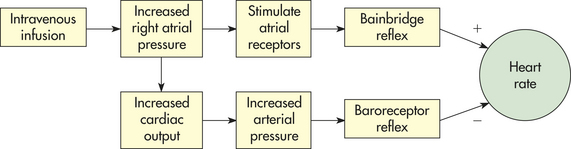
Figure 29-21 Heart rate and intravenous infusions. Intravenous infusions of blood or electrolyte solutions tend to increase heart rate through the Bainbridge reflex and to decrease heart rate through the baroreceptor reflex. The actual change in heart rate induced by such infusions is the result of these two opposing effects. (From Berne RM, Levy MN: Cardiovascular physiology, ed 8, St Louis, 2001, Mosby.)
The baroreceptor reflex facilitates both blood pressure changes and heart rate changes. The baroreceptor reflex is mediated by tissue pressure receptors (pressoreceptors) in the aortic arch and carotid arteries. (Because the receptors respond to mechanical factors, they are also called aortic and carotid mechanoreceptors.) If blood pressure is decreased, the baroreceptor reflex accelerates heart rate and causes vessels to constrict. These responses raise blood pressure back toward normal. This reflex is critical to maintaining adequate tissue perfusion. Aging is associated with dysfunction of the baroreflex and can result in postural hypotension (orthostatic hypotension, see p. 1156).14,15 Dysfunction of this reflex also plays a role in shock states.16
The baroreflex also serves to lower blood pressure when it gets too high. The pressoreceptors increase their rate of discharge when stretched by blood pressure elevations. Neural impulses are then transmitted over the glossopharyngeal nerve (ninth cranial nerve) from the carotid artery and through the vagus nerve from the aorta to the cardiovascular control centers in the medulla. These centers initiate an increase in parasympathetic activity and a decrease in sympathetic activity, causing blood vessels to dilate and heart rate to decrease. Responses to the baroreceptor reflex return the blood pressure to its previous level, which may or may not be normal. The higher the blood pressure, the greater the reflexive decrease in heart rate. This action of the baroreflex is being explored as a potential mechanism for the treatment of hypertension.17
Neural receptors in the lungs cause heart rate to increase during inspiration and decrease during expiration. The increase in heart rate during inspiration is caused by the stretching (activation) of vagal fibers in the lungs that cause heart rate to speed up by inhibiting the cardioinhibitory center of the medulla. Inhibition of this center allows unopposed sympathetic acceleration of heart rate.
Atrial Receptors: Receptors that influence heart rate exist in both atria. They are located in the right atrium at its junctions with the vena cava and in the left atrium at its junctions with the pulmonary veins.13 Distension of these atrial receptors sends impulses via C-fiber afferents. Stimulation of these atrial receptors also increases urine volume because of a neurally mediated reduction in antidiuretic hormone and the release of natriuretic peptides.1 Atrial natriuretic peptide (ANP) is released from atrial tissue in response to increased blood volume. ANP has powerful diuretic and natriuretic (salt excretion) properties, resulting in decreased blood volume and pressure.
Hormones and Biochemicals: Hormones and biochemicals affect the arteries, arterioles, venules, capillaries, and contractility of the myocardium. Norepinephrine increases heart rate, enhances myocardial contractility, and constricts blood vessels. Epinephrine dilates vessels of the liver and skeletal muscle and causes an increase in myocardial contractility. Some adrenocortical hormones, such as hydrocortisone, potentiate the effects of the catecholamines.
Thyroid hormones enhance sympathetic activity, promoting an increase in cardiac output. The exact mechanism by which this occurs is not known. A decrease in growth hormone, thyroid hormones, or adrenal hormones results in bradycardia (heart rate below 60 beats/minute), reduced cardiac output, and low blood pressure.
SYSTEMIC CIRCULATION
The arteries and veins of the systemic circulation are illustrated in Figure 29-22. Blood from the left side of the heart flows through the aorta and into the systemic arteries. The arteries branch into small arterioles that branch further into the smallest vessels, the capillaries, where nutrient exchange between the blood and tissues occurs. Blood from the capillaries then enters tiny venules that join to form the larger veins, which return venous blood to the right heart. Peripheral vascular system is an imprecise term used to describe the part of the systemic circulation that supplies the skin and the extremities, particularly the legs and feet.
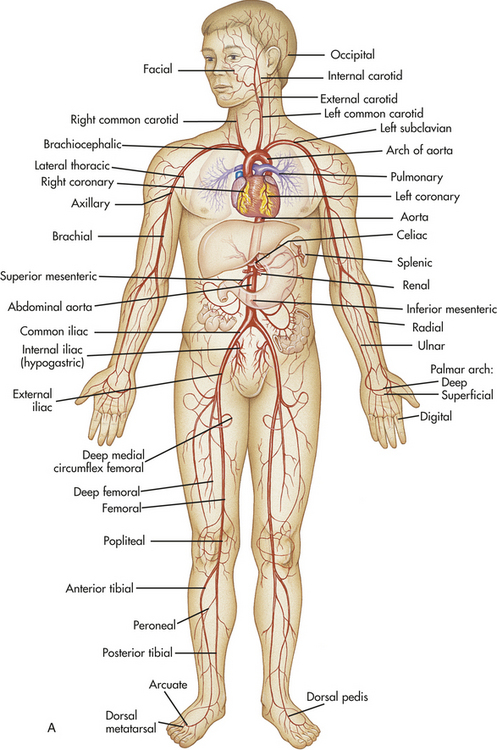
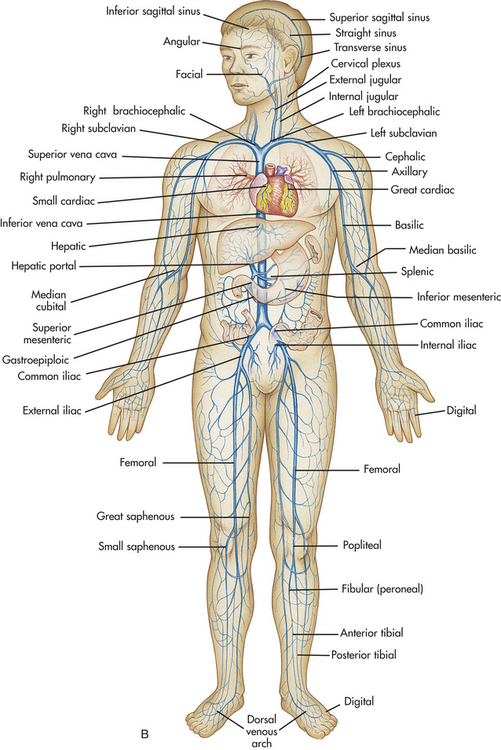
Figure 29-22 Circulatory system. A, Principal arteries of the body. B, Principal veins of the body. (From Thibodeau GA, Patton KT: Anatomy & physiology, ed 5, St Louis, 2003, Mosby.)
Structure of Blood Vessels
Blood vessel walls are composed of three layers: the tunica intima (innermost or intimal layer), the tunica media (middle or medial layer), and the tunica externa or adventitia (outermost or external layer). These structures are illustrated in Figure 29-23 and 29-24. The tunica intima is composed of a layer of squamous epithelium or endothelium, a layer of connective tissue, and a basement membrane. (These cellular structures are described in Chapter 1.) The tunica media is composed of smooth muscle fibers mixed with elastic fibers. The tunica externa, or adventitia, has a thin layer of connective tissue containing elastic and collagenous fibers that run lengthwise in the vessel. Blood vessel walls vary in thickness depending on the thickness or absence of one or more of these three layers. Cells of the larger vessels are nourished by the vasa vasorum, small vessels located in the tunica externa. The vasa vasorum arise from the blood vessel itself or from other vessels nearby.
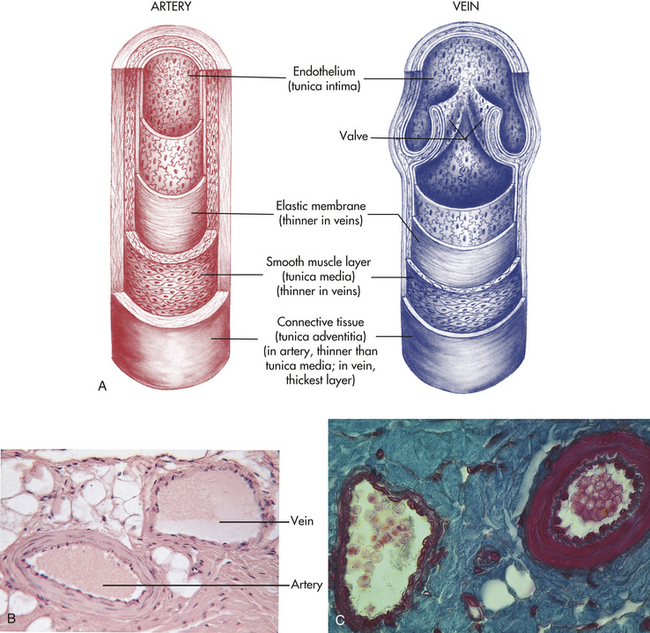
Figure 29-23 Schematic drawings and micrograph of artery and vein. A, Shown are the comparative thickness of three layers: outer layer (tunica adventitia), muscle layer (tunica media), and lining of endothelium (tunica intima). Note that muscle and outer coats are much thinner in veins than in arteries and that veins have valves. B, Micrograph (× 250) of a cross section of tissue containing both an artery (left) and a vein (right). Note the thickness of the smooth muscle (tunica media) in the artery compared with the vein. C, Micrograph showing both an artery and vein. The tunica media is much thicker in the artery. (A modified from Thompson JM et al: Mosby’s clinical nursing, ed 5, St Louis, 2002, Mosby. B from Thibodeau GA, Patton KT: Anatomy & physiology, ed 5, St Louis, 2003, Mosby. C copyright © Ed Reschke.)
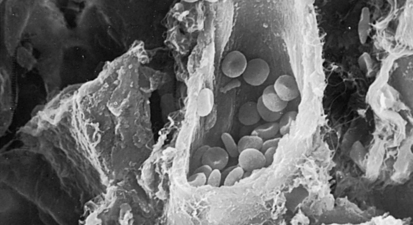
Figure 29-24 This ruptured tube is a blood vessel. It is full of red blood cells that move through blood vessels transporting oxygen and carbon dioxide from one place to another in the body. (From Raven RH, Johnson GB: Biology, ed 3, St Louis, 1992, Mosby)
Arterial Vessels
Arterial walls are composed of elastic connective tissue, fibrous connective tissue, and smooth muscle. The two types of arteries are elastic and muscular. The elastic arteries have a very thick tunica media that contains more elastic fibers than smooth muscle fibers. Elastic arteries include the aorta and its major branches and the pulmonary trunk. Elasticity enables the vessel to stretch as blood is ejected from the heart during systole. During diastole, elasticity promotes recoil of the arteries, which is important for maintaining blood pressure within the vessels.
The muscular arteries are the medium-size and small arteries farther from the heart than the elastic arteries. They contain fewer elastic fibers and more muscle fibers than the elastic arteries because, being farther from the heart, they have less need of the properties of stretch and recoil. The function of the muscular arteries is to distribute blood to arterioles throughout the body. They also play a role in controlling blood flow because their smooth muscle can be stimulated to contract or relax. Contraction narrows the vessel lumen (the internal cavity of the vessel), which diminishes flow through the vessel. This condition is termed vasoconstriction. The smooth muscle layer also can be stimulated to relax, which permits more blood to flow through the vessel lumen. This state is called vasodilation.
An artery becomes an arteriole at the point where the diameter of its lumen narrows to less than 0.5 mm. The arterioles are composed almost exclusively of smooth muscle, with little elastic tissue. Arterioles regulate the flow of blood into the capillaries by vasoconstriction, which retards the flow of blood into the capillaries, and vasodilation, which permits blood to enter the capillaries freely (Figure 29-25, p. 1117). The thick, smooth muscle layer of the arterioles is a major determinant of the resistance blood encounters as it flows through the systemic circulation.
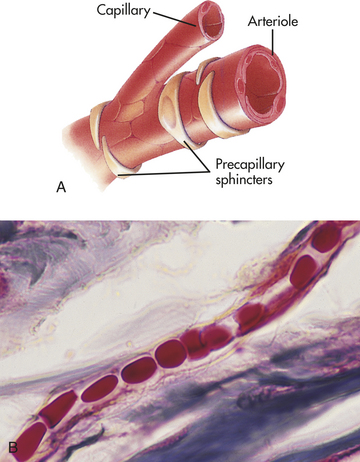
Figure 29-25 Capillary wall. A, Capillaries have a wall composed of only a single layer of flattened cells, whereas the walls of the larger vessels also have smooth muscle. B, Capillary with red blood cells in single file (× 500). (A from Thibodeau GA, Patton KT: Anatomy & physiology, ed 5, St Louis, 2003, Mosby; B copyright © Ed Reschke.)
The capillary network is composed of connective channels, or thoroughfares, called metarterioles, and “true” capillaries (Figure 29-26, p. 1118). The capillaries branch from the metarterioles, meeting at a ring of smooth muscle called the precapillary sphincters. As the sphincters contract and relax, they regulate blood flow through the capillaries. Appropriately stimulated, the precapillary sphincters help maintain arterial pressure and regulate selective flow to vascular beds.
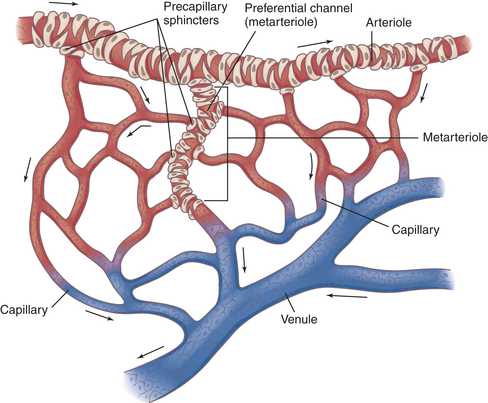
Figure 29-26 Capillary network. Blood enters the network as arterial blood and exits as venous blood.
The capillary walls are very thin, making possible the rapid exchange of substrates, metabolites, and special products (e.g., hormones) between the blood and the interstitial fluid, from which they are taken up by the cells. The capillary wall consists of a single layer of endothelial cells surrounded by the thin basement membrane of the tunica intima. A single endothelial cell may form the entire vessel wall if the capillary has no tunica media or tunica externa. In some capillaries the endothelial cells contain oval windows or pores termed fenestrations. Fenestrations generally are covered by a thin diaphragm.
Substances pass between the capillary lumen and the interstitial fluid in several ways: (1) through junctions between endothelial cells, (2) through fenestrations in endothelial cells, (3) in vesicles moved by active transport across the endothelial cell membrane, or (4) by diffusion through the endothelial cell membrane. (Movement across cell membranes is described in Chapter 1.) A single capillary may be only 0.5 to 1 mm in length and 0.01 mm in diameter, but the capillaries are so numerous that their total surface area may be more than 600 m2.
Endothelium
All tissues depend on a blood supply and the blood supply depends on endothelial cells, which form the lining, or endothelium, of the blood vessel (Figure 29-27). Endothelial cells are really quite remarkable in that they can adjust their number and arrangement to accommodate local requirements. Thus they are a life-support tissue extending and remodeling the network of blood vessels to enable tissue growth, promote contraction or relaxation or vasomotion, repair, antithrombogenesis, and fibrinolysis. The endothelium performs these vital functions via synthesis and release of vasoactive chemicals.18–20 Box 29-1 and Figures 29-28 (p. 1120) and 29-29 (p. 1121) summarize some of the more important functions. Endothelial injury and dysfunction are central processes in many of the most common and serious cardiovascular disorders including hypertension and atherosclerosis (see p. 1157).
Box 29-1 Endothelium Functions and Vasoactive Substances
Prostacyclin: A prostaglandin formed from arachidonic acid that can relax vascular smooth muscle through increases in cAMP. The primary function is to inhibit platelet adherence to the endothelium.
Nitric oxide (NO): Bradykinin prompts the endothelium to synthesize and release NO, a potent vasodilator. NO is anti-inflammatory and antithrombotic.
C-type natriuretic hormone: Made throughout the vasculature and works with NO and prostacyclin as a vasodilator.
Insulin: Insulin increases endothelial cell production of nitric oxide.
Endothelin: A potent endothelium-derived constrictor.
Urotensin II: Another potent endothelium-derived constrictor
Angiotensin II (Ang II): A potent vasoconstrictor is produced both hormonally via the renin-angiotensin-aldosterone system and locally in vascular tissues. Ang II blocks the release of NO and prostacyclin. Ang II is also proinflammatory: it increases vascular permeability, recruits infiltrating monocytes, increases expression of adhesion molecules, and stimulates release of growth factors.
Thromboxane: Causes vasoconstriction and platelet adhesion.
Prostaglandins: Cause vasoconstriction especially during states of chronic inflammation.
Platelet and monocyte adhesion: The endothelium helps regulate clotting and inflammation by modulating the number of platelets and inflammatory cells (monocytes and macrophages) that bind to the vessel wall. Endothelial-derived substances include von Willebrand factor, platelet-activating factor, heparan sulfate, t-PA, and others.
Filtration and permeability: The endothelium facilitates movement of large molecules through intercellular junctions and small molecules via vesicles and junctions.
Cell growth and inhibition: NO and prostacyclin inhibit cellular growth; Ang II stimulates growth.
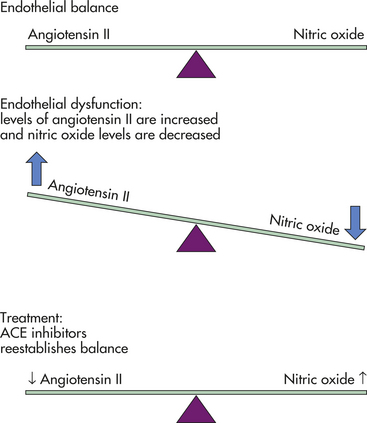
ACE, Angiotensin-converting enzyme; cAMP, cyclic adenosine monophosphate; t-PA, tissue-type plasminogen activator.
Data from Esper RJ et al: Adv Cardiol 45:17-43, 2008; Schafer A, Bauersachs J: Curr Vasc Pharmacol 6(1):52-60, 2008; Thijssen DH et al: J Physiol 586(2):319-324, 2008.
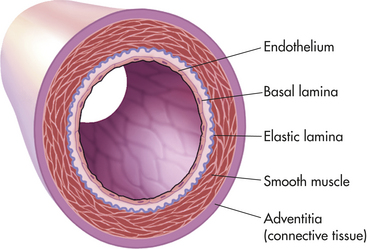
Figure 29-27 Endothelium. Practically imperceptible, the endothelial cells arrange themselves as a fine lining that has numerous life support functions.
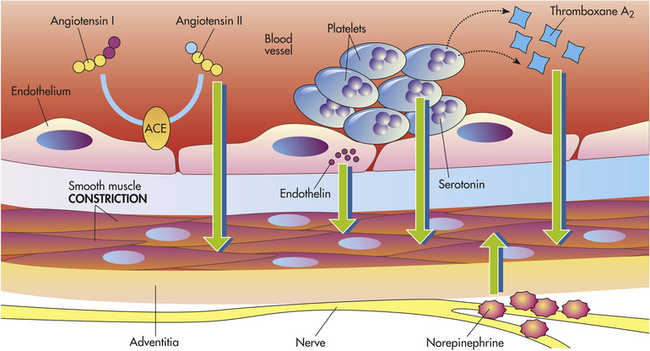
Figure 29-28 Endothelium regulation of vasomotion (constriction and dilation) and platelet aggregation by release of a variety of constricting and dilating substances. Constricting factors include arachidonic acid and metabolites, such as thromboxane A2 (which aspirin inhibits), and a potent amino acid peptide called endothelin. The endothelium also converts angiotensin I into angiotensin II by the membrane-bound angiotensin-converting enzyme that also metabolizes the endogenous endothelium-dependent vasodilator, bradykinin. (Modified from Stern S: Silent myocardial ischemia, St Louis, 1998, Mosby.)
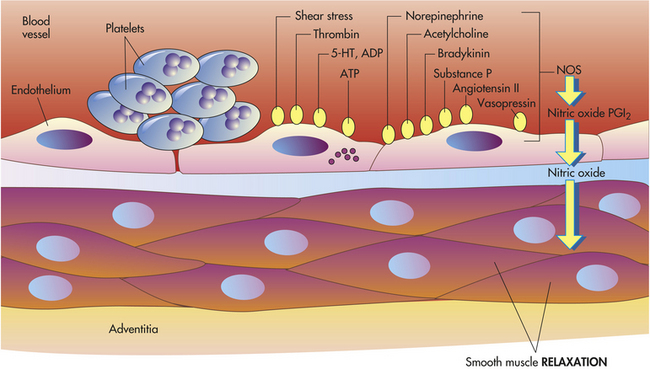
Figure 29-29 Factors causing endothelium-dependent vasodilation. A variety of exogenous pharmacologic substances, platelet-derived factors, and shear stress can promote release of nitric oxide by stimulating nitric oxide synthase (NOS). Prostacyclin (PGI2) causes relaxation of vascular smooth muscle cells by cyclic adenosine monophosphate (cAMP)–dependent mechanism, and both nitric oxide and PGI2 inhibit platelet aggregation. 5-HT, Serotonin; ADP, adenosine diphosphate; ATP, adenosine triphosphate. (Modified from Stern S: Silent myocardial ischemia, St Louis, 1998, Mosby.)
Veins
The smallest venules closest to the capillaries have an inner lining composed of the endothelium of the tunica intima and surrounded by fibrous tissue. The largest venules, those farthest from the capillaries, are surrounded by a few smooth muscle fibers comprising a thin tunica media.
Compared with arteries, veins are thin walled and fibrous with a larger diameter (see Figure 29-23). A given vein is larger than the artery that lies within the same sheath. Veins are more numerous than arteries. In veins the tunica externa has less elastic tissue than in arteries, so veins do not recoil after distention as quickly as arteries. Like arteries, veins receive nourishment from the tiny vasa vasorum. Some veins, most commonly in the lower limbs, contain valves that regulate the one-way flow of blood toward the heart (Figure 29-30, p. 1121). These valves are folds of the tunica intima and resemble the semilunar valves of the heart. Backflow in veins of the legs is stopped as the flaps of the valves fill with blood and block the vessel. The position of the valves also facilitates blood flow in the proper direction during venous compression. When a person stands up, contraction of the skeletal muscles of the legs compresses the deep veins of the legs and assists the flow of blood toward the heart. This important mechanism of venous return is called the muscle pump (Figure 29-31, p. 1122).
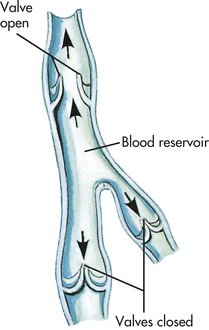
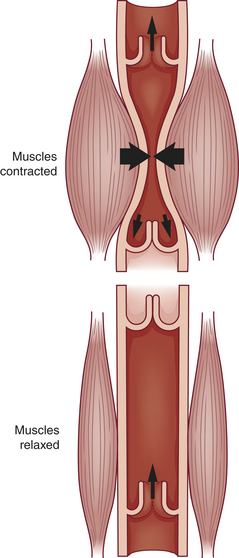
Factors Affecting Blood Flow
Blood flow is the amount of fluid moved per unit of time and usually is expressed as liters or milliliters per minute (ml/min) or cubic centimeters per second (cm3/sec). Flow is regulated by the same physical properties that govern the movement of simple fluids in a closed, rigid system, that is, pressure, resistance, velocity, turbulent versus laminar flow, and compliance.
Pressure and Resistance
Blood flow is determined primarily by two factors: pressure and resistance. Pressure in a liquid system is the force exerted on the liquid per unit area and is expressed as dynes per square centimeter (dynes/cm2), millimeters of mercury (mmHg), or torr. Blood flow depends partly on the difference between pressures in the arterial and venous vessels supplying the organ. Fluid moves from the arterial “side” of the capillaries, a region of greater pressure, to the venous side, a region of lesser pressure.
Resistance is the opposition to force. In the cardiovascular system most opposition to blood flow is provided by the diameter and length of the blood vessels themselves. Therefore changes in blood flow through an organ result from changes in the vascular resistance within the organ. The major mechanisms causing changes in vascular resistance are an increase or a decrease in vessel diameter and the opening or closing of vascular channels. Resistance in a vessel is inversely related to blood flow; that is, increased resistance leads to decreased blood flow.
Blood flow (Q) through a vessel can be calculated from measurements of pressure at the inflow end of the vessel (P1), pressure at the outflow end of the vessel (P2), and resistance (R). The difference between P1 and P2 often is referred to as the change in pressure and is expressed as δP. The following formula, which expresses Poiseuille’s law, shows the relationship among blood flow, pressure, and resistance:

where Q = blood flow, δP = the pressure difference (P1 −P2), and R = resistance.
Resistance to flow cannot be measured directly, but it can be calculated if the pressure difference and flow volumes are known.
Flow varies inversely with the viscosity of the fluid. Thick fluids move more slowly and cause greater resistance to flow than thin fluids. The viscosity of blood depends on its red cell content. The greater the percentage of red cells in the blood, the more viscous the blood. This relationship is expressed as the hematocrit—the ratio of the volume of red blood cells to the volume of whole blood (see Chapter 25). A high hematocrit reduces flow through the blood vessels, particularly the microcirculation (arterioles, capillaries, venules). Conditions in which the hematocrit is elevated, such as dehydration, cyanotic congenital heart disease (see Chapter 31), or polycythemia (see Chapter 26), can lead to increased cardiac work as a result of increased vascular resistance.
The viscosity of blood also increases if blood flow becomes very slow or stagnates (anomalous viscosity). Anomalous viscosity is generally not significant unless cardiac output is low. (Shock is described in Chapter 46.)
Poiseuille’s formula for resistance to fluid flow through a tube takes into account the length of the tube, the viscosity of the fluid, and the radius of the tube’s lumen. Resistance (R) is proportional to a constant 8/π, the viscosity of the blood (η), and the length of the vessel (l), and it is inversely proportional to the fourth power of the lumen’s radius (ν4).2 Thus

Because this equation was derived using straight, rigid tubes with steady streamlined flow, it cannot be applied directly to the vascular system. Nevertheless, it is a useful model of vascular resistance.
The most important factor determining resistance in a single vessel is the caliber of the vessel’s lumen, expressed in Poiseuille’s formula as its radius and in Figure 29-32 as its diameter. Small changes in the lumen’s radius lead to large changes in vascular resistance. Because vessel length is relatively constant, length is not as important as lumen size in determining flow through a single vessel.
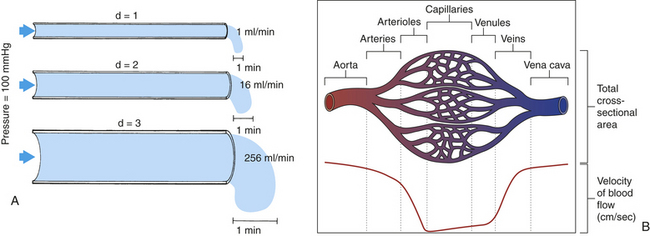
Figure 29-32 Lumen diameter, blood flow, and resistance. A, Effect of lumen diameter on flow through vessel. B, Blood flows with great speed in the large arteries. However, branching of arterial vessels increases the total cross-sectional area of the arterioles and capillaries, reducing the flow rate. When capillaries merge into venules and venules merge into veins, the total cross-sectional area decreases, causing the flow rate to increase. d, Diameter. (B from Thibodeau GA, Patton KT: Anatomy & physiology, ed 5, St Louis, 2003, Mosby.)
Generally, resistance to flow is greater in longer tubes because resistance increases with length. That resistance increases with increased length is demonstrated by comparing flow of the same amount of blood under the same pressure through vessels arranged in different configurations. Blood flowing through the distributing arteries, beginning with branches off the aorta and ending at arterioles in the capillary bed, encounters more resistance than blood flowing through the capillary bed itself, where flow is distributed among many short, tiny branches arranged in parallel. This is because the distributing arteries comprise a long system of tubes connected in series (end-to-end), whereas the arterioles and capillaries comprise a short system of many vessels arranged in parallel (side by side) (Figure 29-33). Although the arterioles are arranged in series with the distributing arteries and the capillaries, they are arranged in parallel with other arterioles. Similarly, the capillaries are in series with the metarterioles, but they are in parallel with other capillaries.
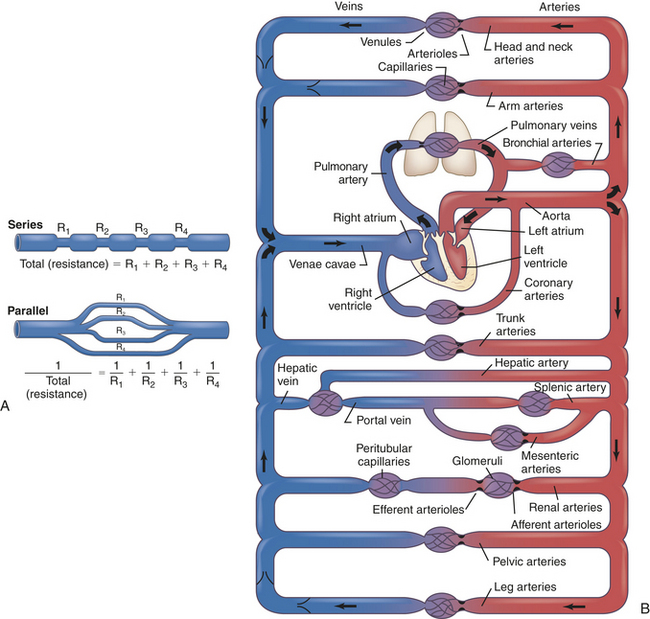
Figure 29-33 Schematic diagram of the parallel and series arrangement of the vessels composing the circulatory system. A, Resistance in blood vessels arranged in series or parallel. B, The capillary beds are represented by thin lines connecting the arterioles (on the right) and the veins (on the left). The crescent-shaped thickenings proximal to the capillary beds represent the arterioles (resistance vessels). R, Resistance in an individual vessel. (B modified from Berne RM, Levy MN: Cardiovascular physiology, ed 8, St Louis, 2001, Mosby.)
Resistance to flow through a system of vessels, or total resistance, depends not only on characteristics of individual vessels but also on whether the vessels are arranged in series or in parallel (see Figure 29-30). For vessels arranged in series, total resistance equals the sum obtained by adding all the individual resistances calculated using Poiseuille’s formula. For vessels arranged in parallel, total resistance equals the sum of the reciprocals (I/R) of the individual resistances.
Total resistance is related to the total cross-sectional area of a system of vessels in parallel and to the number of vessels in parallel that make up the total cross-sectional area. The larger the total cross-sectional area, as in the capillary system, the lower the resistance. However, if a cross-sectional area is made up of a very large number of parallel vessels, the overall resistance will be greater than it would be if the cross-sectional area were made up of only two or three parallel vessels. Therefore, resistance is greater in smaller vessels than in larger vessels. The total cross-sectional area of the arteriolar system is greater than that of the arterial system (see Figure 29-32); the greater number of arterioles arranged in parallel, however, leads to greater resistance to flow in the arteriolar system. The pressure drop is greatest across the arterioles. Many capillaries arise from each arteriole so that the total cross-sectional area of the capillary bed is very large and resistance is low, despite the fact that the cross-sectional area of each capillary is less (which normally increases resistance) than that of each arteriole. As a result, blood flow becomes quite slow in the capillaries, analogous to water flow in a river. A narrow river whose bed widens flows more slowly through the wide section than through the narrow section. The slow velocity of flow in each vessel promotes optimal capillary-tissue exchange.
Velocity
Blood velocity is the distance blood travels in a unit of time, usually centimeters per second (cm/sec). Blood velocity is directly related to blood flow (amount of blood moved per unit of time) and inversely related to the cross-sectional area of the vessel in which the blood is flowing.
The relationship between velocity and flow can be understood by thinking of a river. The volume of water flowing in a river is the same whether the river is narrow or wide. Where the river narrows, the water flows quickly; where it widens, the water flows slowly. The volume of water moving between the riverbanks does not change. In the body, as blood moves from the aorta to the capillaries, the total cross-sectional area of the vessels increases and velocity of flow decreases.
Laminar Versus Turbulent Flow
Flow through any tubular system is either laminar or turbulent. Normally, blood flow through the vessels is laminar. In laminar flow, concentric layers of molecules move “straight ahead.” Each concentric layer flows at a different velocity (Figure 29-34). The cohesive attraction between the fluid and the vessel wall prevents the molecules of blood that are in contact with the wall from moving. The next thin layer of blood is able to slide slowly past the stationary layer and so on until, at the center, the blood velocity is greatest. The centermost concentric layer of fluid is not slowed by friction against the vessel wall. Large vessels have room for a large center layer; therefore, they have less resistance to flow and greater flow and velocity than smaller vessels.
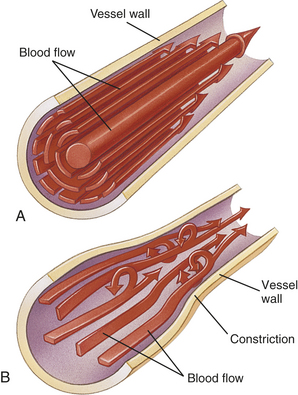
Figure 29-34 Laminar and turbulent flow. A, Laminar flow. Fluid flows in long smooth-walled tubes as if it is composed of a large number of concentric layers. B, Turbulent flow is caused by numerous small currents flowing crosswise or oblique to the long axis of the vessel, resulting in flowing whorls and eddy currents. (From Seeley RR, Stephens TD, Tate P: Anatomy and physiology, ed 3, St Louis, 1995, Mosby.)
Where flow is obstructed, the vessel turns, or blood flows over rough surfaces, it becomes turbulent with whorls or eddy currents that produce noise, causing a murmur to be heard on auscultation. Resistance increases with turbulence.
Vascular Compliance
Vascular compliance is the increase in volume a vessel is able to accommodate for a given increase in pressure (e.g., C = VP). Compliance depends on the ratio of elastic fibers to muscle fibers in the vessel wall. The elastic arteries are more compliant than the muscular arteries; the veins are more compliant than either type of artery and serve as storage areas for the circulatory system.
Compliance determines a vessel’s response to pressure changes. For example, with a very small increase in pressure, a large volume of blood can be accommodated by the venous system. In the less compliant arterial system, where smaller volumes and higher pressures are normal, small variations in pressure cause little or no change in the volume of blood within the arterial vessels.
Stiffness is the opposite of compliance. Several conditions and disorders can cause stiffness, with the most common being arteriosclerosis (see Chapter 30). Arteriosclerosis increases the rigidity or stiffness of arterial walls, which in turn increases peak arterial pressure at a given volume of blood.
Regulation of Blood Pressure (Arterial Pressure)
Arterial pressure is constantly regulated to maintain tissue perfusion, or blood supply to the capillary beds, during a wide range of physiologic conditions, including changes in body position, muscular activity, and circulating blood volume. Arterial pressure is determined by the cardiac output (heart rate times stroke volume) and the peripheral resistance. Increases in one or both will raise arterial pressure, and decreases in one or both will lower the arterial pressure (see Table 29-3). The mean arterial pressure (MAP), which is the average pressure in the arteries throughout the cardiac cycle, depends on the elastic properties of the arterial walls and the mean volume of blood in the arterial system. MAP can be approximated from the measured values of the systolic (Ps) and diastolic (Pd) pressures by means of the following formula:MAP = Pd + 1/3
Table 29-3
Factors That Affect Mean Arterial Pressure and Capillary Flow
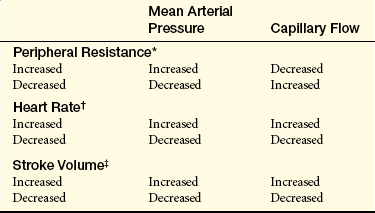
∗Cardiac output maintained constant.
†Peripheral resistance and stroke volume constant.
‡Peripheral resistance and heart rate constant.
From Little RC: Physiology of the heart and circulation, ed 3, St Louis, 1985, Mosby.
The major factors and relationships that regulate arterial blood pressure are summarized in Figure 29-35.
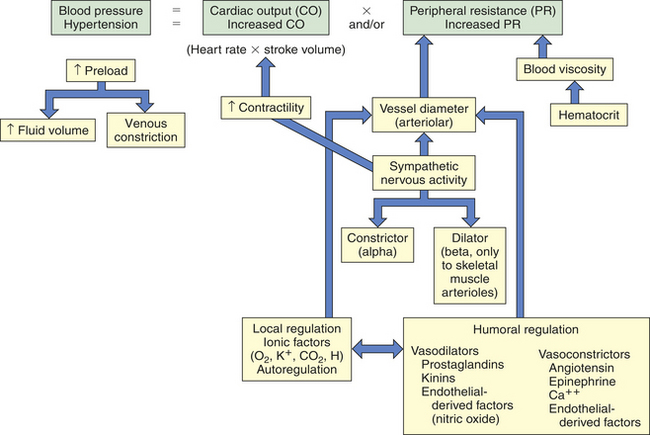
Effects of Cardiac Output
The cardiac output (minute volume) of the heart can be changed by alterations in heart rate, stroke volume (volume of blood ejected during each ventricular contraction), or both. An increase in cardiac output without a decrease in peripheral resistance will cause arterial volume and mean blood pressure to increase. The higher arterial pressure increases blood flow through the arterioles. On the other hand, a decrease in the cardiac output causes an immediate drop in mean arterial blood pressure and arteriolar flow (Table 29-3).
Effects of Total Peripheral Resistance and Blood Volume
Total resistance in the systemic circulation, sometimes called total peripheral resistance, is determined primarily by change in the diameter of the arterioles. Arteriolar constriction raises mean arterial pressure by preventing the free flow of blood into the capillaries. Dilation has the opposite effect.
Neural Control of Total Peripheral Resistance: Reflex control of total cardiac output and peripheral resistance includes (1) sympathetic stimulation of heart, arterioles, and veins; and (2) parasympathetic stimulation of the heart only. The autonomic nervous system is monitored by the cardiovascular control center in the brain (see Figure 29-11). The hypothalamic centers regulate vascular (and cardiac) responses to changes in temperature. When the body’s core temperature exceeds normal, the hypothalamus reflex initiates dilation of arterioles and veins in the skin. This causes shunting of blood to the skin, where heat is lost from sweating, radiation, conduction, or convection. When body core temperature decreases below normal, surface vessels constrict, shunting blood to the vital organs. Vasoconstriction is regulated by an area of the brainstem that maintains a constant (tonic) output of norepinephrine from sympathetic fibers in the peripheral arterioles. This tonic activity is essential for maintenance of blood pressure.
During exercise and stress, the sympathetic fibers that stimulate vasodilation of skeletal muscle arterioles are thought to be under the direct control of the cerebral cortex and hypothalamus and not the medullary centers. Information about pressure and resistance is sensed by neural receptors (baroreceptors and chemoreceptors) in arterial walls and delivered to the medullary centers.
Baroreceptors: As described, baroreceptors influence both heart rate and vascular resistance, and therefore blood pressure. Major stretch receptors are located in the aorta and in the carotid sinus (Figure 29-36). These baroreceptors respond to changes in smooth muscle fiber length by altering their rate of discharge and they supply sensory information to the cardiovascular center that regulates blood pressure.14,15 (Technically they are mechanoreceptors but they usually are called baroreceptors or pressoreceptors.) The rate of firing of the baroreceptors increases and decreases with changes in blood pressure. An increase in arterial pressure increases the rate of firing of the carotid sinus and aortic arch baroreceptors. These impulses travel up the afferent nerves to the medulla (e.g., the cardiac control center) and (1) slow heart rate by decreasing sympathetic discharge and increasing parasympathetic discharge (vagus nerve), (2) decrease myocardial contractility by inhibiting sympathetic discharge, and (3) increase arteriolar and venous dilation by decreasing sympathetic discharge to smooth muscle. The net effect of this major blood pressure–regulating reflex is to reduce blood pressure to normal by decreasing cardiac output (heart rate and stroke volume) and peripheral resistance. Conversely, the baroreceptor response to decreased blood pressure results in an increase in heart rate, an increase in myocardial contractility, and peripheral vasoconstriction, thus raising the blood pressure. (Postural changes and the baroreceptor reflex are discussed in Chapter 30.)
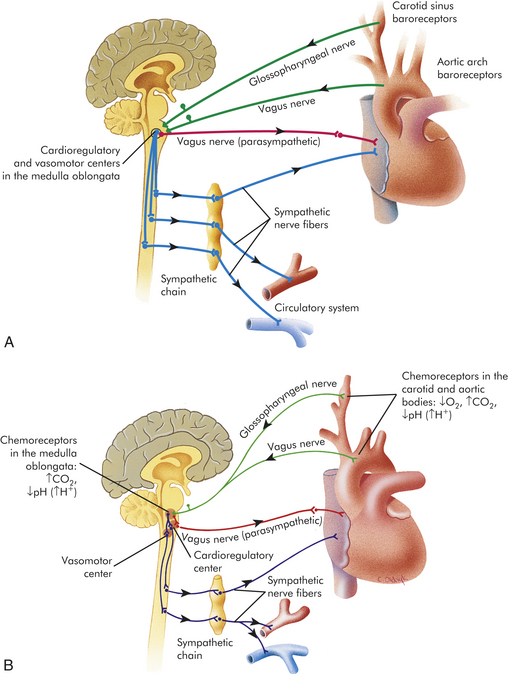
Figure 29-36 Baroreceptor and chemoreceptor reflex control of blood pressure. A, Baroreceptor reflexes. Baroreceptors located in the carotid sinuses and aortic arch detect changes in blood pressure. Action potentials are conducted to the cardioregulatory and vasomotor centers. The heart rate can be decreased by the parasympathetic system; the heart rate and stroke volume can be increased by the sympathetic system. The sympathetic system also can constrict or dilate blood vessels. B, Chemoreceptor reflexes. Chemoreceptors located in the medulla oblongata and in the carotid and aortic bodies detect changes in blood oxygen, carbon dioxide, or pH. Action potentials are conducted to the medulla oblongata. In response, the vasomotor center can cause vasoconstriction or dilation of blood vessels by the sympathetic system, and the cardioregulatory center can cause changes in the pumping activity of the heart through the parasympathetic and sympathetic systems. (From Seeley RR, Stephens TD, Tate P: Anatomy & physiology, ed 3, St Louis, 1995, Mosby.)
Arterial Chemoreceptors: Specialized areas within the medulla oblongata and aortic and carotid arteries are sensitive to concentrations of oxygen, carbon dioxide, and hydrogen ions (pH) in the blood (see Figure 29-34, B). Although these receptors, called chemoreceptors, are more important for the control of respiration, they also transmit impulses to the medullary cardiovascular centers that regulate blood pressure. A decrease in arterial oxygen concentration or pH causes a reflexive increase in blood pressure, whereas an increase in carbon dioxide causes a decrease in blood pressure. Blood pressure changes are carried out by smooth muscle layers in the vessels. Vasoconstriction raises blood pressure and vasodilation lowers it. The major chemoreceptive reflex is caused by alterations in arterial oxygen concentration. The effects of altered pH or carbon dioxide levels are minor.
Effect of Hyperemia: When metabolic activity is increased in the heart, skeletal muscle, and other muscular organs, it causes an increase in blood flow termed hyperemia. For example, the blood flow to exercising skeletal muscle increases in proportion to the activity of the muscle. This condition, known as active (exercise) hyperemia, is the result of arteriolar dilation and autoregulation of blood flow within the active organ. Reactive hyperemia refers to vasodilation in response to restoration of blood flow after a period of tissue ischemia and results from a buildup of vasodilatory metabolic byproducts in the ischemic tissue.
Effects of Hormones: Many hormones cause contraction or relaxation of arteriolar smooth muscle. By constricting or dilating arterioles in specific vascular beds, hormones can (1) increase the blood supply to vital organs requiring more flow in times of stress, (2) redistribute blood volume during hemorrhage or shock, and (3) regulate heat loss.
Epinephrine, the hormone released from the adrenal medulla, causes vasoconstriction in most vascular beds (exceptions are the coronary, liver, and skeletal muscle). However, the effects of norepinephrine (from the sympathetic nervous system and adrenal medulla) are quantitatively more vasoconstrictive than the effects of epinephrine.
Antidiuretic hormone (ADH) is released by the posterior pituitary and causes reabsorption of water by the kidney. With reabsorption the blood plasma volume will increase, increasing blood pressure. ADH, also known as arginine vasopressin, is a potent vasoconstrictor, thus it increases peripheral resistance (Figure 29-37, and see Chapters 3 and 35).
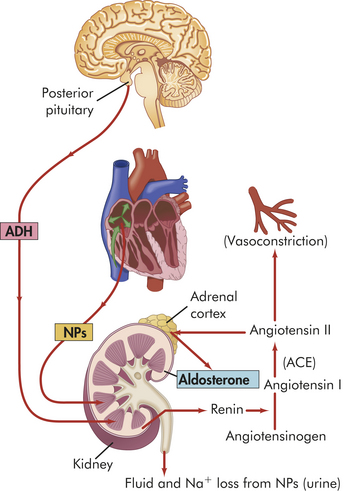
Figure 29-37 Three mechanisms that influence total plasma volume. The antidiuretic hormone (ADH) mechanism and renin-angiotensin and aldosterone mechanisms tend to increase water retention and thus increase total plasma volume. The natriuretic peptides antagonize these mechanisms by promoting water loss and sodium loss, thus promoting a decrease in total plasma volume. NPs, Natriuretic peptides; ACE, angiotensin-converting enzyme. (Modified from Thibodeau GA, Patton KT: Anatomy & physiology, ed 5, St Louis, 2003, Mosby.)
Renin is an enzyme synthesized and secreted by the juxtaglomerular cells of the kidney. It also has been found in the adrenal cortex, salivary gland, prolactin-producing and luteinizing hormone–producing cells of the pituitary, arterial smooth muscle cells in the vascular endothelium, brain, myocardium, and possibly other tissues.21 The following factors control renin release:
1. A drop in blood pressure (detected by the juxtaglomerular cells as a decrease in blood flow to the kidney)
2. A decrease in the amount of sodium chloride delivered to the kidney
3. β-adrenergic stimuli (increase renin release) and β-adrenergic inhibitors (decrease renin release)
4. Angiotensin II (decreases renin release)
5. Low potassium concentrations in plasma (increases renin release)
Angiotensin II (Ang II) is created when renin splits off a polypeptide from angiotensinogen to generate angiotensin I (Ang I). Angiotensin I appears to be physiologically inactive. Angiotensin I, however, is converted by an enzyme, called angiotensin-converting enzyme (ACE), to Ang II. Ang II is a powerful vasoconstrictor and stimulates the secretion of aldosterone from the adrenal gland22 (Figure 29-37; also see Figure 29-38). Ang II is also a growth promoter in cardiovascular tissues, resulting in myocyte and vascular hypertrophy and progression of hypertension.21,22 Neural effects of Ang II include stimulation of thirst, release of antidiuretic hormone, and increases in sympathetic nervous system output (i.e., catecholamines). A second form of ACE, called ACE2, helps to degrade Ang II and therefore balance its effects on the vasculature23 (see What’s New? The Renin-Angiotensin-Aldosterone System Revisited, p. 1128).
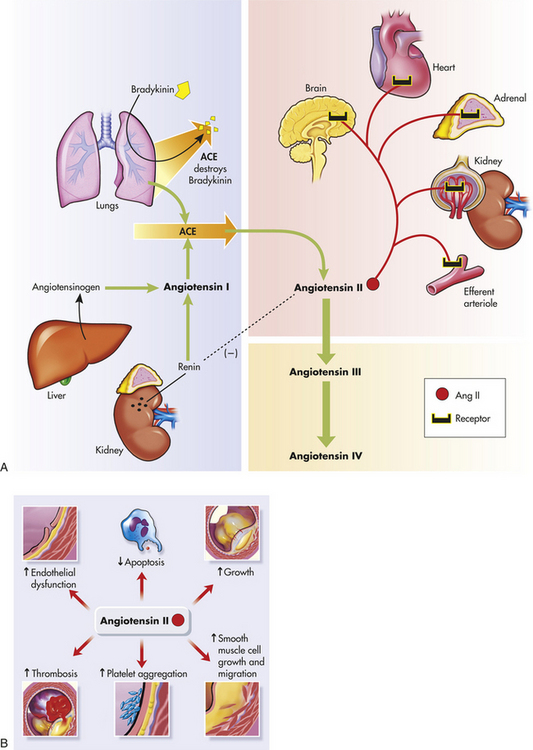
Figure 29-38 Angiotensins and the organs affected. A, The shaded blue area is the classical pathway of biosynthesis that generates the renin and angiotensin I. Angiotensinogen is synthesized in the liver and is released into the blood where it is cleaved to form angiotensin I by renin secreted by cells in the kidneys. Angiotensin-converting enzyme (ACE) in the lung catalyzes the formation of angiotensin II from angiotensin I, and destroys the potent vasodilator, bradykinin. Further cleavage generates the angiotensins III and IV. The reddish shading shows the organs affected by angiotensin II including the brain, heart, adrenals, kidney, and the kidney’s efferent arterioloes. The dashed arrow (on the left) shows the inhibition of renin by angiotensin II. B, Summary of angiotensin II effects on blood vessel structure and function leading to arteriosclerosis. (Redrawn from Goodfriend TL et al: N Engl J Med 334:2649-2654, 1996.)
This kidney-based renin-angiotensin-aldosterone-system (RAAS) serves as an important regulatory loop. For example, decreases in blood pressure or sodium delivery to the kidneys (macula densa), as might occur after hemorrhage or extracellular volume deficits (dehydration), stimulate secretion of renin, which forms Ang I, which is converted to Ang II and restores blood pressure. Sodium retention also results from increased secretion of aldosterone. Overall, the renin-angiotensin system is activated after volume depletion or hypotension or both, and it is suppressed after volume repletion and restoration of normal blood pressure. Basic knowledge of the renin-angiotensin system has advanced. Important is knowledge of a tissue-based renin-angiotensin system that can be regulated independently from the circulation. These new data are redefining our understanding of hypertension and other vascular disorders. The tissue renin-angiotensin system is activated in response to tissue injury. This system is involved in maladaptive alterations, such as ventricular and vascular remodeling, alterations in renal functions, and atherosclerosis24,25 (see Chapter 30). Particularly significant is an increased recognition of the role of Ang II in these processes (see Figure 29-38).
Ang II has two primary subtypes of receptors, AT1 and AT2 (see Figure 29-38). Both subtypes are expressed in human hearts. AT1 is also found on vascular smooth muscle and endothelial cells, nerve endings, conduction tissues, adrenal cortex, liver, kidney and brain. AT2 receptors are found in fetal mesenchymal tissue, adrenal medulla, uterus and ovarian follicles, renal tubules, and vasculature. A third type of Ang II receptor, AT4, has been described, although its effects are still being evaluated26 (see What’s New? The Renin-Angiotensin-Aldosterone System Revisited). The majority of Ang II actions are thought to occur through the AT1 receptor, including growth promotion, vasoconstriction, antinatriuresis (save Na+), aldosterone secretion, inhibition of renin synthesis and release, salt appetite, thirst, sympathetic outflow and stimulation of inflammation.22,25–28 Treatments such as ACE inhibitors and angiotensin receptor antagonists that inhibit AT1 receptor are a main target in preventive and reparative strategies in cardiovascular disease.
Although the majority of Ang II actions are mediated via the AT1 receptor, evidence is emerging that AT2 receptor opposes the AT1 receptor, especially by inducing vasodilation instead of vasoconstriction.29 AT2 dilator action is mediated by nitric oxide (NO) in a bradykinin-dependent or independent manner (Figure 29-39). Vasodilation mediated by AT2 receptors has been shown in microarteries of the coronary, mesenteric, and uterine circulation. In addition, continuous use of compounds that stimulate AT2 receptor (agonists) cause sustained vasodilation and hypotension. Therapeutically, these data predict that AT2 receptor stimulation would be a beneficial addition to AT1 receptor blockage in the treatment of hypertension.
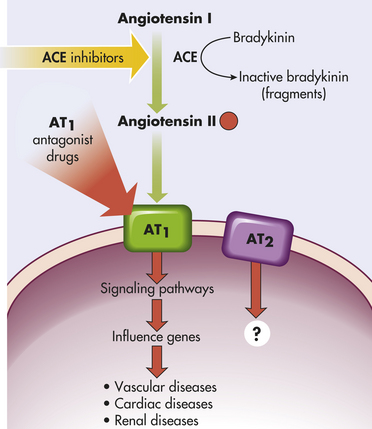
Figure 29-39 Angiotensins and their receptors, AT1 and AT2. Blocking the angiotensin-converting enzyme (ACE) with ACE inhibitors decreases the amount of angiotensin II. Blocking the receptor AT1 with drugs (AT1 antagonists) blocks the attachment of angiotensin II to the cell preventing the cellular effects and decreasing the vascular, cardiac, and renal effects.
Ang II is now considered to be a growth promoter in cardiovascular tissues, and the resultant vascular hypertrophy is a significant factor in the pathogenesis of hypertension. Chronically elevated levels of Ang II in the heart, like that seen in hypertension, contribute to myocardial hypertrophy and heart failure (see Chapter 30). Ang II plays a role in the kidney, not only as a regulator of blood flow but also in the development of structural changes and proteinuria. Therefore treatments, such as ACE inhibitors and angiotensin receptor (ATR) antagonists that inhibit mostly AT1 receptors are a main target in preventive and reparative strategies in cardiovascular diseases.
Aldosterone is released by the adrenal cortex in response to Ang II. It causes reabsorption of sodium and water in the kidneys. Aldosterone plays an important role in the pathogenesis of cardiovascular and renal disease. Aldosterone has a number of deleterious effects, including myocardial necrosis and fibrosis, vascular stiffening and injury, reduced fibrinolyses, endothelial dysfunction, catecholamine release, and promotion of dysrhythmias. These effects are caused by aldosterone, itself, and are independent of Ang II. Some mechanisms of aldosterone-induced cardiovascular dysfunction include activation of phospholipase C-mediated vasoconstriction, activation of the cyclooxygenase 2 pathway of inflammation, increased production of toxic oxygen radicals, and stimulation of smooth muscle cell proliferation.30
The natriuretic peptides include ANP, brain natriuretic peptide, C-type natriuretic peptide (CNP), and urodilatin.31 These peptides help regulate urinary sodium excretion (natriuresis), diuresis, vasodilation, and antagonism of the renin-angiotensin system. All of these effects lead to the formation of a large volume of dilute urine that decreases blood volume and blood pressure. Atrial natriuretic peptide (ANP) (or factor) is a peptide secreted from cells (monocytes) in the right atrium when right atrial blood pressure increases. In addition, under pathologic conditions, the left ventricle may secrete ANP. ANP causes increased urine sodium excretion, leading to decreased blood volume and blood pressure.32 Brain natriuretic peptide (BNP) was originally isolated from paracrine brain and named brain natriuretic peptide. The name is misleading, however, because BNP is mostly synthesized, stored, and secreted from cardiac cells (i.e., atria). BNP also contributes to urinary sodium excretion and is used both as a marker and as a treatment for acute heart failure.33 C-type natriuretic peptide (CNP) is widely expressed
throughout the vasculature and is found in very high concentrations in the endothelium.34 Recent findings suggest that CNP complements NO and prostacyclin as mediators of vasodilation. Urodilatin is a natriuretic peptide synthesized in kidney tubular cells and is secreted into the kidney tubules. The function of urodilatin and the renal urodilation system is as a paracrine intrarenal regulator for Na+ and water balance and sodium excretion.
Abnormal natriuretic peptide production and activity have been associated with several cardiovascular disorders, including hypertension and heart failure, and interventions that selectively target or enhance these peptides have considerable therapeutic benefit.35 There is emerging evidence that these peptides have important roles outside of the cardiovascular system as well (see What’s New? New Insights into the Natriuretic Peptides).
Adrenomedullin (ADM) is a recently discovered, widely dispersed peptide present in numerous tissues with powerful vasodilatory activity. Originally isolated from human pheochromocytoma (tumor of the adrenal medulla), it is now known to be present in cardiovascular, pulmonary, renal, gastrointestinal, cerebral, and endocrine tissues. It is synthesized and secreted from vascular endothelial and smooth muscle cells. Adrenomedullin mediates vasodilatory and natriuretic properties through the second messenger cyclic adenosine monophosphate (cAMP), NO, and the renal prostaglandin system. ADM acts as a local autocrine or paracrine vasoactive hormone and is increased in the plasma in various cardiorenal diseases such as hypertension, chronic renal failure, and congestive heart failure. Overall, ADM appears to play an important role in fluid and electrolyte balance and cardiorenal regulation. Recent studies in rats with myocardial infarction where ADM was administered revealed decreased left ventricle remodeling and heart failure.
ADM plays an important role in vascular protection by decreasing oxidative stress, limiting endothelial injury, causing vasodilation, and promoting angiogenesis.36,37 Other
functions of ADM include neurotransmission; growth hormone secretion regulation; down-regulation of proinflammatory cytokines, such as tumor necrosis factor-alpha (TNF-α); and modulation of anticoagulant properties. Therefore, changes in ADM levels have been correlated with several diseases including cardiovascular and renal disorders, sepsis, cancer, and diabetes.
Insulin has direct vascular actions that contribute to vascular protection and injury. The vascular protection and injury properties are summarized in Box 29-2.
Venous Pressure
The main determinants of venous blood pressure are (1) the volume of fluid within the veins and (2) the compliance (distensibility) of the vessel walls. Veins have much thinner walls than arteries and are more distensible than arteries. The venous system accommodates approximately 60% of the total blood volume at any given moment, with venous pressure averaging less than 10 mmHg. Conversely, the arteries accommodate about 15% of the total blood volume, with an average arterial pressure (blood pressure) of about 100 mmHg.
The sympathetic nervous system controls compliance. The walls of the veins are highly innervated by sympathetic fibers that when stimulated cause venous smooth muscle to contract. This increases smooth muscle tone rather than causing vasoconstriction, as occurs in arterial vessels. The effect of increased smooth muscle tone is to stiffen the wall of the vein, which reduces distensibility and increases venous blood pressure, forcing more blood through the veins and into the right heart.
Two other mechanisms that increase venous pressure and venous return to the heart are (1) the skeletal muscle pump and (2) the respiratory pump. During skeletal muscle contraction the veins within the muscles are partially compressed, causing a decrease in venous capacity and increased return to the heart. The respiratory pump acts during inspiration, when the veins of the abdomen are partially compressed by the downward movement of the diaphragm. Increased abdominal pressure moves blood toward the heart.
Regulation of Coronary Circulation
Flow of blood (F) in the coronary circulation, as in vascular beds, is directly proportional to the perfusion pressure (P) and inversely proportional to the vascular resistance (R) of the bed (F = P/R). Coronary perfusion pressure is the difference between pressure in the aorta and pressure in the coronary vessels. Aortic pressure is the driving pressure that perfuses vessels of the myocardium. Mechanisms of vasodilation and vasoconstriction normally maintain coronary blood flow despite stresses imposed by the constant contraction and relaxation of the heart muscle and despite shifts (within a physiologic range) of coronary perfusion pressure.
Several anatomic factors influence coronary blood flow. Because of their location, the aortic valve cusps obstruct coronary blood flow by pushing against the openings of the coronary arteries during systole. Also during systole, the coronary arteries are compressed by ventricular contraction. These anatomic factors have a systolic compressive effect, which is particularly evident in the subendocardial layers of the left ventricular wall and can greatly increase resistance to coronary blood flow.1 Therefore, most coronary blood flow in the left ventricle occurs during diastole. During the period of systolic compression, when flow is slowed or stopped, oxygen is supplied by myoglobin, a protein that is present in heart muscle that binds oxygen during diastole and then releases it when blood levels of oxygen fall during systole.
Autoregulation
Autoregulation (automatic self-regulation) enables individual vessels to regulate blood flow by altering their own arteriolar resistances. Autoregulation in the coronary circulation maintains constant blood flow at perfusion pressures (mean arterial pressure) between 60 and 180 mmHg when other influencing factors are held constant. Thus autoregulation ensures constant coronary blood flow despite shifts in the perfusion pressure within the stated range.
The mechanism of autoregulation is not known, but two explanations have been proposed: the myogenic hypothesis and the metabolic hypothesis. The myogenic hypothesis proposes that autoregulation originates in vascular smooth muscle, presumably of the arterioles, as a response to changes in arterial perfusion pressure. Increased coronary perfusion pressure increases the pressure against the vessel wall and the stretch increases the vessel’s radius, resulting in an increase in wall tension. Initially, coronary blood flow increases with the abrupt distention of the blood vessels. The stretching eventually stimulates contraction of the smooth muscles, which increases vascular resistance. The return of more normal flow follows constriction of the arterioles. Because stretch of vascular smooth muscle increases intracellular Ca++, it is proposed that an increase in transmural pressure activates membrane calcium channels.1 This mechanism also works in the opposite direction; that is, vasodilation is stimulated by decreased arterial pressure.
The metabolic hypothesis of autoregulation, which is better documented, proposes that autoregulation of coronary vessels originates in the myocardium. The stimulus is a drop in coronary perfusion pressure or an increase in the metabolic needs of the myocardium (e.g., because of strenuous exercise). With an increased myocardial oxygen requirement, myocardial cells release substances that promote vasodilation. Substances implicated include CO2, hydrogen ions (lactic acid), potassium ions, and adenosine. The best known of these substances is adenosine, a potent vasodilator released in response to a decrease in myocardial oxygenation.1 An increased concentration of adenosine in the interstitial fluid decreases the resistance of the coronary arterioles and increases blood flow. Perfusion strongly correlates with the amount of adenosine released. When coronary perfusion pressure is increased, the increased flow washes out the vasodilatory substances. As the dilators are washed out, vasoconstriction occurs and returns flow toward normal.
Autonomic Regulation
As described, stimulation of the sympathetic nerves to the heart causes a marked increase in coronary blood flow, even though it also causes vasoconstriction of the coronary vessels. The increased coronary flow is caused by the increase in myocardial metabolism created by the sympathetic stimulation of the heart rate and contractility. The release of vasodilatory metabolites, such as adenosine, from the increased myocardial activity tends to overwhelm the coronary vasoconstriction. Thus metabolic autoregulation overrides neurogenic influences, and the net effect of sympathetic stimulation is to increase coronary blood flow.1
LYMPHATIC SYSTEM
The lymphatic system is a special vascular system that picks up excess tissue fluid and returns it to the bloodstream. Normally, fluid is forced out of the blood at the arterial end of the capillary bed and is reabsorbed into the bloodstream at the venous end (Figure 29-40), yet capillary outflow exceeds venous reabsorption by about 3 L/day so some fluid lags behind in the interstitium. To maintain sufficient blood volume in the cardiovascular system, this fluid must eventually rejoin the bloodstream, which is the function of the lymphatic system.

Figure 29-40 Role of the lymphatic system in fluid balance. Fluid from plasma flowing through the capillaries moves into interstitial spaces. Although much of this interstitial fluid is either absorbed by tissue cells or reabsorbed by capillaries, some of the fluid tends to accumulate in the interstitial spaces. As this fluid builds up, it tends to drain into lymphatic vessels that eventually return the fluid to the venous blood. (From Thibodeau GA, Patton KT: Anatomy & physiology, ed 5, St Louis, 2003, Mosby.)
The lymphatic system consists of lymphatic vessels and the lymph nodes (Figure 29-41). (Lymph nodes and lymphoid tissues are described in Chapters 7 and 25.) In this pumpless system a series of valves ensures one-way flow of the excess interstitial fluid (then called lymph) toward the heart. The lymphatic capillaries are closed at the ends (Figure 29-42).
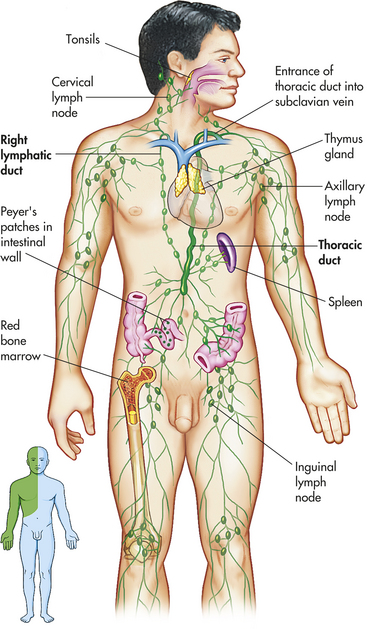
Figure 29-41 Principal organs of the lymphatic system. The inset shows the areas drained by the right lymphatic duct (green) and the thoracic duct (blue). (From Thibodeau GA, Patton KT: Anatomy & physiology, ed 5, St. Louis, 2003, Mosby.)
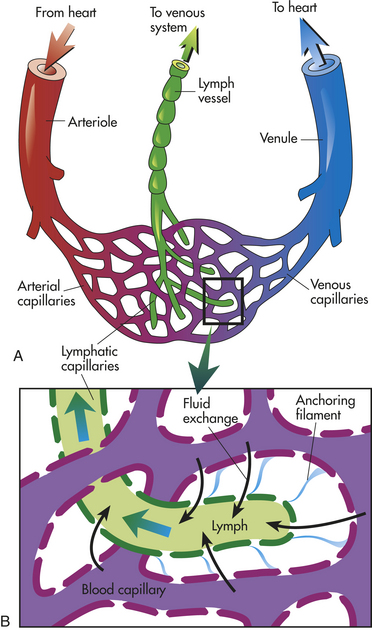
Figure 29-42 Lymphatic capillaries. A, Schematic representation of lymphatic capillaries. B, Anatomic components of microcirculation.
Lymph consists primarily of water and small amounts of dissolved proteins, mostly albumin, which are too large to be reabsorbed into the less permeable blood capillaries. Once within the lymphatic system, lymph travels successively through larger and larger vessels called lymphatic venules and lymphatic veins. The lymphatic vessels run in the same sheaths with the arteries and veins and eventually drain into one of two large ducts in the thorax—the right lymphatic duct and the thoracic duct. The right lymphatic duct drains lymph from the right arm and the right side of the head and thorax, whereas the larger thoracic duct receives lymph from the rest of the body (see Figure 29-41). The right lymphatic duct and the thoracic duct drain lymph into the right and left subclavian veins, respectively.
The lymphatic veins are thin walled, like the veins of the cardiovascular system. In the larger lymphatic veins, endothelial flaps form valves similar to those in the circulatory veins (see Figure 29-26). The valves permit lymph to flow in only one direction because lymphatic vessels are compressed intermittently by contraction of skeletal muscles, pulsatile expansion of an artery in the same sheath, and contraction of the smooth muscles in the walls of the lymphatic vessel.
As lymph is transported toward the heart, it is filtered through thousands of bean-shaped lymph nodes clustered along the lymphatic vessels (see Figure 29-41). Lymph enters the node through several afferent lymphatic vessels, filters through the sinuses in the node, and leaves by way of efferent lymphatic vessels. Lymph flows slowly through the node, which facilitates the phagocytosis of foreign substances within the node and prevents them from reentering the bloodstream. (Phagocytosis is described in Chapter 6.)
TESTS OF CARDIOVASCULAR FUNCTION
The general approach to the individual with suspected cardiovascular disorders begins with a thorough history for risk factors and symptoms. This is followed by a careful physical examination looking for evidence of tissue ischemia, pulmonary congestion, and cardiac dysfunction. Nonspecific and specific serum laboratories are usually obtained. For many individuals, these basic steps will be complemented by the use of sophisticated methods to measure heart and vascular function. Cardiac function can be evaluated using indicators calculated from pressures and flow rates in the heart and vessels. Table 29-4 defines the indicators most often used in the clinical setting.
Table 29-4
Indicators of Cardiac Function
| Indicator | Definition∗ | Common Cause of Abnormality |
| Heart rate (HR) | Number of heartbeats (cardiac cycles) per min | Ischemia, electrolyte disturbances, drug toxicity |
| Normal adult value: 70 beats/min | ||
| Cardiac output (CO) | Amount of blood (in liters) moved by the heart in 1 min | Decrease indicates heart failure |
| Normal range: 4-8 L/min | Increase indicates decreased systemic vascular resistance, common in sepsis | |
| Cardiac index (CI) | Relationship between cardiac output and body surface area (BSA, in square meters) | Decrease indicates heart failure |
| Normal range: 2.8-4.2 L/min/m2 | Increase indicates decreased systemic vascular resistance, common in sepsis | |
| Stroke volume (SV) | Amount of blood (in milliliters) ejected by the left ventricle during systole (i.e., per beat) | Decrease indicates heart failure |
| Stroke volume index (SVI) | Relationship between stroke volume and body surface area | Decrease indicates heart failure |
| Normal range: 33-47 ml/beat/m2 | Increase indicates deceased systemic vascular resistance, common in sepsis | |
| Oxygen consumption index (V•O2) | Amount of oxygen (in milliliters) consumed per minute in relation to BSA | Decrease: sedation, anesthesia, hypothermiaIncrease: elevated temperature, sepsis, seizures |
| Stroke work index (SWI) | Amount of work (expressed as done) by the left or right ventricle per systole per square meter of BSA | Decreases within specific ranges indicate cardiogenic or hypovolemic shock (see Chapter 46) |
| Normal value: 35 g/m2 | Increase: elevated systemic vascular resistance | |
| Systemic mean arterial pressure (MAP) | Mean blood pressure (in millimeters of mercury) in the systemic arteries | Elevated: epinephrine release, diseases of arteries, primary hypertension |
| Normal range: 70-100 mmHg | Decreased: cardiac failure, decreased vascular resistance of sepsis | |
| Pulmonary vascular resistance (PVR) | Relationship among cardiac output, preload, and afterload, expressed as units of force of resistance per second per centimeter of water | Increased: acute respiratory distress syndrome (ARDS), pneumonia, primary pulmonary hypertension, congestive heart failure |
| Normal value: less than 250 dynes/sec/cm−5 | Decreased: late shock | |
| Systemic vascular resistance (SVR) | Same definition as for PVR | Increased: epinephrine release |
| Normal range: 770-1500 dynes/sec/cm−5 | Decreased: inflammatory response |
Cardiac and Coronary Artery Evaluation
Many sophisticated tests can be obtained to evaluate individuals for cardiac or coronary artery disease, and new ones are being tested each year. Some of the more commonly used modalities include electrocardiography, chest x-ray, stress testing, echocardiography, computed tomography (CT) and magnetic resonance imaging (MRI), technetium scanning, electrophysiology, and catheterization with angiography.
Cardiography
Electrocardiography, typically the 12-lead electrocardiogram (ECG), gives information about heart rate and rhythm, the effects of electrolytes or drugs on the heart, and the electrical orientation of the cardiac muscle. An ECG gives no direct information about the contractile state or mechanical performance of the heart.
Serial 12-lead ECGs are of primary importance in establishing the presence of myocardial ischemia and infarction or conduction defects and dysrhythmias. This examination has become part of the routine hospital admission assessment, even when the admitting diagnosis is not cardiac in nature, because it establishes baseline information about the electrical function of the heart. Also recent ECGs can be compared with ECGs obtained from the same individual in the past. Changes in the ECG over time assist in determining the cause, amount, or nature of changes in cardiac anatomy and physiology.
Chest Radiograph Examination
Chest x-rays allow for the examination of the size and contour of the heart and related structures. Evidence of chamber enlargement, pericardial disease, pulmonary edema, valvular calcification, and pathology of the great vessels may be visualized. Chest x-ray is also useful to look for appropriate placement of invasive cardiac devices and for any complications thereof (e.g., pneumothorax or hemothorax; see Chapter 33). A chest x-ray examination is a routine part of a cardiac examination. The most commonly obtained views are posteroanterior (PA) and lateral, with the individual standing upright and the lungs fully expanded. In those individuals confined to bed, an anteroposterior (AP) view may be obtained but is usually of lesser quality than the PA.
Stress Testing
Cardiac activity during exercise is examined during a stress test. Stress testing elicits signs and symptoms of heart disease and coronary artery disease that may not appear at rest. Continuous 12-lead ECG and blood pressure measurement are obtained before, during, and after the study. Cardiac stress from exercise is induced by having the individual walk on a treadmill. Other, less frequently used forms of exercise include static exercise (hand ergometry or chemical stress), stair climbing (the Stairmaster’s double two-step), arm ergometry, and bicycle ergometry. The individual exercises until the maximal heart rate for gender and age is reached or until other subjective or objective indicators of cardiac dysfunction or distress appear. Subjective indicators include chest pain, extreme fatigue, extreme dyspnea, leg pain, or the individual’s request to stop the test. Objective criteria are ST segment elevation or depression, SA node or atrial dysrhythmias, AV node dysrhythmias, ventricular dysrhythmias, elevated or decreased blood pressure, signs of cerebral hypoxia, and signs of circulatory insufficiency.
A stress test is useful also in determining the rate or progress of recovery from a myocardial infarction or cardiac surgery. Graded exercise in individuals with low- to moderate-risk chest pain evaluated in an emergency department can be used as a prognostic indicator of adverse cardiac events. When a differential diagnosis for chest pain has been difficult to determine, stress testing may help distinguish coronary artery insufficiency from other causes of pain. There is some risk associated with stress testing. The risk is greater when the test is performed soon after an acute ischemic event.
Stress testing with ECG monitoring may not be sensitive enough to detect and localize areas of the myocardium at risk for ischemia and infarction. Currently, most stress testing includes the injection of a radiotracer that is taken up by active heart cells. When the heart is scanned, during and after stress testing, areas where the radiotracer is not taken up by ischemic cells can be seen and therefore localizes areas of myocardial damage and risk.
Single-Photon Emission Computed Tomography
Single-photon emission computed tomography (SPECT) is the most commonly used tool for evaluating individuals for coronary artery disease and myocardial ischemia during stress testing. A radiotracer (usually thalium-201) is injected intravenously and is taken up by healthy myocytes and retained for some period of time.38 Photons are emitted from the myocardium in proportion to perfusion of the tissue. A gamma camera visualizes the photons, and views are taken from 360 degrees by CT, which digitizes the information and provides a three-dimensional view. Data about where the myocardium take up the tracer normally, slowly, or not at all can be correlated with existing myocardial disease and can help quantify ischemic risk.
Echocardiography
Echocardiography is the most effective noninvasive modality for evaluating the structures of the heart. Ultrasound beams reflected by cardiovascular structures produce shapes that can be visualized and allow for recognition of altered cardiac anatomy.38 It is used to evaluate for suspected heart failure, valvular disease, infective endocarditis, cardiomyopathies, pericardial disease, and congenital heart disease. Through the use of two-dimensional techniques with Doppler and color flow imaging, accurate assessments of cardiac output, ejection fraction, and valvular function can be obtained.
Computed Tomography and Magnetic Resonance Imaging
Initially, CT and MRI had limited roles in the evaluation of heart disease because they required structures to be still in order to provide clear images. New techniques, including ECG gating (timing of gathering the data to the cardiac cycle), have greatly expanded the use of these two modalities38 that can evaluate cardiac anatomy and physiology. Improvements such as electron beam CT and spiral CT have improved the ability of tomography to visualize cardiac structures. The high resolution of CT can provide information about calcification of coronary vessels and cardiac valves. It is also an essential tool for evaluating large-vessel disease.
MRI is based on the principle that the frequency of energy (resonant frequency) given up by a nucleus is exactly proportional to the surrounding magnetic field38 (see Chapter 14). Anatomy and physiology of the great blood vessels and myocardium are depicted in three dimensions with excellent resolution. Ventricular function can be evaluated using indices of ventricular function, such as ejection fraction. Rapidly moving sequences (MRI) can determine regional wall motion and myocardial deformation. Flow direction and velocity also can be quantitatively determined.
Technetium Scanning
Technetium pyrophosphate (99mTcPYP) is injected intravenously into a resting individual during a “hot spot” imaging examination. Two hours after injection the distribution pattern of the radioactive solution is recorded by nuclear scan. During the 2-hour delay, the injected material will have been taken up by infarcted areas of the myocardium, particularly 1 to 3 days after the onset of symptoms. This study is not definitive during the first 12 hours after an infarct.
Technetium scanning is used when (1) there is a conflicting history for myocardial infarction, (2) there are equivocal ECG abnormalities, or (3) an individual’s cardiac enzymes have been elevated because of surgery or trauma. Such small amounts of the injected material are used in this examination that the risks associated with radioactive substances are not an issue.
Electrophysiology Studies
In-depth evaluation of electrical conduction within the heart can provide important information about the nature and causes of dysrhythmias, such as atrial and ventricular tachycardias and heart block. There are many types of electrophysiology studies that are specific to certain conduction disorders but they have the common goal of documenting abnormal conduction pathways. Furthermore, the techniques used may also allow for ablation of unwanted pathways or the appropriate placement of stimulating devices (pacers).
One example of an electrophysiology study is AV bundle electrocardiography. Two electrode-tipped catheters are inserted percutaneously into the femoral vein, floated up the inferior vena cava, and positioned in or near the right atrium during AV bundle (His bundle) electrocardiography. AV bundle electrocardiography can detect secondary sites of impulse generation (ectopic foci), as well as accessory pathways of conduction. Other conduction defects and the effects of drugs on conduction also can be illuminated. Risks related to this procedure can be grave and include dysrhythmias, death, vessel or heart perforation, clot or plaque embolization, and kidney failure.
Cardiac Catheterization and Angiography
One or both sides of the heart can be examined using cardiac catheterization. This procedure requires the use of fluoroscopy and strict sterile techniques and takes place in a specially equipped catheterization laboratory. Local anesthesia is given, and a catheter is introduced percutaneously into the vasculature and passed caudally into the atrium and ventricle. For a right-heart catheterization, the catheter is placed in the jugular, subclavian, brachial, or femoral vein. The femoral artery is commonly used for a left-heart study. Once the catheter has been guided into the atrium, pressures are recorded, blood samples are obtained to examine oxygen content, and a contrast medium is injected to visualize chamber function and valve patency. The catheter is then passed into the ventricles and the sequence is repeated.
Cardiac catheterization provides a means to visualize the chambers of the heart continuously, although for a short time. A great deal of information can be obtained about heart structure and function. Pressures in each chamber and across heart valves can be precisely measured, along with timing of events in the cardiac cycle. Of particular value is the ability to compare the oxygen content of blood in each heart chamber. Risks for this procedure have decreased over time. One of the most serious complications of cardiac catheterization is the development of dysrhythmias. Death usually is caused by cardiac arrest after ventricular fibrillation.
Fluoroscopic visualization of the coronary arteries and left-heart structures using contrast dye is called coronary angiography or arteriography. Like cardiac catheterization, this study takes place in a catheterization laboratory using local anesthesia and a sterile field. A catheter is threaded into the left ventricle through the femoral artery. A ventriculogram generally is performed first. Contrast dye is injected into the apex of the ventricle, and the next few cardiac cycles are visualized and filmed. Like cardiac catheterization, coronary angiography is used to gain information about the structure and function of the ventricles and related valves. After the ventriculogram, catheters are introduced individually into the ostia of the coronary arteries. When the catheter is in position, 5 to 10 ml of contrast dye is mechanically and rapidly injected into the artery and the results are visualized and filmed. Dye injection is repeated with the individual tilted at various angles to afford views of the artery other than the anteroposterior view. The catheter is then either moved to the next artery to be studied or withdrawn to conclude the study.
The risks of this procedure are similar to those of cardiac catheterization, with exceptions. Because the blood supply to the cardiac muscle is briefly interrupted when dye is introduced into the coronary arteries, angina (chest pain) caused by ischemia (lack of oxygen) is much more common. Coronary artery spasms also can occur. Interrupted flow also causes decreased heart rate (bradycardia), as well as some tachydysrhythmias, hypotension, and ST segment depression.
Systemic Vascular Evaluation
The systemic vascular system can be studied by a variety of techniques in order to evaluate for adequate flow rates, vascular obstruction, and structural defects. These techniques include pulse tracing, Doppler ultrasonography, CT and MRI, venography, and arteriography.
Pulse Tracing
Pulsation, described by the flow of blood through an artery during the cardiac cycle, can be drawn as a waveform plotting pressure against time (Figure 29-43). The waveform can be obtained noninvasively by placing a transducer on the skin over the carotid artery while the individual’s head is turned slightly away from the transducer. The amplitude and shape of arterial waveforms can provide information about arterial stiffening and adequacy of perfusion.
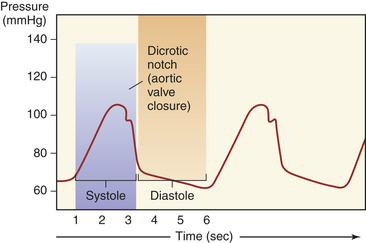
Doppler Ultrasonography Studies
A Doppler study is made by using a handheld microphone placed on the skin over a lubricating gel. The microphone amplifies and can record sounds made by blood flowing in peripheral vessels. The Doppler microphone is placed over the vessel to be studied, and sounds related to obstructions to flow, vessel wall mobility, and heart murmurs are transmitted through the gel to the microphone. The microphone amplifies sound waves so that they are audible to the human ear. Ultrasound techniques can be used to digitize the audio findings into visual findings that can be analyzed for flow velocity and volume. These studies are useful in the evaluation for abnormalities of venous flow (e.g., deep venous thrombosis) and arterial flow (e.g., embolism).
Computed Tomography and Magnetic Resonance Imaging
CT and MRI, used to evaluate the systemic circulation, provide information about the structure of the great vessels. Either can be used to evaluate for aneurysms and dissections of the thoracic or abdominal aorta. CT also can be used to assess for vessel calcification and provide some insights into the risk for stroke and myocardial infarction through evaluation of the carotid and coronary vessels.
Venography and Arteriography
Radiopaque dye can be injected through intravenous or intra-arterial catheters to allow for visualization of the internal structure, diameter, and patency of veins and arteries. Venography is performed primarily in the lower extremity to assess for the presence of thrombi in the large veins of the leg. Arteriography (angiography) can be used in almost any vascular system, including the great vessels, pulmonary, coronary (see previously in this chapter), cerebral, mesenteric, renal, hepatic, and peripheral arteries. Risks include rupture, dissection, thrombosis, embolization, or organ infarction involving the arterial system being studied.
Aging and the Cardiovascular System
Cardiovascular disease is the most common cause of hospitalization and death in older adults in Western society. The most common cardiovascular pathologic condition is hypertension followed by coronary atherosclerosis. It is difficult to describe normal physiologic changes in cardiac function with aging because many pathologic changes are usually present as well. Studies of the effect of age on cardiovascular function must be rigorous in their distinction between persons who are free of disease and those who have disease that may be evident only during stress testing. A consistent finding is the large variation in the older population for nearly every cardiovascular variable. These variations are in part the result of a sharp increase in the prevalence of hypertension and coronary disease with advancing age and in part the result of major age-associated changes in lifestyle (e.g., fitness status). The most relevant age-associated changes in cardiovascular performance are myocardial and blood vessel stiffening, changes in neurogenic control over vascular tone, and left ventricular hypertrophy and fibrosis.39,40 These changes pose considerable consequences with increased demand for flow, changes in posture, or with disease.
Arterial stiffening occurs with aging even in the absence of clinical hypertension. It can, however, be an important contributor to systolic hypertension and its associated risks for cardiovascular events, dementia, and death. These changes result from alterations within the vascular media, including age-associated changes in cross-linking of collagen, an increase in the amount of collagen, and changes in the nature of elastin, and extracellular matrix, inflammatory molecules, endothelial cell function, and reactive oxygen species.39 Other influences include glucose regulation, chronic renal disease, salt, and changes in neurohormonal (e.g., renin-angiotensin-aldosterone) regulation.39 The increased arterial stiffness may not be related strictly to an age-associated change in vascular structure but may be caused by changes in baroreceptor activity. Baroreceptor activity may decrease with age, slowing physiologic adjustment to changes in blood pressure, and posture. The autonomic nervous system also is affected by the aging process, including changes in catecholamine receptor sensitivity.
Left ventricular hypertrophy and fibrosis also are more common in the aging population, even when controlled for hypertension. In the aging heart, disruption of growth factor function and an imbalance in collagen synthesis and degradation result in cardiac dysfunction and increased risk for heart failure.40
Stress testing is used to uncover changes in functional capacity that are not apparent at rest. In contrast to the subtle age effects on resting cardiac tests, more dramatic changes occur during exercise. Table 29-5 summarizes age-associated changes at rest and during exercise. Overall, long-term exercise conditioning in older individuals increases aerobic capacity and decreases arterial stiffness and left ventricular function. Cardiovascular diseases often can be prevented in older adults. A recent article indicates that although age plays a role in cardiovascular disease, much of the high prevalence of heart disease in older individuals is because of their lifelong exposure to traditional risk factors such as hypertension, diabetes, and dyslipidemia.41 Although the risks and benefits of pharmacologic and invasive strategies must always be assessed carefully, many older adults can live longer and healthier lives if appropriate preventive and treatment regimens are offered, even quite late in life.
SUMMARY REVIEW
Table 29-5
Cardiovascular Function in Older Adults
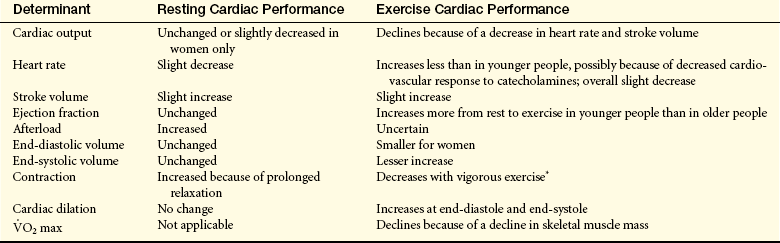
∗As measured by end-systolic volume/systolic blood pressure (ESV/SBP), an index of contractility.
Data from Gerstenblith G, Lakatta EG: Aging and the cardiovascular system. In Willerson JT, Cohn JN, editors: Cardiovascular medicine, New York, 1995, Churchill Livingstone.
1. The circulatory system is the body’s transport system. It delivers oxygen, nutrients, metabolites, hormones, neurochemicals, proteins, and blood cells throughout the body and carries metabolic wastes to the kidneys and lungs for excretion.
2. The circulatory system consists of the heart and blood vessels and is made up of two separate, serially connected systems: the pulmonary circulation and the systemic circulation.
3. The pulmonary circulation is driven by the right side of the heart. The function of the pulmonary circulation is to deliver blood to the lungs for oxygenation.
4. The systemic circulation is driven by the left side of the heart, and its function is to move oxygenated blood throughout the body.
5. The lymphatic vessels collect fluids from the interstitium and return the fluids to the circulatory system.
1. The heart consists of four chambers (two atria and two ventricles), four valves (two AV valves and two semilunar valves), a muscular wall, a fibrous skeleton, a conduction system, nerve fibers, systemic vessels (the coronary circulation), and openings where the great vessels enter the atria and ventricles.
2. The heart wall, which encloses the heart and divides it into chambers, is made up of three layers: the pericardium (outer layer), the myocardium (muscular layer), and the endocardium (inner lining).
3. The myocardial layer of the two atria, which receive blood entering the heart, is thinner than the myocardial layer of the ventricles, which must be stronger to squeeze blood out of the heart.
4. The right and left sides of the heart are separated by portions of the heart wall called the interatrial septum and the interventricular septum.
5. Unoxygenated (venous) blood from the systemic circulation enters the right atrium through the superior and inferior venae cavae. From the atrium the blood passes through the right AV (tricuspid) valve into the right ventricle. In the ventricle the blood flows from the inflow tract to the outflow tract and then through the pulmonic semilunar valve (pulmonary valve) into the pulmonary artery, which delivers it to the lungs for oxygenation.
6. Oxygenated blood from the lungs enters the left atrium through the four pulmonary veins (two from the left lung and two from the right lung). From the left atrium the blood passes through the left AV valve (mitral valve) into the left ventricle. In the ventricle the blood flows from the inflow tract to the outflow tract and then through the aortic semilunar valve (aortic valve) into the aorta, which delivers it to systemic arteries of the entire body.
7. The heart valves ensure the one-way flow of blood from atrium to ventricle and from ventricle to artery.
8. Oxygenated blood enters the coronary arteries through an opening in the aorta, and unoxygenated blood from the coronary veins enters the right atrium through the coronary sinus.
9. The pumping action of the heart consists of two phases: diastole, during which the myocardium relaxes and the chambers fill with blood; and systole, during which the myocardium contracts, forcing blood out of the ventricles. A cardiac cycle consists of one systolic contraction and the diastolic relaxation that follows it. Each cardiac cycle makes up one heartbeat.
10. The conduction system of the heart generates and transmits electrical impulses (cardiac action potentials) that stimulate systolic contractions. The autonomic nerves (sympathetic and parasympathetic fibers) can adjust heart rate and systolic force, but they do not stimulate the heart to beat.
11. The normal ECG is the sum of all action potentials. The P wave represents atrial depolarization; the QRS complex is the sum of all ventricular cell depolarizations. The ST interval occurs when the entire ventricular myocardium is depolarized.
12. Cardiac action potentials are generated by the SA node at the rate of about 75 impulses per minute. The impulses can travel through the conduction system of the heart, stimulating myocardial contraction as they go.
13. Cells of the cardiac conduction system possess the properties of automaticity and rhythmicity. Automatic cells return to threshold and depolarize rhythmically without outside stimulus. The cells of the SA node depolarize faster than other automatic cells, making it the natural pacemaker of the heart. If the SA node is disabled, the next fastest pacemaker, the AV node, takes over.
14. Each cardiac action potential travels from the SA node to the AV node to the bundle of His (AV bundle), through the bundle branches, and finally to the Purkinje fibers. There the impulse is stopped. It is prevented from reversing its path by the refractory period of cells that have just been polarized. The refractory period ensures that diastole (relaxation) will occur, thereby completing the cardiac cycle.
15. Adrenergic receptor number, type, and function govern autonomic (sympathetic) regulation of heart rate, contractile force, and dilation or constriction of coronary arteries. The presence of specific receptors (α1, α2, β1, β2) in the myocardium and coronary vessels determines the effects of the neurotransmitters norepinephrine and epinephrine.
16. Unique features that distinguish myocardial cells from skeletal cells enable myocardial cells to transmit action potentials faster (through intercalated disks), synthesize more ATP (because of a large number of mitochondria), and have readier access to ions in the interstitium (because of an abundance of transverse tubules). These combined differences enable the myocardium to work constantly, which skeletal muscle is not required to do.
17. Cross-bridges between actin and myosin enable contraction to occur. Calcium and its interaction with the troponin complex facilitate the contraction process. With troponin release of calcium, myocardial relaxation begins.
18. Cardiac performance is affected by preload, afterload, heart rate, and myocardial contractility.
19. Preload, or pressure generated in the ventricles at the end of diastole, depends on the amount of blood in the ventricle. Afterload is the resistance to ejection of the blood from the ventricle. Afterload depends on pressure in the aorta.
20. Heart rate is determined by the SA node and by components of the autonomic nervous system, including cardiovascular control centers in the brain, neuroreceptors in the atria and aorta, hormones, and catecholamines (epinephrine and norepinephrine).
21. Contractility is the potential for myocardial fiber shortening during systole. It is determined by the amount of stretch during diastole (i.e., preload) and by sympathetic stimulation of the ventricles.
22. The Frank-Starling law of the heart states that the myocardial stretch determines the force of myocardial contraction (the greater the stretch, the stronger the contraction).
23. Laplace’s law states that the amount of contractile force generated within a chamber depends on the radius of the chamber and the thickness of its wall (the smaller the radius and the thicker the wall, the greater the force of contraction).
1. Blood flows from the left ventricle into the aorta and from the aorta into arteries that eventually branch into arterioles and capillaries, the smallest of the arterial vessels. Oxygen, nutrients, and other substances needed for cellular metabolism pass from the capillaries into the interstitium, where they are available for uptake by the cells. Capillaries also absorb products of cellular metabolism from the interstitium.
2. Venules, the smallest veins, receive capillary blood. From the venules the venous blood flows into larger and larger veins until it reaches the venae cavae, through which it enters the right atrium.
3. Vessel walls consist of three layers: the tunica intima (inner layer), the tunica media (middle layer), and the tunica externa (outer layer).
4. Layers of the vessel wall differ in thickness and composition from vessel to vessel, depending on the vessel’s size and location within the circulatory system. In general, the tunica media of arteries close to the heart contains a greater proportion of elastic fibers because these arteries must be able to distend during systole and recoil during diastole. Distributing arteries farther from the heart contain a greater proportion of smooth muscle fibers because these arteries must be able to constrict and dilate to control blood pressure and volume within specific capillary beds.
5. Blood flow into the capillary beds is controlled by the contraction and relaxation of smooth muscle bands (precapillary sphincters) at junctions between metarterioles and capillaries. The endothelium is probably a source of prostaglandins that control vasomotion.
6. Blood flow through the veins is assisted by the contraction of skeletal muscles (the muscle pump), and backflow in the lower body is prevented by one-way valves, particularly in the deep veins of the legs.
7. Blood flow is affected by blood pressure; resistance to flow within the vessels; blood consistency (which affects velocity); anatomic features that may cause turbulent or laminar flow; and compliance (distensibility) of the vessels.
8. Poiseuille’s law describes the relationship of blood flow, pressure, and resistance as the difference between pressure at the inflow end of the vessel and pressure at the outflow end divided by resistance within the vessel.
9. According to Poiseuille’s formula, resistance depends on the vessel’s length and radius and on the viscosity of the blood. The greater the vessel’s length and the blood’s viscosity and the narrower the radius of the vessel’s lumen, the greater the resistance within the vessel.
10. Total peripheral resistance, or the resistance to flow within the entire systemic circulatory system, depends on the combined lengths and radii of all the vessels within the system and on whether the vessels are arranged in series (greater resistance) or in parallel (lesser resistance).
11. Poiseuille’s law and Poiseuille’s formula are based on physical laws governing the behavior of fluids in a straight tube. In the body, blood flow is influenced also by neural stimulation (of vasoconstriction or vasodilation) and by autonomic features that cause turbulence within the vascular lumen (e.g., protrusions from the vessel wall, twists and turns, bifurcations).
12. Arterial blood pressure is influenced and regulated by factors that affect cardiac output (heart rate and stroke volume), total resistance within the system, and blood volume.
13. Many hormones alter vasomotion including epinephrine, norepinephrine, antidiuretic hormone, renin-angiotensin system, natriuretic peptides adrenomedullin and insulin.
14. Ang II has two subtypes of receptors, AT1 and AT2. The majority of Ang II actions are thought to be mediated by AT1 receptor.
15. Venous blood pressure is influenced by blood volume within the venous system and compliance of the venous walls.
16. Blood flow through the coronary circulation is governed not only by the same principles as flow through other vascular beds but also by adaptations dictated by cardiac dynamics. First, blood flows into the coronary arteries during diastole rather than systole because during systole, the cusps of the aortic semilunar valve block the openings of the coronary arteries. Second, systolic contraction inhibits coronary artery flow by compressing the coronary arteries.
17. Autoregulation enables the coronary vessels to maintain optimal perfusion pressure despite systolic effects, and myoglobin in heart muscle stores oxygen for use during the systolic phase of the cardiac cycle.
1. The vessels of the lymphatic system run in the same sheaths in which the arteries and veins run.
2. Lymph (interstitial fluid) is absorbed by lymphatic venules in the capillary beds and travels through ever larger lymphatic veins until it is emptied through the right or left thoracic duct into the right or left subclavian vein.
3. As lymph travels toward the thoracic ducts, it is filtered by thousands of lymph nodes clustered around the lymphatic veins. The lymph nodes are sites of immune function.
Tests of Cardiovascular Function
1. The evaluation of an individual with known or suspected cardiovascular disease must include a careful history and physical examination including assessment of risk factors, symptoms, vital signs, level of consciousness, mucous membrane color, and cardiopulmonary functioning.
2. Important tests for cardiac disorders are ECG and Holter monitoring, which detect disturbances of impulse generation or conduction.
3. Stress tests elicit clinical manifestations of cardiovascular disease that might not be present at rest.
4. The sensitivity of stress testing is improved by the use of radiotracer imaging techniques such as SPECT.
5. Echocardiography detects structural and functional cardiac abnormalities over time.
6. Cardiac catheterization is used to measure the oxygen content and pressure of blood in the heart’s chambers and to inject contrast media for x-ray examination of the size and shape of the chambers and valves. Injection of contrast medium into the coronary arteries (coronary angiography), on the other hand, permits visualization of the coronary circulation and every tissue perfused by the coronary arteries.
7. Evaluation of the systemic vascular system can include pulse tracings, Doppler ultrasonography, venography, and arteriography.
Aging and the Cardiovascular System
1. Much controversy exists regarding the effects of normal aging on the cardiovascular system. Separating the physiologic from the pathologic alterations is difficult because of the presence of arteriosclerosis in a majority of older adults.
2. Studies have documented no change in cardiac output, a slight decrease in heart rate, and a slight increase in stroke volume in healthy (lack of ischemic heart disease) older adults at rest. No changes were noted at rest in ejection fraction. A slight increase in afterload (e.g., as systolic blood pressure) and prolonged left ventricular relaxation was noted.
3. The most relevant age-associated changes in cardiovascular performance are myocardial and blood vessel stiffening, changes in neurogenic control over vascular tone, and left ventricular hypertrophy and fibrosis.
4. With active risk reduction and disease management, older adults can have markedly improved cardiovascular health.
a wave 1096
Adrenomedullin (ADM) 1128
Afferent lymphatic vessel 1133
Afterload 1109
Aldosterone 1127
Angiogenesis 1097
Angiotensin I (Ang I) 1125
Angiotensin II (Ang II) 1125
Anisotropic band (A band) 1106
Anomalous viscosity 1119
Anterior interatrial myocardial band (Bachmann bundle) 1102
Antidiuretic hormone (ADH) 1125
Aorta 1095
Aortic semilunar valve 1094
Arteriogenesis 1097
Arteriole 1113
Arteries 1113
AT1 1127
AT2 1127
Atrial natriuretic peptide (ANP or factor) 1128
Atrioventricular (AV) node 1101
Atrioventricular valve 1094
Automatic cell 1103
Automaticity 1103
Bainbridge reflex 1112
Baroreceptor reflex 1112
Brain natriuretic peptide (BNP) 1128
Bundle branch 1101
Bundle of His (atrioventricular bundle, common bundle) 1101
c-type natriuretic peptide (CNP) 1128
c wave 1096
Calcium channel–blocking drug 1108
Capillary 1113
Cardiac action potential 1099
Cardiac catheterization 1135
Cardiac cycle 1095
Cardiac output 1109
Cardiac plexus 1104
Cardioexcitatory center 1112
Cardioinhibitory center 1112
Cardiovascular control center 1111
Chordae tendineae 1094
Circumflex artery 1097
Collateral artery 1097
Conduction system 1099
Coronary angiography 1135
Coronary perfusion pressure 1130
Coronary sulcus 1097
Crista supraventricularis 1095
Cross-bridge theory of muscle contraction 1108
Depolarization 1102
Diastole 1095
Diastolic depolarization 1103
Efferent lymphatic vessel 1133
Ejection fraction 1109
Elastic artery 1113
End-diastolic volume 1110
Endocardium 1093
Endothelial cells 1116
Endothelium 1116
Epinephrine 1125
Excitation-contraction coupling 1108
Fenestration 1113
Frank-Starling law of the heart 1109
Great cardiac vein 1099
Heart rate 1099
Hyperemia 1125
Inferior vena cava 1095
Inflow tract 1094
Inotropic agent 1111
Insulin 1130
Intercalated disk 1105
Isotropic band (I band) 1106
Laminar flow 1121
Left anterior descending artery (LAD) 1097
Left atrium 1093
Left bundle branch (LBB) 1102
Left coronary artery (LCA) 1096
Left heart 1091
Left pulmonary artery 1095
Left ventricle 1093
Left ventricular end-diastolic pressure (LVEDP) 1110
Left ventricular end-diastolic volume (LVEDV) 1110
Lumen 1113
Lymph 1132
Lymphatic system 1131
Lymphatic vein 1132
Lymphatic venule 1132
M line 1106
Mean arterial pressure (MAP) 1122
Mediastinum 1093
Metarterioles 1113
Middle internodal pathway 1102
Mitral and tricuspid complex 1094
Mitral valve 1094
Muscular artery 1113
Myocardial contractility 1108
Myocardial oxygen consumption () 1107
Myocardium 1093
Myoglobin 1131
Myosin 1106
Node 1099
Norepinephrine 1125
Outflow tract 1094
P cell 1100
P wave 1103
Papillary muscle 1094
Parietal pericardium 1093
Perfusion 1122
Pericardial cavity 1093
Pericardial fluid 1093
Pericardium 1093
Peripheral vascular system 1113
Poiseuille’s formula 1119
Posterior internodal pathway 1102
Posterior vein of the left ventricle 1099
Precapillary sphincter 1113
Preload 1109
Pressure 1117
PR interval 1103
Pulmonary artery 1095
Pulmonary circulation 1091
Pulmonary veins 1095
Pulmonic semilunar valve 1094
Purkinje fiber 1102
QRS complex 1103
QT interval 1103
Renin 1125
Renin-angiotensin aldosterone system (RAAS) 1126
Repolarization 1102
Resistance 1118
Rhythmicity 1103
Right atrium 1093
Right bundle branch (RBB) 1101
Right coronary artery (RCA) 1096
Right heart 1091
Right lymphatic duct 1132
Right pulmonary artery 1095
Right ventricle 1093
Semilunar valve 1094
Shear stress 1097
Sinoatrial node (SA node, sinus node) 1100
ST interval 1103
Stroke volume 1109
Superior vena cava 1095
Systemic circulation 1091
Systole 1095
Systolic compressive effect 1131
Thoracic duct 1132
Tissue-based renin-angiotensin system 1127
Total resistance 1120
Trabeculae carneae 1096
Tricuspid valve 1094
Troponin 1106
Troponin C 1106
Troponin T 1106
Troponin-tropomyosin complex 1106
Tunica externa (adventitia) 1113
Tunica intima 1113
Tunica media 1113
Turbulent 1121
Urodilatin 1128
v wave 1096
Vasa vasorum 1113
Vascular compliance 1122
Vasoconstriction 1113
Vasodilation 1113
Vasomotion 1116
Vein 1113
Venule 1113
Visceral pericardium (epicardium) 1093
x descent 1096
y descent 1096
Z line 1106
REFERENCES
1. Mohrman D.E., Heller J.A., eds. Cardiovascular physiology, ed 6, Philadelphia: McGraw-Hill, 2006.
2. Shireman, P.K. The chemokine system in arteriogenesis and hind limb ischemia. J Vasc Surg. 2007;45(Suppl A):A48–A56.
3. Kocaman, S.A., et al. Increased circulating monocytes count is related to good collateral development in coronary artery disease. Atherosclerosis. 2008;197(2):753–756.
4. Maulik, N., Thirunavukkarasu, M. Growth factor/s and cell therapy in myocardial regeneration. J Mol Cell Cardiol. 2008;44(2):219–227.
5. Boodhwani, M., et al. Insulin treatment enhances the myocardial angiogenic response in diabetes. J Thorac Cardiovasc Surg. 2007;135(6):1453–1460.
6. Molin, D., Post, M.J. Therapeutic angiogenesis in the heart: protect and serve. Curr Opin Pharmacol. 2007;7(2):158–163.
7. Zipes, D.P., Rubart, M. Genesis of cardiac arrhythmias: electrophysiological considerations. In Peter L., et al, eds.: Braunwald’s heart disease: a textbook of cardiovascular medicine, ed 8, Philadelphia: Saunders, 2008.
8. Gauthier, C., Seze-Goismier, C., Rozec, B. Beta 3-adrenoceptors in the cardiovascular system. Clin Hemorheol Microcirc. 2007;37(1-2):193–204.
9. Feldman, D.S., et al. Mechanisms of disease: detrimental adrenergic signaling in acute decompensated heart failure. Nat Clin Pract Cardiovasc Med. 2008;5(4):208–218.
10. Hassan, M., et al. Association of beta1-adrenergic receptor genetic polymorphism with mental stress-induced myocardial ischemia in patients with coronary artery disease. Arch Intern Med. 2008;168(7):763–770.
11. Schwartz, P.J., et al. Neural control of heart rate is an arrhythmia risk modifier in long QT syndrome. J Am Coll Cardiol. 2008;51(9):920–929.
12. Horiba, M., et al. T-type Ca2+ channel blockers prevent cardiac cell hypertrophy through an inhibition of calcineurin-NFAT3 activation as well as L-type Ca2+ channel blockers. Life Sci. 2008;82(11-12):554–560.
12a. Book Review: The Linacre lecture on the law of the heart given at Cambridge, 1915. Nature. 1918;101(2525):43.
13. Berne R.M., Levy M.N., eds. Cardiovascular physiology, ed 8, St Louis: Mosby, 2001.
14. Monahan, K.D. Effect of aging on baroreflex function in humans. Am J Physiol Reg IntegrComp Physiol. 2007;293(1):R3–R12.
15. Freeman, R. Clinical practice, Neurogenic orthostatic hypotension. N Engl J Med. 2008;358(6):615–624.
16. Schmidt, H., et al. The alteration of autonomic function in multiple organ dysfunction syndrome,. Crit Care Clin. 2008;24(1):149–163. [ix].
17. Filippone, J.D., Bisognano, J.D. Baroreflex stimulation in the treatment of hypertension. Curr Opin Nephrol Hypertens. 2007;16(5):403–408.
18. Esper, R.J., et al. Endothelial dysfunction in normal and abnormal glucose metabolism. Adv Cardiol. 2008;45:17–43.
19. Schafer, A., Bauersachs, J. Endothelial dysfunction, impaired endogenous platelet inhibition and platelet activation in diabetes and atherosclerosis. Curr Vasc Pharmacol. 2008;6(1):52–60.
20. Thijssen, D.H., et al. Physical (in)activity and endothelium-derived constricting factors: overlooked adaptations. J Physiol. 2008;586(2):319–324.
21. Gradman, A.H., Kad, R. Renin inhibition in hypertension. J Am Coll Cardiol. 2008;51(5):519–528.
22. Coffman, T.M., Crowley, S.D. Kidney in hypertension: Guyton redux. Hypertension. 2008;51(4):811–816.
23. Lambert, D.W., Hooper, N.M., Turner, A.J. Angiotensin-converting enzyme-2 and new insights into the renin-angiotensin system. Biochem Pharmacol. 2008;75(4):781–786.
24. Raizada, V., et al. Intracardiac and intrarenal renin-angiotensin systems: mechanisms of cardiovascular and renal effects. J Invest Med. 2007;55(7):341–359.
25. Selektor, Y., Weber, K.T. The salt-avid state of congestive heart failure revisited. Am J Med Sci. 2008;335(3):209–218.
26. Wright, J.W., Yamamoto, B.J., Harding, J.W. Angiotensin receptor subtype mediated physiologies and behaviors: new discoveries and clinical targets. Prog Neurobiol. 2008;84(2):157–181.
27. Skultetyova, D., et al. The role of angiotensin type 1 receptor in inflammation and endothelial dysfunction. Recent Patents Cardiovas Drug Discov. 2007;2(1):23–27.
28. Perkins, J.M., Davis, S.N. The renin-angiotensin-aldosterone system: a pivotal role in insulin sensitivity and glycemic control. Curr Opin Endocrinol Diabetes Obes. 2008;15(2):147–152.
29. Widdop, R.E., et al. Vascular angiotensin AT2 receptors in hypertension and ageing. Clin Exp Pharmacol Physiol. 2008;35(4):386–390.
30. Schiffrin, E.L. Effects of aldosterone on the vasculature. Hypertension. 2006;47(3):312–318.
31. Gardner, D.G., et al. Molecular biology of the natriuretic peptide system: implications for physiology and hypertension. Hypertension. 2007;49(3):419–426.
32. Chen, H., et al. Atrial natriuretic peptide-initiated cGMP pathways regulate vasodilator-stimulated phosphoprotein phosphorylation and angiogenesis in vascular endothelium. J Bio Chem. 2008;283(7):4439–4447.
33. Bettencourt, P., Januzzi, J.L., Jr. Amino-terminal pro-B-type natriuretic peptide testing for inpatient monitoring and treatment guidance of acute destabilized heart failure. Am J Cardiol. 2008;101(3A):67–71.
34. Sandow, S.L., Tare, M. C-type natriuretic peptide: a new endothelium-derived hyperpolarizing factor? Trends Pharmacol Sci. 2007;28(2):61–67.
35. Lee, C.Y., Burnett, J.C., Jr. Natriuretic peptides and therapeutic applications. Heart Fail Rev. 2007;12(2):131–142.
36. Yanagawa, B., Nagaya, N. Adrenomedullin: molecular mechanisms and its role in cardiac disease. Amino Acids. 2007;32(1):157–164.
37. Temmesfeld-Wollbruck, B., et al. Adrenomedullin and endothelial barrier function. Thromb Haemost. 2007;98(5):944–951.
38. Fang, J.C., O’Gara, P.T. Evaluation of the patient. In Peter L., et al, eds.: Braunwald’s heart disease: a textbook of cardiovascular medicine, ed 8, Philadelphia: Saunders, 2008.
39. Schwartz, J.B., Zipes, D.P. Cardiovascular disease in the elderly. In Peter L., et al, eds.: Braunwald’s heart disease: a textbook of cardiovascular medicine, ed 8, Philadelphia: Saunders, 2008.
40. Susic, D., Frohlich, E.D. The aging hypertensive heart: a brief update. Nat Clin Pract Cardiovasc Med. 2008;5(2):104–110.
41. Sniderman, A.D., Furberg, C.D. Age as a modifiable risk factor for cardiovascular disease. Lancet. 2008;371(9623):1547–1549.