35 OBESITY AND DIABETES MELLITUS
INTRODUCTION
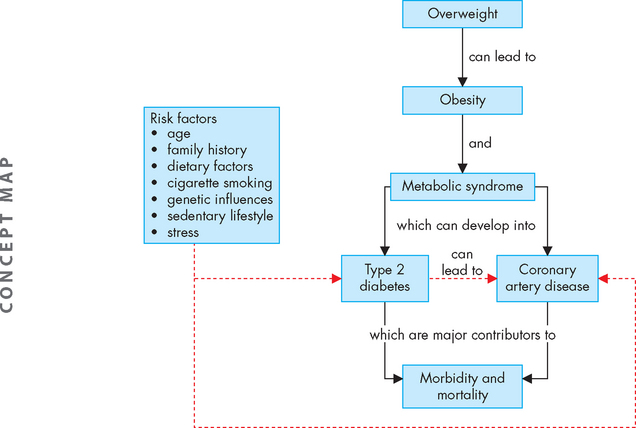
In this chapter, we consider two chronic health complications that are increasing in prevalence in our society and that have substantial associated health risks: obesity and diabetes mellitus. These two conditions are major contributors to morbidity and mortality (see Figure 35-1). Obesity is a significant risk factor for the development of type 2 diabetes. It is also an important risk factor for the development of coronary heart disease, which was discussed fully in Chapter 23. Diabetes is a major long-term health complaint, with complications ranging from short-term imbalance of blood glucose levels through to long-term complications that substantially increase the risk of mortality. Metabolic syndrome may be considered an intermediate condition between obesity and diabetes, as the presence of abdominal obesity and other characteristics of this syndrome are also risk factors for diabetes.
THE DEVELOPMENT OF OVERWEIGHT AND OBESITY
Obesity generally develops when energy intake exceeds energy expenditure. Energy that is not needed by the body is stored in adipose tissue. The digestive system is particularly efficient at digesting and absorbing most of the available nutrients from foods, including energy. Excesses of energy, fat, protein and carbohydrate may all be stored as adipose tissue. This is particularly useful in preparing for occasions when intake of nutrients is low, as body stores can then be released and used. While adequate amounts of energy and fats are essential for survival, overweight and obesity develop when the amount of stored adipose tissue is more than is necessary for normal body function.
As weight increases from a healthy weight, the individual is considered as overweight — further increases in body fat result in obesity. The distinctions between being overweight and obese are based on body mass index (see below). In this chapter, we focus more on obesity, as this signals the largest body size and it is associated with the highest risk of serious illnesses and mortality. However, it should be noted that although being overweight does not attract consequences as severe as obesity, it still increases an individual’s likelihood of chronic diseases and for many it is a sign to act now and prevent the development of obesity.
EVALUATION OF BODY SIZE
Body mass index and waist circumference are the most widely used methods for measuring or estimating body fat mass, and in most cases they provide sufficient information on body size for clinical diagnosis of body size. Hence in this chapter we concentrate on these two methods. However, several other methods are available, including CT and MRI techniques, dual energy X-ray absorptiometry, bioimpedance analysis, underwater weighing and other anthropometric measurements such as skin-fold thickness and waist-to-hip ratios.
Body mass index
Body mass index (BMI) is calculated by measuring the weight in kilograms (kg) and the height in metres (m). To obtain the BMI, the weight is divided by the height value squared (height multiplied by height). Thus:
So, for someone who weighs 65 kg and is 1.7 m tall, the calculation is:
Those who have a BMI of 25 or higher are considered to be overweight; those who have a BMI between 25 and 30 are considered pre-obese; and those who have a BMI above 30 are divided into different categories of obesity (see Table 35-1). As weight increases, the risk of co-morbidities increases substantially.
Table 35-1 CLASSIFICATION OF WEIGHT BY BMI*
| CLASSIFICATION | BMI | RISK OF CO-MORBIDITIES |
|---|---|---|
| Underweight | < 18.50 | Low (but risk of other clinical problems increased) |
| Normal range | 18.50–24.99 | Average |
| Overweight | ||
| * These BMI values are age-independent and the same for both sexes. However, BMI may not correspond to the same degree of fatness in different populations due, in part, to differences in body proportions. The table shows a simplistic relationship between BMI and the risk of comorbidity, which can be affected by a range of factors, including the nature of the diet, ethnic group and activity level. The risks associated with increasing BMI are continuous and graded and begin at a BMI above 25. The interpretation of BMI gradings in relation to risk may differ for different populations. Both BMI and a measure of fat distribution (waist circumference or waist:hip ratio (WHR)) are important in calculating the risk of obesity co-morbidities. | ||
Source: World Health Organization. Obesity: preventing and managing the global epidemic. Report of a WHO Consultation. WHO Technical Report Series 894. Geneva: WHO; 2000.
When making BMI calculations for those who are overweight, the BMI is actually quite a good indicator of the amount of body fat8 and is therefore a useful tool. However, there are some limitations to the BMI calculation. For example, it does not distinguish between weight due to muscle and weight due to fat. Therefore, the BMI calculation of a muscular athlete may suggest that the individual is overweight or obese, rather than reflecting the muscle bulk. At the opposite end of the scale, the elderly have less muscle bulk, as well as being shorter. As a result, their BMI calculation may actually underestimate their condition of overweight.
Also, people with a very long leg length, such as some Aboriginal Australians,9 who are very tall and lean may have quite low BMIs and therefore the healthy BMI range for these people is lowered to 17–22.10 Furthermore, those with a broad frame (such as wide shoulder structure) may have a BMI that overestimates their weight — the increased bone size will add extra weight, which cannot be distinguished from adipose stores.
Waist circumference
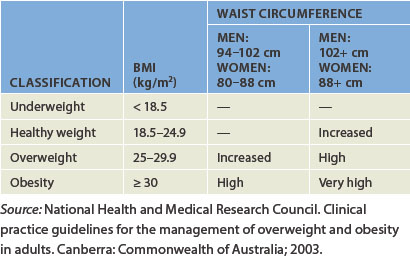
The Australian National Health and Medical Research Council guidelines recommend interpreting the BMI with caution, because it is not always accurate, as noted above.11 Another commonly used indication of body size is waist circumference. Waist circumference is preferred as a measure because it more directly indicates the amount of fat stored around the abdomen.12 The waist measurement is performed by standing, relaxing and wrapping a tape measure around the narrowest part of the torso viewed from the front. The measurement is taken just at the end of a normal exhalation and the value is recorded in centimetres. Waist measurements are categorised into increased risk and substantially increased risk for males and females (see Table 35-2).
Table 35-2 WAIST CIRCUMFERENCE AND RISK OF HEALTH COMPLICATIONS
| RISK OF METABOLIC COMPLICATIONS | WAIST CIRCUMFERENCE (cm) | |
|---|---|---|
| Men | Women | |
| Increased | ≥ 94 | ≥ 80 |
| Substantially increased | ≥ 102 | ≥ 88 |
Source: World Health Organization. Obesity: preventing and managing the global epidemic. Report of a WHO Consultation. WHO Technical Report Series 894. Geneva: WHO; 2000.
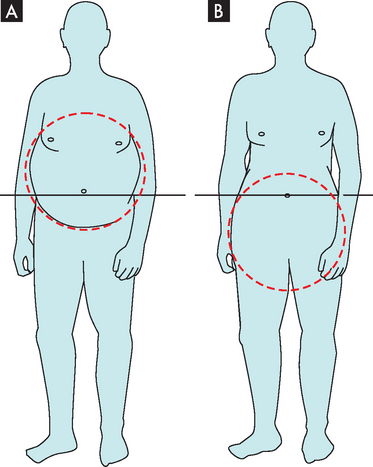
Obesity usually presents with two different forms of adipose tissue distribution (see Table 35-3). Central obesity (also known as intra-abdominal, visceral android or masculine obesity) occurs when the distribution of body fat is localised around the abdomen and upper body, resulting in an apple shape. Measurement of the waist circumference is a good indication of the amount of central obesity. Peripheral obesity (also known as gluteal-femoral, gynoid or feminine obesity) occurs when the distribution of body fat is below the waist around the thighs and buttocks, resulting in a pear shape (see Figure 35-2). Males who are overweight and obese are usually characterised by central obesity, with the excess fat stored around the waist. Younger women tend to have less centrally located fat than men, as most of their stores are usually below the waistline. However, after menopause, the female distribution becomes more central.8
Table 35-3 COMPARISON OF FAT DISTRIBUTION IN OBESE INDIVIDUALS
| CENTRAL OBESITY | PERIPHERAL OBESITY |
|---|---|
| Apple-shaped | Pear-shaped |
| Visceral and abdominal fat stores | Hips and buttocks fat stores |
| Higher risk of obesity-related complications | Lower risk of obesity-related complications |
Combining the BMI calculation with the waist circumference gives a better overall perspective of an individual’s status (see Table 35-4). For example, a male with a BMI in the overweight category is at further risk of major health complications if he also has a waist circumference greater than 102 cm. Therefore, healthcare professionals should always consider both BMI and waist circumference when providing information to individuals, as body shape may influence the individual’s overall risk.
Body composition
Approximately 20–25% of body weight in a normal weight person is fat.13,14 The percentage of body fat increases with age in both sexes,8 with women generally having a higher percentage than men.15 The proportion of body fat also increases with increasing body size and can reach 45% of body weight in those who are obese class III (BMI > 40).14 It is important to emphasise that lipids have a range of essential structural and functional roles in the body (see Table 26-2) and therefore it is necessary to have some fat in the diet and to maintain a healthy body weight with a normal level of body fat. It is excessive stores of fats that are of concern in this chapter.
OBESITY
The extent of the issue
In 2005 worldwide, 1.6 billion adults (over the age of 15) were overweight and 400,000 million were obese; in addition, 20 million children under the age of 5 were overweight.1 In Australia in 2008, 37% of the population were overweight and 25% were obese, meaning 62% of the population were above ideal weight.2 The situation is almost identical in New Zealand, where 63% of the population are overweight or obese.3 In Australia, slightly more men are overweight and obese than women (68% and 55%, respectively). The rates of obesity have been increasing over recent decades (see Figure 35-3).
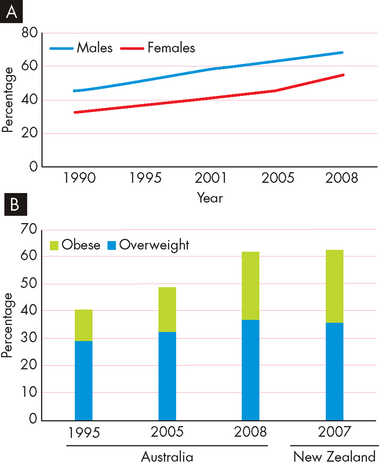
FIGURE 35-3 The prevalence of overweight and obesity in Australia and New Zealand.
A Changes in the percentage of overweight and obese men and women in Australia. B Trends in the number of overweight and obese Australians and New Zealanders.
Source: Australian Bureau of Statistics. Overweight and obesity in adults, 2004–2005. Available at www.abs.gov.au, accessed August 2009; Australian Bureau of Statistics. National health survey: summary of results, 2007–2008. Catalogue no. 4364.0. Available at www.abs.gov.au, accessed August 2009; Ministry of Health. A portrait of health: key results of the 2006/07 New Zealand Health Survey. Wellington: Ministry of Health; 2008. Available at www.moh.gov.nz.
Obesity is now one of the Australian National Health Priority Areas, as it is a huge cost to the health system — it was the third highest cause of the burden of disease in 2003, after tobacco use and high blood pressure.4 And in 2008 the total financial cost of obesity in Australia was $8.3 billion — this does not include any costs for overweight.5
There is a much higher proportion of obesity in Indigenous Australians compared with non-Indigenous Australians: in 2004–2005, 28% of Indigenous Australians were overweight (non-Indigenous Australians = 35%) and 29% were obese (non-Indigenous Australians = 17%).6 Depending on their degree of ‘Westernisation’, Aboriginal Australians may have a much higher or lower prevalence of obesity than the non-Indigenous population.7
Risk factors for the development of obesity
In very simple terms, weight is gained when the amount of energy consumed is greater than the amount of energy which is used (Figure 35-4). This excess weight is stored as adipose tissue. The actual reasons behind this imbalance appear complex and may include lifestyle and environmental factors, genetics and metabolic or endocrine disorders.
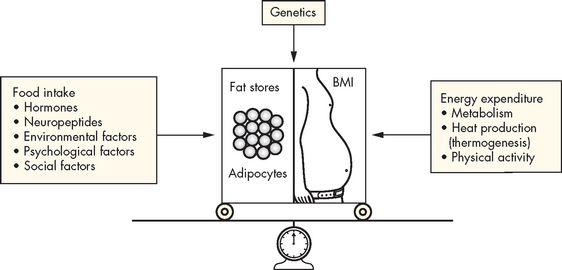
FIGURE 35-4 The energy balance.
Factors affecting energy intake and energy expenditure.
Source: Bryant B, Knights K. Pharmacology for health professionals. 2nd edn. Sydney: Mosby; 2007.
Lifestyle factors
Lifestyle factors include food habits, physical activity, stress, smoking and socioeconomic status. The World Health Organization identifies two main causes of being overweight and obese: a higher intake of energy-dense foods and lower levels of physical activity.1
Unhealthy diet
The contemporary diet in Australia and New Zealand often consists of a high intake of energy-dense foods. Such foods are high in fats and simple sugars, but low in important nutrients such as vitamins, minerals and proteins. Energy-dense foods are typical of many processed foods and takeaway fast foods, which have become increasingly prevalent in our community within the last 20 years. Other generally unhealthy dietary habits include insufficient consumption of fruits, vegetables, grains and fibre (includes complex carbohydrates).
Despite broad public-health advertising campaigns regarding fruit and vegetable intake, almost half of all Australians do not eat sufficient servings of fruit and more than 80% do not consume sufficient vegetables (the recommendation is 2 fruits and 5 vegetables per day).2
The guidelines for healthy eating in Australia recommend that less than 30% of the total energy intake should be derived from fat and less than 10% should be derived from saturated fats.16 Those who are overweight may get more than 35% of their energy from fat.17–19 4 6
Physical inactivity
Low levels of physical activity are now commonplace, due to a range of reasons. For example, many workplaces are sedentary as a result of computerisation; sedentary recreational activities mean that an increased amount of our recreation time is being spent sitting down; many people drive rather than use physical modes of transport such as walking or cycling; and we rely heavily on labour-saving devices, such as remote controls for televisions and garage doors. Together these components make for a more sedentary lifestyle than seen in previous generations.
An adequate level of physical activity is defined as 30 minutes of moderate exercise at least 5 days per week, totalling 150 minutes of physical activity per week.20 This recommendation is for all people, to assist in maintaining weight and overall good health. The importance of physical activity cannot be overestimated: it has been shown that the amount of fat intake is not as important a risk factor for being overweight and obese as a lack of physical activity.21
Stress
Stress is common in the obese, but it is unclear whether stress is a cause or a result of obesity11 — it is likely to be a combination of both. Either way, stress causes physiological and physical changes, including emotional eating and altered cortisol secretion, which can worsen the obesity (see Chapter 34 for more about stress). Stress may result from various factors including getting divorced, having children and undergoing changes in employment and housing circumstances. Stress is also a factor for those in particular age groups, including adolescence, menopause and the ageing. In addition, shift work can place stress on the body’s daily cycle. It can also make healthy food choices more difficult and will alter sleep patterns (see Chapter 34 for the effects of irregular sleep patterns).
Smoking
Much attention has been directed towards smoking cessation and its tremendous health benefits. However, there is evidence that those who quit smoking may undergo considerable weight gain — approximately 5–6 kg within a year.11 In an attempt to avoid this weight gain, adequate education and the introduction of a low-energy diet with the cessation of smoking may be particularly useful.11,22
Socioeconomic factors
Socioeconomic status and education levels can impact substantially on lifestyle choices such as food selection, physical activity and understanding the importance of maintaining a healthy weight. Furthermore, those in rural areas generally have less access to wide varieties of healthy food, exercise options, and support and medical care.
Genetic factors
Obesity is known to occur in families and approximately 300 genes have been identified that can influence obesity in humans23 — this clearly demonstrates the complex nature of the role of genetics in obesity. Even so, genetics is reported to account for no more than 30% of the effect on body weight,23 as both genetics and lifestyle factors are important. In Chapter 37, we further explore the complex relationships between genetic and environmental influences on obesity.
Metabolic disorders
Metabolic abnormalities associated with obesity include increased production of cortisol (Cushing’s syndrome), polycystic ovarian syndrome, hypothyroidism and hypothalamic injury. Diagnosis and adequate treatment of metabolic disorders is important in preventing weight gain.
PATHOPHYSIOLOGY
Central obesity
Central obesity attracts an increased risk of hyperlipidaemia, cardiovascular disease and insulin resistance with the development of type 2 diabetes.24 Abdominal fat is associated with specific changes in hormones that are involved in blood glucose levels (see Table 35-5), which relates obesity to changes that are consistent with the development of diabetes.
Table 35-5 EFFECTS OF INCREASED INTRA-ABDOMINAL FAT ON GLYCAEMIC HORMONES
Source: World Health Organization. Obesity: preventing and managing the global epidemic. Report of a WHO Consultation. WHO Technical Report Series 894. Geneva: WHO; 2000.
Abdominal fat is different from excess fat stored below the waist (peripheral fat) for the following reasons.
 It has greater rates of lipolysis (fat breakdown) in response to adrenaline and noradrenaline. This is worsened by it being less responsive to inhibition of lipolysis by insulin, resulting in increased levels of lipids circulating in the blood. It is more susceptible to hormonal stimulation; for example, it has more receptors for cortisol, adrenaline, noradrenaline and testosterone.
Therefore, the central fat is metabolically active, as it interacts with hormones, and may directly influence the liver. Stores of peripheral fat are usually referred to as being ‘quieter’ than abdominal fat for these reasons, as peripheral fat is less involved with other body systems and contributes less to complications arising from obesity. According to the National Health and Medical Research Council: ‘Waist circumference appears to be the best clinical determinant of truncal (relating to the body trunk) obesity and hence metabolic risk.’26
Adipose cells
Adipose cells (adipocytes or fat cells) were previously thought to be relatively inactive, their only function being the storage of large droplets of fats — up to 90% of the cell volume is occupied by stored fat. However, we now know that adipose cells actually secrete molecules such as hormones and cytokines that are collectively known as adipocytokines (see Box 35-1). Adipose cells secrete at least 20 different substances27 that behave like hormones, in that they can bind to receptors on target cells to influence other body processes. In this way, adipose cells have a real and powerful effect on the body. Adipocytokines participate in the neuroendocrine regulation of food intake, lipid storage, metabolism, insulin sensitivity and female reproduction. Adipocytokines also influence the complement system, vascular homeostasis, blood pressure regulation and the inflammatory and immune responses. Adipose cells can also stimulate angiogenesis, to ensure that adequate blood supply is available for the increased amount of adipose stores — an increase of fat tissue will require increased blood circulation.27
Box 35-1 EXAMPLES OF ADIPOCYTOKINES AND HORMONES FROM ADIPOSE TISSUE
Adipocytokines
Leptin: hunger/appetite suppression at hypothalamus; promotes insulin sensitivity
Adiponectin: insulin sensitising for regulation of blood glucose; promotes anti-inflammatory vascular effects and reduces atherosclerosis
Resistin: promotes insulin resistance and increases blood glucose levels
Excessive increase in fat cell mass causes dysfunction in the regulation and interaction of adipocytokines and contributes to the complications and consequences of obesity. Adipose cells clearly have a diverse role and higher amounts of adipose tissue will result in a greater interaction with body processes.
Control of appetite
Neuroendocrine regulation of appetite, eating behaviour, energy metabolism and body fat mass is controlled by a dynamic circuit of signalling molecules from the periphery acting on the hypothalamus28 (see Figure 35-5). An imbalance in this system is usually associated with excessive kilojoule intake in relation to exercise, with the consequence of weight gain and obesity.
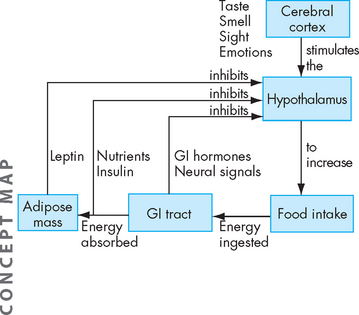
FIGURE 35-5 Conscious thought about food by the cerebral cortex stimulates the hypothalamus.
The hypothalamus regulates food intake. The digestive tract also sends signals to the hypothalamus. The hormone ghrelin is released by the stomach in the hours after a meal to increase appetite. When food is present in the stomach, stretch receptors send signals back to the hypothalamus, and gastrointestinal (GI) hormones are released to inhibit further food intake. The hormone leptin, which is released by adipose cells, inhibits appetite at the hypothalamus.
Source: Based on Guyton AC, Hall JE. Textbook of medical physiology. 10th edn. Philadelphia: Saunders; 2000.
Many different hormones and signalling systems control appetite and body weight. These include insulin from the pancreas, ghrelin from the stomach, peptide YY from the intestines and leptin, adiponectin and resistin from adipose tissue. These hormones circulate in the blood at concentrations proportional to body fat mass and serve as peripheral signals to the hypothalamus where appetite and metabolism are regulated. Obesity is associated with increased circulating plasma levels of leptin, insulin, ghrelin and peptide YY and decreased levels of adiponectin. Interaction of these hormones with neuropeptides at the level of the hypothalamus may be an important determinant of excessive fat mass.
One of the functions of leptin is to act on the hypothalamus to suppress appetite and function to regulate body weight within a fairly narrow range. Leptin secretion increases as adipose cells increase; however, for unknown reasons, high leptin levels are ineffective at decreasing appetite and energy expenditure, a condition known as leptin resistance. Leptin resistance disrupts hypothalamic satiety signalling (the feeling of fullness) and promotes overeating and excessive weight gain and may be a factor in the development of obesity29 (see Figure 35-6). Leptin may also be associated with the cardiovascular complications of obesity.30 Decreases in adiponectin are associated with insulin resistance, coronary heart disease and hypertension and also may contribute to the complications of obesity.31
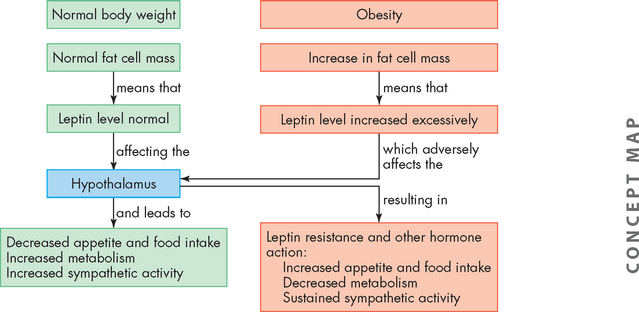
FIGURE 35-6 Leptin theory of obesity.
The hypothalamus controls appetite, fat cell mass and energy expenditure by responding to circulating levels of leptin and other hormones. Regulation of normal body weight is presented in the green boxes, and changes occurring with obesity are presented in the pink boxes.
Health complications associated with obesity
Obesity is associated with morbidity and mortality associated with type 2 diabetes, coronary heart disease and some cancers (colon, breast in postmenopausal women, endometrial, prostate, kidney and oesophagus). The health crisis of diabetes is so extensive that we will explore it fully later in this chapter. Obesity is also a risk factor for stroke, hepatobiliary disease (gallstones and non-alcoholic steatohepatitis) and osteoarthritis. Pulmonary function can be compromised by a large amount of adipose tissue overlying the chest cage, and obstructive sleep apnoea syndrome can occur as a consequence. The main disorders that are exacerbated by obesity are shown in Table 35-6.
Table 35-6 DISORDERS EXACERBATED BY OBESITY
Source: World Health Organization. Obesity and overweight. Fact sheet no. 311. September 2006. Available at www.who.int/mediacentre/factsheets/fs311/en/print.html, accessed March 2009; World Health Organization. Obesity: preventing and managing the global epidemic. Report of a WHO Consultation. WHO Technical Report Series 894. Geneva: WHO; 2000.
Cardiovascular disease
Obesity is a significant risk factor for the development of cardiovascular disease (discussed in Chapter 23), and higher weights correspond to higher risks of complications and mortality.10 Dyslipidaemia is indicated by increased triglycerides, increased low-density lipoproteins (LDL) (‘bad cholesterol’) and lowered HDL (‘good cholesterol’) — this is related to the development of coronary disease and is common in obese individuals.10 Furthermore, obesity is linked to abnormalities of the coagulation system, increasing the likelihood of developing thrombosis and myocardial infarction.10
The amount of fat surrounding the heart (epicardial fat) may be a contributor to cardiovascular disease in the obese — epicardial fat has smaller adipose cells, which behave slightly differently to other adipose stores, as they release fatty acids at high rates and are slow to decrease during weight loss.32 There is a strong relationship between the amount of epicardial fat and both the amount of abdominal fat and the presence of coronary atherosclerosis.32
In one study, stroke was related only to abdominal adiposity but not to BMI,33 which indicates the relevance of this central store of excess weight. Hypertension and thromboembolic stroke are also at higher risks at higher weights.10 It is likely that the higher levels of insulin associated with obesity result in renal retention of sodium, thereby increasing blood pressure (see the box ‘Health alert: obesity and hypertension’).10
Cancer
The types of cancers that have the strongest incidence in the obese can be broadly divided into those associated with hormones (reproductive organs) and those associated with the digestive system, and includes endometrial cancer, post-menopausal breast cancer, and cancers of the kidneys, gallbladder and colon.33 Fat stores in the abdomen attract higher risks than just high BMI levels.10 A weight loss of even 0.5–1.0 kg is associated with a substantial decrease in mortality due to obesity-related cancers.34
Respiratory disorders
Respiratory function is impaired in obese individuals, as the increased weight around the chest and abdomen make expansion of the thoracic cage more difficult. This is worsened when lying down, as the abdominal fat tends to push towards the thoracic cavity, thereby making expansion of the lungs more difficult.35 Hypoxaemia is common in obese patients.10
Obesity and hypertension
Several haemodynamic and metabolic abnormalities have been implicated in the development of hypertension in diabetes. These include activation of the sympathetic nervous system and the renin-angiotensin-aldosterone system, insulin resistance, endothelial dysfunction and renal function abnormalities. One of the major mechanisms leading to the development of obesity-induced hypertension appears to be leptin-mediated effects on blood vessels and the kidneys. Leptin is a circulating peptide hormone that is primarily secreted by adipose cells. Although obesity is generally associated with resistance to the weight-reducing actions of leptin, the resultant increased levels of this peptide cause an increase in sympathetic nervous system activity and adversely lead to sodium retention. Further studies aimed at achieving better understanding of leptin signalling in the hypothalamus and in the renal and vascular systems may lead to new treatments for obesity-related hypertension.
Source: Correia ML, Haynes WG. Leptin, obesity and cardiovascular disease. Curr Opin Nephrol Hypetens 2004; 13(2):215–223; Haynes WG. Role of leptin in obesity-related hypertension. Experim Physiol 2005; 90(5):686–688; Mukherjee R et al. Leptin as a common link to obesity and hypertension. Drugs Today 2005; 41(10):687–695; Rahmouni K et al. Obesity-associated hypertension: new insights into mechanisms. Hypertens 2005; 45(1):9–14.
Approximately two-thirds of all those experiencing obstructive sleep apnoea (whereby breathing ceases during sleep) are obese.10 Excess weight around the neck can constrict the upper airways — this is a particularly unnerving symptom, as patients wake up suddenly, gasping for breath (see Chapter 25 for more details).
Gallbladder and liver disease
Cholelithiasis (gallstones) are three to four times more prevalent in obese individuals compared with non-obese people.10 Again, there is an even greater risk when the fat is stored in the abdomen.
The liver is an important storage site for excesses of nutrients, including excess energy stored as fat. This makes the liver prone to becoming infiltrated with excess fat during obesity. As a result, non-alcoholic steatohepatitis is common (see Chapter 27) — almost three-quarters of patients with non-alcoholic steatohepatitis are overweight.36
Osteoarthritis
Osteoarthritis is characterised by pain and dysfunction of the joints (see Chapter 15). Osteoarthritis of the joints that bear most of the body weight (namely, the knees and ankles) is increased in obese individuals.10
Mortality
It is not surprising that with the profound effects that obesity has on the body systems, individuals who are obese have a higher mortality rate than those of normal weight. For example, in 25–35-year-olds, severe obesity is associated with a 12-times greater mortality rate than for lean people of the same age.10 While the overall cause of death due to obesity may seem low (0.1% of all Australian deaths), the median age of these people at death was 59.5 years — 21 years younger than the median age for all causes death.37 In 2003 obesity contributed to 7.5% of the total burden of disease and injury in Australia, with type 2 diabetes and ischaemic heart disease accounting for almost three-quarters of this.38
TREATMENT OF OBESITY
Obesity is a chronic disease for which various approaches to treatment have been used; these include individually tailored weight-reduction diets, exercise programs and correction of metabolic abnormalities.39–43 40 41 42 43 Self-motivation and support systems are critical aspects of treatment. Additional treatments, such as psychotherapy, behavioural modification, medications and bariatric surgery (surgery directed at weight loss, such as gastric banding), are also prescribed and, when successful, can significantly reduce co-morbidities and decrease insulin resistance.44 Achieving weight loss of even 10% of body weight will see improvements across a range of health complications and importantly a lowering of cardiovascular risk factors, as well as better control of blood glucose levels (see Table 35-7). Unravelling the exact causes of obesity will likely lead to more specific prevention, treatment and pharmacotherapeutical strategies.45
Table 35-7 BENEFITS OF MODERATE WEIGHT LOSS (10% OF BODY WEIGHT)
Source: World Health Organization. Obesity: preventing and managing the global epidemic. Report of a WHO Consultation. WHO Technical Report Series 894. Geneva: WHO; 2000.
Dietary factors
Overweight and obesity may be prevented by making individual choices that are aligned with a healthy lifestyle. This means:
choosing foods that are lower in fat and changing from consumption of saturated fats to unsaturated fats — it is important that the total energy intake is reduced, as simply reducing dietary fat without also reducing overall energy intake is not effective in achieving weight loss for the overweight and obese21A weight loss of even 5–10% of original body weight is defined as ‘modest weight loss’ and will result in benefits to the patient’s health.10,11,23 Some realistic weight loss goals are listed in Table 35-8. An optimum rate of weight loss is 0.5–1.0 kg per week, because losing weight more rapidly than this may cause loss of lean tissue.35 To achieve a weight loss in this range, an energy deficit of 2000–4000 kilojoules per day is necessary35 — this is referred to as a reduced-energy diet. A reduced-energy diet allows patients to make educated decisions about appropriate food choices and encourages them to focus on low-fat and healthier alternatives. Allowing patients to have flexibility in their food selection enables them to develop the skills necessary to maintain a healthy weight in the long term. These dietary changes are often easily applied to other members of the family and therefore promote healthy eating among household members.46
Table 35-8 REALISTIC GOALS FOR WEIGHT LOSS
| DURATION | WEIGHT LOSS | WAIST CIRCUMFERENCE |
|---|---|---|
| Short term | 1–4 kg/month | 1–4 cm/month |
| Medium term | 10% of initial weight | 5% after 6 weeks |
| Long term | 10–20% of initial weight | 88 cm (females); 102 cm (males) |
Source: National Health and Medical Research Council. Clinical practice guidelines for the management of overweight and obesity in adults. Canberra: Commonwealth of Australia; 2003.
More prescriptive diets may be necessary for some patients. A low-energy diet provides a total of 4000–5000 kilojoules per day, while a very low-energy diet provides only 1700–3300 kilojoules per day — usually as liquid meals or shakes, which need to also include a substantial amount of protein. The very low-energy diet is particularly useful for those who have previously had little success with weight loss or who have life-threatening risk factors that require urgent weight loss. However, these diets are less likely to be sustained and the nature of the restrictions means that patients may easily regain weight after the program has ceased, unless an alternative strategy is actioned. This is particularly due to the fact that these programs use combinations of shakes and prepackaged foods. The disadvantage is that those on the program do not benefit from learning about purchasing and preparing healthier food choices (as can be achieved with the reduced-energy diet). Hence, on ceasing the program, the previously consumed unhealthy foods are likely to be recommenced.
Physical activity
‘Physical activity’ refers to body movements and is not restricted to more formal exercise sessions. Combining exercise with dietary restraint has been shown to be effective at weight loss11 — this supports the decision to both modify dietary intake and increase physical activity in adopting a healthy lifestyle. Adequate levels of physical activity are also recommended for maintaining health in those of a healthy weight. The benefits of exercise in consuming energy are two-fold, because on top of the amount of energy that is consumed by working muscles at the time of exercise, an episode of exercise can increase the metabolic rate for several hours afterwards, thereby continuing the higher consumption of energy after the exercise has ceased.47
Health benefits occur with moderate levels of physical activity, such as brisk walking for 30 minutes per day or by expending 4000 kilojoules of energy per week. More activity may be necessary to achieve weight loss, but the actual amount of physical activity required can be difficult to define, as it is influenced by the frequency, duration and intensity of the exercise.11 However, it is clear that more exercise leads to more weight loss. Those who are very obese may be somewhat limited in their exercise options. Appropriate choices include non–weight-bearing activities such as swimming, walking in water and cycling.11
Pharmacological agents
Pharmacological treatments should be considered after lifestyle approaches have been attempted (namely dietary, exercise and behavioural modifications). They may also be suitable for patients who have had some success with lifestyle modifications but need assistance to continue losing weight. Medications are usually best targeted for those with a BMI of at least 30 or for those with a BMI greater than 27 with obesity-related co-morbidities (such as hypertension, diabetes, obstructive sleep apnoea).
Orlistat (Xenical) inhibits the action of the pancreatic lipase in the small intestine, which is responsible for the digestion of fats (see Chapter 26). As a result, fats cannot be digested and absorbed into the blood and hence pass out of the body with the faeces. An average weight loss of 9% occurs after 1–2 years.11 Common side effects due to the presence of excess fat in the faeces include diarrhoea, flatulence, abdominal pain and faecal incontinence. These can be minimised by patients restricting their fat intake (which can actually assist patients in learning about decreasing their intake of fatty foods). However, insufficient fat digestion may result in deficiency of the fat-soluble vitamins (vitamins A, D, E and K).
Sibutramine (Reductil) promotes satiety (a feeling of fullness), thereby assisting patients to decrease their food intake. It can also stimulate the body’s basal metabolic rate, which assists in using energy and contributes to weight loss. An average weight loss of 6% in 1–2 years is possible, and this increases to 11% if combined with dietary and lifestyle changes.11 Because the drug works by altering neurotransmission (particularly serotonin and noradrenalin; see Chapter 6), the side effects are more widespread, such as tachycardia, hypertension, headaches, dry mouth, insomnia, anxiety and sweating. Dopamine agonists (such as phentermine, Duromine) are approved for up to 3 months’ use only.11
Regardless of drug choice, if patients do not learn appropriate food and lifestyle choices, they usually regain weight after drug treatment is ceased.
Some inappropriate agents can cause weight loss too. Laxatives decrease the absorption of all foods within the gut, but they have a strong risk of electrolyte disturbances as well as damage to the intestines. Thyroxine increases the metabolic rate (see Chapter 11), but has an accompanying risk of arrhythmia and hypertension. Diuretics decrease overall weight by causing loss of body fluids, with the consequent risks of dehydration and electrolyte imbalance. These agents are not recommended for use in weight-loss programs.
Surgical treatment
Surgical treatment is usually reserved for those with a BMI greater than 40 or for those with a BMI greater than 35 with serious co-morbidity risk factors.11 It should be used only after other options have been attempted. Prior to surgery, it is important that patients be well educated about the potential results, as well as learning about the lifestyle changes that will ensure maximum success of the surgical procedure in the medium to long term.
Surgical options include gastric restrictions, which decrease the size of the stomach, such as vertical banded gastroplasty and gastric banding (see Figure 35-7). In such cases, the functional size of the stomach becomes small, as the goal is to limit food consumption. While gastric banding is less invasive and adjustable, it has a higher re-operation rate than vertical banded gastroplasty.11 In gastric malabsorption surgery, such as gastric bypass and Roux-en-Y bypass, sections of the small intestine are bypassed, resulting in a decrease in food absorption. Biliopancreatic diversion is a type of gastric malabsorption surgery usually reserved for the most obese patients. Liposuction involves removing localised deposits of fat, but is best used for those of normal weight who have excess fat deposits in particular areas48 and is therefore not a recommended treatment option for obesity.
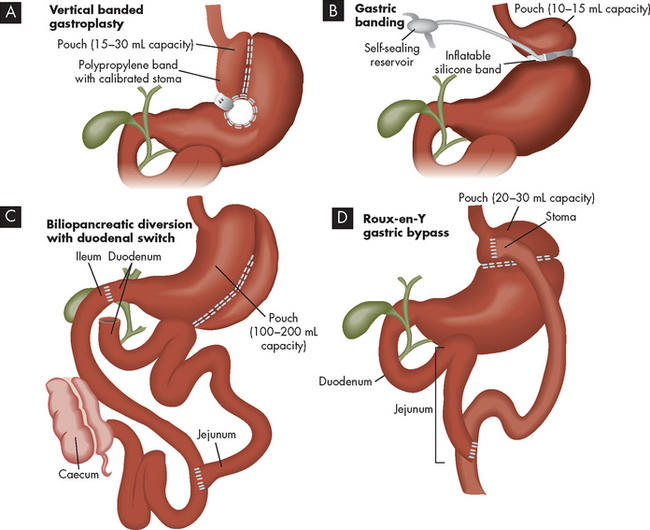
FIGURE 35-7 Bariatric surgical treatment procedures.
Source: Brown D, Edwards H. Lewis’s medical-surgical nursing. 2nd edn. Sydney: Mosby; 2008.
While surgical treatment may be useful for weight loss in the obese, patients usually regain a substantial amount of weight afterwards.49 Because obesity is a chronic disease, longer-term follow-up of patients is necessary to determine the sustained effect of the treatment; literature in this area is currently minimal.50 At any rate, we continue to emphasise that effective maintenance of a healthy weight requires patients to make lifelong changes to their approach to diet and physical activity. Changes in lifestyle choices are necessary, regardless of any other treatment used, and long-term support from health professionals is recommended.11
Complications of weight loss
In contrast to the range of health complications arising from carrying excess weight, the hazards associated with losing weight are few.10 Gallbladder disease may occur due to the release of cholesterol from storage in adipose cells; this can temporarily increase the concentration of cholesterol in the bile. A decrease in bone density may also occur, as the bone becomes remodelled when carrying less weight. Improving bone density for these patients may be achieved in a similar manner to that recommended for everyone — by undertaking weight-bearing exercise (see Chapter 21).
 PAEDIATRICS
Childhood obesity
The Childhood Obesity Working Group of the International Obesity Task Force has published cut-off points for childhood BMIs at specific ages throughout childhood and adolescence, based on the adult reference BMIs of 25 for overweight and 30 for obesity.51 This links the growth patterns during childhood and adolescence through to body size in adulthood and allows for appropriate early classification and diagnosis of overweight and obesity.
The rate of increase in the percentage of children and adolescents who are becoming overweight and obese is alarmingly high. Approximately 20% of Australian children were classified as overweight or obese in 1995.52 Furthermore, between 1985 and 1995 the percentage of obese children (BMI > 30) rose from 1.4% to 4.5% for boys and from 1.2% to 5.3% for girls — a trebling within a decade.52
Risk factors for the development of childhood obesity
Overweight and obesity are often seen in families — children with one overweight parent have a 40% likelihood of becoming overweight, while if both parents are overweight, the likelihood increases to a staggering 80%.23 While this is probably due to a combination of poor lifestyle choices within the family and genetic causes, as discussed previously, genetics alone is usually linked to only 30% of weight variation.23
Other causes for children becoming obese are similar to those listed for adults, such as sedentary recreational activities, increased consumption of energy-dense foods (such as high-fat foods and sugary soft drinks) and low levels of physical activity.53 For example, between 1985 and 1995 children aged 10–15 years increased their intake of food by an average rise of 500–2000 kilojoules per day.52
Complications associated with childhood obesity
The most common manifestation of obesity in young people results from the social and psychological issues of their increased weight.53 This is of particular concern for these youngsters, when self-esteem is heavily influenced by interactions with other people. Another manifestation is the development of physical bone alterations in the feet and lower legs.53 The extra weight being carried by the body stimulates bone remodelling and alterations as the epiphyseal plates in bones have not yet fused, allowing for changes in bone shape (see Chapter 20). These changes become permanent into adulthood. The development of acanthosis nigricans, thin velvety folds of skin around the neck, occurs as a result of childhood obesity.54 This can be unsightly in those children and adolescents who may already be experiencing low self-esteem.
In addition, the onset of puberty is altered in obese children. The average age of menarche (the first menstrual period) in obese girls is 8 or 9 years of age — at least 2 years younger than the average for non-obese girls.54 In boys, puberty may be delayed by obesity and obese boys commonly experience gynaecomastia (breast development).55
Obese children experience headaches, including pseudotumour cerebri (raised intracranial pressure accompanied by headaches and vomiting) — an urgent medical condition requiring treatment. Approximately half of all children presenting with pseudotumour cerebri are overweight or obese.54,55
Additional complications of childhood obesity are similar to those discussed for adults; namely, dyslipidaemia, hypertension, type 2 diabetes, gallstones, osteoarthritis and obstructive sleep apnoea. Perhaps one of the most significant consequences of childhood obesity is that it usually continues into adulthood,11,53,56 and this brings with it an increased risk of chronic disease and mortality later in life.55
Treatment of childhood obesity
Goals for weight loss in children may be more appropriately directed at preventing further weight gain rather than actually decreasing weight,53 as phases of growth tend to see a lessening of the obesity. Parental education and support of the child are critical, and improved family lifestyle habits are effective in limiting weight gain.53 A range of other approaches include school and community group programs:53 community-based and population-wide programs targeting obesity are being used in Australia and New Zealand.57,58 Interestingly, there is some evidence that less regimented approaches may have greater success in children, such as decreasing television viewing time rather than increasing exercise time59 and a lower energy diet being consumed by the whole family rather than a prescriptive dieting program for the child.60
A wide range of strategies are being developed to treat childhood obesity; however, the difficulty is often not just developing a program for the individual child, but ensuring the child adheres to such a program. Children and adults alike share the factor of being unwilling or unable to choose lifestyle practices that control their weight. This reflects the complex psychological and physiological nature of this condition.
Prevention of childhood obesity is the preferable approach, ‘for though obesity is the most prevalent health affliction in children, it is also the most preventable’.54 Strategies for the prevention of childhood obesity are currently the focus of much discussion in the literature. An important focus should be:
Issues that are more pertinent to children than adults include the need for entertainment — for children to engage in regular physical activity, they must obtain some level of amusement from the activity.62 Similarly, the importance of taste (particularly sweetness) is critical to children in assisting with food intake — this can complicate the transition from processed, energy-dense foods to nutritious foods.63
The rights and protection of children
Collecting measurements of children would be useful in improving the quality of data surrounding childhood obesity to enable improved population-level planning for education and treatment; however, the limitation of parental consent restricts children from being measured in school-based programs.64 This becomes a balance between the requirements of information for groups seeking to address the problem of childhood obesity and parental perception of the importance of the information. Also, parental consent may not be provided due to lack of attention to the paperwork rather than a conscious objection.
Another complex and sensitive issue surrounding childhood obesity is the view that allowing children to become obese is a form of parental neglect65 that places the child at substantial health risks. Although exposing children to lifestyle factors that contribute to obesity may be considered neglect on the behalf of parents, there is currently debate about whether healthcare professionals should notify child protection services about obese children and, if so, at what degree of obesity. On the other hand, this threat could discourage parents from seeking medical assistance for their obese children, thereby depriving the children of the opportunity for appropriate care.65 This ethical and legal issue is currently the topic of much discussion in the literature.
METABOLIC SYNDROME
In many patients, metabolic syndrome is a link between obesity and the development of diabetes mellitus. While the relationship between obesity, metabolic syndrome and diabetes mellitus is not clear cut, substantial overlap in risk factors, signs and symptoms and chronic health effects does indicate the likelihood of progressing from one to another for many people. It is diagnosed in people who have central adiposity (increased waist circumference) and insulin resistance (in which blood glucose levels are between those seen in healthy people and those with diabetes) as well as other signs and symptoms as discussed below. People with metabolic syndrome are at an increased risk of developing cardiovascular disease and type 2 diabetes66 and therefore a diagnosis of metabolic syndrome can assist in making modifications to slow the progression to these chronic diseases. However, metabolic syndrome does not always lead to diabetes; similarly, some patients with type 2 diabetes would not be classified as either being obese or having metabolic syndrome.
In addition to identifying those at risk of developing cardiovascular disease and diabetes, other important benefits of the diagnosis of metabolic syndrome include:
it ensures that, by addressing the components of metabolic syndrome using the proven treatment of lifestyle modification, the onset of diabetes and cardiovascular disease is prevented and general health and wellbeing are improved.67Evaluation of metabolic syndrome
Metabolic syndrome has been known by a number of other names, such as syndrome X and dysmetabolic syndrome. There are five components associated with the syndrome:
These are detailed in Table 35-9. People with an increased waist circumference only need to have two of the other components to be classified as having metabolic syndrome.
Table 35-9 CRITERIA FOR THE DIAGNOSIS OF METABOLIC SYNDROME
| COMPONENT | MEASUREMENT |
|---|---|
| Abdominal obesity | Waist circumference (for those of European descent): |
| PLUS any 2 of the following: | |
| Elevated triglycerides | |
| Lowered HDL cholesterol | |
| Hypertension | |
| Elevated plasma glucose | |
Source: Alberti K, Zimmet P, Shaw J. The metabolic syndrome: a new worldwide definition. Lancet 2005; 366:1059–1062.
The syndrome is actually a debated collection of signs and symptoms, as four different classifications have been made by the World Health Organization and other professional organisations, focusing mainly on either diabetes or cardiovascular disease.68–71 69 70 71 Consequently, each definition has a slightly different emphasis and slightly different cut-off values for each criterion. Within this section, we use the criteria published by the International Diabetes Federation (see Table 35-9).69 This particular classification has lower cut-offs for fasting glucose and waist circumference and includes abdominal adiposity as a requirement. As a result it includes more people and therefore increases estimates of prevalence, but this makes it is less accurate in predicting the development of cardiovascular disease and diabetes.72,73 Because the classification criterion vary slightly with each definition of metabolic syndrome, care must be taken when reading data relating to the incidence and prevalence of this syndrome. Regardless of the choice of criteria used, diagnosing a patient with metabolic syndrome remains useful in management approaches to limit the progression of chronic disease.
There has been some discussion whether liver function tests should be included as part of the criteria for metabolic syndrome, as non-alcoholic fatty liver disease is increasingly common with type 2 diabetes and obesity.74 Including an assessment of liver function may increase the effectiveness of metabolic syndrome in predicting cardiovascular disease.75
Chronic complications associated with metabolic syndrome
Coronary heart disease
People with metabolic syndrome have a greater burden of subclinical atherosclerosis, which reinforces the benefit of using metabolic syndrome to identify all risks together in patients.76 High levels of central adipose tissue are associated with dyslipidaemia, hypertension and cardiovascular disease.77 In one study, metabolic syndrome predicted future cardiovascular risk in women, whereas BMI did not; this underlines the importance of identifying all risk factors associated with metabolic syndrome in the development of atherosclerosis, not just the presence of obesity.78 Furthermore, this study group also found that in women with angiographically significant coronary heart disease, those who had metabolic syndrome had a significantly higher risk of cardiovascular events than those without metabolic syndrome.79
Diabetes
Increased amounts of central adipose are associated with insulin resistance, an important precursor to the development of diabetes.77 Higher than normal levels of glucose in the blood can indicate a pre-diabetic condition, which is an intermediate step between normal glucose handling and the development of diabetes. Early diagnosis of alterations in blood glucose levels can allow for lifestyle changes to limit the progression to diabetes. However, a study of the Australian population looking at the four published sets of criteria for the diagnosis of metabolic syndrome found that none of these were superior to simply checking fasting glucose levels for predicting diabetes.67
Treatment of metabolic syndrome
One of the most important benefits of diagnosing a patient with metabolic syndrome is that it allows the individual to address the modifiable risk factors. There are two main goals in the management of those with metabolic syndrome: (1) reduce the risk of developing atherosclerotic heart disease; and (2) prevent the progression to type 2 diabetes.77
Weight loss is necessary for those who are obese. Regular physical activity will reduce cardiovascular risk factors and has a strong protective effect against cardiovascular mortality with metabolic syndrome.77
Appropriate education and follow-up with patients are essential if these patients are to continue with adequate lifestyle changes. For example, in one study patients who took part in a specific program of monthly nurse counselling meetings reduced their metabolic syndrome risk factors such as waist circumference and triglycerides compared with those who did not participate in the meetings.80
DIABETES MELLITUS
Diabetes mellitus includes a number of disorders that are characterised by either insufficient release of insulin by the Islets of the pancreas (see Chapter 10) or an ineffective response to insulin at the target cells (known as insulin resistance). The result of this is hyperglycaemia (an increased blood glucose level), as glucose remains circulating within the bloodstream rather than being taken into body cells for immediate use or storage. Homeostasis of blood glucose levels is not maintained.
Type 1 diabetes is characterised by destruction of Islet cells and progresses so quickly that it is usually diagnosed in childhood. Type 2 diabetes is characterised by insulin resistance at the target cells (see Table 35-10), and may progress to insufficient pancreatic insulin release and Islet cell destruction. Gestational diabetes occurs as the changes in hormones during pregnancy suppress the response to insulin, which is similar to the insulin resistance of type 2 diabetes — consequently, gestational diabetes is a risk factor for later development of type 2 diabetes. In this chapter, we focus mainly on type 2 diabetes as it relates strongly to obesity; type 1 diabetes and gestational diabetes have a different underlying pathophysiology (see Table 35-11) and are discussed in more detail in Chapter 11.
Table 35-10 HORMONE LEVELS IN DIABETES
| TYPE 1 | TYPE 2 | |
|---|---|---|
| Plasma insulin | Low or absent | Normal to high (initially), may progress to low |
| Plasma glucose | Increased | Increased |
| Insulin sensitivity | Normal | Reduced |
| Note that reduced insulin sensitivity is referred to as insulin resistance. | ||
Source: Modified from Guyton AC, Hall JE. Textbook of medical physiology. 10th edn. Philadelphia: Saunders; 2000.
Table 35-11 CLASSIFICATION AND CHARACTERISTICS OF DIABETES MELLITUS
| NAME | CHARACTERISTICS |
|---|---|
| Type 1 diabetes mellitus | |
| Type 2 diabetes mellitus | |
| Gestational diabetes mellitus |
The extent of the issue
More than 7% of the Australian population have diabetes, which is 880,000 Australians aged 25 and over.81 Of these, the vast majority (96%) have type 2 diabetes. The rates in males are slightly higher than in females (8.0% and 6.8%, respectively). The prevalence of diabetes in Australia has doubled within the last 20 years. In New Zealand, 125,000 people have type 2 diabetes.82 Approximately 275 Australians and 20 New Zealanders are diagnosed with diabetes every day.83,84 A further 16.4% of the Australian population has a pre-diabetic condition of impaired glucose tolerance or impaired fasting glucose.81 These pre-diabetic conditions indicate a progression to diabetes, which can often be prevented or delayed by lifestyle changes.
Diabetes mellitus is a Health Priority Area in both Australia and New Zealand due to its prevalence, range of chronic health complications, contribution to mortality and cost to the health system.82,85
Evaluation of diabetes
The diagnosis of diabetes requires blood tests. A fasting blood glucose level of at least 7.0 mmol/L indicates the hyperglycaemia characteristic of diabetes, while a normal fasting blood glucose level is usually less than 6.1 mmol/L (see Table 35-12). Diabetes is also indicated by the presence of glucose in the urine (glycosuria), but this should be confirmed using blood tests. In fact, the term ‘mellitus’ is Latin for honey, indicating the sweetness of urine.
Table 35-12 ORAL GLUCOSE TOLERANCE TEST, PLASMA GLUCOSE LEVELS (mmol/L)
| FASTING PLASMA GLUCOSE (mmol/L) | 2 HOURS FOLLOWING GLUCOSE INGESTION, PLASMA GLUCOSE (mmol/L) | |
|---|---|---|
| Normal glucose tolerance | < 6.1 | < 7.8 |
| Impaired fasting glucose | 6.1–6.9 | < 7.8 |
| Impaired glucose tolerance | < 7.0 | 7.8–11.0 |
| Diabetes | ≥ 7.0 | ≥ 11.1 |
Source: World Health Organization. Definition, diagnosis and classification of diabetes mellitus and its complications. Part 1: Diagnosis and classification of diabetes mellitus. Geneva: Department of Noncommunicable Disease Surveillance; 1999.
The oral glucose tolerance test requires fasting followed by consumption of a glucose drink; blood glucose levels are monitored after fasting and then again 2 hours after glucose ingestion. In a non-diabetic person, the blood glucose level should rise as the glucose drink is absorbed into the bloodstream, then decrease to below 7.8 mmol/L after 2 hours (see Figure 35-8). In a person with diabetes, the blood glucose level remains over 11.0 mmol/L after 2 hours. The maximum blood glucose level is higher in diabetics than in non-diabetics.
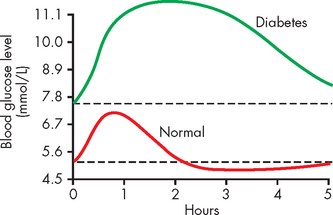
FIGURE 35-8 Glucose tolerance curve in a non-diabetic and a diabetic.
Source: Based on Guyton AC, Hall JE. Textbook of medical physiology. 11th edn. Philadelphia: Saunders; 2006.
Pre-diabetic conditions are those in which glucose homeostasis is between the normal level of control and that seen with diabetes. Pre-diabetic conditions are impaired fasting glucose and impaired glucose tolerance. In impaired fasting glucose, the fasting blood glucose level is raised, but the response to the oral glucose tolerance test appears normal (see Table 35-12). Conversely, for impaired glucose tolerance, the fasting blood glucose level is normal, and there is a hyperglycaemic response to the oral glucose tolerance test, but to a lesser extent than seen with diabetes. Pre-diabetic conditions should be considered as a warning that type 2 diabetes is developing and modifiable lifestyle factors should be changed.
CLINICAL MANIFESTATIONS OF DIABETES
Hyperglycaemia results when there is insufficient action of insulin and therefore inadequate transport of glucose into the liver and skeletal muscle cells from the bloodstream. As a consequence, glucose remains in the blood, causing hyperglycaemia. Hyperglycaemia is common to all types of diabetes mellitus. The three main symptoms of hyperglycaemia are:
Polyphagia occurs because glucose (and lipid) does not enter cells in sufficient amounts and therefore cells are deprived of nutrients, which in turn stimulates increased food intake. Polyuria occurs due to the kidneys’ inability to manage the high amount of glucose in the bloodstream. Glucose filters freely at the nephron, but in the non-diabetic person, all glucose is returned to the blood by reabsorption in the kidneys. However, in the diabetic, the much higher amount of glucose in the blood that is filtered cannot be fully reabsorbed, as the transport maximum (or maximum capacity to reabsorb glucose back into the blood) is exceeded. Therefore, some of the glucose appears in the urine, which is known as glycosuria (refer to Chapter 28 for the normal renal handling of glucose). The osmotic effect of glucose in the urine draws water into the urine from the bloodstream, increasing the production of urine. The water being lost from the body in the urine leads to dehydration, which triggers increased thirst (polydipsia) in an attempt to rehydrate the cells. Dehydration leads to low blood volume and hypotension.
Clinical manifestations of type 2 diabetes are often nonspecific. The individual is often overweight and hyperlipidaemic. The onset is generally slow and insidious, making early diagnosis difficult. Some of the classic symptoms of diabetes may be present, but more often there will be nonspecific symptoms, such as pruritus, recurrent infections, visual changes and paraesthesias (see Table 35-13).
Table 35-13 CLINICAL MANIFESTATIONS AND MECHANISMS FOR TYPE 2 DIABETES
| MANIFESTATIONS | MECHANISMS |
|---|---|
| Recurrent infections (e.g. boils and carbuncles), skin infections and prolonged wound healing | Growth of microorganisms is stimulated by increased glucose levels; impaired blood supply hinders healing |
| Genital pruritus | Hyperglycaemia and glycosuria favour fungal growth; candidal infections, resulting in pruritus, are a common presenting symptom in women |
| Visual changes | Blurred vision occurs as water balance in the eyes fluctuates because of elevated blood glucose levels; diabetic retinopathy may ensue |
| Paraesthesias | Paraesthesias are common manifestations of diabetic neuropathies |
| Fatigue | Metabolic changes result in poor use of food products, contributing to lethargy and fatigue |
PATHOPHYSIOLOGY
Type 2 diabetes is characterised by an ineffective response to insulin at the target cells, which is known as insulin resistance. It may also progress to destruction of pancreatic beta cells, so that insulin production by the pancreas ceases (as occurs in type 1 diabetes).
Insulin resistance
The process of insulin resistance is characterised by failure of the target cells to respond adequately to insulin (see Figure 35-9). As a result, hyperglycaemia persists. Although insulin secretion by the pancreas may increase (resulting in hyperinsulinaemia) to compensate for insulin resistance (or lack of insulin response) in peripheral tissues, there is still a relative deficiency of insulin function. This process of insulin resistance is a factor for the majority of individuals with type 2 diabetes. Insulin resistance increases with obesity.
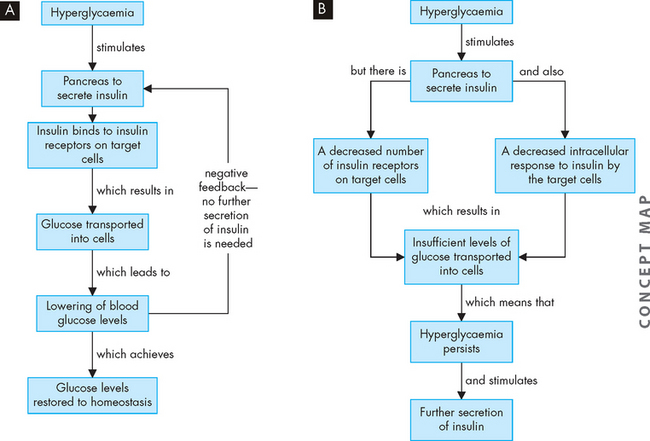
FIGURE 35-9 The relationship between hyperglycaemia and insulin secretion.
A In a non-diabetic, hyperglycaemia stimulates insulin secretion, which targets the liver and skeletal muscle for uptake of glucose. B In a type 2 diabetic, despite secretion of insulin, there is insufficient response at the target cells. This is probably due to a combination of low levels of insulin receptors and a decreased response inside the cells, preventing glucose from entering. As a result, hyperglycaemia persists and stimulates further insulin secretion, but the insulin resistance at the target cells remains.
Decreased beta cell responsiveness to plasma glucose levels is also an important part of the pathogenesis of type 2 diabetes, as the beta cells are no longer stimulated to secrete insulin by hyperglycaemia (see Figure 35-10). This abnormal functioning of the beta cells occurs with abnormal glucagon secretion.
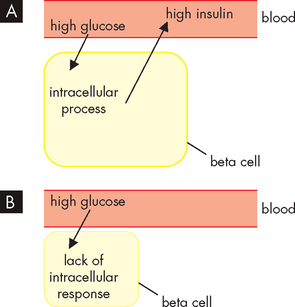
FIGURE 35-10 A In the development of type 2 diabetes, the presence of high glucose causes the pancreatic beta cells to secrete high concentrations of insulin. Because the insulin is not effective at its target cells, hyperglycaemia persists, stimulating further insulin production and resulting in hyperinsulinaemia. B Fatigued beta cells are no longer able to respond to hyperglycaemia by secreting sufficient insulin, resulting in insulin secretory abnormality. Hyperglycaemia persists.
Beta cell destruction
A progressive decrease in the weight and number of beta cells occurs in type 2 diabetes. Beta cells are extremely sensitive to high levels of glucose (and free fatty acids as well), so the persistent hyperglycaemia can contribute to the destruction of pancreatic beta cells. In longstanding type 2 diabetes, beta cell mass is decreased by 20–40%,86 but the number of functional cells is considerably lower and inexorably declines over time. Pancreatic fibrosis, occurring in 33–66% of individuals with type 2 diabetes, also contributes to loss of beta cell function.
Furthermore, a variety of cytokines, including tumour necrosis factor-alpha (TNF-α) and interleukin 1-beta (IL-1β), have also been shown to be toxic to beta cells. Interestingly, intra-abdominal fat produces these cytokines (called adipocytokines), which have excessive rates of free fatty acid release. Most experts now believe that the combinations of excess nutrients, obesity, inflammatory cytokines and the production of obesity-related adipokines are major contributors to insulin resistance and beta cell death in type 2 diabetes.87–89 4 6 This strongly relates diabetes to obesity (as discussed earlier in the chapter).
Risk factors for the development of type 2 diabetes
Interactions of metabolic, genetic and environmental factors affect the prevalence of type 2 diabetes. It primarily affects people over the age of 40, many of whom are obese. There is also an increasing incidence of type 2 diabetes in children. The risk factors include obesity and increased BMI, a family history of type 2 diabetes and metabolic syndrome.90
Obesity
The most powerful risk factor for type 2 diabetes is obesity, especially abdominal obesity. The risk for developing type 2 diabetes increases 10 times with severe obesity.88 Over half of those who are obese will develop diabetes.91 Excessive energy intake predisposes an individual to type 2 diabetes by contributing to obesity.
In obese individuals, insulin is less able to facilitate the entry of glucose into the liver, skeletal muscles and adipose tissue. This may be due to:
release of free fatty acids interfering with insulin signalling and impeding cellular metabolism of glucose hyperinsulinaemia from overeating inducing insulin resistance — this may be to protect the body from hypoglycaemia that could occur with an enhanced response to high levels of insulin.In any event, the mechanism responsible for insulin-receptor binding or intracellular response may be reversed through weight loss.
People with diabetes are more likely to be overweight than non-diabetics. When classified according to BMI, a staggering 80% of diabetic Australians are overweight or obese, including 57% who are obese (see Figure 35-11).92 The percentage of non-diabetic Australians who are obese is much lower, at 19%.
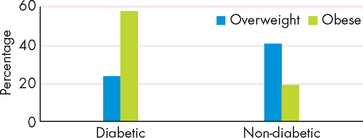
FIGURE 35-11 The proportion of overweight and obese people who are diabetic and those who do not have diabetes.
Source: Australian Institute of Health and Welfare. Diabetes: Australian facts, 2008. Diabetes series no. 8. Catalogue no. CVD 40.
The accumulation of fat in non-adipose tissue (ectopic fat) is common in type 2 diabetes and insulin-resistance states. Lipid accumulation in pancreatic islets is associated with impaired insulin secretion, and excess fat in muscle has been correlated with insulin resistance. The pathogenesis of ectopic fat is poorly understood but is clearly related to overnutrition.
Pre-diabetes
Pre-diabetic conditions are impaired fasting glucose and impaired glucose tolerance (see Table 35-12). The presence of hyperglycaemia in pre-diabetes can enhance the transition from impaired glucose tolerance to diabetes.93 For this reason, identification and education of those with pre-diabetes is important to allow for lifestyle changes, as increased physical activity and healthy eating can slow or stop the progression to diabetes.92
Pre-diabetic conditions are usually present for years before they progress to diabetes, which provides an opportunity for screening and limiting the progression to diabetes. Both Australia and New Zealand currently have recommendations for screening programs for diabetes,94 which allow early detection and treatment. Impaired fasting glucose and impaired glucose tolerance affects more than 16% of Australians (5.8% with impaired fasting glucose and 10.6% with impaired glucose tolerance).81
Metabolic syndrome
Metabolic syndrome incorporates abdominal obesity, elevated blood glucose levels, hypertension and dyslipidaemia, all of which increase the progression to type 2 diabetes. In a similar manner to pre-diabetes discussed above, the progression from metabolic syndrome to diabetes is enhanced by unsuitable lifestyle choices and the diagnosis of this syndrome provides a window of opportunity to slow or prevent the development of diabetes. Note that these risks associated with metabolic syndrome are also important risks for cardiovascular diseases (see Chapter 23).
Physical inactivity
Undertaking 150 minutes of physical activity per week (as discussed above) is an important recommendation for the prevention of type 2 diabetes.92 Exercise can decrease the progression from impaired glucose regulation to diabetes95 by increasing the effectiveness of insulin at the target cells. However, most Australians do not achieve this level of activity — 70% of those aged 15 and over do not undertake the recommended amount of exercise.2
Physical activity is also particularly beneficial for those who already have diabetes, as it significantly improves glycaemic control in those with type 2 diabetes92 and makes glucose utilisation more efficient. Despite this, 75% of Australians who have been diagnosed with diabetes do not undertake the recommended level of physical activity (this is slightly worse than the overall national average of 70%).
Unhealthy diet
Unhealthy dietary choices were described above in relation to obesity and include an excessive intake of fats and simple sugars (or simple carbohydrates), combined with an inadequate intake of whole foods. Saturated fats decrease the function of insulin, so reducing saturated fat intake can decrease the risk of diabetes, thereby increasing the body’s ability to use insulin adequately.96 This can allow for improvements in glucose homeostasis.
Simple sugars are found in high amounts in processed and refined foods. Of particular interest are sugary carbonated soft drinks, which are energy-dense and rich in simple sugars. The amount of soft drinks being consumed in our society is sufficient to cause serious concern regarding health complaints — in a recent study, 4 out of 5 teenagers in New Zealand had consumed soft drink in the previous week and 1 in 4 toddlers aged 2–3 had consumed soft drink in the previous 24 hours.97 The high concentrations of sugars in products such as soft drinks can quickly result in high levels of hyperglycaemia. This requires increased secretion of insulin, which increases the likelihood of target cells developing resistance to the effects of insulin — the underlying pathophysiology of type 2 diabetes.
Tobacco smoking
Smoking increases the risk of developing diabetes and related conditions such as cardiovascular disease and damage to capillaries. Rates of smoking in males are lower in diabetics (16%) than in non-diabetics (27%), but more female diabetics smoke (24%) than non-diabetics (20%).92 Because approximately one-fifth of the population smoke, it is a substantial risk factor in our community.
Genetic factors
Type 2 diabetes runs in families and results from a combination of genetic susceptibility and environmental factors. Although the genetics of type 2 diabetes are complex and not clearly defined, the pathogenesis of type 2 diabetes involves genes that influence either cellular responses to insulin or beta cell function or viability, or both. A discussion on the genetic and lifestyle factors is in Chapter 37.
Childhood diabetes
The majority of children with type 2 diabetes are overweight or obese at the time of their diagnosis,93 which demonstrates the very strong link between obesity and diabetes. In addition to being overweight, the children usually have hyperglycaemia and glycosuria, but polyuria and polydipsia are much less common than in adult diabetes.93
Puberty increases the risk of developing diabetes, as this developmental period is characterised by a surge in growth hormone.93 As discussed previously, growth hormone increases blood glucose levels, which can contribute to hyperglycaemia and lead to diabetes. Many children are first diagnosed with type 2 diabetes around the onset of puberty.
Some children are diagnosed with maturity-onset diabetes of the young (MODY), which is a subset of type 2 diabetes. This condition has a strong association with genetic factors and it affects 50% of first-degree relatives.
The onset of type 2 diabetes in children and adolescents increases the risk of diabetic complications in adulthood. In particular, the blood vessels, which are particularly prone to diabetic changes, will have been exposed to the adverse consequences of hyperglycaemia for a much longer time than in those who develop type 2 diabetes later in adult life. Children with poorly controlled type 2 diabetes have high risk for macrovascular complications within a few decades.98 This means that they could be at a high risk of cardiovascular disease and stroke from approximately 30–35 years of age.
TREATMENT OF DIABETES
The goal of treatment of diabetes is restoration of euglycaemia (a normal blood glucose level) and correction of related metabolic disorders. Lifestyle changes are the cornerstone of effective management of type 2 diabetes. Dietary measures, including a restriction in total energy intake, are of primary importance in overweight individuals. In both type 1 and type 2 diabetes, the ratio of fats, carbohydrates and protein is important, and both cholesterol and saturated fats are restricted (see Table 35-14). High-fibre diets also improve diabetic control.51 As the obese individual with type 2 diabetes loses weight, the body’s resistance to insulin often diminishes so that weight loss results in improved glucose tolerance.
Table 35-14 NUTRITIONAL THERAPY FOR DIABETES MELLITUS
| FACTOR | TYPE 1 | TYPE 2 |
|---|---|---|
| Total kilojoules | Increased intake possibly necessary to achieve desirable body weight and restore body tissues | Reduction in intake desirable for overweight or obese patient |
| Effect of diet | Diet and insulin necessary for glucose control | Diet alone possibly sufficient for glucose control |
| Distribution of kilojoules | Equal distribution of carbohydrates through meals or adjustment of carbohydrates for insulin activity | Equal distribution recommended; low-fat diet desirable; consistency of carbohydrate at meals desirable |
| Consistency in daily intake | Necessary for glucose control | Desirable for weight reduction and moderation of blood glucose levels |
| Uniform timing of meals | Crucial for some insulin regimens | Desirable but not essential |
| Inter-meal and bedtime snacks | Frequently necessary | Not usually recommended |
| Nutritional supplement for exercise programs | Carbohydrates 20 g/h for moderate physical activities | May be necessary if patient is controlled on sulfonylurea |
Oral hypoglycaemic agents
Oral hypoglycaemic agents target a number of different mechanisms, but all depend on some level of secretion of insulin from the pancreas and so are effective only in type 2 diabetes. The sulfonylureas (e.g. glibenclamide) and meglinitides (e.g. repaglinide) act on the pancreatic beta cells to increase the secretion of insulin, while the sulfonylureas can also increase the response to insulin at the target tissues. The biguanides (e.g. metformin) and glitazones (e.g. rosiglitazone) increase glucose uptake and usage at target tissues. Acarbose can also be used to slow the digestion and absorption of carbohydrates from the digestive system, thereby slowing the rise in blood glucose level and limiting hyperglycaemia.
These agents can be associated with excessive lowering of blood glucose levels, resulting in hypoglycaemia that can become a life-threatening emergency (see below). It is essential that all patients receiving these drugs are adequately educated about how to manage this risk. The amount and timing of doses may need to be modified in conjunction with dietary changes to achieve glucose homeostasis. Taking medications with meals can lower the risk of hypoglycaemia.
Some of these drugs are contraindicated in those with liver disease, renal disease and the elderly. This can limit the options for pharmacological management of type 2 diabetes in many patients.
Insulin
Insulin is an essential medication for all type 1 diabetics, because destruction of their pancreatic beta cells results in an inability to produce their own insulin. For this reason, type 1 diabetes was previously referred to as insulin-dependent, as insulin medication is essential. There are no other processes within the body that can perform the role of insulin. Due to the progressive nature of type 2 diabetes, insulin therapy is used when oral medications fail to maintain euglycaemia. Insulin is often needed for control of gestational diabetes.
There are a number of different formulations of insulin based on their duration of action, from a rapid onset of action in 15 minutes through to a duration of more than 24 hours (see Figure 35-12). The choice of formulation and dosage depends on individual patient factors such as lifestyle, weight, diet, exercise and stress.
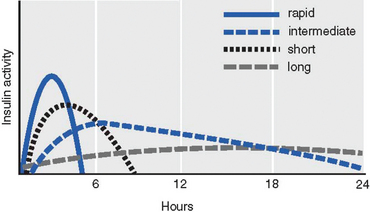
FIGURE 35-12 Insulin pharmacokinetics.
Curves indicate approximate times of onset, peak and duration of hypoglycaemic activity of the main types of insulin formulations.
Source: Based on Bryant B, Knights K. Pharmacology for health professionals. 2nd edn. Sydney: Mosby; 2007.
Insulin is a protein-based molecule, so it cannot be given orally or it would be digested along with proteins on reaching the stomach and small intestine and would not reach the blood as intact insulin. It is injected subcutaneously at a range of sites that are rotated around the abdomen and thighs (see Figure 35-13). Lipodystrophy is the hypertrophy or atrophy of subcutaneous tissue, which may occur in response to regular injections at the one location. It can cause erratic absorption of insulin medication, so rotation of injection sites is important.
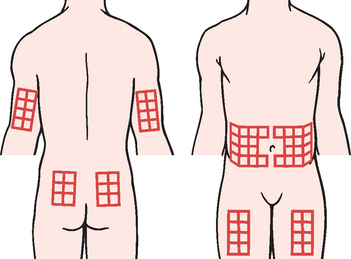
Complications of pharmacological treatments
The Somogyi effect is a unique combination of hypoglycaemia followed by rebound hyperglycaemia. The rise in blood glucose occurs because of counter-regulatory hormones (adrenaline, growth hormone, cortisol), which are stimulated by hypoglycaemia. They produce gluconeogenesis. Excessive carbohydrate intake may contribute to the rebound hyperglycaemia. The clinical occurrence of the Somogyi effect is controversial. It can be managed by lowering the dosage of insulin, as the original cause was hypoglycaemia.
The dawn phenomenon is an early morning rise in blood glucose concentration with no hypoglycaemia during the night. It is related to nocturnal elevations of growth hormone, which decrease the metabolism of glucose by muscle and fat. Increased clearance of plasma insulin may also be involved. Altering the time and dose of insulin administration manages the problem.
Monitoring blood glucose control
Diabetic patients soon become familiar with regularly testing their own blood glucose levels. A small self-test device known as a blood glucometer allows patients to monitor the effectiveness of their control measures. A pin-prick to the finger provides a drop of blood to be measured, so the test can be performed quickly and easily. If euglycaemia is not being achieved, the patient can alter their medication timing and dosage, as well as modifying diet and exercise.
Monitoring plasma glucose levels over time by measuring glycated haemoglobin gives an indication of the effectiveness of glucose control. This is used as a general indication of glycaemia over recent weeks, but it does not accurately reflect glucose control. In the normal 120-day life span of red blood cells, glucose molecules join haemoglobin, forming glycated haemoglobin. In an individual with persistent hyperglycaemia (poorly controlled diabetes), increases in the quantities of glycated haemoglobin (principally HbA1c) are noted. Levels less than or equal to 8% indicate good glucose control.99 Once a haemoglobin molecule is glycated, it remains that way. A build-up of glycated haemoglobin within the red cells reflects the average level of glucose to which the cells have been exposed during their life. Measuring glycated haemoglobin assesses the effectiveness of therapy by monitoring long-term (120 days) serum glucose regulation.
Approximately 75% of diabetics in New Zealand who reported for regular assessment had a result of less than or equal to 8%,100 which indicates good glucose control. The figure was slightly lower for the Maori and Pacific Islander people (60–70%).100 However, some caution should be applied when considering these statistics, as it is possible that those who are most attentive to managing their diabetes are the ones who participate in regular assessment.
Acute complications of diabetes mellitus
The major acute complications of diabetes mellitus are hypoglycaemia and two conditions associated with hyperglycaemia: diabetic ketoacidosis and hyperglycaemic hyperosmolar state (see Table 35-15).
Table 35-15 COMMON ACUTE COMPLICATIONS OF DIABETES MELLITUS
| HYPOGLYCAEMIA | DIABETIC KETOACIDOSIS | HYPERGLYCAEMIC HYPEROSMOLAR STATE |
|---|---|---|
| Those at risk | ||
| Predisposing factors | ||
| Typical onset | ||
| Presenting symptoms | ||
| Laboratory analysis | ||
Hypoglycaemia
Hypoglycaemia results when there is more insulin than required for the amount of glucose. Although it can occur in those with type 1 or type 2 diabetes, it occurs in more than 90% of cases of type 1 diabetes and is related to insulin treatment. Hypoglycaemia in diabetes is sometimes called insulin shock or insulin reaction when it occurs as a result of insulin medication. It can also occur if the amount of exercise is more than planned or if carbohydrate intake is inadequate.
Hypoglycaemia usually has a sudden onset. Mild hypoglycaemia consists of tachycardia, pallor, sweating (diaphoresis), tremors, hunger and restlessness. These signs occur when the blood glucose level drops to approximately 3.5–4.0 mmol/L.101,102 If the level drops to 2.5 mmol/L the hypoglycaemia can progress to brain damage, seizures, coma and death (see Figure 35-14).
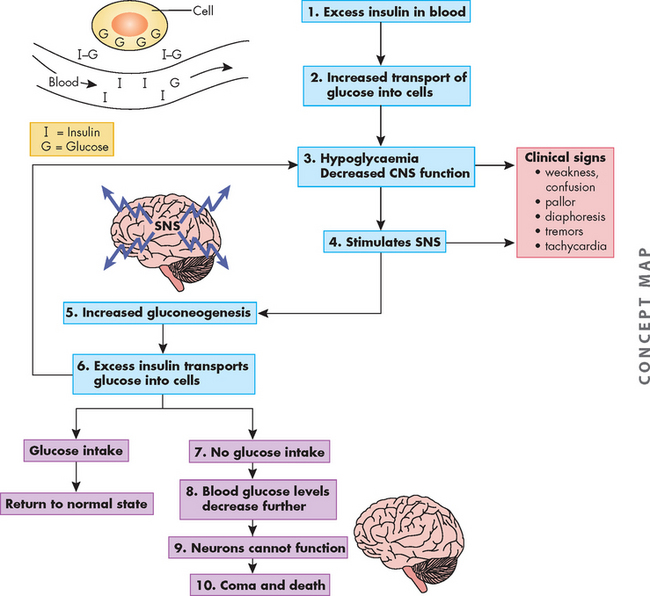
FIGURE 35-14 Hypoglycaemic shock.
Source: Gould BE. Pathophysiology for the health professions, 3rd edn, Philadelphia: Saunders; 2002.
The treatment of hypoglycaemia is to provide an immediate replacement of glucose — usually fruit juice containing glucose, honey placed under the tongue (allowing rapid absorption into the blood) or intravenous glucose used within the healthcare setting. An intramuscular dose of glucagon can be given to assist raising blood glucose levels if intravenous access is not quickly available. Prevention of hypoglycaemia is achieved with individualised treatment, blood glucose monitoring and education.
Hyperglycaemia
Hyperglycaemia is a clinical feature of diabetes. A gradual worsening of hyperglycaemia can lead to mental changes, fatigue, blurred vision, headache, nausea and vomiting. It may progress to seizures, coma and death. Treatment of hyperglycaemia involves administration of insulin or other oral hypoglycaemic agents. Two specific conditions relating to hyperglycaemia are diabetic ketoacidosis and hyperglycaemic hyperosmolar state.
Diabetic ketoacidosis
Diabetic ketoacidosis is a serious complication characterised by extreme hyperglycaemia (above 14 mmol/L) and usually occurs following a stress such as infection. It is related to a deficiency of insulin and an increase in the insulin counter-regulatory hormones (adrenaline, cortisol, glucagon, growth hormone). In response to these hormones, hepatic glucose production increases and peripheral glucose usage decreases, resulting in hyperglycaemia. Insufficient insulin leads to the breakdown of fat stores to be used as energy instead of glucose. However, ketones are released as a result of the fat breakdown. These ketones are acidic and hence the result is ketoacidosis (see Figure 35-15), with blood pH below 7.0 due to the acidic conditions (low pH = high amount of acid). High levels of ketones are also found in the urine.
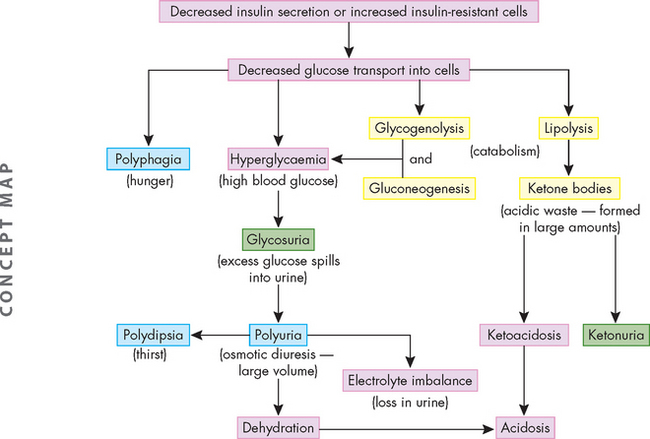
FIGURE 35-15 The development of diabetic ketoacidosis.
Source: Gould BE. Pathophysiology for the health professions, 3rd edn. Philadelphia: Saunders; 2002.
The resulting hyperglycaemia can cause an osmotic diuresis, as the high concentration of glucose in the blood draws water out of cells. As glucose passes through the kidneys and into the urine it also draws water into the urine, causing diuresis and leading to dehydration.
The classical symptom of this syndrome is acetone breath, where the breath smells sweet and fruity, somewhat like the smell of rotten apples. Other symptoms include an increased respiratory rate, nausea and vomiting. Thirst also occurs to counteract the dehydration. Diabetic ketoacidosis is a medical emergency that if untreated can lead to coma and death.
The key aspect of treatment is the replacement of insulin. In addition, fluids are administered to correct the dehydration and bicarbonate may be used to lessen the acidosis. The frequency of diabetic ketoacidosis peaks in adolescence,103 as it is more common in those with type 1 than type 2 diabetes. Approximately 1–5% of type 1 diabetics experience this condition.104
Hyperglycaemic hyperosmolar state
Hyperglycaemic hyperosmolar state (also previously known as hyperosmolar hyperglycaemic nonketotic syndrome) is an uncommon but significant complication of type 2 diabetes with a high overall mortality of approximately 15%.104 It occurs more often in elderly individuals, particularly in those with other co-morbidities such as infections, cardiovascular disease or renal disease. It is also associated with a high-carbohydrate diet and use of medications that impair the action of insulin.
Poor glucose control results in high levels of serum glucose (more than 30 mmol/L) and high serum osmotic pressures that lead to severe dehydration. Because of the large amount of glucose going through the kidneys and into urine, water is drawn into the urine, which can lead to hypovolaemia and hypotension (low blood volume and low blood pressure, respectively). As a consequence, the osmolality (or concentration) of the blood becomes extremely high, due to high levels of glucose and low amounts of water.
This syndrome is similar to diabetic ketoacidosis, as both are characterised by hyperglycaemia. However, in the hyperglycaemic hyperosmolar state, there is sufficient insulin to prevent breakdown of fat stores for production of glucose and therefore ketoacidosis is avoided. Hence blood pH can remain normal.
Hyperglycaemic hyperosmolar state is a medical emergency, as it can lead to drowsiness, stupor, coma and death. Treatment mandates aggressive fluid and electrolyte resuscitation and strict control of serum glucose levels.105
Chronic complications of diabetes mellitus
A number of serious complications are associated with all types of diabetes mellitus and relate to changes in the walls of blood vessels. Glucose changes the structure and function of proteins. Microvascular disease (affecting small capillaries) and macrovascular disease (associated with larger diameter vessels) occur, as well as neuropathies, as neurons are damaged by hyperglycaemia. Most complications are associated with metabolic alterations, primarily hyperglycaemia.106 Strict control of blood glucose significantly reduces complications. The range of organs that are affected by diabetes are shown in Figure 35-16. Even if the individual with diabetes has little experience of the severe acute complications, there is a strong likelihood of progressing to some debilitating chronic complications due to the progressive nature of this disease.
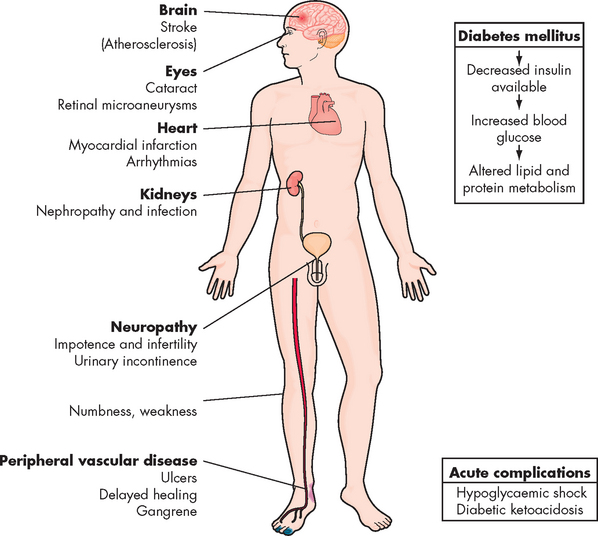
FIGURE 35-16 Organs affected by diabetes.
Source: Gould BE. Pathophysiology for the health professions, 3rd edn. Philadelphia: Saunders; 2002.
Cardiovascular disease
A profile of dyslipidaemia is common, which relates to the development of atherosclerosis. Elevated triglycerides and cholesterol are more prevalent in those with diabetes than those without the condition (see Figure 35-17). In addition, HDL, which tends to protect vessels, is present in only low concentrations in individuals with diabetes compared with non-diabetics. This overall lipid profile is more atherogenic in those with diabetes. As in the non-diabetic person, the presence of other risk factors, including hypertension, increases vulnerability to atherosclerosis (see Figure 35-18). Cardiovascular diseases are discussed fully in Chapter 23.
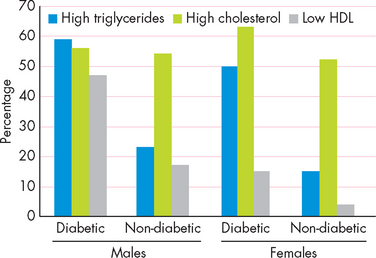
FIGURE 35-17 The percentage of Australians with dyslipidaemia.
Source: Australian Institute of Health and Welfare. Diabetes: Australian facts, 2008. Diabetes series no. 8. Catalogue no. CVD 40.

FIGURE 35-18 Diabetes mellitus and atherosclerosis.
Diabetes with its associated hyperglycaemia, relative hypoinsulinaemia, oxidative stress and pro-inflammatory state contributes to atherogenesis by causing arterial endothelial dysfunction (impaired vasodilation and adhesion of inflammatory cells), dyslipidaemia and smooth muscle proliferation.
Source: Charo IF, Ransohoff RM. The many roles of chemokines and chemokine receptors in inflammation. N Engl J Med 2006; 354(6):610–621; Heinecke JW. Lipoprotein oxidation in cardiovascular disease: chief culprit or innocent bystander? J Exp Med 2006; 203(4):813–816; Kaperonis EA et al. Inflammation and atherosclerosis. Eur J Vasc Endovasc Surg 2006; 31(4):386–393; Tedgui A, Mallat Z. Cytokines in atherosclerosis: pathogenic and regulatory pathways. Physiol Rev 2006; 86(2):515–581.
The risk of coronary heart disease for those with diabetes is higher than for the general population, even when hypertension and hyperlipidaemia are taken into account. Coronary heart disease is the most common cause of death in individuals with type 2 diabetes because of insulin resistance, high levels of LDL and triglycerides, low levels of HDL, platelet abnormalities and endothelial cell dysfunction.107 Mortality is high for both men and women. In general, the prevalence of coronary heart disease increases with the duration but not the severity of diabetes.
Myocardial infarction causes death in 20% of those with diabetes. In addition, the incidence of congestive heart failure is higher in individuals with diabetes, even without myocardial infarction. This may be related to the presence of increased amounts of collagen in the ventricular wall, which reduces the mechanical compliance of the heart during filling. Increased platelet adhesion and decreased fibrinolysis promote thrombus formation in persons with diabetes.108
Stroke
Stroke is much more common in those with diabetes than in the non-diabetic population (5% of those with diabetes and 2% of those without diabetes for people over 25).92 The survival rate for individuals with diabetes after a massive stroke is typically shorter than for non-diabetic individuals. Hypertension and hyperglycaemia are definite risk factors (see Chapter 23).
Visual disturbances
Diabetic retinopathy appears to be a response to retinal ischaemia resulting from blood vessel changes and erythrocyte aggregation and is influenced by growth hormone, metabolic control and activation of other metabolic processes. The prevalence and severity of the retinopathy are strongly related to the age of the individual and the duration of the diabetes. In comparison to type 1 diabetes, retinopathy appears to develop more rapidly in individuals with type 2 diabetes because of the likelihood of longstanding hyperglycaemia before diagnosis. The majority of individuals with diabetes will eventually develop retinopathy.
Diabetic retinopathy can be detected prior to the appearance of symptoms and early detection and treatment can prevent blindness.109 Approximately 75% of diabetics under the annual health assessment plan in New Zealand have had their eyes screened within the previous 2 years,100 but it should be remembered that those who are most attentive to glycaemic control are often the ones who undertake regular assessment. Regardless, regular visual screening should continue to be encouraged.
The stages of retinopathy are:
stage I: non-proliferative, characterised by an increase in retinal capillary permeability, vein dilation, microaneurysm formation and superficial (flame-shaped) and deep (blot) haemorrhages stage II: pre-proliferative, a progression of retinal ischaemia with areas of poor perfusion that culminate in infarcts stage III: proliferative, the result of neovascularisation and fibrous tissue formation within the retina or optic disc (see Figure 35-19).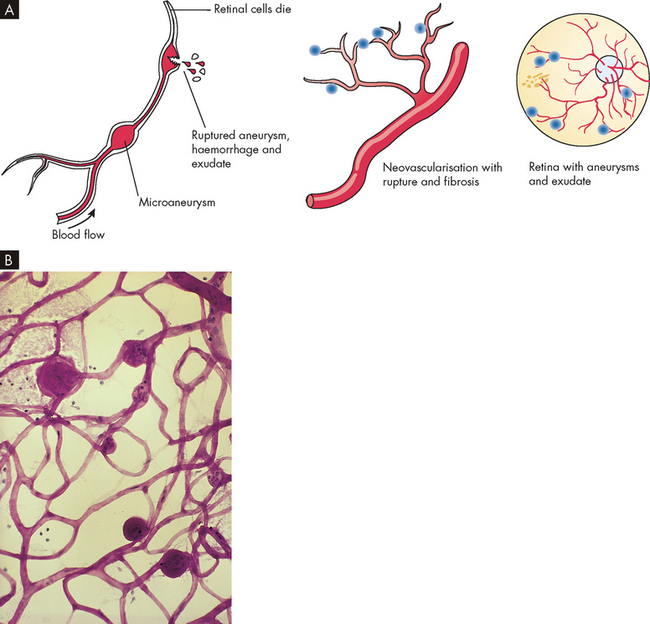
FIGURE 35-19 Diabetic retinopathy.
A Diabetic retinopathy in the eye. B Retina from a case of abnormal diabetic microangiopathy showing several aneurysms.
Source: Gould BE. Pathophysiology for the health professions, 3rd edn. Philadelphia: Saunders; 2002.
Traction of the new vessels on the vitreous humor may cause retinal detachment or haemorrhage into the vitreous humor. Macular oedema is the leading cause of decreased vision among individuals with diabetes. Hard exudates and microaneurysms can result in loss of vision. Blurring of vision can be a consequence of hyperglycaemia. In addition, hyperglycaemia causes some tissues such as the lens to accumulate sorbitol and this, coupled with decreased fluid in the lens, can also contribute to blurred vision. Cataract formation (see Chapter 6) and dehydration of the lens, aqueous humor and vitreous humor reduce visual acuity, leading to blindness.
Kidney damage
Renal failure is among the most debilitating complications of diabetes. Diabetes is the most common cause of terminal end-stage kidney disease (see Chapter 30). Diabetes is the cause of one-third of cases of end-stage kidney disease in Australia and is the main cause of renal dialysis in 39% of cases in New Zealand.82,92 The Australian Institute of Health and Welfare notes: ‘The burden of [end-stage kidney disease] from diabetes, particularly type 2 diabetes, is likely to increase further as both the age of the population and prevalence of diabetes are projected to rise.’92
In diabetes, there is microvascular destruction of the kidneys. The glomeruli are injured by protein denaturation by high glucose levels such that protein shape is altered. Other contributing factors to glomerular injury are hyperglycaemia with high renal blood flow (hyperfiltration) and intraglomerular hypertension exacerbated by systemic hypertension. Renal glomerular changes occur early in diabetes mellitus, occasionally preceding the overt manifestation of the disease. Progressive changes include glomerular enlargement, glomerular basement membrane thickening with proliferation of support cells. This results in diffuse intercapillary glomerulosclerosis (hardening of the glomerulus) and decreased blood flow. Alterations in glomerular membrane permeability occur with loss of negative charge and albuminuria.110
Microalbuminuria (small amounts of the protein alburin appearing in the urine) is the first manifestation of renal dysfunction. Continuous proteinuria generally heralds a life expectancy of less than 10 years. Before proteinuria, no clinical signs or symptoms of progressive glomerulosclerosis are likely to be evident. Later, hypoproteinaemia, reduction in plasma oncotic pressure, fluid overload, anasarca (generalised body oedema) and hypertension may occur. As renal function continues to deteriorate, individuals with type 1 diabetes may experience hypoglycaemia (because of loss of renal insulin metabolism), which necessitates a decrease in insulin therapy. As the glomerular filtration rate drops below 10 mL/min, uraemic signs, such as nausea, lethargy, acidosis, anaemia and uncontrolled hypertension, occur (see Chapter 30 for a discussion of chronic kidney disease). Impaired kidney function also accelerates retinopathy. Death from end-stage kidney disease is much more common in individuals with type 1 diabetes than in those with type 2 diabetes because the appearance of proteinuria in these individuals is strongly correlated with death from cardiovascular disease.
Liver disease
Fatty infiltration of the liver, called non-alcoholic steatohepatitis, is common and may result in hepatic failure and cirrhosis. While liver failure is a serious chronic condition, the progression and prevalence of complications in other organs is usually of greater concern.
Nervous system alterations
Diabetic neuropathy (neuron degeneration) is the most common cause of neuropathy in the Western world and is the most common complication of diabetes. The underlying pathological mechanism includes both metabolic and vascular factors related to hyperglycaemia. Glucose attaches to molecules, which changes their structure and function. In addition, because neurons do not require insulin for glucose entry, high levels of glucose can enter neurons from the blood. As a result, nerve degeneration and delayed conduction occur. Both somatic and peripheral nerve cells show diffuse or focal damage resulting in polyneuropathy. Sensory deficits and symptoms are more common than motor involvement. Common symptoms of neuropathy include numbness, tingling and decreased sensation in the feet. This can also contribute to lower limb disease (discussed below).
Some neuropathies are progressive, but many — such as painful peripheral neuropathy, mononeuropathy (wristdrop, footdrop), diabetic amyotrophy, diabetic neuropathic cachexia and visceral manifestations associated with autonomic neuropathy (e.g. delayed gastric emptying, diabetic diarrhoea, altered bladder function, orthostatic hypotension) — may spontaneously appear to improve. Neuropathy may occur during periods of ‘good’ glucose control and may be the initial clinical manifestation of diabetes. Chronic hyperglycaemia can also cause cognitive dysfunction.111
Infection
The individual with diabetes is at an increased risk for infection throughout the body due to:
Lower limb disease and amputation
The increased incidence of peripheral vascular disease, ulcers (see Figure 35-20), gangrene (tissue death) and amputation of the lower limb, foot or toes in the individual with diabetes has been well documented. Many individuals with type 2 diabetes have evidence of peripheral vascular disease at the time of their initial diagnosis.68 Individuals with diabetes are more likely to have atherosclerosis that appears at a younger age and advances more rapidly than vascular changes that appear in non-diabetics. Age, duration of diabetes, genetics and additional risk factors influence the development of peripheral vascular disease.
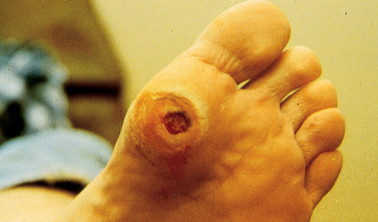
FIGURE 35-20 Classic neuropathic diabetic foot ulcer.
Source: Gould BE. Pathophysiology for the health professions, 3rd edn. Philadelphia: Saunders; 2002.
Neuropathy and decreased sensation, combined with increased susceptibility to infection, contribute to lower limb disease. Because of occlusions of the small arteries and arterioles, most gangrenous changes of the lower extremities occur in patchy areas of the feet and toes (see Figure 35-21).112 The lesions begin as ulcers and progress to osteomyelitis (bone infection) or gangrene requiring amputation.113 Significant morbidity and mortality are associated with major amputation. Approximately half of all lower-limb amputations in New Zealand are due to diabetes.100
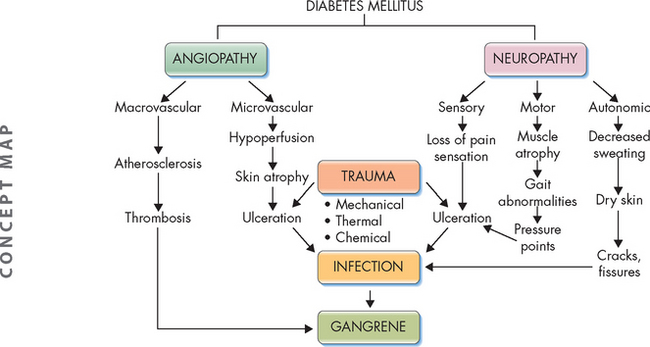
Mechanisms of microvascular disease and macrovascular disease
Microvascular disease due to hyperglycaemia results from thickening of the capillary basement membrane and endothelial hyperplasia (enlarged cells), which emerges over 1–2 years. Decreased tissue perfusion and hypoxia eventually result. The development of this process appears to be proportional to the duration of the disease (more or less than 10 years) and blood glucose levels. Microvascular disease occurs in the retinas and kidneys. If carefully evaluated at the time of presentation, many individuals with type 2 diabetes will be found to have microvascular complications because of the long duration of asymptomatic hyperglycaemia that generally precedes diagnosis. This underscores the need to screen adults for diabetes.
Macrovascular disease causes morbidity and mortality, particularly among individuals with type 2 diabetes. Unlike microangiopathy, atherosclerotic disease is unrelated to the severity of diabetes and often is present in those with merely an impaired glucose tolerance.114 (Atherosclerosis is discussed in Chapter 23.) Atherosclerosis has many contributing factors. Molecules with glucose attached are deposited in the walls of blood vessels and promote changes leading to atherosclerosis (see Figure 35-18).115
Mortality
There is a higher mortality rate associated with diabetes than in those without diabetes. Over 5 years, people with previously diagnosed diabetes are twice as likely to die as those with normal glucose tolerance.83 In Australia, diabetes is the underlying or an associated cause of death in 9.5% of deaths and is the seventh leading cause of death.37 Similarly, in New Zealand almost 6% of all deaths are directly attributable to type 2 diabetes.84 Diabetes accounted for 5.5% of the total burden of disease and injury in Australia in 2003 — 5.1% being due to type 2 diabetes, which is clearly the main concern.38
UNDERSTANDING THE RELATIONSHIP BETWEEN OBESITY AND DIABETES MELLITUS
A number of risk factors are common to obesity and diabetes, such as an unhealthy diet, physical inactivity, smoking and dyslipidaemia. It therefore comes as no surprise to learn that obesity and diabetes often develop together. In many people, an increased waist circumference is the first major step in the process of developing diabetes. Modifying risk factors associated with either diabetes or obesity will usually improve the other condition too.
The discussion on these condtions demonstrates that both obesity and diabetes are also strongly related to cardiovascular disease (see Chapter 23) and renal disease (see Chapter 30). The development of coronary heart disease is a major complication common to both obesity and diabetes. Coronary heart disease is one of the main causes of morbidity and mortality in contemporary Australia and New Zealand, and this highlights the importance of understanding the progression from obesity and diabetes.
Diabetes attracts not only the inconvenience of a lifelong commitment to controlling and monitoring blood glucose levels, but also substantial health risks such as end-stage kidney disease and lower limb amputations. This is a chronic debilitating disease that has substantial effects on the affected individual and the healthcare system.
In recent years, life expectancy has been increasing, largely due to a decrease in cardiovascular risks such as cholesterol, hypertension and smoking. However, the recent surge in the incidence of obesity has led to a lowering of life expectancy.116 In fact, one estimate is that obese individuals have a life expectancy 7 years shorter than those of a healthy weight.117 Having a lower life expectancy in an era of great modern medicine and research is of grave concern. Efforts to improve education about and modification of risk factors of obesity, cardiovascular disease and diabetes are necessary in order to develop healthier communities. This requires making changes in patients’ attitudes and their perceived ability to actually improve their own condition.118 This is the challenge for healthcare professionals.
Evaluation of body size
Body mass index (BMI) is a commonly used tool to classify someone’s body size using height and weight measurements. A BMI of 20–25 is considered normal weight and a BMI greater than 25 as overweight. Of those who are overweight, those with a BMI above 30 are more specifically classified as obese.Obesity
An unhealthy diet increases the risk of becoming overweight and obese. An unhealthy diet includes increased consumption of energy-dense foods and decreased consumption of fruits and vegetables. Some metabolic disorders increase the likelihood of weight gain. Both genetic factors and lifestyle factors are involved in the development of obesity. Abdominal fat is physiologically unique compared with fat from other areas of the body, as it is much more metabolically active in its involvement with other body processes. It places the individual at higher risk of health complications than do gluteal fat stores. Adipose cells have a range of functions that extend well beyond merely storing excess energy. They secrete adipocytokines that signal to other body systems in a manner similar to hormones. The hypothalamus contains a control centre for the regulation of appetite and food intake. This centre receives information from the cerebral cortex (conscious thought), hormones and neural signals from the digestive system and is also influenced by leptin from adipose cells. Other disorders associated with obesity include gallbladder disease, liver disease and osteoarthritis. Dietary changes and physical activity are essential in weight loss and maintenance of weight in the longer term. Dietary changes for losing weight include decreasing intake of energy-dense foods and increasing intake of fruits, vegetables and fibre. Physical activity should be increased to at least moderate levels, with further increases causing further weight loss. Pharmacological agents and surgical treatment may be needed to help some obese patients to lose weight, particularly those with other co-morbidity risks.Metabolic syndrome
Diabetes mellitus
Diabetes mellitus results when there is insufficient insulin (or insufficient insulin response) to the effects of hyperglycaemia. Fasting blood glucose levels and the oral glucose tolerance test are used to diagnose diabetes. Some patients will be classified as having a pre-diabetic condition, whereby their ability to maintain glucose homeostasis is no longer normal but has not yet progressed to type 2 diabetes. Insulin resistance occurs as insulin is no longer as effective at the target cells. The pancreas can respond to the hyperglycaemia by increasing secretion of insulin, but the insulin resistance means that most glucose remains in the blood. Obesity is a strong risk factor for the development of diabetes. Obesity can result in insulin resistance as well as other cellular changes. Pre-diabetes is an important early indicator of developing diabetes. If detected early, it allows individuals to modify their lifestyle to reduce the likelihood of becoming diabetic. While physical inactivity is a risk for becoming diabetic, most people in our community do not undertake recommended levels of exercise. Unhealthy diet is strongly linked to the progression of diabetes. Tobacco smoking and genetic factors can also contribute. Oral hypoglycaemic agents can work through a number of mechanisms. Sulfonylureas and biguanides are used commonly. Hypoglycaemia is a risk associated with some of these agents. Insulin is essential for all type 1 diabetics and may also be needed for those with type 2 diabetes. Insulin formulations can be short or long acting and are targeted to the needs of the individual. Monitoring blood glucose control adequately allows minimisation of adverse effects associated with hypoglycaemia and hyperglycaemia. Hypoglycaemia usually has a sudden onset and is characterised by tachycardia, sweating and restlessness and may progress to seizures, coma and death. Treatment requires an immediate source of glucose, preferably into the bloodstream. Diabetic ketoacidosis results with hyperglycaemia and increased release of fats into the blood as a fuel source. The classic symptom is acetone breath and treatment is immediate replacement of insulin to prevent coma and death. The hyperglycaemic hyperosmolar state results with hyperglycaemia but does not have ketoacidosis. It requires rehydration and electrolyte resuscitation to prevent coma and death. Cardiovascular disease is a main complication of diabetes, with a substantial association with morbidity and mortality. Visual disturbances are characteristic in diabetes and may include diabetic retinopathy, cataracts and blindness. Kidney damage can be severe in diabetes, resulting in end-stage renal disease, which is a main cause of death for diabetics. Diabetic neuropathy causes disturbances in neuronal function that occur particularly with sensory neurons. The effects can be widespread.Peter is 58 years old and has recently been diagnosed with metabolic syndrome. His waist circumference is 98 cm and his blood pressure is 135/85. Results from blood tests show triglycerides 1.9 mmol/L, HDL 0.99 mmol/L and fasting plasma glucose level 5.4 mmol/L. Peter has been told that he needs to make some important changes to his lifestyle, such as having takeaway foods only occasionally and starting an exercise regimen. Peter has never really been interested in being healthy and it is your role to assist him to understand why these lifestyle changes are necessary.