Nutrition and Energy Balance
Learning objectives
After reading this chapter you should be able to:
 Describe mechanisms controlling food intake.
Describe the role of AMP-activated kinase in maintaining cellular energy balance.
Identify the main categories of nutrients and essential nutrients within these categories.
Relate your knowledge of energy metabolism to current nutritional recommendations.
Introduction
From the biochemical point of view, nutrition is an essential interaction of the organism with the environment. Nutrition underpins health and affects susceptibility to disease; malnutrition and obesity are both associated with health risks.
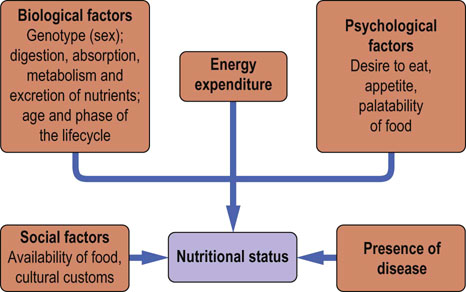
Nutritional status is determined by biological, psychologic and social factors
Factors that determine nutritional status of an individual are the genetic background, the environment, the phase of the life cycle, the level of physical activity and the presence or absence of illness (Fig. 22.1). Nutritional status is also influenced by the availability of food, its palatability and variety. Nutritional deficiencies may result from dietary inadequacies or from genetically determined metabolic errors.
Regulation of food intake
Food intake is controlled by hunger (a desire to eat) and appetite (a desire for a particular food)
The main centers regulating appetite are located in the hypothalamic arcuate and paraventricular nuclei in the central nervous system (CNS). In humans the arcuate nucleus area is known as the infundibular nucleus. The brain regulates energy homeostasis and is also the primary regulator of body weight (Fig. 22.2). Signals controlling energy intake originate from the adipose tissue and are sent to the central nervous system. These signals are mediated by the adipokine leptin and by insulin. In response, the brain sends efferent signals through a complex network of neuropeptides. These regulate appetite and hunger. The neurons in the arcuate nucleus express two neuropeptides: catabolic proopiomelanocortin (POMC), and anabolic neuropeptide Y (NPY). POMC is cleaved, yielding melanocortins such as α-MSH, that decrease food intake. On the other hand, NPY expression increases when adipose tissue is depleted, and when there is a decrease in leptin. NPY links to neurons expressing melanin-concentrating hormone (MCH) and orexins A and B. They, in turn, are involved in the control of food intake by acting on brainstem neurons. These neurons connect with the brain cortex (the satiety center) to promote hunger and to stimulate yet another set of hormones such as thyreoliberin (TRH), corticoliberin (CRH) and oxytocin. Thyreoliberin increases thermogenesis and food intake, whereas corticoliberin decreases food intake and, through the sympathetic activity, increases energy expenditure. Further signals that control food intake are conveyed by gastrointestinal peptides such as glucagon, cholecystokinin, glucagon-like peptide, amylin and peptide YY. Ghrelin, secreted by the stomach, stimulates NPY-expressing neurons. It is the only known appetite-stimulating peptide. Gastric stretch also affects food intake. Finally, hypoglycemia decreases the activity of the satiety center.
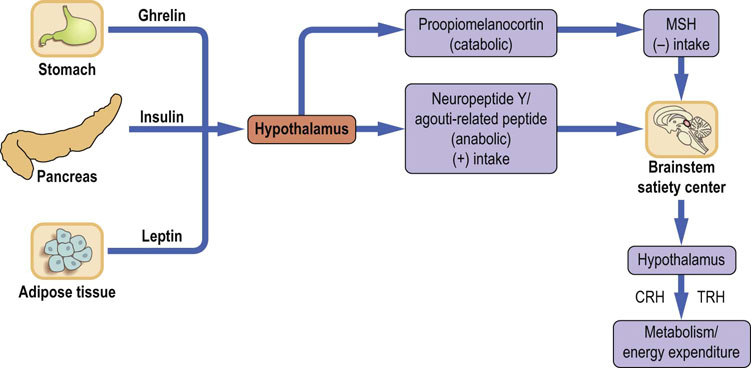
Fig. 22.2 Regulation of food intake.
Regulation of food intake is accomplished by signals generated in the adipose tissue, pancreas, stomach and the brain. The hypothalamus translates signals related to the energy balance into eating behavior through secretion of a range of neuropeptides. The (+) sign means action leading to increase of appetite and food intake, and the (−) sign to a decrease. CRH, corticoliberin; TRH, thyreoliberin; MSH, melanocyte-stimulating hormone.
The endogenous cannabinoid system
The hypothalamus and brainstem translate the information about energy balance into eating behavior. This involves the endogenous cannabinoid system. Endocannabinoids are compounds synthesized from membrane phospholipids. They include Δ9-tetrahydrocannabinol and anandamide formed as a result of hydrolysis of N-arachidonylphosphatidyl ethanolamine by phospholipase D. Endocannabinoids are released at the synapses and bind to the synaptic receptors called CB1. The receptors are present in the central nervous system and also in gut, adipose tissue, liver, muscle and pancreas. They are coupled to G-proteins and adenylate cyclase, and also regulate potassium and calcium channels. The binding of endocannabinoids to the receptors modulates release of neurotransmitters such as GABA, noradrenaline, glutamate and serotonin. Hypothalamic levels of endocannabinoids increase during food deprivation.
 Clinical box The ABC of emergency treatment
Eating and drinking, like breathing, link living organisms with the environment. To survive we need oxygen, water and nutrients. One can exist without oxygen for minutes only. Without water the survival time is days. With these two supplied, a human can survive without food for between 60 and 90 days.
Consequently, these considerations determine the urgency of treatment in critical situations. Re-establishment of oxygen supply and circulating volume is the first priority (The ABC of resuscitation: Airway, Breathing, Circulation). Repletion of lost fluid and electrolytes is also necessary within hours to days, depending on the state of the patient. Provision of other nutrients becomes important as soon as the life-saving measures have been taken. The rule of thumb is that patients unable to eat would need nutritional support if they have been (or will be) unable to take food for more than 7 days. This period is shorter in hypercatabolic persons.
Regulation of energy balance
Adipose tissue is an active endocrine organ
Adipose tissue, far from being an inert depot of storage fat, is an active endocrine organ (Fig. 22.3). Its products are known as adipokines. This endocrine activity influences development of obesity and conditions such as insulin resistance. The two major adipokines secreted by the adipose tissue are leptin and adiponectin.
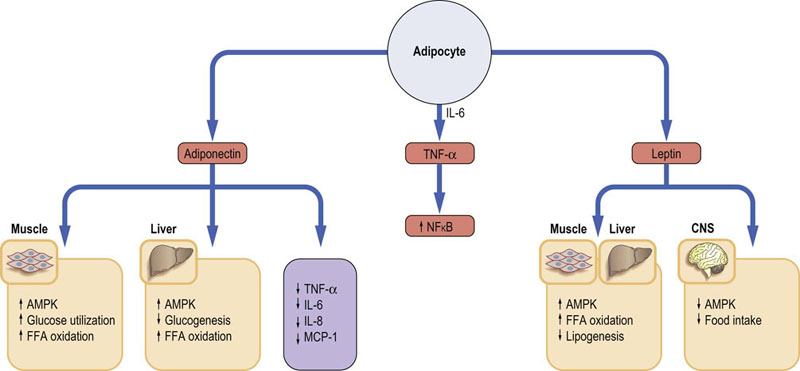
Fig. 22.3 Endocrine activity of the adipose tissue.
Adipose tissue produces adipokines. Leptin and adiponectin play an essential role in adjusting metabolism to body energy needs. They activate the energy sensor enzyme, AMP-activated kinase (AMPK). Adipocytes also secrete a range of proinflammatory cytokines such as TNF-α or IL-6. TNF-α is known to stimulate NFκB, a key transcription factor in the induction of genes involved in the inflammatory response. FFA, free fatty acids; CNS, central nervous system; IL, interleukin; MCP-1, monocyte chemoattractant protein 1; TNF-α, tumor necrosis factor α.
Leptin regulates adipose tissue mass and responds to the energy status
Leptin is a 16 kDa protein. Its secretion is linked to the adipose tissue mass and to the size of adipocytes. Acting in the central nervous system it decreases food intake. It also acts on the skeletal muscle, liver, adipose tissue and pancreas. Leptin gene expression is regulated by food intake, energy status, hormones and inflammatory state. It affects metabolism by stimulating fatty acid oxidation and by decreasing lipogenesis. Importantly, it also decreases ectopic deposition of fat in liver or muscle.
Leptin signals through a membrane receptor that has an extracellular binding domain and intracellular tail. Its signaling pathways involve the Janus kinase and signal transducer and activator of transcription (JAK/STAT; Chapter 40). Mitogen-activated protein kinase and phosphatidyl-inositol 3′ kinase are also involved, as is the AMP-activated kinase (AMPK).
Adiponectin increases insulin sensitivity. Its lack leads to insulin resistance
Adiponectin is a 244 amino acid protein with a structural homology with collagens type VIII and X and with complement factor C1q. Several forms exist in the circulation: globular, trimeric and high molecular weight. Adiponectin stimulates glucose utilization in muscle and increases fatty acid oxidation in muscle and liver, thus increasing insulin sensitivity. It also decreases hepatic glucose production. Low adiponectin levels are linked with insulin resistance and with hepatic steatosis. Adiponectin downregulates secretion of proinflammatory cytokines interleukins 6 and 8 (IL-6 and IL-8) and monocyte chemoattractant protein-1 (MCP-1).
Physical training increases adiponectin expression and upregulates its receptors in the skeletal muscle. On the other hand, its concentration decreases in obesity and in type 2 diabetes. Low levels of adiponectin are also associated with low-grade inflammation, oxidative stress and endothelial dysfunction. Adiponectin receptors activate the AMPK, p38 mitogen-activated protein kinase, and PPARα which in turn regulates fatty acid metabolism (Chapter 21).
Adipose tissue secretes proinflammatory cytokines
Adipose tissue secretes the proinflammatory cytokines-tumor necrosis factor α (TNF-α) and IL-6. TNF-α is highly expressed in obese animals and humans, and it also induces insulin resistance and type 2 diabetes. TNF-α activates the proinflammatory NFκB pathway.
AMP-stimulated kinase (AMPK) responds to cellular energy levels
The AMPK is a serine-threonine kinase. It is a heterotrimer encoded by three genes: it has a catalytic subunit α and two regulatory subunits, β and γ. It is activated by phosphorylation by a kinase known as LKB1, which is a tumor suppressor molecule. The key activator of the AMPK is cellular accumulation of 5′-AMP and the increase the ratio of 5′-AMP/ATP. A high creatine/phosphocreatine ratio also activates the enzyme. High 5′-AMP concentration induces allosteric changes and the phosphorylation of the AMPK catalytic subunit. The AMP is generated in the myokinase (adenylate kinase) reaction:

AMPK stimulates energy-producing pathways and suppresses energy-utilizing ones
In the skeletal muscle, AMPK activation promotes glucose transport, glycolysis and fatty acid oxidation. On the other hand, It inhibits fatty acid synthesis by phosphorylating (and inactivating) acetyl-CoA carboxylase. This leads to a decrease in malonyl-CoA, and to disinhibition of carnitine palmitoyl transferase 1 and consequent facilitation of fatty acid transport into mitochondria. The increased fatty acid oxidation prevents tissue lipid accumulation. In the liver, AMPK inhibits lipogenesis and cholesterol synthesis (the latter by phosphorylation and inactivation of HMG-CoA reductase); its activation suppresses the sterol regulatory element-binding protein 1c (SREBP1c; Chapters 16 and 18).
In the skeletal muscle, AMPK is activated during exercise and is involved in contraction-stimulated glucose transport and fatty acid oxidation (exercise increases insulin sensitivity). In the heart it is activated by ischemia.
The AMPK also acts at the hypothalamic level. The expression of AMPK in the hypothalamus reduces food intake. Leptin and adiponectin stimulate AMPK in the skeletal muscle, liver and adipose tissue. Insulin and leptin inhibit it in the hypothalamus. The antidiabetic drugs such as thiazolidinediones and biguanides act in part through AMPK (Chapter 21). The effects of AMPK activation are summarized in Figure 22.4 (see also Box on p. 98).
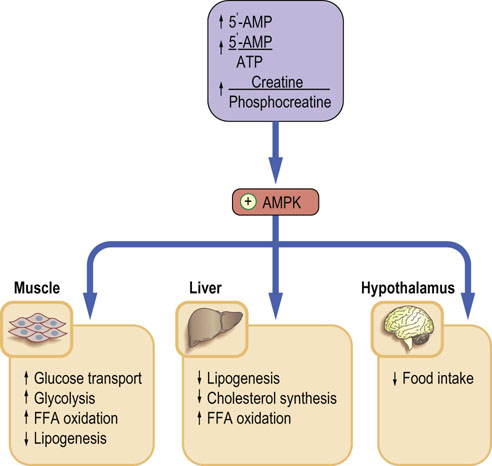
Fig. 22.4 AMP-activated kinase (AMPK).
AMPK fulfills the role of a sensor of cellular energy levels. Its main stimulator is the increase in 5′-AMP. An increased 5′-AMP/ATP ratio signals low cellular energy level. Activated AMPK phosphorylates rate-limiting enzymes in energy-producing and energy-using pathways. The final effect is inhibition of energy-utilizing pathways such as lipogenesis or cholesterol synthesis, and stimulation of pathways that generate energy: glycolysis and FFA oxidation. FFA, free fatty acids.
Energy expenditure
Total daily energy expenditure is a sum of the basal metabolic rate, the thermic effect of food and the energy used up during physical activity.
Energy expenditure can be measured by direct calorimetry, which relies on measurements of heat production. Indirect calorimetry is based on the measurement of the oxygen consumption rate (VO2). The ratio of VCO2 to VO2 is known as the respiratory exchange rate (RER) or respiratory quotient. For carbohydrates, RER = 1; for fat, RER = 0.7.
Basal metabolic rate (BMR) is energy expenditure required to maintain body function at complete rest
The BMR depends on sex, age and body weight. At rest, energy is required for membrane transport (30% of the total), protein synthesis and degradation (30%), and for maintaining temperature, physical activity and growth. Certain organs use particularly high amounts of energy: in a 70-kg person, brain metabolism constitutes approximately 20% of basal metabolic demand, liver 25% and muscle 25%. On the other hand, in very low birth weight babies, the brain is responsible for as much as 60% of the BMR, liver for 20% and muscle for only 5%.
In health, physical activity is the most important changeable component of energy expenditure
The level of activity is normally expressed as metabolic equivalents of task (METs). METs use a reference value for resting metabolism of 1 kcal/kg/h and activities are multiples of these. As both at rest and during activity the metabolism is dependent on the mass of the individual, which allows the intensity and energy expenditure to be compared between people of different weight (the ratio of energy expenditure during the activity to resting metabolism will remain unchanged). Examples of energy expenditure associated with different activities are given in Table 22.1. Energy requirement also depends on sex and age (Table 22.2).
Table 22.1
| Physical activity ratio | Example of activity |
| 1.3 | Watching TV, reading, writing |
| 2.0 | Dressing and undressing, making beds, walking slowly |
| 2.3 | Washing dishes, ironing |
| 2.5 | Dusting and cleaning, cooking |
| 4.5 | Cleaning windows, golf, carpentry |
| 6.5 | Jogging, digging and shoveling |
| 8.0 | Climbing stairs, cycling, football, skiing |
Energy expenditure is expressed as metabolic equivalents of task (METs, i.e. multiples of the expenditure at complete rest.).
Table 22.2
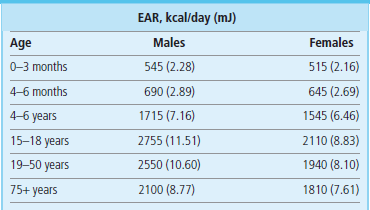
Estimated average requirements (EAR) for energy for selected age and sex groups. Data from Dietary Reference Values for Food Energy and Nutrients for the United Kingdom; Report of the Panel on Dietary Reference Values of the Committee on Medical Aspects of Food Policy, London: TSO 2003.
Nutrigenomics
Individual response to nutrients is to a substantial extent determined by genetics. Genes influence digestion and absorption of nutrients, their metabolism and excretion. Perceptions such as taste or satiety are also, to an extent, genetically determined. This has consequences for nutritional guidelines: because the gene pool varies between populations, optimal nutritional guidelines should be population-specific, rather than general. Nutrigenomics has large potential implications for future nutritional interventions. It is analogous to pharmacogenomics: it aims to exploit the knowledge accumulated by the Human Genome Project, and the ability to monitor the expression of a large number of genes, to devise individual dietary treatments customized to genetic background. Metabolomics, the monitoring of metabolic response patterns to nutrients, offers further opportunities to determine individual nutrition profiles (Chapter 36).
Genotype influences plasma concentrations of nutrients
An example of the genotype effect on nutrient intake is the response of plasma cholesterol concentration to its dietary content. Approximately 50% of individual variation in plasma cholesterol is genetically determined. Response to a cholesterol-containing diet is associated with the apoprotein E (apoE) genotype. ApoE is a protein synthesized in the liver, and is the main metabolic driver of the lipoprotein remnant particles (Chapter 18). It exists in several isoforms coded by alleles designated ε2, ε3 and ε4. It has been observed that plasma cholesterol concentration increases on low-fat/high-cholesterol diet in people with the E4/4 but not E2/2 phenotype.
There are many examples of nutrients affecting gene expression. For instance, the activities of key hepatic enzymes differ in persons on a long-term high-fat diet compared to a high-carbohydrate diet. The amount of dietary cholesterol affects the activity of HMG-CoA reductase. Polyunsaturated fatty acids inhibit the expression of fatty acid synthase and the ω-3 fatty acids (see below) reduce the synthesis of mRNA coding for the platelet-derived growth factor (PDGF) and the inflammatory cytokine interleukin 1 (IL-1). In essential hypertension, sensitivity to dietary salt is controlled, at least to an extent, by the angiotensinogen gene variants. Only 50% of patients are sensitive to salt intake: 30–60% of blood pressure variation is genotype-related.
Genetic regulation of food intake and energy expenditure
Obesity is concordant in 74% between monozygotic, and 32% between dizygotic twins. The current obesity epidemic has prompted a search for genes which control energy expenditure and food intake. Large population studies have been used to look for a relationship between changes in genes and body weight. As there is a close relationship between the body mass of members of the same family, and especially identical twins, it is estimated that 40–70% of the differences in the predisposition to obesity can be explained by genetics.
Changes within two genes have been found to be associated with obesity: fat mass and obesity-associated protein (FTO) and melanocortin-4 receptor (MC4R). FTO is expressed in the arcuate nucleus in response to hunger, and is therefore thought to have an effect on body mass via the control of food intake. MC4R is a ligand for melanocortins in the arcuate nucleus that control food intake. These effects have been shown in a study where participants who had variations in their FTO gene which were associated with obesity picked food with a higher energy content from a lunch buffet, compared to participants who did not have these genetic variants. However, in the general population, variation in FTO and regions near MCR4 genes only account for an increase in body mass of 0.39 kg/m2 and 0.23 kg/m2, respectively, so go no way towards explaining the current obesity epidemic. No genes associated with energy expenditure have been found to date.
Nutrition, life cycle and metabolic adaptation
The demand for nutrients is affected by both physiology and disease. Pregnancy, lactation, and growth (in particular the intensive growth in utero, growth during infancy and the adolescent growth spurt) are the three most important physiologic states associated with increased demand for nutrients.
Pregnancy is an example of metabolic adaptation termed expansive adaptation
Here the body of the mother adapts to carrying the fetus and supplying it with nutrients. Around the time of conception the mother's body prepares for the metabolic demands of the fetus. In early pregnancy the mother sets up the ‘supply capacity’ and later in pregnancy such supply takes place. Ninety percent of fetal weight is gained between the 20th and 40th weeks of pregnancy and the steepest growth is established between the 24th and 36th weeks. The total amount of energy stored during pregnancy is about 70,000 kcal (293,090 kJ), amounting to approx 10 kg of weight.
Nutrient intake changes during the life cycle
After delivery there is a transition from feeding through the placenta to breastfeeding and then, gradually, the baby adapts to a free diet. Up to the breastfeeding stage, nutrition is controlled by substrates and the infant is entirely dependent on the mother for nutrition. Later, the growth hormone assumes a major role in directing development. At school age, new eating and activity patterns emerge as a child learns to be independent from its parents. This continues during adolescence. At this stage, sex hormones begin to play a prominent developmental role. In adulthood, muscle mass increases between 20 and 30 years of age and at that point the level of physical activity stabilizes. Thereafter, muscle mass starts to decline and the fat mass starts to increase. This accelerates after the age of 60. The bone mass also declines with age.
When nutrients are in short supply, either because of increased nutritional need or reduced availability of food, the so-called reductive adaptation takes place: the metabolic rate falls and the desire to eat decreases. This limits weight loss.
Main classes of nutrients
The main nutrients are carbohydrates (including fiber), fats, proteins, minerals and vitamins. Carbohydrates, proteins, fat, fiber and some minerals are macronutrients. Vitamins and trace metals are micronutrients (Chapter 11). Caloric value of the main nutrients is given in Table 22.3. The functions of nutrients are summarized in Figure 22.5.
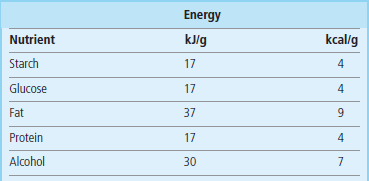

Fig. 22.5 The functions of nutrients.
All main classes of nutrients can be used to produce energy, and all contribute to the synthesis of more complex compounds. The main role of vitamins and minerals is participation in enzymatic reactions either as cofactors or components of enzyme prosthetic groups.
Carbohydrates
Carbohydrates and fats are the most important energy sources. Carbohydrates also are precursors of glycoproteins, glycolipids, and mucopolysaccharides. Dietary carbohydrates include refined carbohydrates such as sucrose in sweets, drinks and fruit juices, and complex carbohydrates such as starch, present in grains and potatoes. Fiber is carbohydrate which is indigestible by the human gut, such as cellulose, hemicellulose, lignin, pectin, and β-glucan. Fiber is present in unprocessed cereals, legumes, vegetables, and fruits. Its main role is to regulate gut motility and transit.
Glycemic index and glycemic load provide quantitative and qualitative insight into handling of carbohydrate-containing foods
The glycemic index (GI) is the system of ranking of the carbohydrate-containing foods according to the degree of increase in blood glucose which takes place after their ingestion. Procedure that underpins the ranking is similar to the oral glucose tolerance test. The effect of a standard dose (25 g or 50 g) of a particular food on plasma glucose concentration is tested and compared to the reference nutrient (e.g. glucose). The comparison is based on the ratio of the area under curve (AUC) for the tested nutrient and glucose.

The GI is expressed on a scale of 1 to 100 (low GI is 0–55, moderate 56–69, and high >69). Foods that are rapidly absorbed and digested have a high GI. Slower absorption and digestion yield low GI. The GI is affected by the nature of food, and the type of starch, but also by the cooking method (i.e. the GI of lightly cooked spaghetti will have lower GI lower than that cooked for a longer period). The low GI foods control postprandial glycemia and insulinemia, and are beneficial for people with diabetes, and better for weight control. Note that low GI foods tend to be high in fat, and low in carbohydrate and fiber.
The derivative of the GI is the glycemic load. It translates the qualitative information contained in the GI into qualitative, which can be used to calculate the carbohydrate content of a given portion of food.

Proteins
Dietary proteins are digested to their component amino acids. Amino acids are then used as a material to build the host's own proteins. They also serve as the ‘last resort’ energy substrate: the catabolic state is typically associated with release of muscle amino acids, and thus muscle wasting. Due to the different composition of animal and plant proteins, eating no animal products at all may lead to nutrient deficiencies such as those of vitamin B12, calcium, iron, and zinc. Similarly to energy requirements, protein requirements change during the life cycle (Table 22.4). Increased demand for dietary protein is associated with pregnancy, lactation and the adolescent growth spurt.
Table 22.4
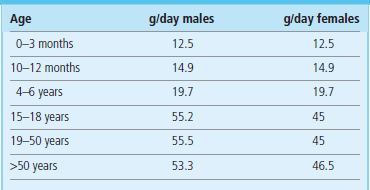
Protein requirements are age and sex dependent. Here reference nutrient intakes (RNI) for selected age groups are shown. Data from Dietary Reference Values for Food Energy and Nutrients for the United Kingdom; Report of the Panel on Dietary Reference Values of the Committee on Medical Aspects of Food Policy, London: TSO 2003.
Fats
Fats are the most important nutrients used for energy storage. Lipids also provide thermal insulation for the organism. They are essential components of biological membranes and serve as substrates for synthesis of glycolipids and glycoproteins, and also phospholipids, prostaglandins, leukotrienes, and thromboxane. They are particularly important for the development of the brain and the retina (see also Table 3.2).
Fatty acids also serve as signaling molecules and are activating ligands for transcription factors. They, for instance, stimulate accumulation of diacylglycerol (DAG), activate the δ isoform of protein kinase C (PKC) in the liver, and decrease tyrosine phosphorylation of insulin receptor substrate proteins 1 and 2 (IRS-1 and 2). Free fatty acids (FFA) also stimulate the NFκB pathway.
Long-chain fatty acids are not soluble in water but short- (C4–6) and medium-chain fatty acids (C8–10) are. Short- and medium-chain fatty acids are transported in plasma bound to albumin rather than in chylomicrons.
Fats are classified into saturated and unsaturated (the latter are either mono- or polyunsaturated). The most common saturated fatty acid is palmitic acid (C16)
Others are stearic (C18), myristic (C14), and lauric (C12). All animal fats (beef fat, butterfat, lard) are highly saturated. Saturated fats are also present in palm oil, cocoa butter and coconut oil.
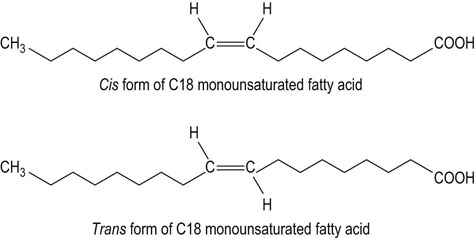
Oleic acid (ω-9) is the only significant dietary monounsaturated fatty acid
Monounsaturated fatty acids are present in all animal and vegetable fats. Olive oil is a particularly rich source of monounsaturated fats. Monounsaturated trans fatty acids (Fig. 22.6), the isomers of the cis-oleic acid, are byproducts of the hydrogenation process of liquid vegetable oils. Trans fatty acids arising from hydrogenation of fats are associated with increased risk of coronary disease.
Polyunsaturated fatty acids include ω-3 and ω-6 acids
The ω-3 fatty acids are α-linolenic (ω-3, C-18:3, Δ9,12,15), eicosapentaenoic (ω -3, C-20:5, Δ5,8,11,14,17), and docosahexaenoic (ω-3, C-22:6, Δ4,7,10,13,16,19) acids. They are present primarily in fish, shellfish, and phytoplankton and also in some vegetable oils such as olive, safflower, corn, sunflower, and soybean and leafy vegetables.
The ω-6 acids are arachidonic acid (ω-6, C-20:4, Δ5,8,11,14) and its precursor linoleic acid (ω-6, C-18:2, Δ9,12). The ω-6 fatty acids are present in soybean and canola oils and in fish oils (particularly in fatty fish such as salmon, sardines, and pilchards).
Definitions in nutrition science
Diet is the total of all the foods and drinks ingested by an individual. The food or foodstuff is the particular food that is ingested. Nutrients are chemically defined components of food required by the body.
Dietary intake is not easy to assess
Available data are based on (sometimes incomplete) population surveys. Sets of values derived from these describe suggested minimal, average, and adequate intakes of particular nutrients. Different values are used in different countries, and there has been a degree of confusion and overlap between various definitions (see Box on p. 305). Currently, the estimates of nutrient intake are based on the dietary reference intakes (DRI), developed by the Food and Nutrition Board (FNB) at the Institute of Medicine (IOM) of the National Academies in the USA. They constitute the sets of values that describe the intake of a given nutrient in a population (Fig. 22.7).
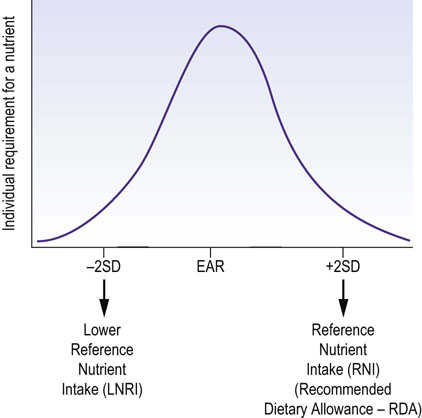
Fig. 22.7 Dietary reference intakes (RDA): the component values.
While the Estimated Average Requirement (EAR) reflects the intake adequate for half of a population, the RNI (or RDA) are values representing intake adequate for the great majority of individuals. SD:standard deviation.
Clinical box A woman with renal failure and weight loss
A 59-year-old woman was admitted to the renal unit with recurrent infections and recurrent endocarditis. She had been treated with hemodialysis for 5 years and over a period of 2 years had lost 33% of her body weight. She had a very poor appetite and had been taking two cartons (1.5 kcal/mL and 6.2 kJ/mL) of milkshake sip feeds daily. She was anuric and her fluid intake was restricted to 1000 mL daily. Her height was 1.68 m and she weighted 52.7 kg; BMI was 18. Her most recent biochemistry results revealed persistent hyperkalemia between 5.7 and 6.2 mmol/L.
Because of her poor nutritional status and continuous weight loss she needs to continue taking nutritional supplements to minimize further weight loss. However, due to the hyperkalemia, a low-electrolyte sip feed should be considered. She was initially taking 22 mmol of potassium from the 1.5 kcal/mL milkshake. Subsequently this was changed to a low-electrolyte sip feed, which provided 12 mmol in total. The UK Renal Nutrition Group Standards recommend that daily potassium intake in this type of patient should be less than 1 mmol/kg body weight. Low-electrolyte/volume sip feeds should always be considered for renal patients and the serum electrolyte concentrations need to be closely monitored.
Essential (limiting) nutrients
Essential nutrients cannot be synthesized in the human body and therefore need to be supplied from outside. They include:
Note that carbohydrates are not essential nutrients.
Some plant proteins are relatively deficient in essential amino acids, whereas animal proteins usually contain a balanced mixture
Essential amino acids are phenylalanine (tyrosine can be synthesized from phenylalanine), the branched-chain amino acids valine, leucine, isoleucine, threonine, and methionine and lysine (Chapter 19).
The essential fatty acids (EFA) are linoleic acid and α-linolenic acid
Arachidonic acid, eicosapentaenoic acid, and docosahexaenoic acid can be made in limited amounts from EFA; however, they become essential nutrients when EFA are deficient.
Vitamins and trace metals are important for the catalysis of chemical reactions
They act as coenzymes and form functionally important prosthetic groups of enzymes. They are discussed in detail in Chapter 11.
Assessing nutritional STATUS
Such assessment includes dietary habits and dietary history, a range of body (anthropometric) measurements, and biochemical and hematologic laboratory tests. Since there is no single definitive marker of nutritional status, assessment relies on the interpretation of a range of variables.
Dietary history should include more than the details of food intake
Dietary habits include meal patterns and the amount and composition of food. Individual diet is determined by biological, psychologic, sociologic and cultural factors. Biological factors involved are the state of the systems responsible for the intake, digestion, absorption and metabolism of nutrients. Enzyme deficiencies, such as, for instance, that of lactase (Chapter 10), cause impaired absorption of foodstuffs (in this case, milk).
Taking dietary history
Psychologic factors play an important role in determining food intake; eating disorders such as anorexia nervosa and bulimia nervosa may lead to severe malnutrition. Sociologic factors include availability and price of food, and measures taken by society to improve diets such as, for instance, school meals or subsidized meals for the elderly or disabled persons. Cultural factors also determine eating patterns and the type of preferred foodstuffs. All the above are important when taking the nutritional/dietary history. Individual food intake can be assessed by food frequency questionnaires, 24-h dietary recalls, food records, and also by direct analysis of foods and by metabolic balance studies. The newer method of diet research is the so-called structured assessment of dietary patterns.
Body weight and the body mass index
Body weight in relation to height is the most commonly used measurement in nutritional assessment. Relationship between the two is expressed as the body mass index (BMI), calculated according to the formula:

The BMI is used to categorize the nutritional status, as shown in Table 22.5. As mentioned above, it should not be used as a sole/definitive indication of the nutritional status.
Table 22.5
Body mass index (BMI) and nutritional status
| BMI (kg/m2) | Interpretation |
| <18.5 | Malnourished |
| 18.5–20 | Underweight |
| 21–25 | Desirable |
| 26–30 | Overweight |
| >30 | Obese |
Other measurements used in nutritional assessment are the waist-to-hip ratio, the mid-arm circumference and the skinfold thickness measured with carefully calibrated calipers. The simple measurement of waist circumference correlates with the amount of visceral fat and is used in the diagnosis of the metabolic syndrome (Chapter 21). More detailed analysis includes assessment of total body water, analysis of body bioelectrical impedance and the measurements of lean body mass using dual-energy X-ray absorptiometry (DEXA). Some of these measurements allow calculation of variables such as body fat content and composition. Functional measurements such as grip strength or peak expiratory flow are also relevant to the nutritional assessment.
Biochemical markers of nutritional status
Urinary nitrogen excretion helps to assess nitrogen balance
Nitrogen balance relates to body protein requirements. It is a difference between the intake of nitrogen and its excretion. Positive nitrogen balance means that the intake exceeds loss. Negative nitrogen balance signifies that the loss exceeds intake. The 24-h urinary nitrogen excretion is an estimate of the quantity of proteins metabolized by the body. Ninety percent of the excreted nitrogen appears in the urine (80% of this as urea). The rest is excreted in the stool, hair, and sweat. Nitrogen excretion adjusts to protein intake over 2–4 days. Measurement of urinary nitrogen (or urea) excretion is the most reliable way of assessing daily protein requirements. Currently, it is rarely used outside the research setting. As a guide, most people require 1–1.2 g protein/kg body weight/day. Age-related protein requirements are listed in Table 22.4.
Specific plasma proteins have been used as markers of nutritional status
Concentration of a protein in plasma may reflect the nutritional status over the time period related to its half-life. Proteins most commonly used for this purpose are albumin and transthyretin (prealbumin). Many studies confirm the link between liver albumin synthesis (albumin half-life is approximately 20 days (Chapter 4) and the nutritional status. Transthyretin, which has a half-life of 2 days, has also been used in nutritional assessment. It is synthesized in the liver and forms a complex with retinal-binding protein in plasma.
Unfortunately, interpretation of plasma concentrations of nutritionally relevant proteins is often difficult, because they are not exclusively determined by the state of nutrition. For instance, albumin concentration in plasma also depends on the state of hydration; it decreases in overhydrated patients (Chapter 24). In addition, albumin and transthyretin are affected by the acute phase response (transthyretin concentration increases during the acute phase reaction and albumin concentration decreases). Thus, in critically ill patients, albumin is not a useful marker of nutritional state.
General laboratory tests provide information supplementing nutritional assessment
Measurement of hemoglobin may uncover iron deficiency. Checking the liver (Chapter 30) and kidney (Chapter 23) function, the measurements of plasma sodium, potassium, chloride, bicarbonate, calcium, phosphate and magnesium, and the assessment of iron metabolism, all provide useful additional information. Assessing daily fluid intake and loss (Chapter 24) is essential in patients who are being considered for nutritional support.
Full assessment involves measurements of vitamins and trace metals
This is particularly important in patients who remain on long-term parenteral nutrition.
Simplified assessment of nutritional status
The Malnutrition Universal Screening Tool (MUST) has been introduced by the British Association for Parenteral and Enteral Nutrition (BAPEN) to enable fast assessment of nutritional state in adults. It is a five-step method of identifying individuals at risk (Fig 22.8).
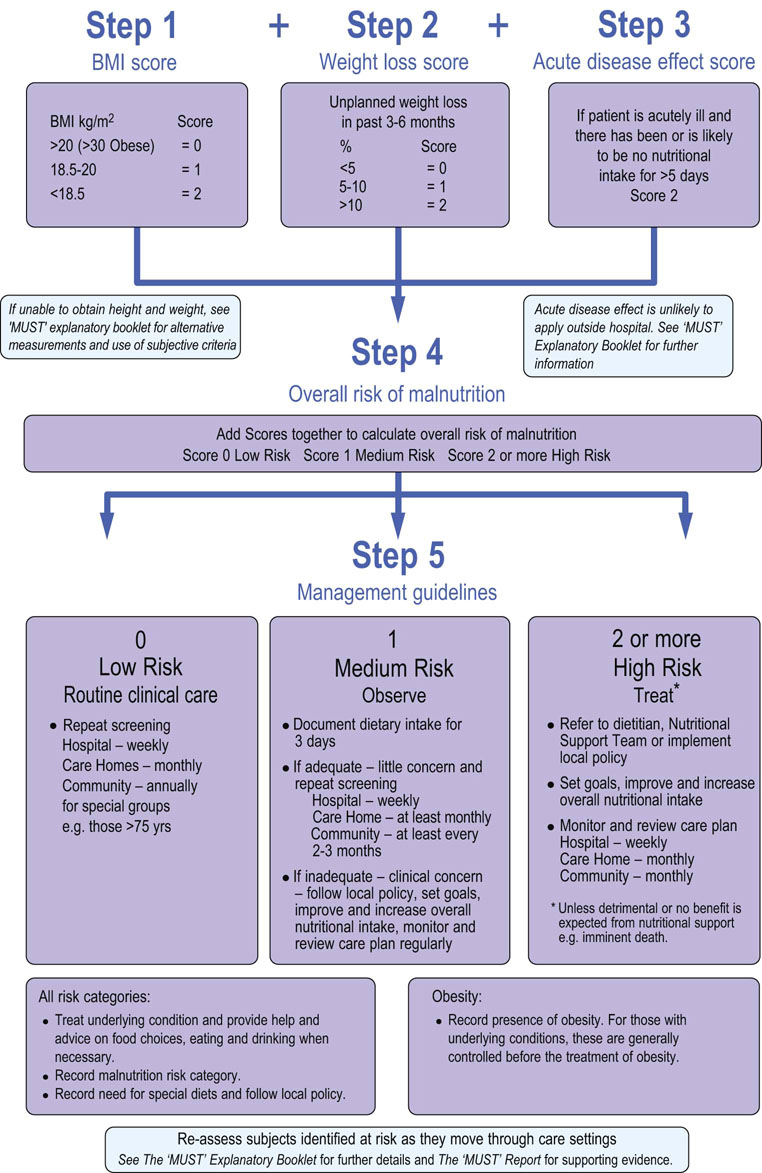
Fig. 22.8 Malnutrition Universal Screening Tool (MUST) developed by the British Association for Enteral and Parenteral Nutrition.
Steps involved in nutritional assessment. (Reproduced with permission from www.Bapen.org.uk). Refer to the BAPEN website for further information.
Malnutrition
Malnutrition is a gradual decline in nutritional status, which in its more advanced stages leads to a decrease in functional capacity and to other complications
Protein energy malnutrition (PEM) is defined as poor nutritional status due to inadequate nutrient intake.
Reduced food intake leads to reductive adaptation, which includes a decrease in nutrient stores, changes in body composition and the more efficient use of fuels such as the use of ketone bodies by the brain (metabolic changes that accompany starvation are described in Chapter 21).
Malnutrition is one of the key issues faced by public health in the developing world, and needs to be viewed from not only medical but also social and economic perspectives. Mortality in malnourished patients (BMI between 10 and 13) is four times higher compared to well-nourished people. The effects of malnutrition are summarized in Table 22.6. Worldwide, malnutrition contributes to 54% of the 11.6 million deaths annually among children below 5 years of age.
Table 22.6
Consequences of protein-calorie malnutrition
Decreased protein synthesis
Decreased activity of Na+/K+-ATPase
Decreased glucose transport
Fatty liver, liver necrosis, liver fibrosis
Depression, apathy, mood changes
Hypothermia
Compromised ventilation
Compromised immune system: impaired wound healing
Risk of wound breakdown
Decreased cardiac output
Decreased renal function
Loss of muscle strength
Anorexia
Decreased mobility
In the developed world, malnutrition is a problem in hospitalized patients who are unable to eat because of their primary problem: for instance, stroke or cancer. Gastrointestinal problems, particularly colon pathology and celiac disease (see case, Chapter 10), or postoperative state, are associated with specific nutritional problems. Malnutrition also affects a large group of older individuals.
In the UK 25–34% of people admitted to hospital are at risk of malnutrition and 20–40% of critically ill patients have evidence of protein-energy malnutrition. Malnutrition is associated with increased morbidity and mortality, with longer hospital stay, and with increased rate of complications. In addition to malnutrition, specific deficiencies such as those of vitamin D, iron, and vitamin C may occur.
Markers of malnutrition risk
BMI of below 18.5 kg/m2 suggests significant risk of malnutrition and so does unintentional loss of 10% of body weight within preceding 3–6 months. In the course of acute illness, inability to eat for more than 5 days poses the risk.
There are two types of protein-calorie malnutrition: marasmus and kwashiorkor
Marasmus results from a prolonged inadequate intake of calories and protein. It is a chronic condition, which develops over months or years. It is characterized by loss of muscle tissue and subcutaneous fat with the preservation of the synthesis of visceral proteins such as albumin. There is a clear loss of weight.
Kwashiorkor is a more acute form of undernutrition, which may also occur on the background of marasmus. It also develops because of inadequate nutrient intake after trauma or infection. In kwashiorkor, in contrast to marasmus, visceral tissues are not spared: the hallmark of kwashiorkor is edema due to the low concentration of plasma albumin and the loss of oncotic pressure (Chapter 24). The edema may mask the weight loss. Complications of kwashiorkor are dehydration, hypoglycemia, hypothermia, electrolyte disturbances and septicemia. These patients have impaired immunity and wound healing, and are prone to infection.
The WHO classification of malnutrition is based on anthropometry and the presence of bilateral pitting edema. Another classification has been proposed which distinguishes complicated from uncomplicated malnutrition (Table 22.7). Marasmus and kwashiorkor are terms rarely used in the hospital practice in developed countries; malnutrition and complicated malnutrition are probably more appropriate.
Table 22.7
Classification of malnutrition
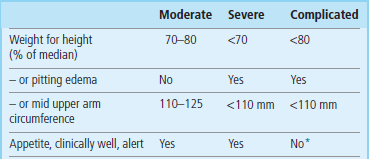
Note that, in the classic classification of malnutrition, the presence of edema is also the main differentiating feature between marasmus and kwashiorkor.
*Patients with complicated malnutrition may develop anorexia, high fever, anemia and dehydration.
After Collins S, Yates R: The need to update the classification of acute malnutrition, Lancet 362:249, 2003.
Refeeding syndrome develops as a consequence of inappropriate feeding of a malnourished person
The inpatient treatment of malnutrition in famine areas includes standard preparations such as Formula 100 therapeutic milk (F100). F100 is a liquid diet with an energy content of 100 kcal/100 mL. It includes dried skimmed milk, oil, sugar and a mix of vitamins and minerals (without iron). In the areas of famine, community feeding programs use the so-called life-sustaining general rations (at least 2100 kcal; 8786 kJ/day) containing grains, legumes, and vegetable oil. During the treatment of malnutrition, this needs to be combined with providing adequate water, sanitation, and basic health care.
It is important to take time to replete a starved person nutritionally. Too quick a replacement may be dangerous due to a possibility of a major shift between intracellular and extracellular fluid. This is known as the refeeding syndrome, and is characterized by a severe decrease in concentrations of serum magnesium, phosphate and potassium (the latter because of the stimulation of insulin secretion). Also, if thiamine deficiency is present, carbohydrate feeding can precipitate the Wernicke–Korsakoff syndrome (Chapter 11). Frequent simple meals at short intervals are recommended during famine relief and, in a hospital setting, gradual introduction of nutritional support and close monitoring are required.
Clinical box Obese man with type 2 diabetes, coronary disease and arthritis
Mr K is a 55-year-old man with type 2 diabetes and coronary disease. He suffers from angina on effort and from severe arthritic knee pain. When he initially presented to the out-patient clinic his weight was 140 kg and his height 1.80 m (BMI 43). Within a year he managed to lose 12 kg by dieting. He was prescribed a lipase inhibitor, which he tolerated well. However, his arthritis worsened and he was increasingly less able to exercise. As a result his weight increased again to 137 kg. He was referred to the surgeons and is now being considered for gastric banding surgery.
This patient illustrates multiple problems associated with obesity and in particular the way a concomitant disease may interfere with weight reduction programs. Weight loss is, to a substantial extent, dependent on the level of exercise. This patient lost weight initially but the maintenance of lower body weight was compromised by decreased mobility caused by arthritis.
Nutritional support
Nutritional support is required for a substantial number of hospitalized patients, and ranges from simple assistance with meals, through enriched or special-consistency diets, to enteral nutrition and total parenteral nutrition (Table 22.8).
Table 22.8
Special diets
Assistance with eating
Enteral nutrition (feeding through different feeding tubes: nasogastric, nasoduodenal; gastrostomy and jejunostomy)
Parenteral (intravenous) nutrition
Enteral nutrition entails feeding a person through special tubes placed in the stomach or jejunum
Enteral nutrition is appropriate when there are difficulties with taking food orally but the gastrointestinal tract functions properly. Standard enteral feeds contain carbohydrate, protein, fat, water, electrolytes, vitamins, and minerals, including trace elements. Predigested feeds contain short peptides or free amino acids.
When the gastrointestinal tract does not function because of, for instance, intestinal obstruction, or when large parts of it have been surgically removed, total parenteral nutrition is appropriate
Parenteral nutrition means intravenous feeding. Parenteral nutrition solutions contain fluids, glucose (dextrose), amino acids, and fats given as lipid emulsion (in the US derived from soybean oil and in Europe also from fish oil, olive oil and medium-chain triglycerides). Vitamins, minerals and electrolytes are also included. Total parenteral nutrition, while in many instances life-saving, is a treatment potentially associated with complications caused by intravenous line infections (it requires strictly sterile procedures) as well as metabolic problems. For this reason, parenteral nutrition treatment in hospitals is managed by multidisciplinary teams that include specialist nurses, surgeons, gastroenterologists, dieticians, pharmacists, and laboratory medicine physicians.
Obesity
Obesity has emerged as a major health problem worldwide
Worldwide obesity has increased by more than 70% since 1980. In the US, 35.7% of adults and 16.9% of children are obese (US National Health and Nutrition Examination Survey 2009). Main causes of this seem to be the wide availability of highly caloric food, and the decrease in physical activity both at work and during leisure time.
Clinical box A 46-year-old man with hypertriglyceridemia and fatty liver
Mr A is a 46-year-old man of South Asian descent. He has recently been gaining weight – ‘middle-age spread’ as he puts it. This weight gain is concentrated on his abdomen. His wife is concerned, as his father had had type 2 diabetes and died from a heart attack aged 60, and insists he goes to the doctor for a check-up. He attends the doctor and has blood samples taken – these show moderately raised total cholesterol, high triglyceride concentration, and low HDL-cholesterol Chapter 18). He has impaired fasting glucose and his liver function tests show a small rise in his transaminases. The liver ultrasound is consistent with intrahepatic fat deposition (the fatty liver).
The combination of Mr A's sex, ethnicity and family history has predisposed him to gaining weight centrally rather than evenly through his body subcutaneously. This central obesity is due to fat within his abdominal cavity known as the visceral fat. This fat is deposited round his liver and pancreas, and increases his risk of developing type 2 diabetes. His plasma glucose is raised but he is not yet at the level classified as diabetes (Chapter 21). There is a degree of inflammation in his liver due to the layer of fat across it and, although rare, this can later lead to liver cirrhosis in some people. His cholesterol profile is in keeping with insulin resistance; this is mostly due to the ectopic triglyceride deposition in muscle and liver.
Obesity is associated with an increased risk of medical and surgical problems
Obesity is associated with an increased risk of diseases in every system in the body (Table 22.9). In particular, it is a risk factor for type 2 diabetes mellitus (Chapter 21); the increased incidence of diabetes worldwide parallels that of obesity. Insulin resistance, which develops in obesity, is an important common denominator between obesity and diabetes. Obesity and insulin resistance carry an increased risk of cardiovascular disease.
Table 22.9
Health risks associated with obesity
| System | Conditions associated with obesity |
| Cardiovascular | Coronary heart disease Phlebitis/venous ulceration High blood pressure High plasma cholesterol |
| Endocrine | Type 2 diabetes Polycystic ovary syndrome Infertility |
| Gastrointestinal | Nonalcoholic fatty liver disease Esophageal reflux Esophageal cancer Gallstones Hepatocellular cancer |
| Respiratory | Obstructive sleep apnea Asthma |
| Central nervous system | Idiopathic intracranial hypertension Stroke |
| Locomotor | Osteoarthritis Gout |
| Genitourinary | Cervical cancer Endometrial cancer Renal cancer Prostate cancer |
| Other | Breast cancer Cataracts Psoriasis Complications of pregnancy |
Attempting weight loss to reverse the consequences of obesity
Losing weight increases life expectancy, decreases blood pressure, decreases visceral fat deposition, improves plasma lipid concentrations, increases insulin sensitivity and normalizes glycemia, improves clotting and platelet function, and enhances the quality of life.
To lose weight, one needs to change the balance between energy intake and expenditure, i.e. between food intake and physical activity
However, the process involves many other factors, such as motivation, available time, cost, and access to appropriate weight reduction programs. Low-calorie diets contain approximately 1200–1300 kcal/day and very low-calorie diets around 800 kcal/day. Generally, a combination of diet and exercise plus behavior interventions (e.g. goal-setting, relapse avoidance) is more effective in inducing weight loss than diet alone. However, currently there are no evidence-based interventions that can induce a weight loss greater than 5% of body weight and maintain this long term, other than surgical treatments (bariatric surgery).
Low-carbohydrate diets for weight reduction
Low-carbohydrate, high-fat diets appear to be effective in weight reduction, at least in the short term, and they consistently lower plasma glucose concentration. As with many other aspects of dietary management, they are not completely evidence based. There are persisting concerns that include potential risk of abnormalities of liver and kidney function, and the long-term effects of higher fat intake on cardiovascular risk. Research in the field continues.
Surgical treatment of obesity results in large weight loss
Bariatric surgery includes gastric bypass surgery, where the stomach is made smaller and the first part of the small intestine is bypassed, and gastric banding, where a band is inflated around the part of the stomach. Surgery can result in a 20% weight loss and has been shown to reduce the future risk of cardiovascular disease and cancers, as well as improving mental health and general well-being. It can have such a profound effect on glycemic control that patients with diabetes achieve blood glucose concentrations well below the threshold at which diabetes is diagnosed.
Clinical box A 46-year-old man with hypertriglyceridemia and fatty liver: the benefits of weight loss
Mr A is worried about his father's history of type 2 diabetes and cardiovascular disease. He decides to try and lose weight. He thinks carefully about where he goes wrong in his diet and realizes that evening snacking on chocolate biscuits and sugary drinks is his main weakness. He decides the best option is to not buy any of these snacks at the supermarket so he can avoid temptation. He also decides he will join a gym and attend a circuit class twice per week. Six months into this regimen he has lost 7 kg, is feeling well and enjoying his new lifestyle. He returns to the doctor to have his bloods rechecked. His liver function tests have returned to within normal limits. However while his triglycerides are also lower, they still remain elevated, and his HDL-cholesterol is still low. His blood glucose is lower than before but is still classed as impaired fasting glucose. Mr A is upset that all the results have not normalized and feels that his efforts have been in vain.
Mr A has done very well to lose 7 kg of weight. When a person with excess visceral fat loses weight, it is this visceral fat they lose first; this is why Mr A's liver function tests have improved as the liver is no longer ‘irritated’ by fat deposits. However, obesity is only one component of risk: in Mr A's case his sex, age, ethnicity and strong family history are risk factors that he cannot modify. That does not make lifestyle intervention futile in this case, as it will be good for general health and wellbeing. Nevertheless, Mr A may still go on to develop type 2 diabetes in the next 10 years. However, being less obese and participating in regular exercise may delay the onset of diabetes compared to what it would have been otherwise. Also, if he does develop diabetes, it should be simpler to treat.
 Advanced concept box Definitions in nutrition science
The definitions below (given in bold) are used by the Food and Nutrition Board, Institute of Medicine (IOM) of the National Academies in the United States. Definitions used in the UK are also mentioned.The requirements are described by the Dietary Reference Intakes (DRI). The DRI are described by:
Estimated Average Requirement (EAR): average daily nutrient intake estimated to meet the requirement of half of the healthy individuals in a particular gender group at a particular stage of life. The EAR is complemented by:
Recommended Dietary Allowance (RDA): in the UK the Reference Nutrient Intake (RNI). It describes the average daily nutrient intake level sufficient to meet the nutrient requirement of nearly all (97–98%) healthy individuals. The Lower Reference Nutrient Intake (LNRI) used in the UK: the daily intake observed at the low end of intake distribution in a population (about 2%). If intake falls below this, a deficiency may occur.
Adequate Intake (AI): recommended average daily nutrient intake based on estimates of nutrient intake by a group of healthy people that are assumed to be adequate – used when an RDA cannot be determined.
Tolerable Upper Intake Level (UL): highest average daily intake likely to pose no health risk to almost all individuals in a particular gender group at a particular stage of life. As intake increases above the UL, the risk of adverse effects increases.
Note that DRI are intended for healthy people, and a DRI established for any one nutrient presupposes that requirements for other ones are being met.
Advanced concept box Adipose tissue and disease
Adipose tissue can be stored in three distinct depots in the body: subcutaneous fat under the skin; visceral fat within the abdominal cavity; and the ectopic fat, for example the cardiac fat pad, or the excess deposition in the liver itself, and in myocytes. The distribution of fat in a person depends on their sex and ethnicity, combined with family history. For example, women are classically thought of as ‘pear-shaped’, with large subcutaneous adipose stores on their hips and thighs, while men are ‘apple-shaped’ with rounded abdomens due to excess visceral fat in their abdominal cavity. People of south-Asian, Chinese and Japanese descent are also generally more prone to depositing excess visceral rather than subcutaneous fat.
Subcutaneous fat is generally benign; it serves as an energy store. Health problems related to subcutaneous fat deposition are mechanical when a person gets so large they cannot function normally. Visceral fat, however, is an active endocrine organ that produces a number of mediators including interleukin 6 which lead to accelerated atherogenesis and premature cardiovascular disease, and facilitate development of type 2 diabetes. It also promotes a procoagulant state (Chapter 7) by secreting plasminogen activator inhibitor 1 (PAI-1), which inhibits fibrin degradation.
One of the major problems associated with visceral adiposity is the nonalcoholic fatty liver disease (NAFLD). This is due to excess fatty acids being deposited in the liver. It leads to hepatic insulin resistance and is a risk factor for type 2 diabetes, and it can also lead to hepatitis and cirrhosis of the liver.
Ectopic fat pads are less well understood. The main fat pads associated with disease are the cardiac fat pad and the pharyngeal fat pad. The cardiac fat pad is thought to have several characteristics that can be mediators of cardiac disease. The first is simple mechanical obstruction of the heart, which impairs cardiac function. There is also the possibility that these cells also release procoagulant and inflammatory mediators having a local effect on cells. There will also be toxic lipid accumulation in cardiac myocytes. The pharyngeal fat pad is associated with obstructive sleep apnea; in this condition, the pharynx is obstructed during sleep, leading to episodes of hypoxia and apneas (temporary cessation of breathing). People with this condition have very poor sleep quality and are at a high risk of developing cardiovascular disease, including hypertension. It is not known whether the pharyngeal fat pad has effects beyond obstructing the pharynx.
Visceral and ectopic fat is preferentially depleted during weight loss. This means that a person may not have to return to a ‘normal’ weight in order to substantially decrease their visceral and ectopic fat and the health risks these pose.
Healthy eating and dietary prevention of disease
Current dietary recommendations for the general population focus on balanced eating
Current recommendations stress the balanced diet. They unequivocally recommend high intake of fruit and vegetables. Starchy foods are another major part of the diet. With regard to carbohydrates, whole grains are probably the healthiest type of food (as opposed to, for example, white bread or white rice). The intake of dairy products is recommended in moderation. Fish, poultry, beans and nuts are regarded as healthy sources of proteins and are preferred over red meats. With regards to fat, vegetable cooking oils (olive and canola oil) are regarded as healthy fats, as opposed to saturated fats and particularly the trans fats. The diet should be low in unrefined carbohydrates, saturated fat and cholesterol. Restriction of sugar and caloric sweeteners is recommended, as well as sodium restriction and moderation in alcohol consumption. A healthy diet should be combined with an active lifestyle.
Figure 22.9 contains vignettes relating to major recommendations. My Plate contains recommendations of the US Department of Agriculture, which superseded the well known Food Pyramid. The critical comments and the alternative named Healthy Eating Plate has been recommended by the Harvard School of Public Health. The Eatwell Plate is the recommendation developed by the National Health Service in the UK.

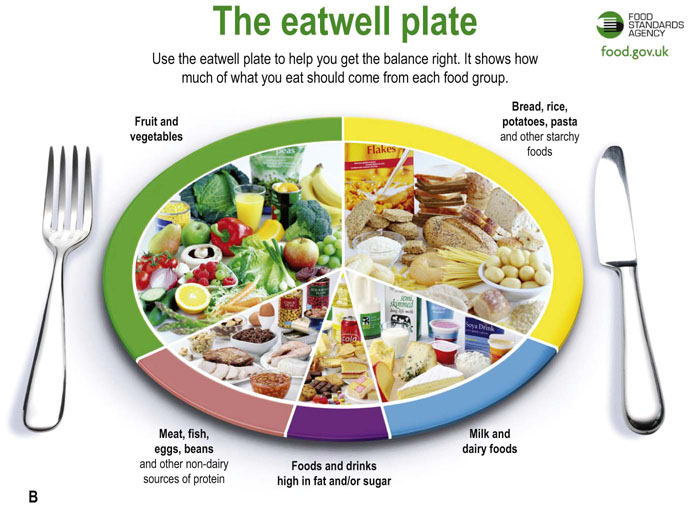
Fig. 22.9 Healthy eating.
Current recommendations emphasize balanced diet.
(A) My Plate contains the current recommendations on healthy eating developed by the US Department of Agriculture. It substituted the previously used Food Pyramid.
(B) The eatwell plate developed by the Food Standards Agency UK (www.food.gov.uk).
Diet is important in the prevention of coronary disease
Nutrients which affect atherosclerosis are dietary cholesterol, saturated fat and trans fatty acids. Excessive caloric intake and consequent obesity also facilitate atherosclerosis. High dietary cholesterol and a diet high in high saturated fat decrease the LDL receptor expression mediated through an increase in the intracellular cholesterol content in the hepatocytes: this leads to an increase in plasma cholesterol concentration (Chapter 17). Foods containing saturated fatty acids (full-fat milk, cheese, butter, and red meats) are atherogenic in excess. The rationale behind low-cholesterol diets is that LDL receptor expression can be increased if dietary cholesterol content is sufficiently low. The typical Western diet contains approximately 400–500 mg of cholesterol daily. The intake required to achieve reduction in plasma cholesterol is much lower – below 200 mg or even below 100 mg daily.
Nutrients that seem to be protective against atherosclerosis include polyunsaturated ω-6-rich fatty acids (contained in vegetable oils) and ω-3-rich fish and fish oils, monounsaturated fat (contained in e.g. olive oil), and soluble fiber. Polyunsaturates also reduce plasma cholesterol concentration. The ω-3 fatty acids reduce triglycerides by decreasing VLDL synthesis and increasing its catabolism. They are also antithrombotic: fish oil inhibits thromboxane and PDGF synthesis, reduces blood viscosity and enhances fibrinolysis. Interestingly, it seems to electrically stabilize the heart muscle, preventing arrhythmias and decreasing the incidence of sudden death in people who have suffered myocardial infarction. Monounsaturated fats increase the HDL concentration, increase insulin sensitivity and decrease plasma triglyceride concentration.
Diets low in fat and cholesterol normally result in an approximately 10% decrease in serum cholesterol if applied during clinical trials, and a lesser decrease (usually below 5%) when applied to the general population. Alcohol seems to be protective against coronary disease but taken in excess it carries many other risks, obesity included. Unfortunately, low-fat diets seem to decrease HDL-cholesterol by 10–20%.
Also, low-fat diets, if the protein content is kept constant, tend to be high in carbohydrates. In spite of recommendations to use predominantly complex carbohydrates, in many populations refined sugars constitute too high a proportion of carbohydrate intake, and this promotes obesity. High-carbohydrate diets may also lead to hypertriglyceridemia.
Low-carbohydrate diet and the Mediterranean diet are alternatives to low-fat diet with regard to cardiovascular prevention and weight loss
For many years the low-cholesterol, low-fat diet was the hallmark of cardiovascular prevention. However, the emergence of the epidemics of obesity, and the greater understanding of the role of carbohydrates in the development of insulin resistance and metabolic syndrome, focused the attention on diets containing low carbohydrates and generally containing foods with a low glycemic index (see above).
Two types of diet seem to have significant health benefits. The low-carbohydrate diets (the Atkins diet and its derivatives) stress low carbohydrate content together with unrestricted caloric intake and are used primarily as means of weight reduction and maintenance. Typically such diet contains only 20 g carbohydrates per day during the 2-month induction phase. Subsequently, the carbohydrate content gradually increases to up to 120 g. Most regimens also encourage consumption of fat and protein from vegetarian sources and avoidance of the trans fats. People who take the low-carbohydrate diet are particularly prone to ketonuria.
The Mediterranean diet contains moderate amount of fat and a high proportion of monounsaturated fats. It is rich in vegetables, low in red meat and instead contains poultry and fish, as well as low-fat grains, fruits and legumes. To achieve weight loss, caloric restriction is necessary. Research studies suggest that both the low-carbohydrate diets and the Mediterranean lead to a greater weight loss than the low-fat diet. In terms of the effect on cardiovascular risk, these diets are at least alternative to the conventional low-fat diet.
Lifestyle and diet may influence the incidence of cancer
High intake of fruit and vegetables seems to be protective against cancer, possibly due to the presence of antioxidants and fiber. Dairy products seem also to be protective. There were suggestions that high-fat diets may increase cancer risk, but epidemiologic evidence for this is weak. In clinical studies β-carotene, retinoids (Chapter 11), fiber, and calcium were not found to be effective in cancer prevention. Massive weight loss with bariatric surgery has shown a reduction in the incidence of cancer.
Low calcium intake may be related to risk of osteoporosis
Osteoporosis is associated with low bone mass and bone fragility, which results in an increased risk of fractures (Chapter 26). It is particularly prominent in the elderly. Calcium is required for mineralization of bone and it is recognized that sufficient intake of calcium, alongside vitamin D in older adults is associated with a lower risk of osteoporosis. High alcohol intake and low body mass are associated with an increased risk of osteoporosis. Numerous other nutritional factors have been related to bone health, though with less evidence, including zinc, copper, manganese, boron, vitamin A, vitamin C and vitamin K; a diet containing high amounts of fruit and vegetables is recommended for optimum bone health.
Summary
Appropriate nutrition underpins health and well-being, and poor nutrition increases susceptibility to disease.
Food intake is controlled by a neuroendocrine system responding to signals generated in adipose tissue.
Genotype, food availability, state of health, and physical activity are factors which determine nutritional status.
Nutritional needs change during the life cycle.
The main categories of nutrients are carbohydrates, fats, proteins, and vitamins and minerals. Water balance is closely associated with nutrition.
Assessment of nutritional status is an important part of general clinical assessment. It includes the assessment of current diet, dietary history, clinical examination and a range of biochemical and hematologic tests.
Malnutrition affects large areas of the developing world, and in the developed world is an issue among disadvantaged social groups and also in hospitalized persons.
Obesity has become a major health problem worldwide.
Nutritional support includes graded assistance with nutrient intake, ranging from assistance with meals to total parenteral nutrition.
Brand-Miller, J, Buyken, AE. The glycemic index issue. Curr Opin Lipidol. 2012; 23:62–67.
Collins, S, Yates, R. The need to update the classification of acute malnutrition. Lancet. 2003; 362:249.
Cota, D. CXB1 receptors: emerging evidence for central and peripheral mechanisms that regulate energy balance, metabolism, and cardiovascular health. Diabetes/Metabol Res Rev. 2007; 23:507–517.
Crowley, VEF. Overview of human obesity and central mechanisms regulating energy homeostasis. Ann Clin Biochem. 2008; 45:245–255.
Dietary Reference Values for Food Energy and Nutrients for the United Kingdom. Report of the Panel on Dietary Reference Values of the Committee on Medical Aspects of Food Policy, Department of Health. London: TSO; 2003.
Eckel, RH. Nonsurgical management of obesity. N Engl J Med. 2008; 358:1941–1950.
Elamin, E. Dietary and pharmacological management of severe catabolic conditions. Am J Med Sci. 2011; 342:513–518.
Gastadelli, A. Role of beta-cell dysfunction, ectopic fat accumulation and insulin resistance in the pathogenesis of type 2 diabetes mellitus. Diab Res Clin Pract. 2011; 93S:560–565.
Gidden, F, Shenkin, A. Laboratory support of the clinical nutrition service. Clin Chem Lab Med. 2000; 38:693–714.
Ramachandrappa, S, Farooqi, IS. Genetic approaches to understanding obesity. J Clin Invest. 2011; 121:2080–2086.
Shai, I, Schwarzfuchs, D, Henkin, Y, et al. Weight loss with a low-carbohydrate, Mediterranean, or low-fat diet. N Engl J Med. 2008; 359:229–241.
Vincent, HK, Innes, KE, Vincent, KR. Oxidative stress and potential interventions to reduce oxidative stress in overweight and obesity. Diabetes Obesity Metabol. 2007; 9:813–839.
Willett, WC, Ludwig, DS. The 2010 dietary guidelines – the best recipe for health? N Engl J Med. 2011; 365(17):1563–1565.
BAPEN. What is malnutrition. www.bapen.org.uk/about-malnutrition/introduction-to-malnutrition.
BAPEN Malnutrition Universal Screening Tool. www.bapen.org.uk/pdfs/must/must_full.pdf.
Burani, J. Gushers and Tricklers. Practical use of the glycemic index. www.glycemicindex.com/cmsAdmin/uploads/glycemicindex.ppt, 2006.
ChooseMyPlate.gov. United States Department of Agriculture.
www.cnpp.usda.gov/Publications/MyPlate/GettingStartedWithMyPlate.pdf
Dietary Reference Intakes. Applications in Dietary Planning (2003). Food and Nutrition Board, Institute of Medicine (IOM) of the National Academies. www.iom.edu.
Eight tips for healthy eating – Live Well – NHS Choices. www.nhs.uk/Livewell/Goodfood/Pages/eight-tips-healthy-eating.aspx.
Eatwell plate. www.nhs.uk/Livewell/Goodfood/Documents/Eatwellplate.pdf.
International chair on cardiometabolic risk. www.myhealthywaist.org.
UK Food Standards Agenc. www.Foodstandards.gov.uk
World Health Organization. Obesity. www.who.int/topics/obesity/en/.
World Health Organization, Management of Severe Malnutrition: A Manual for Physicians and Other Senior Health Workers. WHO, Geneva, 1999. www.who.int/nutrition/publications/severemalnutrition/9241545119/en/
The glycemic index. www.glycemicindex.com.
The Nutrition Source. Healthy Eating Plate vs. USDA's MyPlate. www.hsph.harvard.edu/nutritionsource/healthy-eating-plate/healthy-eating-plate-vs-usda-myplate/index.html.