Glucose Homeostasis and Fuel Metabolism
Diabetes Mellitus
Learning objectives
After reading this chapter you should be able to:
 Characterize the main energy substrates (metabolic fuels).
Outline the actions of insulin and glucagon.
Compare and contrast metabolism in the fasting and postprandial states.
Describe the metabolic response to injury and compare it with metabolism in diabetes.
Characterize type 1 and type 2 diabetes mellitus.
Explain the basis of laboratory tests relevant to fuel metabolism and monitoring of diabetes.
Introduction
Continuous provision of energy is essential to maintain life. This chapter describes metabolism of compounds known as energy substrates (or metabolic fuels). It also discusses the most common metabolic disease, diabetes mellitus.
Glucose and fatty acids are the most important energy substrates: both can be stored in the body
The most important energy substrates in mammals are glucose and fatty acids. After ingestion of food, their excess is stored to be released again in case of need. This storage-release paradigm safeguards the energy supply between meals, and in extreme circumstances can ensure an organism's survival for weeks and months. The main pathways of fuel metabolism and the key metabolites are listed in Table 21.1.
Table 21.1
Principal anabolic and catabolic pathways, and their main substrates and products
| Pathway | Main substrates | End products |
| Anabolic | ||
| Gluconeogenesis | Lactate, alanine, glycerol | Glucose |
| Glycogen synthesis | Glucose-1-phosphate | Glycogen |
| Protein synthesis | Amino acids | Proteins |
| Fatty acid synthesis | Acetyl-CoA | Fatty acids |
| Lipogenesis | Glycerol, fatty acids | Triacylglycerols (triglycerides) |
| Catabolic | ||
| Glycolysis | Glucose | Pyruvate, ATP |
| Tricarboxylic acid cycle | Pyruvate | NADH + H+, FADH2 |
| CO2, H2O, ATP | ||
| Glycogenolysis | Glycogen | Glucose-1-phosphate, glucose |
| Pentose phosphate | Glucose-6-phosphate | NADPH + H+, |
| pathway | pentoses, CO2 | |
| Fatty acid oxidation | Fatty acids | Acetyl-CoA CO2, H2O, ATP (ketone bodies) |
| Lipolysis | Triglycerides | Glycerol, fatty acids |
| Proteolysis | Proteins | Amino acids, glucose |
Note that metabolites such as pyruvate and acetyl-CoA are common to several pathways. Note also which pathways generate reducing equivalents (NADH, NADPH and FADH2), which in turn are substrates for the mitochondrial respiratory chain.
Metabolism is geared towards safeguarding continuous glucose supply. Glucose is stored as glycogen and can also be synthesized from non-carbohydrate compounds
Continuous supply of glucose is essential for survival because in normal circumstances glucose is the only fuel which the brain can use. Glucose is also the preferred fuel for muscle during initial stages of exercise. In spite of the fact that from time to time there is large demand for glucose, the amount of glucose present in the extracellular fluid is only about 20 g (1 oz), the equivalent of 80 kcal (335 kJ). To safeguard supply, glucose can be released into the circulation from the ‘emergency store’ of its polymer, glycogen. Glycogen is stored in the liver (approximately 75 g; 2.5 oz) and in muscle (400 g; 1 lb). This is equivalent to about 1900 kcal (7955 kJ) and can supply glucose for approximately 16 h of fasting (compare Table 19.1 and 20.3). When the period of fast is longer, another mechanism of glucose supply comes into play: its synthesis de novo from noncarbohydrate compounds known as gluconeogenesis.
Fatty acids are stored as esters of glycerol (triacylglycerols or triglycerides)
The body has virtually unlimited capacity for the accumulation of fat in the adipose tissue, and it is stored as esters of glycerol (triacylglycerols). The caloric value of fat (9 kcal/g, 37 kJ/g) is higher than that of either carbohydrates (4 kcal/g, 17 kJ/g) or proteins (4 kcal/g) (Table 21.2). A 70 kg (154 lb) man will store approximately 15 kg (33 lb) of fat. This is equivalent to over 130,000 kcal (544,300 kJ), a vast amount compared to the caloric value of the stored glycogen. Fatty acids support body energy needs during prolonged periods of fasting, and during prolonged exercise. In extreme circumstances, people can fast for as long as 60–90 days: obese persons may survive for over a year without food.
Table 21.2
Reciprocal effects of insulin and glucagon on the key enzymes of gluconeogenesis
| Enzyme | Effect of glucagon | Effect of insulin |
| Glucose-6-phosphatase (Glc-6-Pase) | Induction | Repression |
| Fructose-1,6-biphosphatase (Fru-1,6-BPase) | Induction | Repression |
| Phosphoenolpyruvate carboxykinase (PEPCK) | Induction | Repression |
On a high-carbohydrate diet, insulin induces gene transcription of the glycolytic enzymes glucokinase, phosphofructokinase (PFK), pyruvate kinase (PK), and glycogen synthase. At the same time, it represses the key enzymes of gluconeogenesis, pyruvate carboxylase (PC), PEPCK, Fru-1,6-BPase, and Glc-6-Pase. Glucagon effects oppose those of insulin. On a high-fat diet, glucagon represses the synthesis of glucokinase, PFK-1, and PK, and induces the transcription of PEPCK, Fru-6-Pase, and Glc-6-Pase.
Amino acids can be used as a fuel after conversion to glucose
Amino acids normally serve as substrates for synthesis of body's proteins. However, in certain situations they become energy substrates. During a prolonged fast or periods of metabolic stress induced by illness or injury, body proteins are degraded, and the released amino acids are converted into glucose in the course of gluconeogenesis. When an excessive amount of amino acids is taken as food, they are converted to carbohydrates and are either stored or metabolized (Chapter 19).
Different organs and tissues handle fuels differently
At rest, the brain uses approximately 20% of all oxygen consumed by the body. Glucose is normally its only fuel: during starvation, however, the brain adapts to the use of ketone bodies as an alternative energy source.
The two pathways that provide glucose are glycogenolysis and gluconeogenesis. When glucose concentration in the extracellular fluid decreases, it is first replenished by degrading liver glycogen. However, when the fasting period extends, gluconeogenesis is initiated. Gluconeogenesis takes place mostly in the liver, and the kidneys also contribute during prolonged fast. Its main substrates are lactate (from anaerobic glycolysis), alanine (from the amino acids released during breakdown of muscle protein) and glycerol (from the breakdown of triacylglycerols in the adipose tissue (Chapter 13)).
Muscle uses both glucose and fatty acids as energy sources. During short-term exercise, glucose is the preferred substrate, however, at rest and during prolonged exercise, fatty acids are the main energy source (Chapter 20). The myocyte cannot release glucose directly into the circulation because it does not contain the enzyme glucose-6-phosphatase. Thus, it uses glycogen only for its own energy needs. However, it does contribute to gluconeogenesis by releasing lactate, which is transported to the liver. No gluconeogenesis takes place in muscle.
Glucose concentration in plasma reflects the balance between, on the one hand, its intake (absorption from the gut) or its endogenous production (glycogenolysis and gluconeogenesis), and on the other, its tissue utilization in glycolysis, pentose phosphate pathway, tricarboxylic acid (TCA) cycle and in glycogen synthesis (see Fig. 13.2). In the fasting state, a person weighing 70 kg (154 lb) metabolizes glucose at a rate of approximately 2 mg/kg/min (200 g/24 h).
Insulin and glucagon are the main hormones that control glucose disposal, its plasma concentration, and, generally, the state of fuel metabolism
Glucose homeostasis is controlled, on the one hand, by the anabolic hormone insulin and on the other, by the catabolic hormones (glucagon, catecholamines, cortisol, and growth hormone), also known as counterregulatory hormones (Fig. 21.1). Insulin and glucagon are both secreted from the pancreatic islets of Langerhans. Insulin is secreted by β-cells (approximately 70% of all islet cells) and glucagon by the α-cells. The molar ratio of insulin to glucagon at any given time is the key determinant of fuel metabolism.
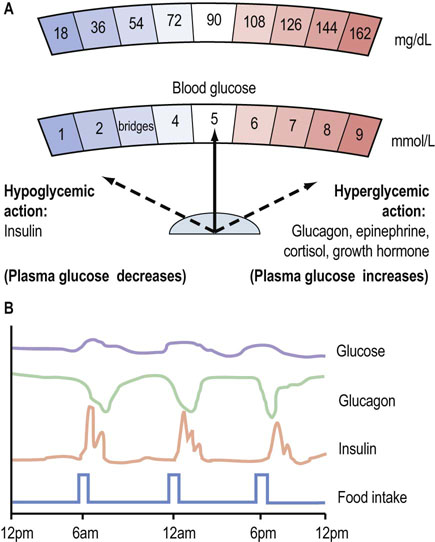
Fig. 21.1 Hormonal control of glucose homeostasis.
(A) Plasma glucose concentration reflects the balance between the hypoglycemic (glucose-lowering) action of insulin and the hyperglycemic (glucose-increasing) action of the anti-insulin hormones. (B) Daily patterns of insulin and glucagon secretion, and corresponding plasma glucose concentrations. Plasma glucose concentration is maintained within a narrow range throughout the day. To obtain glucose concentrations in mg/dL, multiply the value in mmol/L by 18.
Insulin
Insulin was discovered in 1921–22 by Frederick Banting, Charles Best and John Macleod, all working in Toronto (see Further Reading). Much later, in 1979, insulin became the first recombinant human protein to be produced commercially. The insulin molecule consists of two peptide chains linked by two disulfide bonds. Its molecular weight is 5500 Da. The α-chain contains 21 amino acids, and the β-chain 30 amino acids. Insulin is synthesized in the rough endoplasmic reticulum of the pancreatic β-cells and is packaged into the secretory vesicles in the Golgi apparatus. The precursor of insulin is the single chain molecule, preproinsulin. First, a 24-amino acid signal sequence is cleaved from preproinsulin by a peptidase, yielding proinsulin. Proinsulin is then split by endopeptidases into insulin and C-peptide (Fig. 21.2), both of which are released from the cell in equimolar amounts. This is exploited in the clinical laboratories for the assessment of the β-cell function in patients treated with insulin. In such persons, endogenous insulin cannot be measured directly, because the administered insulin would interfere in the assay. However, since C-peptide is present in the same molar concentration as native insulin, its serves as a marker of β-cell function.
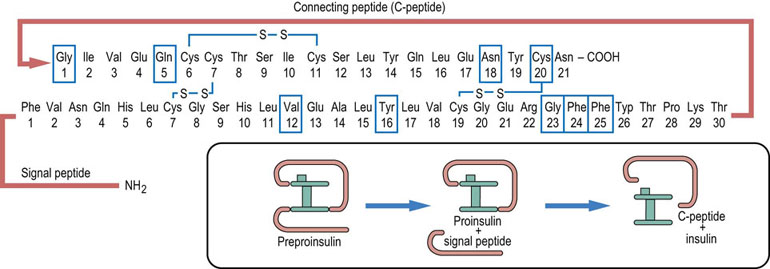
Fig. 21.2 Insulin.
The insulin molecule consists of two polypeptide chains joined by two disulfide bridges. The third bridge is internal to the β-chain. Insulin is synthesized as a longer peptide, preproinsulin, which is cleaved into the signal peptide and proinsulin. Before being secreted from the β-cell, proinsulin is split further into the C-peptide and insulin. Boxes drawn around amino acid residues indicate the amino acid involved in binding to the insulin receptor.
Glucose metabolism in the β-cell determines insulin secretion
When glucose is being absorbed during a meal, the β-cell takes it up using the membrane transporter GLUT-2 (Chapter 8 and Table 8.2). On entering the cell, glucose is phosphorylated by glucokinase. As glucose metabolism is stimulated, the ATP/ADP ratio in the cell increases. This closes the ATP-sensitive potassium channels in the cell membrane, decreasing potassium efflux. The cell is depolarized, and the L-type calcium channels open. Calcium ions enter the cell (Chapter 40) and activate the Ca2+-dependent proteins that cause the release of secretory granules containing preformed insulin. This is known as the first phase of insulin secretion (Fig. 21.3) (compare this with the neurosecretory granules, Chapter 41.1). Loss of this phase is the early functional sign of islet cell damage. The second phase of insulin secretion involves synthesis of new insulin and responds to signals such as an increase in the concentration of the cytosolic long-chain acetyl-CoA.
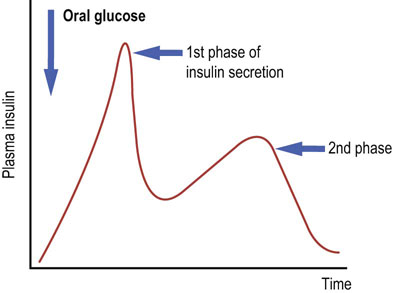
Fig. 21.3 Insulin secretion.
Note the two phases of insulin secretion. Glucose is the most important stimulator of insulin secretion. Other stimulators are some of the amino acids (branched-chain amino acids), stimulation of the vagus nerve and the hormones secreted by the gut (incretins).
The process of ‘matching’ insulin secretion to the sensed plasma glucose concentration by the β-cell is known as the metabolism-secretion coupling.
Insulin action
Insulin signaling within cells involves a membrane receptor and the phosphorylation cascades
Cellular propagation of the insulin signal includes multiple protein phosphorylations (Fig. 21.4; compare Fig. 13.7). They occur at different sites within the target protein molecules: tyrosine phosphorylation sends signals differently from serine-threonine phosphorylation. The phosphorylations help create conformational changes that enable binding (docking) of other proteins and thus further propagation of the signal.
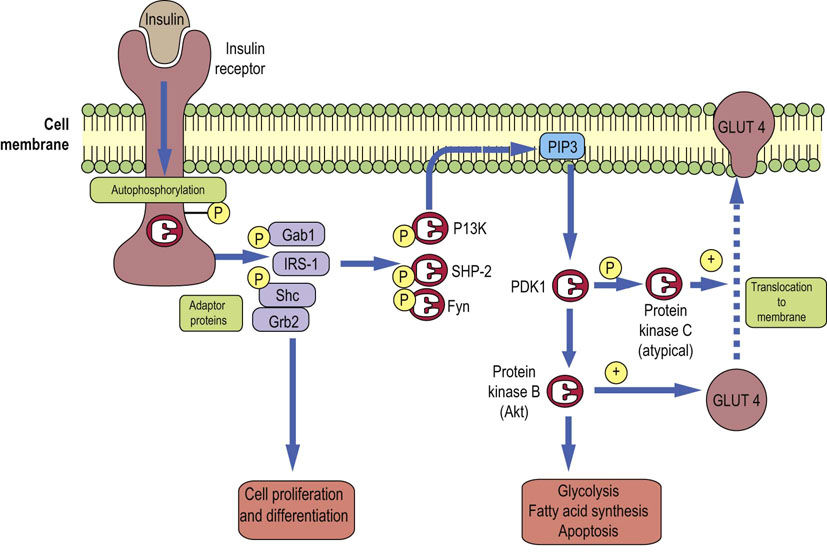
Fig. 21.4 Insulin signaling.
Insulin signaling cascades transfer the signal from the insulin molecule to its target molecules such as regulatory enzymes or the membrane glucose transporter GLUT-4. One signaling pathway involves insulin receptor phosphorylation, phosphorylation of the IRS-1, the phosphoinositol-3-kinase (PI3K), then PDKs and two downstream kinases PKB/Akt and PKC. GLUT4 translocation can also be affected by the PI3K-independent pathway (not shown here). Compare Fig. 13.7. IRS-1, insulin receptor substrate 1; PDK, phosphoinositide-dependent kinase.
First, insulin binds to its receptor, which is a four-subunit protein spanning the cell membrane of a target cell. One subunit of the receptor contains an ATP-binding site and has tyrosine kinase activity. Binding of insulin causes the receptor to phosphorylate itself. The receptor also recruits and phosphorylates several other proteins such as the insulin receptor substrates (designated IRS-1–4), and adaptor proteins Gab1, Shc, Grb2, and others. These in turn dock another set of proteins such as the phosphatidylinositol 3-kinase (PI3K), protein tyrosine phosphatase (SHP2) and Fyn kinase.
As the signal spreads, PI3K generates lipid-based messengers, the phosphoinositol phosphates, the most important being phosphatidylinositol -3,4,5-trisphosphate (PIP3; Chapter 40). They in turn recruit the serine-threonine kinase (protein kinase B, PKB, also called Akt) and the 3′-phosphoinositide-dependent kinases 1 and 2 (PDK1 and 2). PDK1 phosphorylates PKB and protein kinase C (PKC). A form of PKC known as PKC λε is involved in glucose transport and translocation in the adipocytes. Serine-threonine kinases can also phosphorylate IRS-1; this decreases its susceptibility to phosphorylation by the insulin receptor, introducing another regulatory loop. Phosphatases such as the phosphotyrosine phosphatase 1B contribute to the termination of insulin signal.
There is also a PI3K-independent pathway of insulin signaling that also activates glucose transport; the insulin receptor phosphorylates the protein called Cbl, using associated protein substrate (APS) as an adaptor. Phosphorylated Cbl binds to Cbl-associated protein (CAP). CAP in turn binds to flotillin, a protein associated with lipid rafts present in the membrane. Flotillin docks guanyl nucleotide exchange factor (C3G) with the mediation of another adaptor molecule, CrkII. This activates the G-protein called TC-10, which participates in the translocation of the GLUT-4 transporter in adipocytes to the cell membrane, thus affecting the transport of glucose.
Metabolic effects of insulin
Insulin promotes anabolism: the storage of carbohydrates and lipids, and protein synthesis. In parallel, it suppresses the catabolic pathways. Insulin acts on three main target tissues: the liver, adipose tissue and skeletal muscle (Fig. 21.5). The liver is the main target of insulin action in the fasting state. After a meal, the main targets are muscle and adipose tissue.
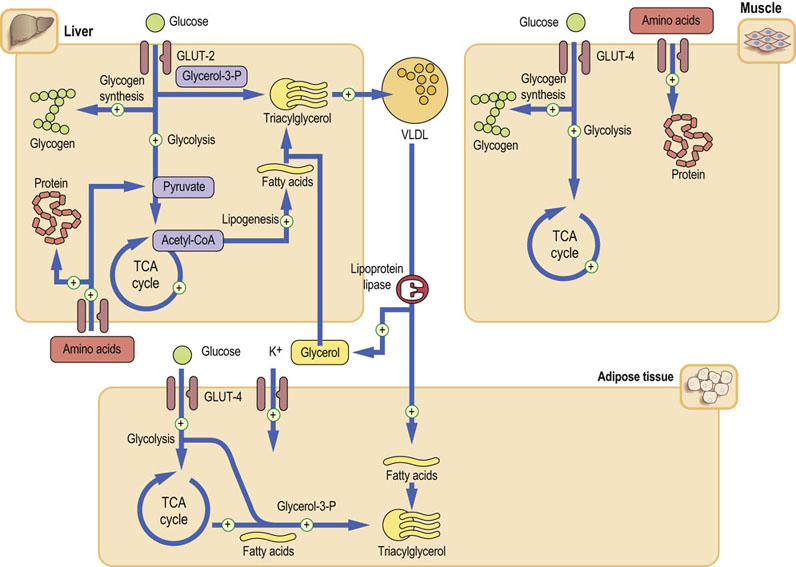
Fig. 21.5 Metabolic effects of insulin.
The principal insulin target tissues are liver, muscle, and adipose tissue. Insulin affects carbohydrate, lipid, and protein metabolism. Insulin, also promotes cellular potassium uptake. The plus sign indicates pathways stimulated by insulin. In most instances insulin also inhibits the opposite processes. Glucose transport in muscle and adipose tissue is mediated by the GLUT-4 transporter and is insulin dependent. On the other hand, the glucose transporter in the liver (GLUT-2) is insulin-independent (compare Fig. 13.7).
In the liver, insulin stimulates glycolysis and glycogen synthesis. At the same time, it suppresses lipolysis and gluconeogenesis. It stimulates synthesis of long-chain fatty acids and lipogenesis – the synthesis of triacylglycerols. It promotes the assembly of the very low-density lipoproteins (VLDL), which transport lipid to the peripheral cells.
In the adipose tissue, insulin stimulates triglyceride synthesis from glycerol-3-phosphate and fatty acids.
In muscle, it stimulates glucose transport, glucose metabolism, and glycogen synthesis. It increases cellular uptake of amino acids and stimulates protein synthesis.
Insulin also induces the endothelial lipoprotein lipase, an enzyme that liberates triacylglycerols from the chylomicrons and VLDL (Chapter 18).
Insulin stimulates glucose transport across cell membrane
Insulin-dependent glucose entry into cells is mediated by proteins known as glucose transporters (Table 8.2). The GLUT-4 transporter controls glucose uptake in skeletal muscle and adipocytes. GLUT-4 cycles between the endosomes and membrane. In an unstimulated cell, most of the GLUT-4 molecules reside intracellularly and no more than 10% are present in the plasma membrane. In humans, insulin doubles the GLUT-4 recruitment to cell membrane. Importantly, muscular contraction increases expression of the GLUT-4 independently of insulin. On the other hand, fatty acids decrease the expression of the GLUT-4 in muscle.
Insulin resistance is a condition in which a given dose of insulin produces a less than expected response in the cell
Insulin resistance affects all the main insulin-responsive tissues. In the liver this results in an increased VLDL production and a procoagulant status (increased fibrinogen synthesis and increased plasminogen activator inhibitor 1, PAI-1), in muscle it causes a decreased glucose uptake, and in adipose tissue the overproduction of free fatty acids and changes in the secretion of adipokines (a decrease in adiponectin and an increase in resistin production).
 Advanced concept box There are several methods of assessment of insulin resistance
Insulin resistance can be assessed by function tests, which are used mostly for research purposes. One such test is the hyperinsulinemic euglycemic clamp: the insulin is infused at a constant rate together with variable amounts of glucose. The rate of glucose infusion is adjusted to keep plasma glucose concentration at 5–5.5 mmol/L (90–99 mg/dL). When a steady state is attained, the rate of glucose infusion is equal to the peripheral glucose uptake and is a measure of insulin sensitivity/resistance. Other tests of insulin resistance are based on the oral glucose tolerance test (see below) and involve frequent measurements of plasma glucose and insulin concentrations after glucose load.
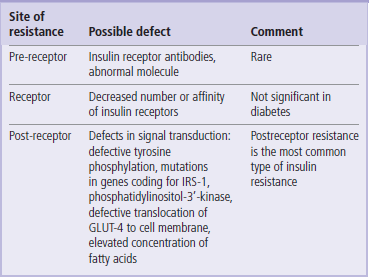
The most important cause of insulin resistance is defective insulin signaling
Within a cell, insulin resistance may be caused by defects at several levels (Table 21.3). It could be a compromised insulin binding to its receptor, for instance due to a very rare mutation in the insulin receptor gene. Resistance can also be caused by antireceptor autoantibodies. The most important causes, however, are defects in the insulin signaling pathways. In type 2 diabetes and in persons with a strong family history of diabetes, the IRS-phosphoinositol kinase pathway may not operate normally. This impairs cellular translocation of GLUT-4, and consequently the glucose uptake. Reduced expression and impaired translocation of GLUT-4 in adipocytes (but not in the skeletal muscle) have been observed both in obesity and in diabetes. Interestingly, adipocytes of GLUT-4-knockout mice show overexpression of a gene for another protein, the retinol-binding protein (RBP). Although RBP is synthesized in adipocytes, it was found to impair insulin signaling in muscle; thus, it serves as an inter-tissue messenger contributing to insulin resistance.
Other causes of insulin resistance include variants of genes coding for IRS-1 and phosphatidylinositol-3-kinase. Peripheral insulin resistance, particularly in muscle, is induced by the presence of excess fatty acids. Fatty acids can also exert a direct harmful effect on the β-cell. The elevated fatty acids concentrations to insulin resistance by inhibiting peripheral glucose disposal, enhancing hepatic glucose output and damaging β-cell function. Steatosis (accumulation of triacylglycerols in liver and muscle), seen in patients with high plasma triglyceride concentrations, also contributes to insulin resistance. These untoward phenomena stimulated by fatty acid excess are known as lipotoxicity.
Metabolic effects of glucagon and other anti-insulin hormones
Anti-insulin hormones antagonize the effects of insulin, promoting hyperglycemia
The anti-insulin hormones mobilize glucose by stimulating glycogenolysis and gluconeogenesis. This leads to an increase in plasma glucose concentration (hyperglycemia).
Glucagon acts on the liver
Glucagon is a single-chain, 29-amino acid peptide, with a molecular weight of 3485 Da. It acts on the liver. It mobilizes fuel reserves to maintain blood glucose concentration between meals. It stimulates glycogenolysis, gluconeogenesis (Table 21.2), the oxidation of the fatty acids and ketogenesis, and inhibits glycolysis, glycogen synthesis and the synthesis of triacylglycerols (Fig. 21.6).
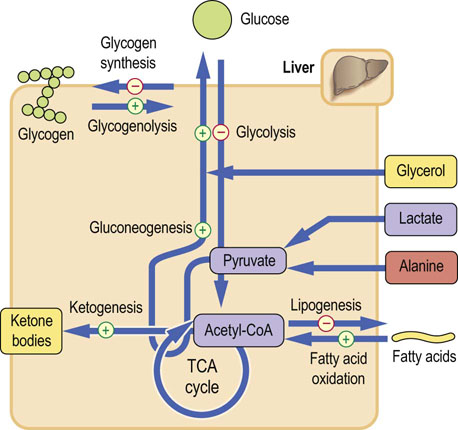
Fig. 21.6 Metabolic effects of glucagon.
Glucagon mobilizes glucose from every available source. It also increases lipolysis, and ketogenesis from acetyl-CoA. Glucagon actions are confined to the liver (compare Fig. 13.4).
Glucagon binds to its own membrane receptor (Chapter 13, Fig. 13.4), which signals through the membrane-associated G-proteins and the cyclic AMP cascade. First, the glucagon–receptor complex causes binding of guanosine 5′-triphosphate (GTP) to a G-protein complex (Chapter 40). This leads to the dissociation of G-protein subunits. One of these subunits (Gα) activates the adenylate cyclase, which in turn converts ATP into cyclic AMP (cAMP). cAMP in turn activates cAMP-dependent protein kinase which, through phosphorylation of several regulatory enzymes, controls the key steps in carbohydrate and lipid metabolism (Figs 21.6 and 21.7).
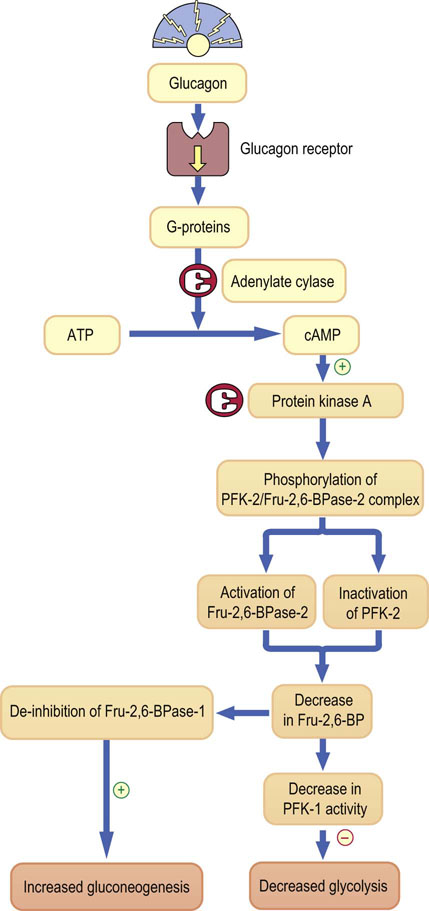
Fig. 21.7 Regulation of glycolysis and gluconeogenesis by phosphofructokinase.
Glucagon regulates gluconeogenesis by controlling the bifunctional enzyme with activities of both phosphofructokinase-2 (PFK-2) and fructose 2,6-biphosphatase-2 (Fru-2,6-BPase-2). Glucagon binds to its membrane receptor and signals through G-proteins, and adenylate cyclase, generating cyclic AMP. cAMP in turn activates protein kinase A. Subsequently, this kinase phosphorylates the PFK-2:Fru-2,6-BPase complex. Phosphorylation activates the bisphosphatase, which degrades Fru-2,6-BP, and lowering of Fru-2,6-BP disinhibits another enzyme, Fru-2,6-BPase-1, in the main pathway of gluconeogenesis. Thus, gluconeogenesis is stimulated. Ingeniously, the decrease in Fru-2,6-BP has a reciprocal inhibitory effect on the key glycolytic enzyme, phosphofructokinase (PFK-1). Thus, glycolysis is inhibited.
There are no glucagon receptors on muscle cells; muscle glycogenolysis is stimulated by another anti-insulin hormone, epinephrine.
Epinephrine acts on liver and muscle
Epinephrine (adrenaline) is a key hormone responsible for hyperglycemia in response to stress. Its metabolic effects are similar to these of glucagon. It inhibits glycolysis and lipogenesis, and stimulates gluconeogenesis. Its receptors are the α- and β-adrenergic receptors (mainly the β2-receptor; Fig. 13.5) and they link to the cAMP signaling cascade.
Hormones regulate key enzymes in the metabolic pathways by several different mechanisms
The rate and direction of metabolic pathways depend on the activity of key (regulatory) enzymes. Hormones target these regulatory enzymes. Regulation can be exerted through several mechanisms: induction or repression of genes that code for these enzymes, phosphorylation and dephosphorylation of enzyme proteins, and other mechanisms such as substrate interactions and allosteric changes. Cell energy level and the redox state of the cell also control their activity (Chapter 6).
Transcription factors directly control gene induction
Induction or repression of genes (Table 21.2) takes days or weeks to take effect, and may occur in response to diet, chronic stress or illness. For example, activities of several hepatic enzymes are different in people on a high-fat diet compared to those on a high-carbohydrate diet.
Gene induction is controlled by transcription factors, proteins which bind to the response elements in gene promoters (Fig. 35.2). Transcription factors are often targets of the hormonal signaling cascades.
Some nuclear receptors such as the peroxisome proliferator-activated receptors (PPARs) act as transcription factors in cooperation with other nuclear receptors. PPARs are important targets of anti-diabetic drugs (Fig. 21.9).
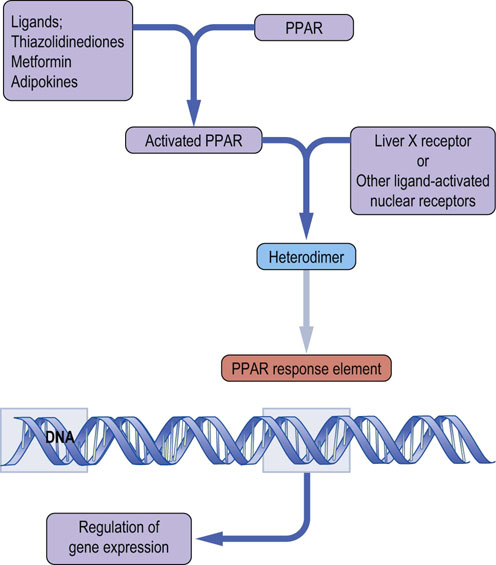
Fig. 21.9 Transcriptional regulation by peroxisome proliferator-activated receptors (PPARs).
PPARs are activated by ligands that may be metabolites or drugs. They form heterodimer complexes with a range of other nuclear receptors. Resulting complexes bind to the PPAR response elements located in gene promoters, regulating gene expression.
Phosphorylation is a key regulatory mechanism in metabolic pathways and signaling cascades
Phosphorylation and dephosphorylation is a fast-acting regulatory mechanism. It commonly controls the key enzymes in the metabolic pathways. It is further fine-tuned by involving several levels of kinases and phosphatases. Phosphorylation/dephosphorylation can also regulate transcription factors. Figure 21.8 illustrates how this mechanism operates in glycogenolysis, gluconeogenesis and lipolysis.
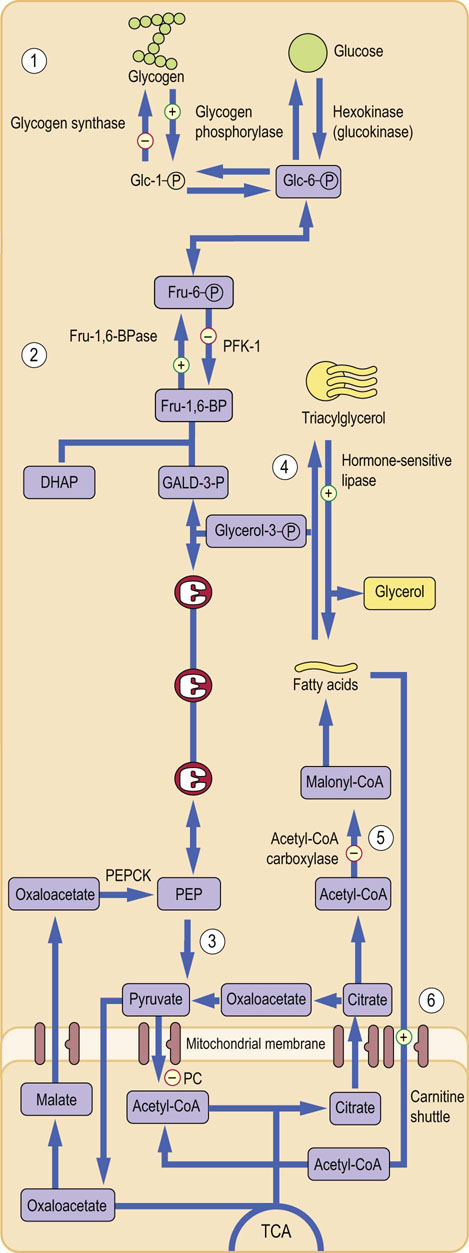
Fig. 21.8 Regulatory role of enzyme phosphorylation.
Phosphorylation of the key enzymes, controlled by glucagon and epinephrine, is the major mechanism of regulation of carbohydrate and lipid metabolism. Phosphorylation usually stimulates enzymes in the catabolic pathways and inhibits enzymes in the anabolic ones. Regulation of glycogen metabolism: glycogen phosphorylase is activated and glycogen synthase is inactivated. This promotes glycogen breakdown (1). Regulation of gluconeogenesis: Fru-2,6-BPase-2 is activated and PFK-2 is inhibited. This decreases Fru-2,6-BP formation and in turn inhibits PFK-1 (glycolysis) and stimulates FBPase (gluconeogenesis) (2). Regulation of glycolysis: normally, Fru-1,6-BP also allosterically activates pyruvate kinase downstream in the glycolytic pathway. Because its formation is decreased, glycolysis slows down (3). Regulation of lipolysis: phosphorylation stimulates hormone-sensitive lipase-stimulating lipolysis (the release of fatty acids from triglycerides) (4). Regulation of fatty acid oxidation: phosphorylation inhibits acetyl-CoA carboxylase, inhibiting the generation of malonyl-CoA (5). Malonyl-CoA normally inhibits carnitine-palmitoyl transferase-1. Lack of malonyl-CoA disinhibits it (6), facilitating the entry of fatty acids into mitochondria. This stimulates lipid oxidation. DHAP, dihydroxyacetone phosphate; GALD-3-P, glyceraldehyde-3-phosphate; PEP, phosphoenolpyruvate.
Insulin and glucagon switch genes on and off during feed–fast cycle
Insulin regulates synthesis of key enzymes by controlling the activity of so-called forkhead transcription factors (they have a helix-turn-helix structure with two additional loops or wings). Two such transcription factors, forkhead box protein 1 (FOXO1) and HNF-3B (FOXA2), are essential for switching metabolism from anabolism to catabolism. FOXO1 promotes gluconeogenesis in the liver in the fasted state, and FOXA2 regulates fatty acid oxidation. They are both inactivated by phosphorylation by kinases in the IRS-1/PKB/Akt pathway.FOXO1 and its co-activators PGC-1 and TORC2 (the latter being cAMP responsive) stimulate gluconeogenesis by activating genes that code for the rate-limiting enzymes phosphoenolpyruvate carboxykinase (PEPCK) and Glc-6-Pase.
During feeding, insulin, again through the IRS-PKB/Akt pathway, phosphorylates and inactivates FOXO1. This inhibits hepatic gluconeogenesis. Insulin also deactivates TORC2. Glucagon, on the other hand, dephosphorylates TORC2, activating it. This leads to induction of the gluconeogenic enzymes.
FOXA2 regulates fat breakdown in the fasted state by inducing genes encoding enzymes of glycolysis, fatty acid oxidation, and ketogenesis. This leads to an increase in the concentrations of free fatty acids, ketone bodies and triacylglycerols, and to a decrease in liver triacylglycerol content. Insulin phosphorylates and inhibits FOXA2 through the IRS-PKB/Akt pathway (Fig. 21.4).
The incretin hormones
Hormones secreted in the gut potentiate insulin secretion
Gastrointestinal hormones, such as glucagon-like peptide-1 (GLP-1) and the glucose-dependent insulinotropic peptide (also known as gastric inhibitory peptide; GIP) and also cholecystokinin, and vasoactive intestinal peptide (VIP), potentiate insulin secretion. They are secreted following ingestion of foods (being stimulated by the increase of glucose concentration in the intestinal lumen). This is known as the incretin effect and explains why insulin response to orally administered glucose is greater than to its intravenous infusion. Insulin secretion is also stimulated by amino acids, such as leucine, arginine, and lysine.
GLP-1 is secreted in the intestinal mucosa by the L-cells, mostly in the distal ileum and colon. It occurs in two forms, GLP-1 (7–37) and GLP-1 (7–36) amide, the latter present in a higher concentration. GLP-1 secretion increases rapidly after a meal. In the presence of elevated glucose concentration, GLP-1 increases insulin secretion by the pancreatic β-cells. It also decreases glucagon secretion and thus decreases endogenous glucose production. This effect diminishes with decreasing glucose concentration. GLP-1 also decreases gastric emptying and increases the feeling of satiety. It also stimulates proliferation of the β-cells. GIP is a 42 amino acid molecule synthesized in the K-cells in the duodenum and jejunum.
GLP-1 and GIP act through G-protein-coupled receptors. The GLP-1 receptor is present in the β- and α-cells in the pancreatic islets, and also in the peripheral tissues. In addition to increasing insulin secretion they also stimulate β-cell proliferation and decrease apoptosis, acting through the PKA-mediated pathway. GLP-1 and GIP are inactivated by the dipeptidyl peptidase-4 (DPP-4).
The feed–fast cycle
Human metabolism oscillates between the fed state and the fasting state. The ‘switch’ which determines metabolic changes is the molar ratio of insulin to glucagon in plasma. The fed state (also called the absorptive or postprandial state) occurs during a meal and for several hours after and is characterized by high insulin and low glucagon concentration (a high insulin/glucagon ratio). Fasting, on the other hand, is a low-insulin/high-glucagon state. Fasting for 6–12 h is called the postabsorptive state. Fasting that lasts longer than 12 h is ‘prolonged fasting’ or starvation.
Metabolism in the fed state
A meal stimulates insulin release and inhibits glucagon secretion
Nutrients present in a meal stimulate insulin release and suppress the secretion of glucagon. This affects metabolism in the liver, adipose tissue, and muscle (Fig. 21.10). Glucose utilization by the brain remains unchanged. There is an increase in glucose uptake in the insulin-dependent tissues, principally in the skeletal muscle. Glucose oxidation and glycogen synthesis are stimulated, and lipid oxidation is inhibited. Glucose taken up by the liver is phosphorylated by glucokinase, yielding glucose-6-phosphate (Glc-6-P). Excess glucose is directed into the pentose phosphate pathway, generating NADPH + H+ that is used in biosyntheses that require reductions, such as synthesis of fatty acids and cholesterol.

Fig. 21.10 Metabolism in the fed (postprandial) state.
Carbohydrates, amino acids and fats are absorbed in the intestine, and insulin secretion is stimulated. Insulin directs metabolism towards storage and synthesis (anabolism). In the liver, glucose is taken up by the GLUT-2 transporter and is channeled into glycolysis and glycogen synthesis. Aerobic glycolysis supplies acetyl-CoA, which is a key substrate for fatty acid synthesis. The fatty acids are subsequently esterified by glycolysis-derived glycerol, forming triacylglycerols in a process known as lipogenesis. Triacylglycerols are packaged into VLDL for transport to peripheral tissues. In muscle, glycogen synthesis, amino acid uptake and protein synthesis are stimulated. In the adipose tissue, VLDL triacylglycerols are hydrolyzed and fatty acids are taken up by cells. Triacylglycerols are resynthesized intracellularly, becoming adipocyte storage material. DHAP, dihydroxyacetone phosphate; Glc-6-P, glucose-6-phosphate.
Fat (triacylglycerols) absorbed in the intestine is transported in chylomicrons to peripheral tissues, where it is hydrolyzed to glycerol and free fatty acids by lipoprotein lipase (Chapter 18). The released fatty acids are taken up by cells. In muscle they are used as fuel. In the adipose tissue they are reassembled into triacylglycerols and stored. The reassembly of triacylglycerols requires glycerol, which is provided from glycolysis (triose phosphate being reduced to glycerol-3-phosphate). Insulin stimulates synthesis of fatty acids in the liver and adipose tissue. It also stimulates amino acid uptake and protein synthesis, and decreases protein degradation in liver, muscle, and adipose tissue.
Metabolism in the fasting state
During fasting the liver switches from a glucose-utilizing to a glucose-producing organ
During fasting, insulin secretion decreases and glucagon secretion increases (Fig. 21.11). This leads to a decrease in glycogen synthesis and an increase in glycogenolysis. The liver is transformed from a glucose-utilizing to a glucose-producing organ. After an overnight fast, a steady state is attained, with hepatic glucose production becoming equal to its peripheral uptake.
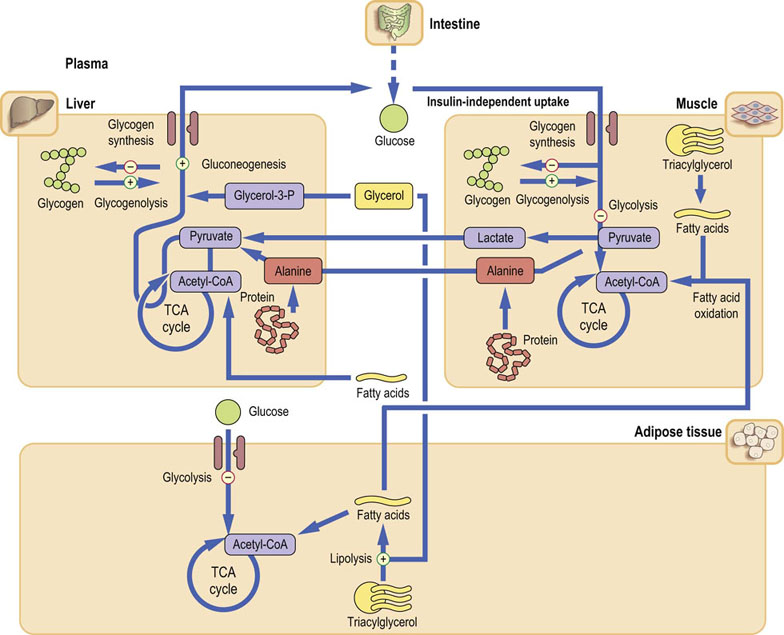
Fig. 21.11 Metabolism after an overnight fast (postabsorptive state).
In the postabsorptive state, liver metabolism changes from glucose utilization to glucose production (through gluconeogenesis stimulated by glucagon). Glucagon also stimulates glycogenolysis and inhibits glycolysis. The substrates for gluconeogenesis are alanine, lactate and glycerol. Alanine and lactate are transported to the liver from muscle (see Fig. 21.13). Glucose uptake by the muscle and adipose tissue decreases. Degradation of triacylglycerols (lipolysis) and subsequent fatty acid oxidation are stimulated, providing energy.
The three key substrates for gluconeogenesis are lactate, alanine and glycerol
In the fasting state the insulin-dependent tissues use relatively little glucose – the muscle and adipose tissue together use only 20% of all available glucose. As much as 80% of all glucose is taken up by insulin-independent tissues. Of this, 50% goes to the brain and 20% to the erythrocytes.
After a 12 h fast, 65–75% of synthesized glucose is still derived from glycogen; the rest comes from gluconeogenesis. During longer fast, the contribution of gluconeogenesis steadily increases. Muscle facilitates gluconeogenesis by releasing lactate, which is taken up by the liver. It is oxidized to pyruvate, which enters gluconeogenesis. The newly synthesized glucose is released from the liver and returns to the skeletal muscle. This closes the loop known as the Cori cycle (Fig. 21.12).
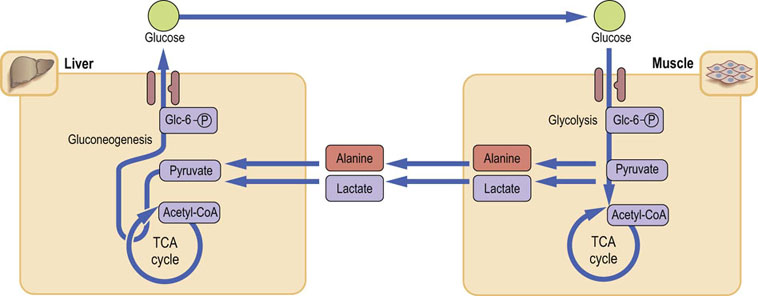
Fig. 21.12 Cori cycle and glucose–alanine cycle.
The Cori (glucose–lactate) cycle allows recycling of lactate back to glucose. Alanine is derived mostly from muscle proteolysis.
Low insulin concentration contributes to the release of amino acids (primarily alanine and glutamine) from muscle by stimulating muscle proteolysis. Alanine, analogously to lactate, is taken up by the liver, and converted to pyruvate. This glucose–alanine cycle parallels the Cori cycle.
The third gluconeogenic substrate, glycerol, is released during the hydrolysis of triacylglycerols by the hormone-sensitive lipase (lipolysis), a process stimulated by glucagon. The fatty acids liberated from triacylglycerols stimulate ketogenesis from the acetyl-CoA. Ketogenesis in turn yields acetoacetate, hydroxybutyrate, and the product of spontaneous decarboxylation of acetoacetate, acetone (the products of ketogenesis are collectively known as ketone bodies). During prolonged fasting, ketone bodies can be used as energy substrates in the heart and skeletal muscle, and also the brain.
Prolonged fasting
Prolonged fasting (starvation) is a chronic low-insulin, high-glucagon state. It is also accompanied by a decrease in the concentration of thyroid hormones: this decreases the metabolic rate. Free fatty acids now become the major energy substrate – the β-oxidation of the fatty acids generates acetyl-CoA to be used in the TCA cycle.
However, because the ongoing gluconeogenesis depletes oxaloacetate (the TCA cycle metabolite), the activity of the TCA cycle (Chapter 14) decreases. This causes accumulation of the acetyl-CoA and its channeling into ketogenesis. Thus, during prolonged fasting, the concentration of ketone bodies in plasma increases.
In addition, there are mechanisms that protect body proteins during starvation, by decreasing the need for endogenous glucose production.
The use of proteins as substrates for gluconeogenesis is minimized by almost total dependence on fat as energy source (Fig. 21.13). The Cori cycle also decreases the requirement for endogenous glucose. Further, the amount of the GLUT-4 transporter in the adipose tissue and muscle decreases, decreasing cellular glucose uptake and thus ‘saving’ even more glucose. Eventually, the brain also adapts to the use of ketone bodies as fuel. Some brain tissue actually switches from complete oxidation of glucose to glycolysis.
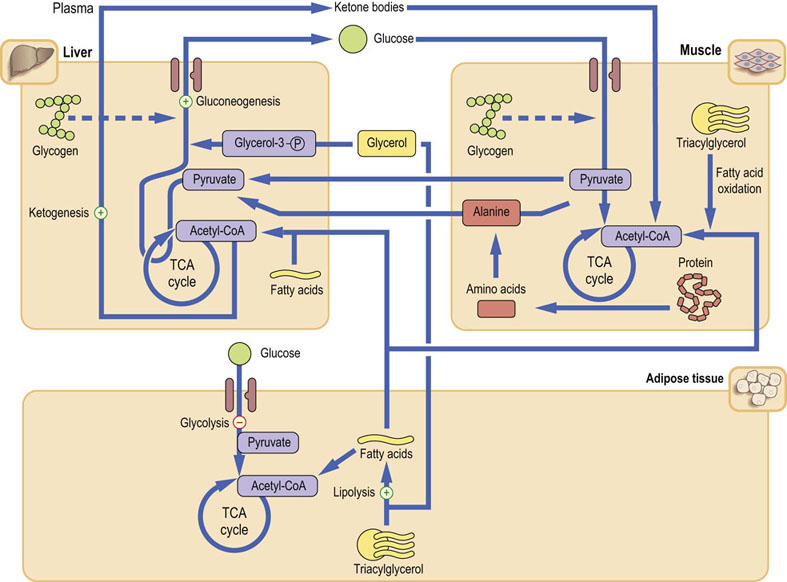
Fig. 21.13 Metabolism during prolonged fast (starvation).
The catabolic state is similar to that during short-term fasting, but adaptive responses are in operation. At this stage glycogen stores are depleted, and the supply of metabolic fuels depends on gluconeogenesis and lipolysis. Ketone bodies produced from large amounts of acetyl-CoA generated by fatty acid oxidation become an important energy source for the muscle. The brain also adapts to their use. Importantly, decreased demand for glucose (and thus gluconeogenesis) in turn decreases the demand for alanine, ‘sparing’ muscle proteins.
Metabolism during stress
Response to stress is driven by the anti-insulin hormones
The stress response occurs not only during ‘fight and flight’ situations but is also triggered by trauma, burns, surgery and infection: therefore it is fundamentally important in medicine. Generally, it is associated with hypermetabolism and the increased activity of the sympathetic nervous system. The metabolic response is driven by the anti-insulin hormones: catecholamines, primarily epinephrine (Fig. 13.5), glucagon and cortisol. The anabolic pathways (glycogen synthesis, lipogenesis) are suppressed, and the catabolic pathways (glycogenolysis, lipolysis, and proteolysis) are stimulated. The insulin-independent peripheral glucose uptake increases (Fig. 21.14). Clinically, there is early vasoconstriction, which aims to limit possible blood loss. There is also fever, tachycardia, tachypnea (increased respiratory rate), and leukocytosis.
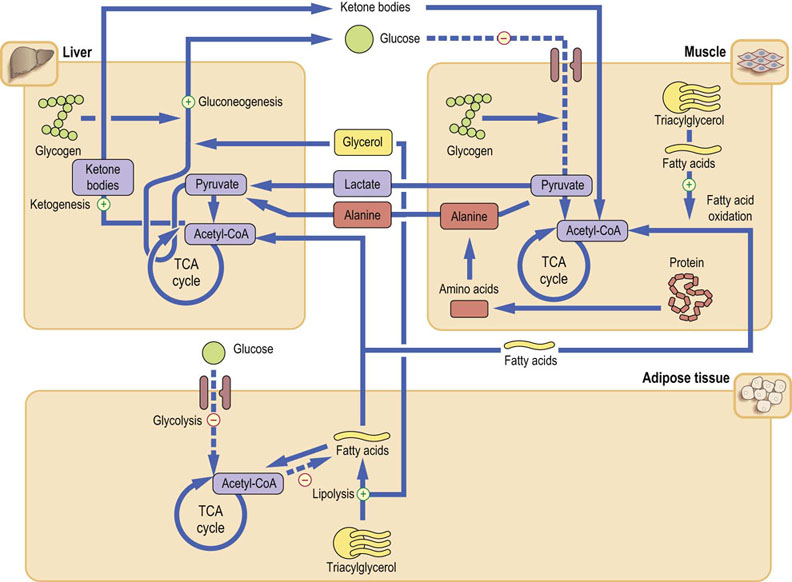
Fig. 21.14 Metabolism during stress and injury.
The metabolic response is catabolic, and is broadly analogous to fasting. Glucose is mobilized from all available sources. However, here epinephrine plays a key role and, together with glucagon, inhibits insulin secretion. Stress also induces peripheral insulin resistance, further sparing glucose. Energy is provided from glucose, fatty acids and from protein catabolism.
Stress response mobilizes energy substrates from all available sources
The priority is to provide glucose for the brain: epinephrine and glucagon stimulate glycogenolysis and gluconeogenesis. In addition, decreased peripheral uptake of glucose makes more of it available to the brain. Later, the metabolic rate increases and fatty acids become the major source of energy. The amino acids for gluconeogenesis are supplied from the muscle; this leads to the negative nitrogen balance within 2–3 days of injury.
Stress response includes insulin resistance
Insulin-dependent transport of glucose into cells, mediated by GLUT-4, decreases under the influence of the glucocorticoids. Also, glucocorticoids, by inducing genes coding for Glc-6-Pase and PEPCK, facilitate stimulation of gluconeogenesis by glucagon and catecholamines (Table 21.3). Insulin-independent glucose uptake increases, particularly in muscle. This is mediated by tumor necrosis factor α (TNF-α) and cytokines such as interleukin-1 (IL-1) (Chapter 42). TNF-α also stimulates muscle glycogen breakdown. IL-6 helps to induce PEPCK, stimulates lipolysis in the adipose tissue, and contributes to muscle proteolysis. There is an increase in lactate production.
Stress response affects results of laboratory tests
Metabolic response to stress affects the results of common laboratory measurements. The key finding is hyperglycemia; importantly, during stress a degree of hyperglycemia should not be confused with diabetes mellitus. Also, injury, infection, and trauma are associated with the acute phase response, which stimulates synthesis of a range of proteins, such as α1-antitrypsin, C-reactive protein (CRP), haptoglobin, α1-acid glycoprotein, complement and others. On the other hand, the albumin synthesis is suppressed. The measurements of CRP are essential in monitoring the progress of treatment in patients with severe infections (Chapter 4).
 Clinical box A woman with chest pain and elevated plasma glucose concentration
a stress-induced hyperglycemia
A 66-year-old woman was admitted to the cardiology ward with chest pain. A myocardial infarction was diagnosed on the basis of EKG and increased plasma troponin concentration. She was successfully treated with thrombolysis. At that time, her random plasma glucose concentration was 10.5 mmol/L (189 mg/dL). Next day the fasting blood glucose was only slightly raised at 7.5 mmol/L (117 mg/dL). Normal fasting plasma glucose is 4.0–6.0 mmol/L (72–109 mg/dL).
Major stress associated with myocardial infarction is associated with the counterregulatory hormone response and this leads to the elevation of blood glucose concentration. Care is needed in the interpretation of raised fasting plasma glucose levels in the context of acute illness. A glucose tolerance test should not be performed during acute illness.
Diabetes mellitus
According to the International Diabetes Federation (2012 data) there are 371 million people living with diabetes worldwide (these numbers include the predicted number of undiagnosed cases). The prevalence of diabetes is on the increase. There were 80 million diabetic individuals in 1985 and it is predicted that there will be up to 430 million in 2030 (see Tuchman in the Further reading section). This increase is linked to lifestyles that include excess of high-energy foods combined with little physical exercise – and to the rising prevalence of obesity. Diabetes results from a combined effect of genetic and environmental influences. In other words, the environmental effects and lifestyle are likely to cause diabetes in persons who are genetically (and epigenetically, see Chapter 36) susceptible. More than 40 loci have been currently associated with type 2 diabetes alone: however, only around 10% of heritability of diabetes can be explained by these loci.
Diabetes is a disorder of fuel metabolism characterized by hyperglycemia and (later) by vascular damage
There are two major components to the syndrome of diabetes mellitus: the hyperglycemia and the vascular complications. There are four main forms of diabetes mellitus: type 1 diabetes (T1D), type 2 diabetes (T2D), secondary diabetes, and gestational diabetes (GDM, diabetes of pregnancy).
The most common is T2D: 90% of all diabetic patients have T2D, and 5–10% have T1D. The other two forms are, in comparison, rare. Diabetes has a strong genetic component but is often unmasked by lifestyle factors. Importantly, some diabetic patients have no clinical symptoms at all. In these individuals the diagnosis is made solely on the basis of laboratory results – hence the importance of laboratory tests (Table 21.4).
Table 21.4
Classification of diabetes mellitus
| Syndrome | Comments |
| Type 1 | Autoimmune destruction of β-cells |
| Type 2 | Impairment of β-cells: B-cell inability to compensate for insulin resistance |
| Other types | Genetic defects of β-cells (e.g. mutations of glucokinase gene). Rare insulin resistance syndromes |
| Diseases of exocrine pancreas. Endocrine diseases (acromegaly, Cushing's syndrome). Drugs and chemical-induced diabetes, infections (e.g. mumps) | |
| Rare syndromes characterized by the presence of antireceptor antibodies Diabetes accompanying other genetic diseases (e.g. Down syndrome) |
|
| Gestational diabetes | Any degree of glucose intolerance diagnosed in pregnancy |
Type 1 diabetes was in older literature described as insulin-dependent diabetes (IDDM) and type 2 as noninsulin-dependent diabetes (NIDDM) or maturity-onset diabetes.
In the long term, diabetes leads to changes in the walls of small (microangiopathy) and large (macroangiopathy) arteries. Microangiopathy occurring in the kidney (diabetic nephropathy) may lead to kidney failure (see Box on p. 329). Microangiopathy developing in the retina (diabetic retinopathy) may cause blindness, and that occurring in the nervous system (diabetic neuropathy) leads to impairment of autonomic nerve function. Diabetic patients also develop lens opacities (cataracts). Diabetes is the main cause of blindness in the Western world and one of the main causes of kidney failure.
Diabetic macroangiopathy is associated with a 2–3 times greater risk of myocardial infarction than in nondiabetic persons of similar age. When macroangiopathy affects peripheral arteries, it leads to diabetic peripheral vascular disease, and to foot ulceration: diabetes remains a major cause of lower limb amputations. However, the most prevalent complication of diabetes is cardiovascular disease, which is the cause of death in more than 80% of type 2 diabetic patients.
Type 1 diabetes
Type 1 diabetes is an autoimmune disease
T1D usually develops in people below 35 years of age, with the peak incidence at approximately 12 years. However, this seems to change: more recent data suggest that only 50–60% of patients are now younger than 16-18 years at presentation. T1D is caused by autoimmune destruction of the pancreatic β-cells. Its precipitating cause remains unclear; it could be a viral infection (e.g. congenital rubella), environmental toxins or foods. The autoimmune reaction could be initiated by the cytokine response to infection.
Susceptibility to type 1 diabetes is inherited
The concordance rate for T1D in monozygotic twins is 30–40%. The risk of diabetes is greater if there is paternal (compared to maternal) history. Susceptibility genes are located on chromosome 6 in the major histocompatibility complex (MHC; Chapter 38). Approximately 50% of the genetic susceptibility to diabetes resides in the HLA genes: HLA genotypes DR and DQ, and to a lesser extent in other loci known as IDDM2 (insulin-VNTR) and IDDM12 (CTLA-4). Both genes imparting risk (DR3/4, DQA1*0301-DQB1*0302 and DQA1*0501-DQB1*0201) and genes imparting protection (DQA1*0102-DQB1*0602) have been identified within the HLA complex. Interestingly, this region also contains susceptibility genes associated with other autoimmune diseases; this means that patients with type 1 diabetes are more susceptible to other autoimmune disorders such as Graves' disease, Addison's disease and celiac disease.
In addition to the inflammatory infiltration of the islets resulting from the abnormal T cell response (Chapter 38), a proportion of patients demonstrate an abnormal B cell response with circulating antibodies against various β-cell proteins. The autoantibodies may appear years before diagnosis and might be directed against insulin, glutamic acid decarboxylase (GAD) and to protein tyrosine phosphatase, or against islet antigens.
Persons with T1D are prone to the development of ketoacidosis and are dependent on insulin treatment. The development of symptomatic disease may happen quickly, and diabetic ketoacidosis may be present at diagnosis.
Type 2 diabetes
Impairment of β-cell function is the main factor in the development of type 2 diabetes
T2D usually develops in obese patients who are over 40 years old. However, in recent years, it has been increasingly observed in younger people. There has been a long-standing discussion of which of the two main contributing factors is dominant: the impairment of the pancreatic β-cell function (and consequently insulin secretion) or the peripheral insulin resistance. Recent interpretations favor the former. The majority of the discovered diabetes susceptibility genes are linked to insulin secretion and to the β-cell function. Thus, the inability of the β-cell to deal with the excessive nutrient supply, and to compensate for the existing insulin resistance, is the main factor leading to the development of diabetes. There is also a wider derangement of the glucose homeostatic system. This includes increased glucagon secretion, reduced incretin response, and also decreased secretion of adiponectin and inflammation in the adipose tissue.
Obesity is a key risk factor for type 2 diabetes
The two most important risk factors for T2D are family history and obesity. Obesity, in turn, is closely linked to insulin resistance.
Insulin resistance first presents as hyperinsulinemia with normal glucose concentration – a sign of the β-cells effectively compensating for the peripheral insulin resistance. When such compensation fails, plasma glucose concentration may increase slightly on fasting (this condition is known as impaired fasting glucose, IFG) or in response to glucose load (impaired glucose tolerance, IGT). Both IFG and IGT are predictors of diabetes. IGT is also associated with an increased risk of macrovascular complications. Further increase in insulin resistance and the consequent impairment of insulin secretion lead to overt T2D. Importantly, the deterioration of glucose tolerance can be slowed down or, occasionally, reversed by weight reduction and exercise. Thus, IFG and IGT are strong signals for individuals to change their lifestyles and minimize the chance of developing overt diabetes later.
Heritability of type 2 diabetes is greater than 50%
Monozygotic twins are approximately 70% concordant with respect to T2D, and the concordance rate in dizygotic twins is 20–30%. First-degree relatives of diabetic persons have a 40% chance of developing the disease.
Population testing identified six genes associated with T2D. They include the one coding for peroxisome proliferator-activated receptor gamma (PPAR-γ). Another gene (IRS1) codes for the IRS-1, and is associated with an impaired peripheral response to insulin. The gene coding for the potassium inwardly-rectifying channel, subfamily J, member 11 (KCNJ11) affects the insulin secretion: it encodes two proteins, which constitute an ATP-sensitive potassium channel that regulates glucose-dependent insulin secretion in the β-cells. Its mutation causes a rare form of neonatal diabetes. The WFS1 gene codes for wolframin, a protein detected in patients with a syndrome including both diabetes insipidus and juvenile diabetes, as well as deafness and optic atrophy. Finally, the genes coding for the HNF1 homeobox A (HNF1A) and HNF1 homeobox B (HNF1B) are associated with forms of monogenic diabetes (MODY, see below).
In 2007 the genome-wide association (GWAS) study identified further two genes associated with T2D, the most important being the solute carrier family 30, member 8 (SLC30A8) – a gene that, somewhat surprisingly, codes for a zinc transporter. Another identified gene was the hematopoietically expressed homeobox HHEX. Still more susceptibility genes were identified by subsequent large meta-analyses of the GWAS studies. These were further genes associated with insulin secretion such as MTNR1B (melatonin receptor), which is associated with impairment of the first phase of insulin secretion. The other ones, such as GCKR and IGF1, are associated with insulin resistance. The obesity-associated genes such as FTO (Chapter 22) are also linked to T2D.
Maturity-onset diabetes of the young (MODY) is a rare form of type 2 diabetes
MODY develops before the age of 25 years, is characterized by persistent C-peptide secretion and a clear pattern of inheritance. MODY results from mutations of at least six different genes; among them are the one coding for the glucokinase (affecting β-cell sensing of glucose and causing MODY2), and for transcription factor HNF1A, which causes MODY3, and HNF1B, which causes MODY5. There is also a mitochondrial DNA mutation that leads to impaired oxidative phosphorylation and causes the so-called mitochondrial diabetes.
The MODY-associated genes also give a fascinating insight into the genetic determination of the response to treatment. In contrast to MODY types caused by the transcription factor mutations, MODY2 responds to diet, and these patients do not require insulin. Patients with HNF1A mutations respond to sulfonylurea drugs.
A continuum between type 1 and type 2 diabetes?
Approximately 10% of patients diagnosed with T2D also have autoantibodies to glutamic acid decarboxylase; these are actually individuals who are developing a form of T1D, sometimes called latent autoimmune diabetes in adults (LADA).
The so-called accelerator hypothesis (developed by Wilkin) proposes that there are the three main ‘accelerators’ of diabetes: the potential for β-cell apoptosis, the insulin resistance and the predisposition to β-cell immunity. If all three are present, T1D develops. If the predisposition to autoimmunity is absent, T2D ensues.
In type 2 diabetes, ketoacidosis is rare
Patients with T2D may develop microvascular complications as in T1D but the main problem is the macrovascular complications, which eventually lead to coronary heart disease, peripheral vascular disease and stroke. T1D and T2D are compared in Table 21.5.
Table 21.5
Comparison of type 1 and type 2 diabetes
| Type 1 | Type 2 | |
| Onset | Usually under 20 years of age | Usually over 40 years of age |
| Insulin synthesis | Absent: immune destruction of β-cells | Preserved: combination of insulin resistance and impaired β-cell function |
| Plasma insulin concentration | Low or zero | Low, normal or high |
| Genetic susceptibility | Yes | Yes |
| Islet cell antibodies at diagnosis | Yes | No |
| Obesity | Uncommon | Common |
| Ketoacidosis | Yes | Rare – can be precipitated by major metabolic stress |
| Treatment | Insulin | Hypoglycemic drugs and insulin |
Metabolism in diabetes
In type 1 diabetes, glucose cannot enter insulin-dependent cells such as adipocytes and myocytes because of lack of insulin
Lack of insulin means that metabolism, by default, enters the glucagon-controlled mode. Glycolysis and lipogenesis are inhibited, whereas glycogenolysis, lipolysis, ketogenesis, and gluconeogenesis are stimulated by glucagon (Fig. 21.15). The liver turns into a glucose-producing organ. This, combined with impaired glucose transport into cells, leads to fasting hyperglycemia.

Fig. 21.15 Metabolism in diabetes mellitus.
In diabetes there is a decreased ability of tissues to use glucose because of insulin lack, defective insulin action, or both. Hyperglycemia results from the combined effect of impaired peripheral glucose uptake and increased liver gluconeogenesis. The excess of fatty acids available to the liver, together with the less efficient TCA cycle due to oxaloacetate being used for gluconeogenesis, results in the accumulation of acetyl-CoA and its conversion into ketone bodies.
When plasma glucose concentration exceeds renal capacity for reabsorption, glucose appears in the urine. Because glucose is osmotically active, its excretion is accompanied by increased water loss (the osmotic diuresis). Poorly controlled diabetic patients pass large volumes of urine (polyuria) and drink excessive amount of fluids (polydipsia). Fluid loss eventually leads to dehydration (Chapter 23). In parallel to the disturbed water balance, lipolysis generates an excess of acetyl-CoA, which enters ketogenesis. The concentration of ketone bodies in plasma increases (ketonemia) and they are excreted in the urine (ketonuria). Overproduction of acetoacetic and β-hydroxybutyric acids increases the blood hydrogen ion concentration (the blood pH decreases). This form of metabolic acidosis (Chapter 24) is known as the diabetic ketoacidosis (Fig. 21.16). In some patients, acetone can be smelled on the breath.
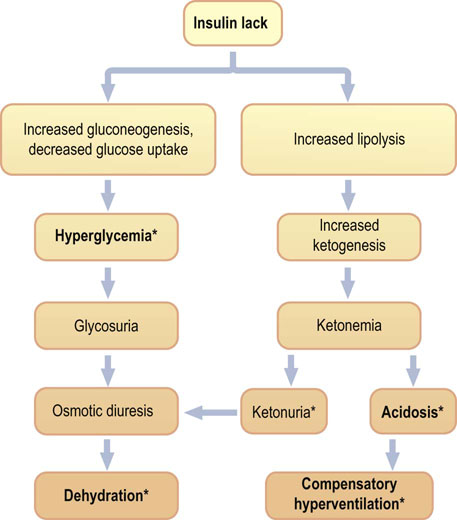
Fig. 21.16 Diabetic ketoacidosis.
Clinical picture of ketoacidosis is a consequence of insulin lack and resulting hyperglycemia and its complications (osmotic diuresis, dehydration), as well as the increased lipolysis and ketogenesis (ketonemia and acidosis). Treatment of ketoacidosis is devised to combat these problems and includes insulin infusion, rehydration and potassium supplementation. *Indicates the most important clinical and laboratory findings.
Ketoacidosis is a major acute complication of poorly controlled diabetes
The key features of diabetic ketoacidosis are hyperglycemia, ketonuria, dehydration and metabolic acidosis. Diabetic ketoacidosis may develop quickly, sometimes even after missing just a single dose of insulin. Ketoacidosis develops predominantly in persons with T1D who have no, or very little, insulin in plasma and, consequently, a very low insulin-to-glucagon concentration ratio. It is rare in T2D, although it may occur after a major stress, such as the myocardial infarction. Untreated ketoacidosis is life-threatening.
Note that there are substantial similarities between metabolism in the fasting state and in diabetes; this is why diabetes was once described as ‘starvation in the midst of plenty’. However, whereas fasting leads just to moderate ketonemia, in diabetes there is accumulation of large amounts of ketone bodies.
Clinical box A 15-year-old girl admitted confused and with breath smelling of acetone
diabetic ketoacidosis
A 15-year-old girl, never known to have diabetes, was admitted to the accident and emergency department. She was confused and her breath had a smell of acetone. She had signs of dehydration with reduced tissue turgor and dry tongue. She also had rapid pauseless respirations. Her blood glucose was 18.0 mmol/L (324 mg/dL) and ketones were present in the urine. Her serum potassium concentration was 4.9 mmol/L (normal 3.5–5.0 mmol/L) and her arterial blood pH was 7.20 (normal 7.37–7.44) (H+ concentration 63 nmol/L; normal 35–45).
This is a typical (if unexpected in this case) presentation of diabetic ketoacidosis. Hyperventilation is a compensatory response to acidosis (see Chapter 24). Diabetic ketoacidosis is a medical emergency. The patient received an intravenous infusion containing physiologic saline with potassium supplements to replace lost fluid, and an infusion of insulin. Note that a substantial proportion of children present with ketoacidosis at the time of diagnosis of diabetes.
Diabetes, obesity, and hypertension are linked with cardiovascular disease
Obesity, insulin resistance and glucose intolerance (or diabetes) may be accompanied by dyslipidemia (Chapter 18) and arterial hypertension. Such cluster of conditions has been described as the metabolic syndrome. It is associated with low-grade inflammation affecting the vasculature (Chapter 18), and with an increased tendency to thrombosis (the hypercoagulable state; Chapter 7). Most importantly, it imparts an increased risk of cardiovascular disease.
‘Metabolic syndrome’ is a concept formulated to increase clinicians' awareness of multiple risk factors for cardiovascular disease when they occur in one individual. The search for a possible common denominator between the major risk factors continues. Increasingly, there is realization that diabetes mellitus and cardiovascular disease may have what some researchers call ‘common soil’. The various links between obesity, diabetes and atherosclerosis are illustrated in Figure 21.17.
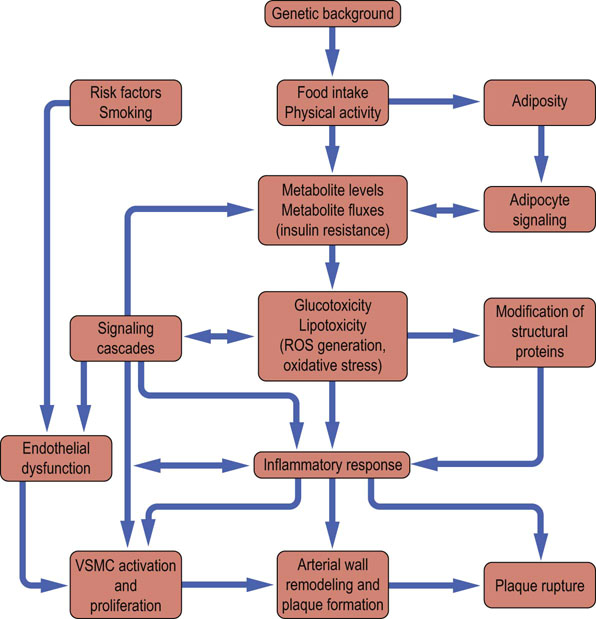
Fig. 21.17 Links between obesity, glucose intolerance, diabetes and atherosclerosis.
In obesity the endocrine activity of the adipose tissue is important in the development of insulin resistance, glucose intolerance and type 2 diabetes. Low-grade inflammation and increased oxidative stress can be induced both by obesity and by the classic cardiovascular risk factors. This results in endothelial damage. Once diabetes is present, protein glycation and formation of the advanced glycation (glycoxidation) end products further contribute to vascular damage.
Clinical box A 56-year-old man with effort-related chest discomfort
diabetes and ischemic heart disease
A 45-year-old man was referred to the cardiology outpatient clinic for investigation of chest discomfort which he felt when climbing steep hills, and when he was stressed or excited. The patient was 170 cm tall and weighed 102 kg (224 lb). His blood pressure was 160/98 mmHg (upper limit of normal 140/90 mmHg), triglyceride concentration was 4 mmol/L (364 mg/dL) (desirable level, 1.7 mmol/L, 148mg/dL), and fasting plasma glucose was 6.5 mmol/L (117 mg/dL). His resting EKG was normal but an ischemic pattern was observed during exercise testing.
This obese man presented with arterial hypertension, hypertriglyceridemia, and impaired fasting glucose. The impaired fasting glucose in this case was due to peripheral insulin resistance. Such a cluster of abnormalities is known as the metabolic syndrome and carries increased risk of coronary heart disease.
The vascular complications of diabetes mellitus
Oxidative stress, advanced glycation (glycoxidation) end products and activity of the polyol pathway contribute to the development of vascular complications
Glucose is toxic in excess. In the presence of transition metals such as copper, it undergoes autooxidation. This generates reactive oxygen species (ROS, Chapter 37). Glucose also attaches nonenzymatically to lysine and valine residues on tissue and plasma proteins in a process known as protein glycation (Fig. 21.18). When glucose interacts with a protein, it first forms a labile compound known as a Schiff base. This, through the so-called Amadori rearrangement, transforms spontaneously to ketoamine. The most widely studied Amadori product is the glycated hemoglobin (hemoglobin A1c, HbA1c). Other proteins such as albumin, collagen and apolipoprotein B also undergo glycation. Glycation affects functions of proteins: for instance, their binding to membrane receptors. For example, glycation of apolipoprotein B inhibits the cellular uptake of LDL particles.
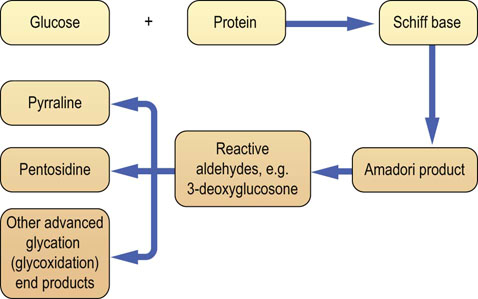
Fig. 21.18 Modification of proteins by glucose: protein glycation and formation of the advanced glycation (glycoxidation) end products.
Nonenzymatic, concentration-dependent, glycation reaction between glucose and protein modifies structure and function of affected proteins. Glycated proteins (Amadori products) are substrates for the formation of the advanced glycation (glycoxidation) end products (AGE). In addition, triose phosphates generated by glycolysis and the increased activity of the polyol pathway can generate reactive precursors of AGE such as methylglyoxal and 3-deoxyglucosone. (Compare Fig. 44.6.)
Further oxidation, rearrangement, dehydration and fragmentation of the Amadori products lead to the formation of a family of compounds known as advanced glycation (also known as glycoxidation) end products (AGE). It also generates compounds that possess chemically very active carbonyl groups, such as 3-deoxyglucosone, glyoxal and methylglyoxal (see Fig. 21.18 and also Fig. 44.6). Some of the AGEs are in fact protein crosslinks, forming, for instance, on collagen or myelin, and decreasing elasticity of these proteins. AGE normally accumulate with increasing biological age and this accelerates in diabetes, in the presence of hyperglycemia. AGE bind to their membrane receptors on the endothelial cells, generating oxidative stress. This damages endothelium and stimulates the proinflammatory pathway involving the transcription factor NFκB. NFκB, in turn, controls the expression of a range of inflammatory cytokines such as TNF-α, and IL-1α and IL-6. The result is chronic low-grade inflammation, known to harm vascular endothelium further. Thus, formation of the AGE is a factor in the development of the microvascular complications of diabetes. It also contributes to atherogenesis. AGE may also be involved in the pathogenesis of other age-related diseases such as Alzheimer's disease.
In addition, the ROS generated during hyperglycemia impair endothelium-dependent relaxation of vascular smooth muscle cells. This is because the vasodilatory nitric oxide (NO) generated by the endothelial cells from arginine is rapidly deactivated by superoxide, forming peroxynitrite radical, which itself is an oxidant. ROS also interfere with signaling cascades, affecting, for instance, the activation of protein kinase C. Hyperglycemia also increases the amount of proton donors within mitochondria, causing increased electrochemical potential difference across the inner mitochondrial membrane and, consequently, increased ROS generation by the respiratory chain (Fig. 37.4). It has been suggested that increased mitochondrial ROS production is the primary cause of long-term diabetic complications.
Increased activity of the polyol pathway is associated with diabetic neuropathy and ocular cataracts
Hyperglycemia alters cellular redox state, by increasing the NADH/NAD+ ratio and decreasing NADPH/NADP+. This directs substrates into the polyol pathway, where glucose is reduced to sorbitol by the aldose reductase (Fig. 21.19). Importantly, because the synthesis of NO from arginine requires NADPH, the aldose reductase and nitric oxide synthase compete for it. Sorbitol is further oxidized to fructose by sorbitol dehydrogenase. Aldose reductase has a high Km for glucose; therefore the polyol pathway is not very active at normal glucose concentrations. However, during hyperglycemia, when glucose concentration in insulin-independent tissues (such as red blood cells, nerve, and lens) increases, the pathway is activated. Similarly to glucose, sorbitol is osmotically active. Its accumulation in the ocular tissue contributes to the development of diabetic cataracts. In the nerve tissue, high concentration of sorbitol decreases the cellular uptake of another alcohol, myoinositol, inhibiting the membrane Na+/K+-ATPase, and thus affecting nerve function. The accumulation of sorbitol, hypoxia and reduced nerve blood flow contribute to the development of diabetic neuropathy. Processes that contribute to the long-term diabetic complications are summarized in Fig. 21.20.
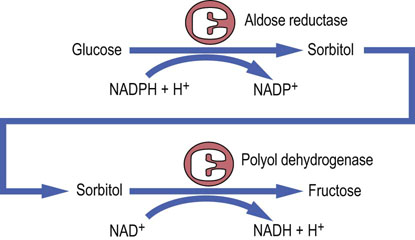
Fig. 21.19 The polyol pathway.
The polyol pathway contributes to the development of diabetic neuropathy. This pathway may be inhibited by inhibitors of its rate-limiting enzyme, aldose reductase.
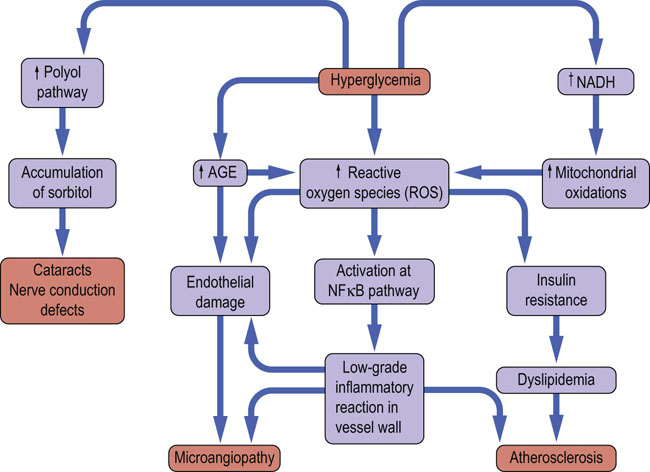
Fig 21.20 Microvascular and macrovascular complications of diabetes mellitus.
Poor glycemic control is associated with development of microvascular complications in type 1 and type 2 diabetes, and with increased cardiovascular risk (the latter particularly in type 2 diabetes). Oxidative stress, protein glycation and formation of advanced glycation (glycoxidation) end products (AGE), are the most important candidate mechanisms of development of microvascular complications. Hyperglycemia stimulates generation of the reactive oxygen species (ROS) through increase in the flow of reductive equivalents through the respiratory chain, and through increased formation of AGE. AGE also generate ROS at different stages of their metabolism. ROS toxicity causes structural and functional damage to proteins and stimulates inflammatory phenomena induced through, for instance, the proinflammatory NFκB pathway. ROS damage endothelium and interfere with insulin signaling, contributing to insulin resistance. The low grade inflammation and insulin resistance are particularly important in atherogenesis, causing macrovascular disease (Chapter 18). Note that increased oxidative stress and low-grade chronic inflammation have also been observed in obesity.
Hypoglycemia
Hypoglycemia (the low blood glucose) is blood glucose concentration below 4 mmol/L (72 mg/dL). Low plasma glucose stimulates the sympathetic nervous system. Epinephrine and glucagon are released, initiating the stress response. This manifests itself as sweating, tremor, tachycardia, and a feeling of hunger. The decreased glucose supply to the nervous system (neuroglycopenia) compromises brain function: the affected person becomes confused and may lose consciousness (this usually happens when glucose concentration falls below 2.5 mmol/L (45 mg/dL)). Profound hypoglycemia can be fatal.
Hypoglycemia in healthy individuals is usually mild and may occur during exercise, after a period of fasting, or as a result of drinking alcohol. Alcohol increases the intracellular NADH/NAD+ ratio: this favors conversion of pyruvate to lactate and reduces the amount of pyruvate available for gluconeogenesis. Hypoglycemia may also occur when there is an insufficient amount of counter-regulatory hormones to balance the effects of insulin; this happens in adrenal insufficiency (Chapter 39). Another endocrine cause of hypoglycemia is a rare tumor of the β-cells, insulinoma, which may secrete large amounts of insulin. The rare causes of hypoglycemia in childhood are glycogen storage diseases (Chapter 13 and Clinical Box on p. 157). The causes of hypoglycemia are summarized in Fig. 21.21.
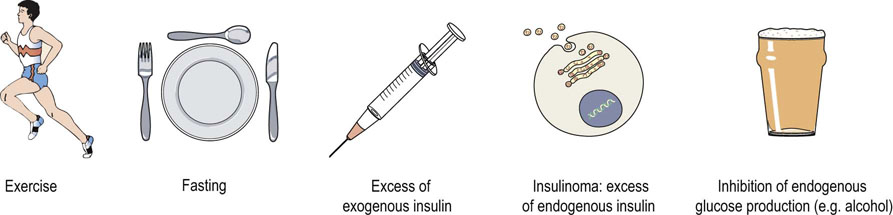
Fig. 21.21 Hypoglycemia.
Hypoglycemia is a plasma glucose concentration below 4 mmol/L (72 mg/dL). Severe hypoglycemia is a glucose concentration below 2.5 mmol/L (45 mg/dL). Hypoglycemia may result from decreased supply of glucose or from an increased insulin secretion. It also results from increased utilization of glucose by tissues (e.g. during exercise).
Hypoglycemia is the most common acute complication of diabetes
It is worth remembering that the most common acute complication of diabetes is not ketoacidosis but hypoglycemia. It can occur in both T1D and T2D. It results from imbalance between insulin dose, carbohydrate supply, and physical activity. Thus, it may occur after taking too much insulin or after missing a meal. Since exercise increases the insulin-independent tissue glucose uptake, diabetic patients, to avoid hypoglycemia, need to decrease their insulin dose before strenuous exercise. Mild hypoglycemia can usually be by taking a sweet drink or eating a few lumps of sugar. Severe hypoglycemia, however, is a medical emergency that requires treatment with intravenous glucose or intramuscular injection of glucagon. Note that the degree of diabetic control achieved during treatment of diabetes is inversely related to the risk of hypoglycemia (the better control, the higher the risk).
Clinical box A 12-year-old diabetic boy WHO lost consciousness on the playing field
hypoglycemia
A 12-year-old diabetic boy was playing with his friends. He received his normal insulin injection in the morning but continued playing through the lunch time without a meal. He became increasingly confused and finally lost consciousness. He was given an injection of glucagon from the emergency kit his father carried, and recovered within minutes. Severe hypoglycemia is a medical emergency.
An immediate improvement after glucagon injection confirms that this boy's symptoms were caused by hypoglycemia, caused by the combination of the administration of exogenous insulin and insufficient food intake. Recovery from hypoglycemia was due to the action of glucagon. In the hospital, hypoglycemic patients who cannot eat or drink are usually treated with intravenous high concentration glucose. An intramuscular glucagon injection is an emergency measure that can be applied at home.
Laboratory assessment of fuel metabolism
Diagnosis and monitoring of patients with diabetes mellitus
Measurement of the plasma glucose concentration is the key diagnostic test for diabetes mellitus
The measurement of plasma glucose concentration is the most important test of fuel metabolism. It needs to be interpreted in relation to the feed–fast cycle. The best time to assess carbohydrate metabolism is after an 8–12 h fast (Fig. 21.11), when the fuel metabolism reaches steady state.
Glucose concentration measured irrespective of the meal times is known as the random plasma glucose. It is useful for the diagnosis of hypoglycemia or severe hyperglycemia, but it is less helpful in assessing the significance of a mild hyperglycemia.
The measurements that are diagnostic for diabetes are the fasting glucose concentration (no caloric intake for approx 10 h) and the concentration measured 2 h after oral ingestion of a standard amount of glucose.
Interpreting the glucose concentration, a clinician wants to know whether it is normal (normoglycemia), too high (hyperglycemia) or too low (hypoglycemia). Further interpretation of hyperglycemia includes the diagnosis of diabetes or identification of the intermediate (prediabetic) stages of metabolism.
A continuum exists between normal, prediabetic and diabetic states
The fasting plasma glucose in an individual is remarkably stable. The prediabetic abnormalities of carbohydrate metabolism are defined as the impaired fasting glucose (IFG) and the impaired glucose tolerance (IGT). The American Diabetes Association (ADA) recommends the diagnosis of IFG. The World Health Organization (WHO) recommends diagnosis of IGT, and this is accepted in Europe.
The diagnostic cut-off points for diabetes mellitus are based on the evidence that higher fasting glucose concentrations constitute a risk for the development of microvascular complications. IGT is also associated with cardiovascular risk, whereas IFG is a risk factor for the future development of diabetes.
Normally, the fasting plasma glucose concentration should remain below 6.1 mmol/L (110mg/dL). The IGT is characterized by a normal fasting level but an elevated concentration 2 h after glucose load. The IFG is defined as an ‘intermediate’ fasting plasma glucose (higher than 6.0 mmol/L but lower than 7.0 mmol/L (126 mg/dL)). The fasting plasma glucose of 7.0 mmol/L (126 mg/dL) or above, if confirmed, is diagnostic for diabetes. The laboratory diagnosis of diabetes is summarized in Table 21.6.
Table 21.6
The equivalence of units of measurement for glycated hemoglobin (HbA1c) measured using the traditional (DCCT) and reference (IFCC) methods
| DCCT units % | IFCC units (mmol/mol) |
| 5 | 31 |
| 6 | 42 |
| 7 | 53 |
| 10 | 86 |
DCCT, Diabetes Control and Complications Trial; IFCC, International Federation of Clinical Chemistry and Laboratory Medicine.
Modified from: Misra S, Hancock M, Meeran K, Dornhorst A, Oliver NS. HbA1c: an old friend in new clothes. Lancet 377:1476–1477, 2011.
Oral glucose tolerance test (OGTT) assesses blood glucose response to a carbohydrate load
WHO recommends that the OGTT is performed on all individuals whose fasting plasma glucose falls into the IFG category. OGTT must be performed under standard conditions. The patient should attend in the morning, after an approximately 10 h fast. To avoid stress- or exercise-related changes in plasma glucose, the person should sit throughout the test. The test should not be performed during, or immediately after, an acute illness. During the test, the fasting plasma glucose is measured first. The patient is then given a standard quantity of glucose to drink (75 g in 300 mL of water) and the plasma glucose concentration is measured again after 120 min (Fig. 21.22). In some protocols glucose is measured after 20, 60 and 120 min. Normally, plasma glucose should reach peak concentration after approximately 60 min and should return to a near-fasting state within 120 min. If it remains above 11.1 mmol/L (200 mg/dL/min) in the 120 min sample, diabetes is diagnosed, even if the fasting blood glucose were normal. Nondiabetic fasting blood glucose with the post-load concentration between 6.1 and 7.8 mmol/L (100–140 mg/dL) signifies IGT. Interpretation of the OGTT is summarized in Table 21.7.
Table 21.7
Diagnostic criteria for diabetes mellitus and glucose intolerance
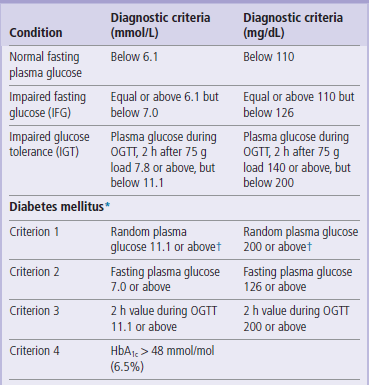
*If one of the criteria is fulfilled, diagnosis is provisional. Diagnosis needs to be confirmed next day using a different criterion.
†If accompanied by symptoms (polyuria, polydypsia, unexplained weight loss). These are the criteria proposed by the American Diabetes Association in 1997 (see Further Reading).

Fig. 21.22 Oral glucose tolerance test (OGTT).
The principle of the test is the measurement of plasma glucose concentration before and after a standard (75 g) oral glucose load. Glucose concentration increases, achieving a peak between 30 and 60 min after the load. It should return to near-fasting values after 2 h. Note higher plasma glucose values at all time points in a diabetic patient.
Glycated hemoglobin (HbA1c) concentration reflects the average concentration of plasma glucose
Knowing an average plasma glucose concentration over a period of time is clinically very relevant, because it is related to the risk of development of late complications of diabetes. Trying to assess the average glycemia by performing multiple plasma glucose measurements is, however, cumbersome. Instead, glycated hemoglobin (hemoglobin A1c, HbA1c) is measured for this purpose. HbA1c forms in the blood erythrocytes at the rate proportional to the prevailing glucose concentration. Because the glycation reaction is irreversible, the formed HbA1c remains in the circulation for the entire life of an erythrocyte. Its amount will reflect the average concentration of plasma glucose (Fig. 21.23) over approximately 8–12 weeks preceding its measurement. The exact time period it reflects is difficult to calculate precisely, because at any time plasma contains populations of erythrocytes of different ages. Values such as 3–6 and 4–8 weeks have also been reported in the literature. Exposure to glucose over 30 days before measurement contributes approximately 50% to observed changes in HbA1c.
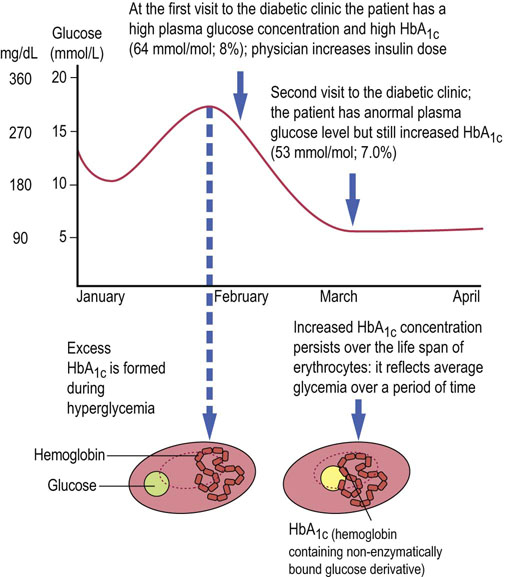
Fig. 21.23 Hemoglobin A1c.
Hemoglobin A1c( HbA1c) is hemoglobin A post-translationally modified by a nonenzymatic glycation. The degree of glycation is proportional to hemoglobin's exposure to glucose during the life span of an erythrocyte. Measurements of HbA1c are used for monitoring of the glycemic control and recently for diagnosis of diabetes. Note that the introduction of a new reference method for the HbA1c resulted in the change of units from the traditional (%) to mmol/mol. The conversion formulas are available (Table 21.6). To obtain glucose concentrations in mg/dL, multiply by 18.
Originally, the HbA1c was measured as a percentage of total hemoglobin. Recently, a reference method capable of measuring the absolute amount of HbA1c has been introduced by the International Federation of Clinical Chemistry and Laboratory Medicine (IFCC). The new method is based on the cleavage of the N-terminal hexapeptide from the β-chain of HbA1c by an endopeptidase, and subsequent separation and quantification by mass spectrometry or capillary electrophoresis. The units employed are mmol/mol. The values obtained by the two methods can be compared using a conversion formula (see Appendix 1). Such comparison is shown in Table 21.6. Note that HbA1c concentration may be affected by anemia and the presence of hemoglobin variants.
HbA1c values can be used to diagnose diabetes and to monitor glycemic control
The guidelines developed by ADA (2012) and WHO (2011) take the HbA1c level of 48 mmol/L (6.5%) or above as diagnostic for diabetes. The HbA1c values are also used in clinical practice to set targets for treatment. The normal concentration of HbA1c is below 6%. ADA recommends that in a diabetic patient one should aim to achieve a concentration below 7% (53 mmol/mol). In some patients, particularly in young children and the elderly, this may be difficult because of the risk of hypoglycemia, and the goals must be adjusted to minimize such risk.
Clinical box A boy WHO did not like diabetes treatment
discrepant glucose and HbA1c results
A 15-year-old insulin-dependent boy visited a diabetic clinic for a routine check-up. He told the doctor that he had followed all the dietary advice and never missed insulin injections. Although his random blood glucose was 6 mmol/L (108 mg/dL), HbA1c concentration was 86 mmol/mol (11%) (adequate control: below 53 mmol/mol, 7%). He had no glycosuria or ketonuria.
Blood and urine glucose results indicate good control of this boy's diabetes at the time of measurement, but the HbA1c level suggests poor control over the last 3–6 weeks. The probability is that he only complied with treatment days before he was due to come to the clinic. This is not uncommon in adolescents, who find it hard to accept the necessity to adjust their lifestyle to, sometimes demanding, diabetes treatment. Measurement of HbA1c identifies diabetic patients who do not comply with treatment.
Urine glucose is not a diagnostic test for diabetes
At a normal plasma concentration, glucose filtered through the renal glomeruli is reabsorbed in the proximal kidney tubules, and none appears in the urine (Chapter 23). The urinary threshold for glucose reabsorption is approximately 10.0 mmol/L (180 mg/dL). At higher concentrations, the reabsorptive capacity of the renal tubular transport system is exceeded, and glucose appears in the urine (this is known as glucosuria). Note that a healthy person may have a low renal glucose threshold and thus show glucosuria at nondiabetic blood glucose levels. Therefore, diabetes cannot be diagnosed on the basis of urine testing alone.
Ketone bodies in urine of a diabetic person signify metabolic decompensation
High concentration of ketones in urine (ketonuria) reflects high rate of lipolysis. Mild ketonuria may occur in healthy individuals during prolonged fasting or on a high-fat diet. However, in a diabetic patient, ketonuria is an important sign of metabolic decompensation, and requires the adjustment of treatment regimen.
Urinary albumin excretion is important in the assessment of diabetic nephropathy
The development of diabetic nephropathy can be predicted by detecting minute amounts of albumin in urine (microalbuminuria). To do this, laboratories employ a method that is more sensitive than the conventional one used for the measurement of serum albumin. The test is positive if more than 200 mg of albumin is excreted in urine over 24 h. Urine protein above 300 mg/day signifies overt proteinuria. In diabetic patients plasma urea and creatinine concentrations are also routinely checked (Chapter 23).
Increased plasma lactate indicates inadequate oxygenation
The high plasma lactate level indicates increased anaerobic metabolism, and is a marker of inadequate tissue oxygenation (hypoxia; Chapter 5). In extreme situations, such as the cardiac arrest, this causes severe acidosis (the lactic acidosis). In diabetes, measurements of plasma lactate are important in rare instances of hyperglycemic nonketotic coma, a life-threatening condition where very high plasma glucose levels and extreme dehydration occur, but there is no ketoacidosis.
Diabetic patients need regular follow-up
During a periodic assessment of a diabetic patient, the physician would check blood glucose and HbA1c concentrations to assess glycemic control. She would perform an eye examination (looking for signs of retinopathy) and neurologic examination (neuropathy). She would also measure urea and creatinine in plasma and microalbumin/protein in urine (to determine the presence, or assess the risk of, nephropathy), and measure plasma lipids (to check the blood pressure and assess the risk of cardiovascular disease; Chapter 18).
Treating diabetes
The control of glycemia prevents the development of diabetic complications
The goal of treatment in diabetes is prevention of acute and chronic complications. Maintaining good glycemic control is fundamental for diabetes care. Two major clinical trials, the Diabetic Control and Complications Trial (DCCT) in T1D and the UK Prospective Diabetes Study (UKPDS) in T2D confirmed that microvascular complications are associated with the severity of hyperglycemia (see Further Reading). There is also a strong evidence that therapeutic interventions that include both glycemic control and the management of cardiovascular risk are optimal for the prevention of long-term complications. Thus, in addition to striving to maintain the plasma glucose concentration close to normal, intensive management of cardiovascular risk factors such as hypertension and dyslipidemia is necessary.
Lifestyle modification is the mainstay of diabetes prevention and a key element of its treatment
Diet and exercise are the key lifestyle factors in the management of diabetes mellitus, and they underpin all drug treatments. They also are essential – and often undervalued – preventive measures. The Diabetes Prevention Program study demonstrated a 58% decrease in development of T2D after lifestyle interventions involving diet and exercise (see Further Reading). Unfortunately, glycemia can be controlled by lifestyle measures alone in less than 20% of all diabetic patients.
Patients with type 1 diabetes are treated with insulin
Insulin remains absolutely necessary for the treatment of T1D. Different preparations of insulin are available and they differ in the duration of their action. The ‘classic’ short-acting insulin is human regular insulin, the intermediate-acting are the Isophane and Lente insulins, and the long-acting is Ultralente. The newer analogs of human insulin are insulin lispro and insulin aspart (short-acting), and insulin detemir and insulin glargine (very long-acting).
Standard insulin treatment protocols involve daily subcutaneous injections throughout life
Patients usually take two subcutaneous injections of intermediate-acting insulin per day, or a mixture of a short-acting and intermediate-acting insulin. The newer so-called basal-bolus approach involves insulin glargine or detemir used as the basal component, and insulin lispro or aspart as boluses added before meals.
The greatest challenge of insulin treatment is replicating normal daily patterns of insulin secretion with insulin injections. Multiple injections of short-acting insulin are used in patients where glycemia is particularly difficult to control. Rarely, a constant insulin infusion is needed: this is delivered by a portable pump programmed to increase the delivery rate at meal times.
Emergency treatment of diabetic ketoacidosis includes intravenous insulin, rehydration and potassium supplementation
Emergency treatment of diabetic ketoacidosis addresses five issues: insulin lack, dehydration, potassium depletion, acidosis and the primary cause of decompensation. Insulin infusion is required to reverse metabolic effect of the excess of anti-insulin hormones, and fluids are infused to treat dehydration. The administered intravenous fluids normally contain potassium to prevent hypokalemia associated with insulin-caused shift of potassium into cells. Such treatment is usually sufficient to control the metabolic acidosis; however, when acidosis is severe, infusion of an alkalinizing solution (sodium bicarbonate) may also be required (see case described on p. 281). Primary cause such as, for instance, infection must also be intensively treated.
Clinical box Diabetic ketoacidosis affects the potassium balance
Insulin increases cellular potassium uptake and the lack of insulin leads to the release of potassium from cells. Since uncontrolled diabetes is also accompanied by osmotic diuresis, the released potassium is excreted in urine. As a result, most patients admitted with ketoacidosis are potassium depleted but, paradoxically, often have normal or raised plasma potassium concentration. When exogenous insulin is given to such patients, it stimulates the entry of potassium into cells and can lead to very low plasma potassium levels (hypokalemia). Hypokalemia is dangerous, owing to its effects on the cardiac muscle. Thus, except for patients with very high plasma concentrations, potassium needs to be given during treatment of diabetic ketoacidosis. (See also Chapters 22 and 23.)
Patients with type 2 diabetes are treated with oral hypoglycemic drugs but may require insulin
T2D patients usually do not require insulin treatment because their insulin synthesis is at least partly preserved; they can be treated with hypoglycemic drugs. However, if adequate control cannot be achieved they do require insulin: each year 5–10% of patients treated with hypoglycemic drugs need to commence insulin treatment with insulin.
Advanced concept box Regulatory role of the PPAR-γ transcription factor
Peroxisome proliferator-activated receptors (PPARs) are ligand-activated nuclear receptors belonging to the steroid receptor family. Binding of a ligand induces conformational change which allows a PPAR to form a heterodimer with another receptor, retinoid X receptor (RXR). PPAR may also bind small molecules, coactivators or corepressors. The complex binds to response elements in gene promoters (Fig. 21.9).
There are three types of PPAR: PPAR-α, which is discussed in Chapter 18, PPAR-γ and PPAR-β. PPAR-γ is predominantly expressed in adipose tissue but also in muscle, liver, intestine and heart. It is activated by polyunsaturated fatty acids and by components of the oxidized LDL. It regulates carbohydrate and fatty acid metabolism, inducing, among others, genes coding for lipoprotein lipase (LPL), GLUT-4 glucose transporter and glucokinase. It also induces the ABCA1 transporter, increasing transfer of cholesterol from cells to the HDL (Chapter 18). It inhibits macrophage activation and the production of cytokines such as tumor necrosis factor (TNF-α), interferon-γ and interleukin-1 (IL-1). PPAR-γ is a target of thiazolidinediones, drugs used in the treatment of T2D.
The antidiabetic drugs
The currently used oral hypoglycemic drugs target the three processes: insulin secretion, tissue insulin sensitivity, and absorption and digestion of carbohydrates.
Sulfonylureas, meglitinides and drugs affecting the incretin system stimulate insulin secretion
Sulfonylureas bind to a receptor in the plasma membrane of the pancreatic β-cells. The receptor contains the ATP-sensitive potassium channel. Binding of the drug closes the channel, depolarizes the membrane and opens the calcium channel. Increasing intracellular cytoplasmic calcium concentration stimulates the exocytosis of insulin. Hypoglycemia is a substantial side effect of sulfonylurea treatment.
Meglitinides target the K-ATP channel similarly to the sulfonylureas but bind to a different site.
Drugs affecting the incretin system: GLP-1 receptor agonists and DPP-4 inhibitors. GLP-1 receptor agonists such as exenatide or liraglutide increase insulin secretion. They act via the cyclic AMP–PKA pathway and potentiate insulin secretion induced by raised glucose. Endogenous GLP-1 can also be increased by using DPP-4 inhibitors such as sitagliptin, which prevents GLP-1 degradation and thus increases its effect.
Biguanides and thiazolidinediones sensitize the peripheral tissues to insulin
Metformin, a biguanide, is currently the most common oral treatment in T2D. It reduces hepatic gluconeogenesis, and decreases the endogenous glucose production. It suppresses the effects of glucagon and increases peripheral insulin sensitivity. It also inhibits glycogenolysis by inhibiting the activity of the Glc-6-Pase. Metformin increases insulin-dependent glucose uptake in the skeletal muscle, and reduces fatty acid oxidation.
Thiazolidinediones, such as pioglitazone, act at the transcriptional level. They improve peripheral glucose utilization and insulin sensitivity. They are ligands of the PPAR-γ transcription factor in the adipose tissue and, to a lesser extent, in muscle. PPAR-γ activation increases transcription of a range of genes responsible for glucose and lipid metabolism such as the lipoprotein lipase, acyl-CoA synthase and the GLUT-4 transporter. Thiazolidinediones also activate the IRS-1/phosphoinositol kinase signaling pathway. They promote expansion of subcutaneous adipose tissue, reduce lipolysis and reduce the adipose tissue inflammation. However, they cause weight increase.
The glitazar group of drugs is currently being tested; these agents stimulate both PPAR-α and PPAR-γ and therefore, apart from thiazolidinedione-like action, they may influence lipid metabolism by raising the HDL and decreasing the plasma triglyceride concentration (Chapter 18).
Acarbose and SGLT2 inhibitors decrease intestinal glucose digestion
Acarbose is an inhibitor of intestinal α-glucosidase, which digests complex sugars. It delays intestinal absorption of glucose.
Amylin, an inhibitor of the SGLT2 glucose transporter, slows down gastric emptying, promotes satiety and inhibits glucagon secretion. It is used as an adjunct to insulin treatment.
Drug combinations used in type 2 diabetes
If glycemia cannot be controlled by diet and exercise, metformin is recommended in patients with T2D as a first-line therapy. Insulin is considered in those with severe symptoms and poor glycemic control. A second oral agent (e.g. thiazolidinedione or sulfonylurea), a GLP-1 receptor agonist, or insulin, may later be added to metformin treatment.
Summary
Glucose homeostasis involves the liver, adipose tissue, skeletal muscle and the pancreas.
The organism alternates between the fed and fasting state. Metabolite concentrations in blood change during the feed–fast cycle, and are influenced by stress and disease. Therefore, interpretation of metabolite levels needs to be related to meal times and to the overall clinical condition of the patient.
Measurement of plasma glucose concentration is part of a routine assessment of every patient admitted to hospital. The measurements of plasma glucose and glycated hemoglobin (HbA1c) are used for diagnosis and monitoring of glycemic control. In diabetic patients, measurements of plasma and urine glucose, urinary ketones, HbA1c, and tests of renal function, including microalbuminuria, are performed.
Type 1 diabetes mellitus is an autoimmune disease caused by destruction of pancreatic β-cells.
Type 2 diabetes results from the inability of functionally impaired β-cells to compensate for peripheral insulin resistance. Type 2 diabetes is strongly associated with obesity.
The short-term complications of diabetes include hypoglycemia and ketoacidosis. The long-term complications include diabetic retinopathy, nephropathy and neuropathy. Cardiovascular disease is linked to diabetic macroangiopathy. Cardiovascular disease is currently the main cause of death in diabetes.
Ahlqvist, E, Ahluvalia, TS, Groop, L. Genetics of type 2 diabetes. Clin Chem. 2011; 57:241–254.
American Diabetes Association. Standards of medical care in diabetes – 2012. Diabetes Care. 2012; 35(Suppl 1):S11–S63.
Bliss, M. The discovery of insulin, Edinburgh. Paul Harris Publishing; 1983.
Daneman, D. Type 1 diabetes. Lancet. 2006; 367:847–858.
Diabetes Control and Complications Trial (DCCT) Research Group. The effect of intensive treatment of diabetes on the development and progression of long-term complications in insulin-dependent diabetes mellitus. N Engl J Med. 1993; 329:977–986.
Diabetes Prevention Program Research Group. Reduction in the incidence of type 2 diabetes with lifestyle intervention or metformin. N Engl J Med. 2002; 24:387–388.
Dominiczak, MH. Obesity, glucose intolerance and diabetes and their links to cardiovascular disease. Implications for laboratory medicine. CCLM. 2003; 41:1266–1278.
Drucker, DJ, Nauck, MA. The incretin system: glucagon-like peptide-1 receptor agonists and dipeptidyl peptidase-4 inhibitors in type 2 diabetes. Lancet. 2006; 368:1696–1705.
Expert Committee on the Diagnosis and Classification of Diabetes Mellitus. Report of the Expert Committee on the Diagnosis and Classification of Diabetes Mellitus. Diabetes Care. 2003; 26:S4–S20.
Jeffcoate, SL. Diabetes control and complications: the role of glycated hemoglobin, 25 years on. Diabetic Med. 2004; 21:6576–6665.
Nolan, C, Damm, P, Prentki, M. Type 2 diabetes across generations: from pathophysiology to prevention and management. Lancet. 2011; 378:169–171.
Steck, AK, Rewers, MJ. Genetics of type 1 diabetes. Clin Chem. 2011; 57:176–185.
Stern, MP. Diabetes and cardiovascular disease. The ‘common soil’ hypothesis. Diabetes. 1995; 44:369–374.
Stumvoll, M, Goldstein, BJ, von Haeften, TW. Type 2 diabetes: principles of pathogenesis and therapy. Lancet. 2005; 365:1333–1346.
Tuchman, A. Diabetes and the public's health. Lancet. 2009; 374:1140–1141.
UK Prospective Diabetes Study (UKPDS) Group. Intensive blood-glucose control with sulphonylureas or insulin compared with conventional treatment and risk of complications in patients with type 2 diabetes (UKPDS 33). Lancet. 1998; 352:837–853.
Wong, TY, Liew, G, Tapp, RJ, et al. Relation between fasting glucose and retinopathy for diagnosis of diabetes: three population-based cross-sectional studies. Lancet. 2008; 371:736–743.
Zimmet, P, Alberti, KGMM, Shaw, J. Global and societal implications of the diabetes epidemic. Nature. 2001; 414:782–787.
American Diabetes Association. Type 1 diabetes. www.diabetes.org/diabetes-basics/type-1.
American Diabetes Association. Type 2 diabetes. www.diabetes.org/diabetes-basics/type-2/?loc=DropDownDB-type2.
American Diabetes Association. Standards of Medical Care in Diabetes. http://care.diabetesjournals.org/content/36/Supplement_1/S11.full, 2013.
Diabetes.co.u. www.diabetes.co.uk/index.html
Diabetes, UK. Type 1 diabetes. http://www.diabetes.org.uk/Guide-to-diabetes/Type-1-diabetes/IDF Diabetes Atla. www.idf.org/diabetesatlas/5e/Update2012.
Diabetes UK blog. http://blogs.diabetes.org.uk
NHS choices. Diabetes type 2 – symptoms. www.nhs.uk/Conditions/Diabetes-type2/Pages/Symptoms.aspx.
WHO Consultation. Abbreviated Report. Use of glycated haemoglobin (HbA1c) in the diagnosis of diabetes mellitus. www.who.int/diabetes/publications/report-hba1c_2011.pdf.