Pharmacokinetics
Pharmacokinetics of biological drugs
The type of response experienced by an individual to a particular drug depends on the inherent pharmacological properties of the drug at its site of action. However, the speed of onset, the intensity and the duration of the response usually depend on parameters such as:
 the rate and extent of uptake of the drug from its site of administration,
the rate and extent of distribution of the drug to different tissues, including the site of action,
Overall, the response of an individual depends upon a combination of the effects of the drug at its site of action in the body (pharmacodynamics) and the way the body influences drug delivery to its site of action (pharmacokinetics) (Fig. 2.1). Both pharmacodynamic and pharmacokinetic aspects are subject to a number of variables, which affect the dose–response relationship. Pharmacodynamic aspects are determined by processes such as drug–receptor interaction and are specific to the class of the drug (Ch. 1). Pharmacokinetic aspects are determined by general processes, such as transfer across membranes, metabolism and renal elimination, which apply irrespective of the pharmacodynamic properties.
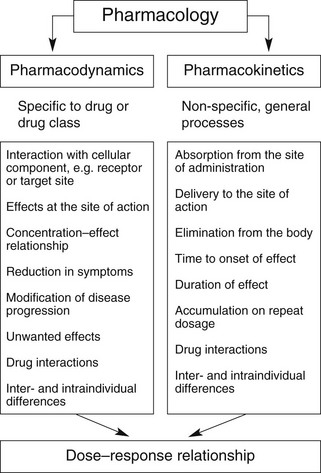
Pharmacokinetics may be divided into four basic processes, sometimes referred to collectively as ‘ADME’:
absorption: the transfer of the drug from its site of administration to the general circulation,
distribution: the transfer of the drug from the general circulation into the different organs of the body,
metabolism: the extent to which the drug molecule is chemically modified in the body,
excretion: the removal of the parent drug and any metabolites from the body; metabolism and excretion together account for drug elimination.
Each of these processes can be described qualitatively in biological terms, involving biochemical and physiological processes, and also in mathematical terms, which determine many of the quantitative aspects of drug prescribing.
The biological basis of pharmacokinetics
Most drug structures bear little resemblance to normal dietary constituents such as carbohydrates, fats and proteins, and they are handled in the body by different processes. Drugs that bind to the same receptor as an endogenous ligand rarely resemble the natural ligand sufficiently closely in chemical structure to share the same carrier processes or metabolising enzymes. Consequently, the movement of drugs in the tissues is mostly by simple passive diffusion rather than by specific transporters, whereas metabolism is usually by enzymes of low substrate specificity that can handle a wide variety of drug substrates and other xenobiotics (foreign substances).
General considerations
With the exception of intravenous or intra-arterial injections, a drug must cross at least one membrane in its movement from the site of administration into the general circulation. Drugs acting at intracellular sites must also cross the cell membrane to exert an effect. The main mechanisms by which drugs can cross membranes (Fig. 2.2) are:
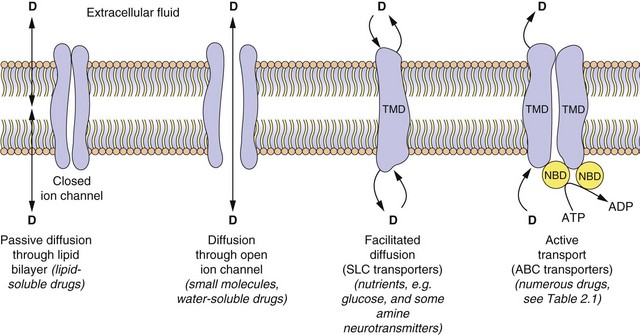
Fig. 2.2 The passage of drugs across membranes.
Molecules can cross the membrane by simple passive diffusion through the lipid bilayer or via a channel, or by facilitated diffusion, or by ATP-dependent active transport. D, drug; TMD, transmembrane domain; NBD, nucleotide-binding domain; ABC, ATP-binding cassette superfamily of transport proteins; SLC, solute carrier superfamily of transporters (see Table 2.1).
Passive diffusion: All drugs can move passively down a concentration gradient. To cross the phospholipid bilayer directly (Fig. 2.2) a drug must have a degree of lipid solubility, such as ethanol or steroids. Eventually a state of equilibrium will be reached in which equal concentrations of the diffusible form of the drug are present in solution on each side of the membrane. The rate of diffusion is directly proportional to the concentration gradient across the membrane, and to the area and permeability of the membrane, but inversely proportional to its thickness (Fick's Law). In the laboratory, transient water-filled pores can be created in the phospholipid bilayer by applying a strong external electric field, and this process (electroporation) is used to introduce large or charged molecules, such as DNA, drugs and probes into live cells in suspension.
Passage through membrane pores or ion channels: Movement through channels occurs down a concentration gradient and is restricted to extremely small water-soluble molecules (<100 Da), such as ions. This is applicable to therapeutic ions such as lithium and also to radioactive iodine. Water itself crosses membranes rapidly via a ubiquitous family of aquaporins.
Carrier-mediated processes: Two carrier-mediated processes are of widespread importance in the transport of drugs, particularly those with low lipid solubility, across membranes.
Active transport utilises energy (ATP) and transports drugs into or out of cells against their concentration gradient. It is performed by a family of non-specific carriers termed the ATP-binding cassette (ABC) superfamily of membrane transporters (Fig. 2.2, Table 2.1).
Table 2.1
Examples of carrier molecules involved in drug transport
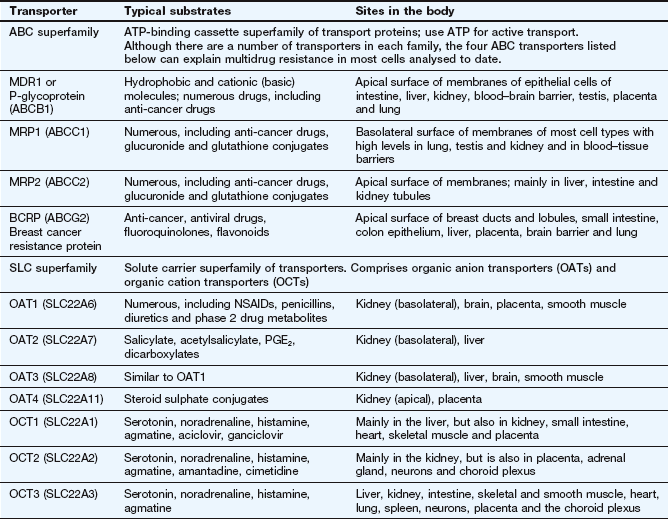
ABC, ATP-binding cassette; NSAIDs, non-steroidal anti-inflammatory drugs; PGE2, prostaglandin E2; SLC, solute carrier.
Facilitated transport of a molecule by a carrier aids its passive movement down a concentration gradient, or uses the electrochemical gradient of a co-transported solute to transport the molecule against its own gradient; the latter is energy-dependent but does not utilise ATP. The major examples are the solute carrier (SLC) superfamily of transporters (Fig. 2.2, Table 2.1).
In humans, the ABC active-transporter superfamily contains 49 members organised into seven subfamilies (A–G) based on their relative sequence homology. Interest in this area has expanded rapidly since the discovery of P-glycoprotein (P-gp), also known as multidrug resistance 1 (MDR1) or ABCB1 transporter. P-gp transports a wide range of drug substrates, including anti-cancer drugs, steroids and immunosuppressive agents, from the cytoplasm to the extracellular side of the cell membrane, and therefore acts as an efflux transporter. Verapamil increases the concentrations of anti-cancer drugs at their intracellular sites of action by inhibiting P-gp (Ch. 52). ABCB transporter proteins contain two hydrophobic transmembrane domains, which consist of different numbers of membrane-spanning α-helices (12 in P-gp), and two hydrophilic nucleotide (ATP)-binding domains, which bind and hydrolyse intracellular ATP. The transporter is on the apical surface and acts as an efflux pump that transports substrates from the cell into the interstitial fluid, plasma, bile, urine or gut lumen. Examples of other ABC transporters are given in Table 2.1.
The SLC superfamily comprises over 400 types of organic anion transporters (OATs) and organic cation transporters (OCTs) (Table 2.1). OAT1 to OAT4 are present in various tissues; OAT1 is the classic organic anion transporter in the kidney, which secretes urate and penicillins and is blocked by probenecid (Ch. 33). Organic cation transporters (OCT1, OCT2 and OCT3) effect facilitated diffusion and can transport cations in both directions across the membrane. Substrates common to all three OCT transporters are serotonin (5-hydroxytryptamine, 5-HT), noradrenaline, histamine and agmatine; although some drugs are substrates for the transporters (Table 2.1), many basic drugs act as inhibitors of the transporters.
Pinocytosis: This can be regarded as a form of carrier-mediated entry into the cell cytoplasm. Pinocytosis is normally concerned with the uptake of endogenous macromolecules and may be involved in the uptake of recombinant therapeutic proteins; drugs can also be incorporated into a lipid vesicle or liposome for pinocytotic uptake (e.g. amphotericin and doxorubicin; Ch. 51).
Drug ionisation and membrane diffusion
Ionisation is a fundamental property of most drugs that are either weak acids, such as aspirin, or weak bases, such as propranolol. The presence of an ionisable group(s) is essential for the mechanism of action of most drugs, because ionic forces represent a key part of ligand–receptor interactions (Ch. 1). The extent of ionisation may also influence the extent of absorption of a drug, its distribution into organs such as the brain or adipose tissue and the mechanism and route of its elimination from the body.
Drugs with ionisable groups exist in equilibrium between charged (ionised) and uncharged (un-ionised) forms (Fig. 2.3). The extent of ionisation of a drug depends on the strength of the ionisable group and the pH of the solution. The extent of ionisation is given by the acid dissociation constant, Ka.
The term conjugate acid refers to a form of the drug able to release a proton, such as:
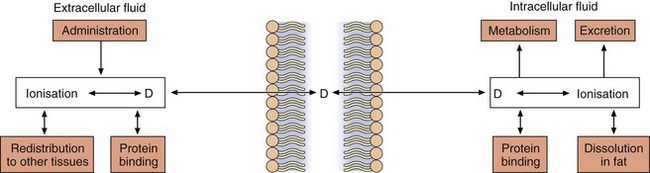
Fig. 2.3 The effect of pH on drug ionisation.
Acidic conditions (low pH, high H+ concentrations) push the equilibrium of acidic drugs towards their un-ionised (protonated) form, and basic drugs towards their ionised form. Basic conditions (high pH) have the opposite effect.
The conjugate base is the corresponding equilibrium form of the drug that has lost a proton, such as:
The value of Ka is normally much less than 1, so it is easier to compare compounds using the negative logarithm of Ka, which is called pKa. For example, a Ka of 10−5 becomes pKa 5, and a Ka of 10−10 becomes pKa 10. Based on the equation above, a strong acid (such as an  SO3H functional group) that readily donates its H+ ion will have a relatively high Ka value (e.g. 10−1 or 10−2) and hence a low pKa (i.e. 1 or 2), whereas weakly acidic groups, which donate their H+ ion less readily, have a pKa of 4–5. Conversely, for basic functional groups, the stronger the base, the greater will be its ability to retain the H+, resulting in low Ka and high pKa values. Thus, strongly basic groups have a pKa of 10–11, while weakly basic groups have a pKa of 7–8.
Drugs are 50% ionised when the pH of the solution equals the pKa of the drug. Acidic drugs (low pKa values) are least ionised in acidic solution (low pH) and most ionised in alkaline solutions (high pH). Basic drugs (high pKa values) are least ionised in alkaline solutions (high pH), and most ionised in acid solutions (low pH). In either case, the ionised form of the molecule can generally be regarded as the water-soluble form and the un-ionised form as the lipid-soluble form. The ease with which a drug can diffuse across a lipid bilayer is determined by the lipid solubility of its un-ionised form (Fig. 2.4).
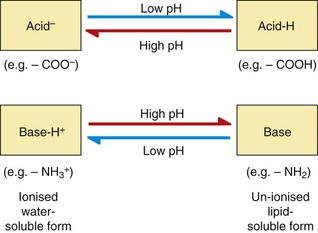
Fig. 2.4 Passive diffusion and the factors that affect drug concentrations in equilibrium between un-ionised and ionised forms.
In this case, the pH is assumed to be the same on each side of the membrane; see Fig. 2.5 for drug partitioning when there is a pH gradient across the membrane.
The pH of body fluids is controlled by the buffering capacity of the ionic groups present in endogenous molecules such as phosphate ions and proteins. When the fluids on each side of a membrane have the same pH value there will be equal concentrations of both the diffusible (un-ionised) form and the non-diffusible (ionised) form of the drug on each side of the membrane at equilibrium (Fig. 2.4).
When the fluids on each side of a membrane are at different pH values, the concentrations of the un-ionised form on each side of the membrane at equilibrium will remain equal as it can diffuse reversibly across the membrane, but the concentrations of the ionised drug will be determined by the pH of the solution. This results in pH-dependent differences in total drug concentration on each side of a membrane (pH trapping or partitioning), with the total drug concentration being higher on the side of the membrane on which it is most ionised. This is exemplified by the pH difference between urine (pH 5–7) and plasma (pH 7.4), which can influence renal elimination of drugs (Fig. 2.5). The relatively low pH of the urine forces an acidic drug to become predominantly un-ionised, allowing its reabsorption into the plasma, while the higher pH in plasma (7.4) converts the drug to the ionised form, preventing it diffusing back and trapping (partitioning) it in the plasma. The opposite situation prevails with basic drugs, which are enabled to diffuse from the plasma into urine, where they become trapped.
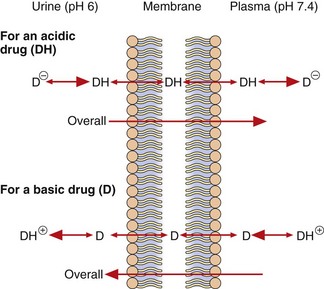
Fig. 2.5 Partitioning of acidic and basic drugs across a pH gradient.
Only the un-ionised forms (DH and D) are able to diffuse across the membrane. In urine (pH 6), the un-ionised acidic drug (DH) can be readily reabsorbed into the plasma, where its ionised form (D−) becomes concentrated, while the ionised basic drug (D+) is trapped within the urine. Alkalinising the urine would reduce reabsorption of the acid drug and enhance that of the basic drug.
After drug overdose, when the aim is to enhance drug elimination, alkalinisation of the urine can be used to reduce reabsorption of acidic drugs, leading to their faster elimination in the urine. Acidification of the urine can enhance ionisation and renal elimination of basic drugs, such as dexamfetamine.
The pH difference between gastric contents (pH 1–2) and plasma (pH 7.4) affects the absorption of many oral drugs. The acidity of stomach contents means that an acidic drug is present largely in its un-ionised (protonated) form, allowing it to pass into plasma where its ionised form becomes partitioned. In contrast, basic drugs are highly ionised in the stomach and absorption is negligible until the stomach empties and the drug can be absorbed from the more alkaline lumen of the duodenum (pH ~8).
Drugs that are fixed in their ionised form at all pH values, such as the quaternary amine compound suxamethonium (Ch. 27), cross cell membranes extremely slowly or not at all; they are given by injection (because of lack of absorption from the gastrointestinal tract) and have limited effects on the brain (because of lack of entry).
Absorption
Absorption is the process of transfer of the drug from the site of administration into the general or systemic circulation.
Absorption from the gut
The easiest and most convenient route of administration of medicines is orally by tablets, capsules or syrups. The large surface area of the small intestine combined with its high blood flow can give rapid and complete absorption of orally administered drugs. However, this route presents a number of obstacles for a drug before it reaches the systemic circulation.
Drug structure
Drug structure is a major determinant of absorption. Drugs need to be lipid-soluble to be absorbed from the gut. Highly polar acids and bases tend to be absorbed only slowly and incompletely, with much of the unabsorbed dose being voided in the faeces. High polarity may, however, be useful for delivery of the drug to a site of action in the lower bowel (see Ch. 34). The structures of some drugs can make them unstable either at the low pH of the stomach (e.g. benzylpenicillin) or in the presence of digestive enzymes (e.g. insulin). Such compounds have to be given by injection, but administration by other routes may be possible (e.g. inhalation for insulin).
Drugs that are weak acids or bases undergo pH partitioning between the gut lumen and mucosal cells. Acidic drugs will be least ionised in the stomach lumen and most absorption would be expected at this site, but absorption in the stomach is limited by its relatively low surface area (compared to the small intestine) and the presence of a zone of neutral pH on the immediate surface of the gastric mucosal cells (the mucosal bicarbonate layer; see Ch. 33). In consequence, the bulk of the absorption of drugs, even weak acids such as aspirin, occurs in the small intestine.
Drug formulation
A drug cannot be absorbed when it is taken in a tablet or capsule until the vehicle disintegrates and the drug is dissolved in the gastrointestinal contents to form a molecular solution. Most tablets disintegrate and dissolve quickly and completely and the whole dose rapidly becomes available for absorption. However, some formulations are designed to disintegrate slowly so that the rate of release and dissolution of drug from the formulation determines the rate of absorption. In modified-release (i.e. slow-release) formulations the drug is either incorporated into a complex matrix from which it diffuses slowly, or in a crystallised form that dissolves slowly. Dissolution of a tablet in the stomach can also be prevented by coating it in an acid-insoluble layer, producing enteric-coated formulations. This is useful for drugs such as omeprazole (Ch. 33), which is unstable in an acid environment, and allows delivery of intact drug to the duodenum.
Gastric emptying
The rate of gastric emptying determines how soon a drug taken orally is delivered to the small intestine, the major site of absorption. Delay between oral drug ingestion and the drug being detected in the circulation is usually caused by delayed gastric emptying. Drugs that slow gastric emptying, for example antimuscarinics, can delay the absorption of other drugs taken at the same time.
Food has complex effects on drug absorption; it slows gastric emptying and delays drug absorption, and it can also bind drugs and reduce the total amount of drug absorbed.
First-pass metabolism
Metabolism of drugs can occur before and during their absorption, and this can limit the amount of parent compound that reaches the general circulation. Drugs taken orally have to pass four major metabolic barriers before they reach the general circulation. If there is extensive metabolism of a drug at one or more of the sites below, only a fraction of the original oral dose reaches the general circulation as the parent compound. This process is known as first-pass metabolism because it occurs at the first passage through the organ.
Intestinal lumen: The intestinal lumen contains digestive enzymes secreted by the mucosal cells and pancreas that are able to split amide, ester and glycosidic bonds. Intestinal proteases prevent the oral administration of peptide drugs, such as insulin and other products of molecular biological approaches to drug development. In addition, the lower bowel contains large numbers of aerobic and anaerobic bacteria that are capable of performing a range of metabolic reactions on drugs, especially hydrolysis and reduction.
Intestinal wall: The walls of the upper intestine are rich in cellular enzymes such as monoamine oxidase (MAO), aromatic L-amino acid decarboxylase, cytochrome P450 isoenzymes (e.g. CYP3A4) and the enzymes responsible for phase 2 conjugation reactions described below. In addition, the luminal membrane of the intestinal cells (enterocytes) contains efflux transporters such as P-gp (see above), which may limit the absorption of a drug by transporting it back into the intestinal lumen. Drug molecules that enter the enterocyte may thus undergo three possible fates; that is, diffusion into the hepatic portal circulation, metabolism within the cell or transport back into the gut lumen (by P-gp). The substrate specificities of CYP3A4 and P-gp overlap and for common substrates their combined actions can prevent most of the oral dose of some drugs reaching the hepatic portal circulation.
Liver: Blood from the intestine is delivered by the splanchnic circulation directly to the liver, which is the major site of drug metabolism in the body. Hepatic first-pass metabolism can be avoided by administering the drug to a region of the gut from which the blood does not drain into the hepatic portal vein, for example the buccal cavity or rectum; a good example of this is the buccal administration of glyceryl trinitrate (Ch. 5).
Absorption from other routes
Percutaneous (transcutaneous) administration
The human epidermis (especially the stratum corneum) is an effective permeability barrier to water loss and to the transfer of water-soluble compounds. Although lipid-soluble drugs are able to cross this barrier, the rate and extent of entry are very limited. In consequence, this route is only effective for use with potent, non-irritant drugs, such as glyceryl trinitrate (Ch. 5) or fentanyl (Ch. 19), or to produce a local effect. The slow and continued absorption from dermal administration (e.g. via adhesive patches) can be used to produce low, but relatively constant, blood concentrations of some drugs; for example nicotine-replacement therapy (Ch. 54).
Intradermal and subcutaneous injection
Intradermal or subcutaneous injection avoids the barrier presented by the stratum corneum and entry into the general circulation is limited mainly by the rate of blood flow to the site of injection. However, these sites only allow the administration of small volumes of drug and tend to be used mostly for local effects, such as local anaesthesia, or to deliberately limit the rate of drug absorption, for example insulin (Ch. 40).
Intramuscular injection
The rate of absorption from an intramuscular injection depends on two variables: the local blood flow and the water solubility of the drug. An increase in either of these factors enhances the rate of removal from the injection site. Absorption of drugs from the injection site can be prolonged intentionally either by incorporation of the drug into a lipophilic vehicle, such as flupentixol decanoate (Ch. 21) or by formation of a sparingly soluble salt, such as benzathine benzylpenicillin (Ch. 51), creating a depot formulation from which the drug is released over days or weeks.
Intranasal administration
The nasal mucosa provides a good surface area for absorption, combined with low levels of proteases and drug-metabolising enzymes compared with the gastrointestinal tract. In consequence, intranasal administration is used for the administration of some drugs, such as triptan drugs for migraine (Ch. 26), and desmopressin (Ch. 43), as well as for drugs designed to produce local effects, such as nasal decongestants and topical corticosteroids (Ch. 39).
Inhalation
Although the lungs possess the characteristics of a good site for drug absorption (a large surface area and extensive blood flow), inhalation is rarely used to produce systemic effects. The principal reasons for this are the difficulty of delivering non-volatile drugs to the alveoli and the potential for local toxicity to alveolar membranes. Therefore, drug administration by inhalation is largely restricted to:
volatile compounds, such as general anaesthetics (Ch. 17),
locally acting drugs, such as bronchodilators and corticosteroids used in the treatment of airway disease such as asthma and chronic obstructive pulmonary disease (Ch. 12).
Drugs in the latter group are not volatile and have to be given as either aerosols containing droplets of dissolved drug or fine particles of the solid drug (dry powder) (see Ch. 12). Particles greater than 10 µm in diameter settle out in the upper airways, which are poor sites for absorption, and the drug then passes back up the airways via ciliary motion and is eventually swallowed. It was estimated that only 5–10% of an inhaled dose is absorbed from the airways, although the percentage may be higher with modern inhaler devices delivering particle sizes closer to the optimum for airways deposition (2–5 µm). Particles less than 1 µm in diameter are not deposited in the airways and are exhaled.
Distribution
Distribution is the process by which the drug is transferred reversibly from the general circulation into the tissues as the concentrations in blood increase, and from the tissues into blood when the blood concentrations decrease. For most drugs this occurs by passive diffusion of the un-ionised form across cell membranes (Fig. 2.2) until equilibrium is reached (Fig. 2.4). At equilibrium, any process that removes the drug from one side of the membrane results in movement of drug across the membrane to re-establish the equilibrium (Fig. 2.4).
After an intravenous injection there is a high initial plasma concentration and the drug may rapidly enter well-perfused tissues such as the brain, liver and lungs (Table 2.2). This may be so rapid that these tissues may be assumed to equilibrate instantaneously with plasma and represent part of the ‘central’ compartment (see below). However, the drug will continue to enter poorly perfused tissues, and this will lower the plasma concentration. The high concentrations in the rapidly perfused tissues then decrease in parallel with the decreasing plasma concentration, resulting in a transfer of drug back into the plasma (Fig. 2.6). This redistribution is important for terminating the action of some drugs given as a rapid intravenous injection or bolus. For example, intravenous thiopental produces rapid anaesthesia, but effects in the brain are short-lived because continued uptake into muscle lowers the concentrations in the blood and therefore in the brain (Fig. 2.6; see also Fig. 17.2).
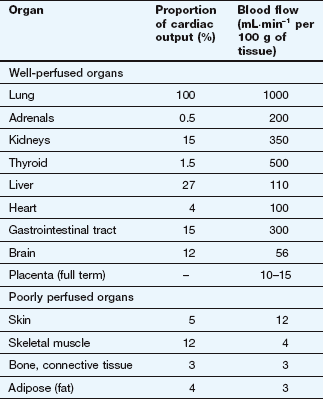
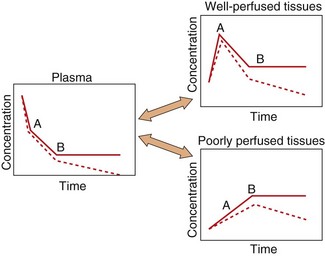
Fig. 2.6 A simplified scheme for the redistribution of drugs between tissues.
The initial decrease in plasma concentrations results from uptake into well-perfused tissues, which essentially reaches equilibrium at point A. Between points A and B, the drug continues to enter poorly perfused tissues, resulting in a decrease in the concentrations in both plasma and well-perfused tissues. At point B all tissues are in equilibrium. The additional presence of an elimination process would produce a decrease from point B (shown as a dashed line), which would be parallel in all tissues.
The processes of elimination (such as metabolism and excretion) are of major importance and are discussed in detail below. Elimination results in a net transfer of drug from other tissues via the circulation to the organ(s) of elimination (see dashed lines in Fig. 2.6).
Reversible protein binding
Many drugs show an affinity for sites on non-receptor proteins, resulting in reversible binding:

Such binding occurs with plasma proteins, most commonly albumin, which binds many acidic drugs, and α1-acid glycoprotein, which binds many basic or neutral drugs (Table 2.3). Drugs may also bind reversibly with intracellular proteins (Fig. 2.4). The drug–protein binding interaction resembles the drug–receptor interaction since it is rapid, reversible and saturable, and different ligands can compete for the same site. It does not result in a pharmacological effect but lowers the free concentration of drug available to act at receptors; the amounts of drug remaining available may be only a minute fraction of the total body load. Proteins such as albumin can therefore act as depots, rapidly releasing the bound drug when the free drug is distributed to other compartments or eliminated.
Table 2.3
Examples of drugs that undergo extensive binding to plasma protein
| Bound to albumin | Bound to α1-acid glycoprotein |
| Digitoxin | Chlorpromazine |
| Furosemide | Propranolol |
| Ibuprofen | Quinidine |
| Indometacin | Tricyclic antidepressants |
| Phenytoin | Lidocaine |
| Salicylates | |
| Sulphonamides | |
| Thiazides | |
| Tolbutamide | |
| Warfarin |
Competition for binding to proteins in plasma or inside cells can occur between different drugs (drug interaction; see Ch. 56), and also between drugs and endogenous ligands. A highly protein-bound drug such as aspirin can displace another drug such as warfarin from its binding sites on plasma proteins; the increase in unbound drug concentration can increase the biological activity of the displaced drug. An example of interaction with an endogenous ligand is the displacement of bilirubin from albumin-binding sites by sulphanilamide drugs, causing a potentially dangerous increase in the bilirubin concentration in plasma, leading to kernicterus.
Irreversible protein binding
Certain drugs, because of chemical reactivity of the parent compound or a metabolite, undergo covalent binding to plasma or tissue components such as proteins or nucleic acids. When the binding is irreversible, for example the interaction of some cytotoxic drugs with DNA, this can be considered as equivalent to elimination, because the parent drug cannot re-enter the circulation. In contrast, some covalent binding may be slowly reversible, such as the formation of disulphide bridges by captopril with its target ACE and with plasma proteins (Ch. 6); the covalently bound drug will not dissociate rapidly in response to a decrease in the concentration of unbound drug, and such binding represents a slowly equilibrating reservoir of drug.
Distribution to specific organs
Two systems require more detailed consideration of drug distribution: the brain, because of the difficulty of drug entry, and the fetus, because of the potential for drug toxicity.
Brain
Lipid-soluble drugs readily pass from the blood into the brain, and for such drugs the brain represents a typical well-perfused tissue (Table 2.2). In contrast, the entry of water-soluble drugs into the brain is much slower than into other well-perfused tissues, giving rise to the concept of a blood–brain barrier. The functional basis of the barrier to water-soluble drugs (Fig. 2.7) is reduced permeability of brain capillaries owing to:
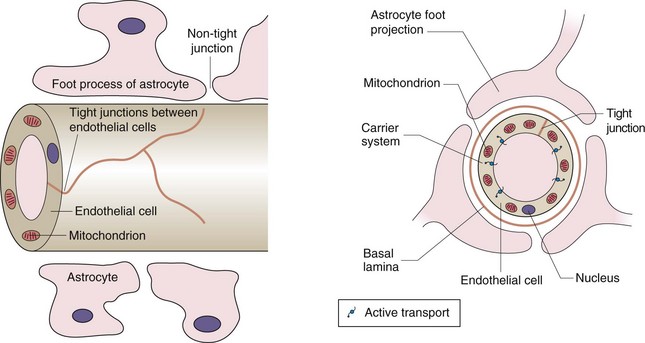
Fig. 2.7 The blood–brain barrier.
The barrier arises from the low number of membrane pores, the tight junctions between adjacent cells and the presence of efflux transporters that remove any drug that enters the endothelial cell. The presence of astrocytes is the stimulus for these changes in endothelial structure and function. Astrocytes are one of the several types of cells found in the CNS that make up the glia; they have numerous sheet-like processes and may provide nutrients to neurons.
tight junctions between adjacent endothelial cells (capillaries are composed of an endothelial layer a single cell thick, with no smooth muscle),
smaller size and lower number of pores in the endothelial cell membranes,
In addition, efflux transporters in the endothelial cells are an important part of the blood–brain barrier and return drug molecules back into the circulation, thereby preventing their entry into the brain and reducing effects in the central nervous system.
Water-soluble endogenous compounds needed for normal brain functioning, such as carbohydrates and amino acids, enter the brain via specific uptake transporters of the SLC superfamily (Table 2.1). Some drugs, for example levodopa, may enter the brain using these transport processes, and in such cases the rate of transport of the drug will be influenced by the concentrations of competitive endogenous substrates.
There is limited drug-metabolising ability in the brain and drugs leave by diffusion back into plasma, by active transport processes in the choroid plexus or by elimination in the cerebrospinal fluid. Organic acid transporters of the SLC superfamily (Table 2.1) are important in removing polar neurotransmitter metabolites from the brain.
Fetus
Lipid-soluble drugs can readily cross the placenta and enter the fetus. The placental blood flow is low compared to that in the liver, lung and spleen (Table 2.2); consequently, the fetal drug concentrations equilibrate slowly with the maternal circulation. Highly polar and very large molecules (such as heparin; see Ch. 11) do not readily cross the placenta. The fetal liver has only low levels of drug-metabolising enzymes so it is mainly the maternal elimination that clears the fetal circulation of drugs.
After delivery, the neonate may show effects from drugs given to the mother close to delivery (such as pethidine for pain control; see Ch. 19): such effects may be prolonged because the neonate now has to rely on his/her own immature elimination processes (Ch. 56).
Elimination
Elimination is the removal of drug from the body and may involve metabolism, in which the drug molecule is transformed into a different molecule, and/or excretion, in which the drug molecule is expelled in the body's liquid, solid or gaseous ‘waste’.
Metabolism
A degree of lipid solubility is a useful property of most drugs, since it allows the compound to cross lipid barriers and hence to be given via the oral route. Metabolism is necessary for the elimination of lipid-soluble drugs from the body, because it converts a lipid-soluble molecule (which would otherwise be reabsorbed from urine in the kidney tubule; see below) into a water-soluble species capable of rapid elimination in the urine (often via an anion transporter).
Metabolism of the drug produces a new chemical entity, which may show different pharmacological properties from the parent compound:
decrease in biological activity: the most common result of drug metabolism; arises from increased polarity which reduces receptor binding,
increase in activity: the metabolite is more potent than the parent drug; a prodrug is an inactive compound that is converted by metabolism into the active molecular species,
change in the nature of the activity: the metabolite shows qualitatively different pharmacological or toxicological properties.
The various steps of drug metabolism can be divided into two phases (Fig. 2.8). Although many compounds undergo both phases of metabolism, it is possible for a drug to undergo only a phase 1 or a phase 2 reaction, or for a proportion of the drug to be excreted unchanged. Phase 1 metabolism (oxidation, reduction and hydrolysis) is often described as preconjugation, because it produces a molecule that is a suitable substrate for a phase 2 or conjugation reaction. The enzymes involved in these reactions have low substrate specificities and can metabolise a wide range of drug substrates and other xenobiotics.
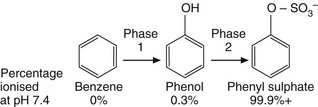
Fig. 2.8 The two phases of drug metabolism.
Phase 1 and phase 2 reactions are also called preconjugation and conjugation, respectively.
Phase 1
Cytochrome P450 is a superfamily of membrane-bound haemoprotein enzymes (Table 2.4). They are present in the smooth endoplasmic reticulum of cells (Fig. 2.9), particularly in the liver which is the major site of drug oxidation; the amounts in other tissues are low in comparison. The cytochrome P450 families CYP1–4 are involved in drug metabolism; the specific isoenzymes CYP2C9, CYP2D6 and CYP3A4 are involved in the phase 1 metabolism of approximately 10, 24 and 55% of drugs respectively.
Table 2.4
| Isoenzyme | Comments |
| CYP1A | Important for methylxanthines and paracetamol; induced by smoking |
| CYP2A | Limited number of substrates; significant inter-individual variability |
| CYP2B | Limited number of substrates |
| CYP2C | CYP2C9 is an important isoform; CYP2C19 shows genetic polymorphism |
| CYP2D | Metabolises numerous drugs; CYP2D6 shows genetic polymorphism |
| CYP2E | Metabolises alcohol |
| CYP3A | Main isoform in liver and intestine; metabolises 50–60% of current drugs |
| CYP4 | Metabolises fatty acids |
Human liver contains at least 20 isoenzymes of cytochrome P450. Families CYP1–4 are involved in drug metabolism.
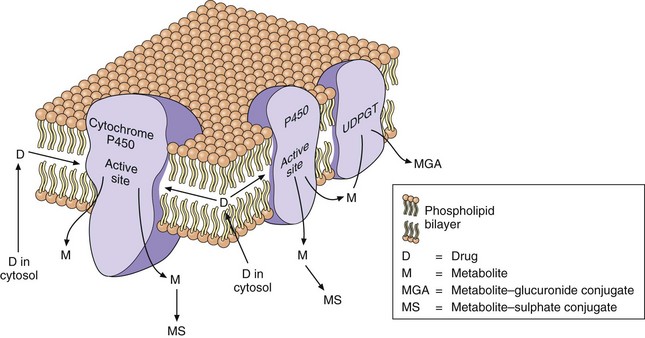
Fig. 2.9 Drug metabolism in the smooth endoplasmic reticulum.
The lipid-soluble drug (D) partitions into the lipid bilayer of the endoplasmic reticulum. The cytochrome P450 oxidises the drug to a metabolite (M) that is more water-soluble and diffuses out of the lipid layer. The metabolite may undergo a phase 2 (conjugation) reaction catalysed by UDP-glucuronyl transferase (UDPGT) in the endoplasmic reticulum to give a glucuronide conjugate (MGA) or with sulphate in the cytosol to give a sulphate conjugate (MS).
Oxidation reactions (Table 2.5) are the most important of the phase 1 reactions and can occur at carbon, nitrogen or sulphur atoms within the drug structure. In most cases, an oxygen atom is retained in the metabolite, although some reactions, such as dealkylation, result in loss of the oxygen atom in a small fragment of the original molecule. Oxidation reactions are catalysed by a diverse group of enzymes, of which the cytochrome P450 system is the most important. The cytochrome P450 isoenzyme binds both the drug and molecular oxygen (Fig. 2.10), and catalyses the transfer of one oxygen atom to the substrate while the other oxygen atom is reduced to water:

The reaction involves initial binding of the drug substrate to the ferric (Fe3+) form of cytochrome P450, followed by reduction (via a specific cytochrome P450 reductase) and then binding of molecular oxygen. Further reduction is followed by molecular rearrangement, with release of the reaction products (drug metabolite and water) and regeneration of ferric cytochrome P450.
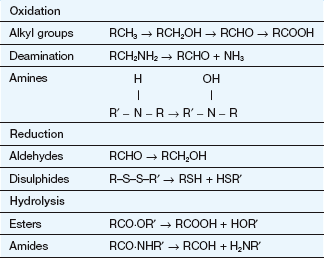
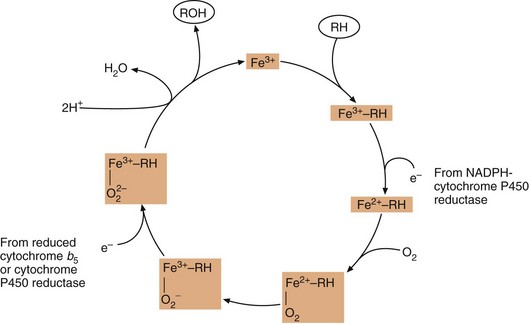
Fig. 2.10 The oxidation of substrate (RH) by cytochrome P450.
Fe3+, the active site of cytochrome P450 in its ferric state; RH, drug substrate; ROH, oxidised metabolite. Cytochrome b5 is present in the endoplasmic reticulum and can transfer an electron to cytochrome P450 as part of its redox reactions.
Oxidations at nitrogen and sulphur atoms are frequently performed by a second enzyme of the endoplasmic reticulum, the flavin-containing mono-oxygenase, which also requires molecular oxygen and NADPH. A number of other enzymes, such as alcohol dehydrogenase, aldehyde oxidase and MAO, may be involved in the oxidation of specific functional groups.
Reduction reactions (Table 2.5) are less than common than oxidation reactions, but occur at unsaturated carbon atoms and at nitrogen and sulphur centres by the actions of cytochrome P450 and cytochrome P450 reductase, and also by the intestinal microflora.
Hydrolysis and hydration reactions (Table 2.5) involve addition of water to the drug molecule. In hydrolysis, the molecule is then split by the addition of water. A number of ubiquitous enzymes are able to hydrolyse ester and amide bonds in drugs. The intestinal bacteria are also important for the hydrolysis of esters and amides and of drug conjugates eliminated in the bile (see below). In hydration reactions, the water molecule is retained in the drug metabolite. Hydration of an epoxide ring by epoxide hydrolase is an important reaction in the metabolism and toxicity of a number of aromatic drugs, for example carbamazepine (Ch. 23).
Phase 2
Phase 2 (conjugation) reactions involve the formation of a covalent bond between the drug, or its phase 1 metabolite, and an endogenous substrate. Table 2.6 shows the types of phase 2 reactions, the functional group necessary in the drug molecule and the activated species needed for the reaction. The products of conjugation reactions are usually highly water-soluble and lack biological activity.
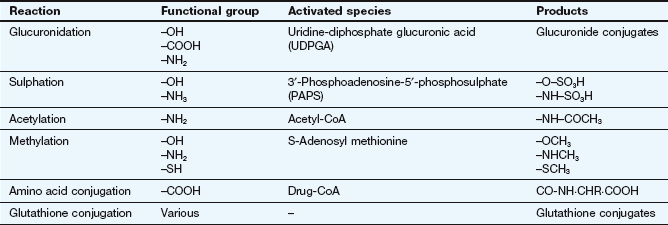
The activated endogenous substrate for glucuronide synthesis is uridine-diphosphate glucuronic acid (UDPGA). UDP-glucuronyl transferases in the endoplasmic reticulum close to the cytochrome P450 system (Fig. 2.9) transfer glucuronate to the drug. Glucuronide conjugation in the gut wall and liver is important in the first-pass metabolism of substrates such as simple phenols.
Sulphate conjugation is performed by a cytosolic enzyme, which utilises high-energy sulphate (3′-phosphoadenosine-5′-phosphosulphate or PAPS) as the rate-limiting endogenous substrate. Saturation of sulphate conjugation contributes to the hepatotoxic consequences of overdose with paracetamol (acetaminophen) (see Ch. 53).
Acetylation and methylation reactions often decrease polarity because they block an ionisable functional group (Table 2.6), but they mask active groups such as amino and catechol moieties. These reactions are primarily involved in inactivation of neurotransmitters such as noradrenaline and local hormones such as histamine.
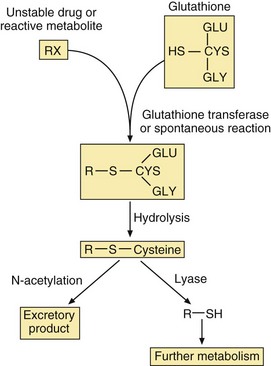
The conjugation of drug carboxylic acid groups with amino acids is unusual because the drug is converted to a high-energy form (a CoA derivative) prior to the formation of the conjugate bond by transferase enzymes. Conjugation with the tripeptide glutathione (GSH or L-α-glutamyl-L-cysteinylglycine) is catalysed by a family of transferases which covalently bind the drug to the thiol group in the cysteine (Fig. 2.11). The substrates are often reactive drugs or activated metabolites, which are inherently unstable (see Ch. 53), and the reaction can also occur non-enzymatically. The glutathione conjugate then undergoes further metabolic reactions. Glutathione conjugation is a detoxification process in which glutathione acts as a scavenging agent to protect the cell from toxic damage. Glutathione conjugates, and endogenous cysteine conjugates such as the cysteinyl-leukotriene (LT) C4, are transported out of cells by the MRP1 transporter (Table 2.1).
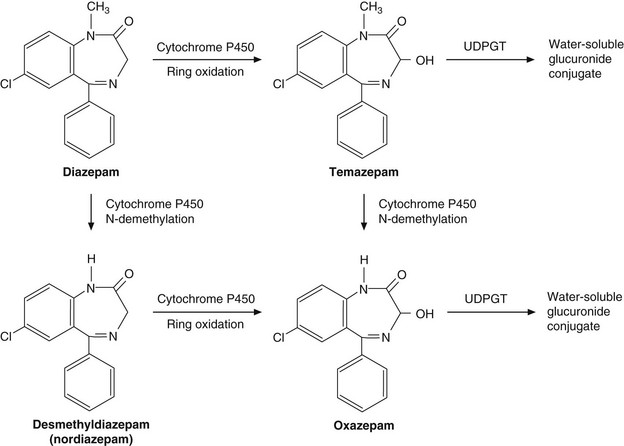
The complex array of biotransformation reactions typically involved in drug metabolism is illustrated by the anxiolytic drug diazepam (Ch. 20), which is metabolised to biologically active intermediates before undergoing conjugation with glucuronide (Fig. 2.12).
Factors affecting drug metabolism
The liver is the main site of drug metabolism; the large surface area of the sinusoids, combined with high levels of enzyme activity in hepatocytes, can result in very rapid drug uptake and metabolism as the blood flows through the liver (see Ch. 56 for normal sinusoid architecture and the effects of liver disease on hepatic drug uptake). Environmental influences including chemical contaminants and therapeutic drugs may induce or inhibit the activity of hepatic drug-metabolising enzymes, particularly cytochrome P450 (Table 2.7). This can affect both the bioavailability and the elimination of other drugs undergoing hepatic elimination (see below).
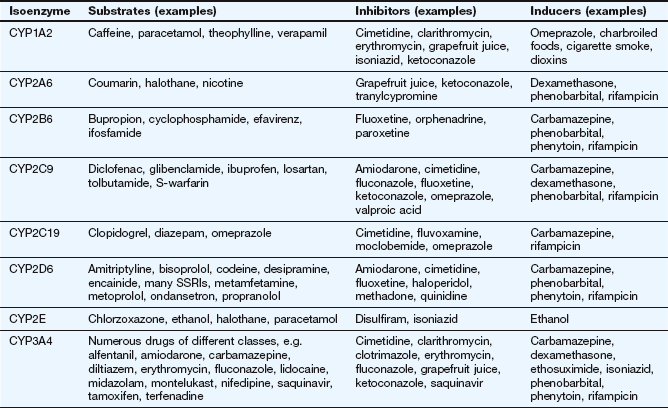
Inducing agents increase the cellular expression of cytochrome P450 enzymes. This occurs over a period of a few days, during which the inducer interacts with nuclear receptors to increase mRNA transcription of genes coding for cytochrome P450. The increased amounts of the enzyme last for a few days after the removal of the inducing agent, and are removed by normal protein turnover. Environmental contaminants such as organochlorine compounds (e.g. dioxins) and polycyclic aromatic hydrocarbons (e.g. benzo[a]pyrene in cigarette smoke) induce CYP1A. Therapeutic drugs can induce members of the CYP2 and CYP3 families. Chronic consumption of alcohol induces CYP2E.
In contrast, inhibition of cytochrome P450 by drugs occurs by direct reversible competition for the enzyme site, not a change in enzyme expression, so the time course follows closely the absorption and elimination of the inhibitor substance. Examples of inhibitors are the histamine H2 receptor antagonist cimetidine (Ch. 33) and components of grapefruit juice (Table 2.7).
The activity of drug-metabolising enzymes is also dependent on the delivery of their drug substrates by the circulation. Metabolism of many drugs is affected significantly by lower hepatic blood flow in the very young and in the elderly (Ch. 56). Genetic variation in drug-metabolising enzymes is discussed at the end of this chapter.
Excretion
Drugs and their metabolites may be eliminated from the circulation by various routes:
in fluids (urine, bile, sweat, tears, breast milk, etc.): important for low-molecular-weight polar compounds; urine is the major route; milk is important because of the potential for exposure of the breastfed infant,
in solids (faeces, hair, etc.): faecal elimination is most important for high-molecular-weight compounds excreted in bile; the sequestration of drugs into hair is not quantitatively important, but the distribution of a drug along the hair shaft can indicate the history of drug intake during the preceding weeks,
in gases (expired air): important only for volatile compounds.
Excretion via the urine
There are three processes involved in the handling of drugs and their metabolites in the kidney: glomerular filtration, reabsorption and tubular secretion. The total urinary excretion of a drug depends on the balance of these three processes:
Glomerular filtration: All molecules less than about 20 kDa undergo filtration under positive hydrostatic pressure through pores of 7–8 nm diameter in the glomerular membrane. The glomerular filtrate contains about 20% of the plasma volume delivered to the glomerulus, and hence about 20% of all water-soluble, low-molecular-weight compounds free in the plasma enter the filtrate. Plasma proteins and protein-bound drugs are not filtered, so the efficiency of glomerular filtration for a drug is influenced by the extent of plasma protein binding.
Reabsorption: The glomerular filtrate contains numerous constituents that the body cannot afford to lose. There are specific tubular uptake processes for carbohydrates, amino acids, vitamins, etc., and most of the water is also reabsorbed (see Ch. 14). A few drugs pass from the tubule back into the plasma as they are substrates for these specific uptake processes. The urine is concentrated on its passage down the renal tubule; as the tubule-to-plasma concentration gradient increases, only the most polar molecules remain in the urine. Because of extensive reabsorption, lipid-soluble drugs are not eliminated via the urine, but are returned to the circulation until they are metabolised to water-soluble products, which are efficiently removed from the body. The pH of urine is usually less than that of plasma; consequently, pH partitioning between urine (pH 5–6) and plasma (pH 7.4) may increase or decrease the tendency of the compound to be reabsorbed (Fig. 2.5).
Tubular secretion: The renal tubule has secretory transporters (Table 2.1) on both the basolateral and apical membranes for compounds that are acidic (organic anion transporters, OATs) or basic (organic cation transporters, OCTs). Drugs and their metabolites, especially the glucuronic acid and sulphate conjugates, may undergo an active carrier-mediated elimination, primarily by OATs but also by multidrug-resistance-associated proteins (MRPs). Because tubular secretion rapidly lowers the plasma concentration of unbound drug there will be a rapid dissociation of any drugs bound to proteins in the plasma. As a result, even highly protein-bound drugs may be cleared almost completely from the blood in a single passage through the kidney.
Excretion via the faeces
Uptake into hepatocytes and subsequent elimination in bile is the principal route of elimination of larger molecules (molecular weight >500 Da). Conjugation with glucuronic acid increases the molecular weight of the substrate by almost 200 Da, so bile is an important route for eliminating glucuronide conjugates. Once the drug or its conjugate has entered the intestinal lumen via the bile (Fig. 2.13) it passes down the gut and may eventually be eliminated in the faeces. However, some drugs may be reabsorbed from the lumen of the gut and re-enter the hepatic portal vein. As a result, the drug is recycled between the gut lumen, hepatic portal vein, liver, bile and back to the gut lumen; this is described as enterohepatic circulation. Some of the reabsorbed drug may escape hepatic extraction and proceed into the hepatic vein, maintaining the drug concentrations in the general circulation.
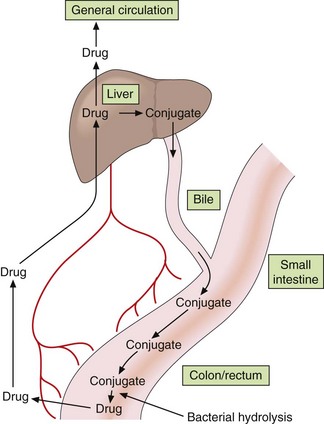
Fig. 2.13 Enterohepatic circulation of drugs.
Drug molecules may circulate repeatedly between the bile, gut, portal circulation, liver and general circulation, particularly if the drug conjugate is hydrolysed by the gut flora.
Highly polar glucuronide conjugates of drugs or their oxidised metabolites that are excreted into the bile undergo little reabsorption in the upper intestine. However, the bacterial flora of the lower intestine may hydrolyse the conjugate, so the original, lipid-soluble drug or its metabolite may be reabsorbed and undergo enterohepatic circulation (Fig. 2.13).
The mathematical basis of pharmacokinetics
The use of mathematics to describe the fate of a drug in the body can be complex and daunting for undergraduates. Nevertheless, a basic knowledge is essential for understanding many aspects of drug handling and the rational prescribing of drugs:
why oral and intravenous treatments may require different doses,
the interval between doses during chronic therapy,
the dosage adjustment that may be necessary in hepatic and renal disease,
the calculation of dosages for the very young and the elderly.
General considerations
The processes of drug absorption, distribution, metabolism and excretion are described in mathematical terms as it is important to quantify the rate and extent to which the drug undergoes each process.
For nearly all physiological and metabolic processes the rate of reaction is not uniform but proportional to the amount of substrate (drug) available: this is described as a first-order reaction. Diffusion down a concentration gradient, glomerular filtration and enzymatic hydrolysis are examples of first-order reactions. At higher concentrations, more drug diffuses or is filtered or hydrolysed than at lower concentrations. Protein-mediated reactions, such as metabolism and active transport, are also first-order, because if the concentration of the substrate is doubled then the rate of formation of product is also doubled. However, as the substrate concentration increases the enzyme or transporter can become saturated with substrate and the rate of reaction cannot respond to a further increase in concentration. The process then occurs at a fixed maximum rate independent of substrate concentration, and the reaction is described as a zero-order reaction; examples are the metabolism of ethanol (Ch. 54) and phenytoin (Ch. 23). When the substrate concentration has decreased sufficiently for protein sites to become available again, then the reaction will revert to first-order.
Zero-order reactions
If a drug is being processed (absorbed, distributed or eliminated) according to zero-order kinetics then the change in concentration with time (dC/dt) is a fixed amount per time, independent of concentration:

The units of k (the reaction rate constant) will be an amount per unit time (e.g. mg⋅min−1). A graph of concentration against time will produce a straight line with a slope of −k (Fig. 2.14A).
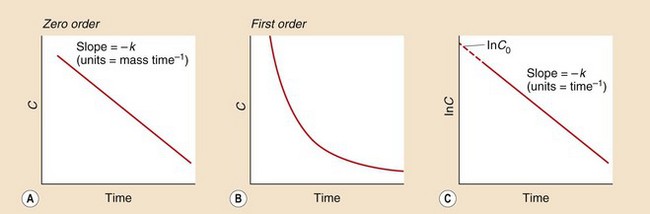
Fig. 2.14 Zero- and first-order kinetics.
(A) The zero-order reaction is a uniform change in concentration C over time. (B) The first-order reaction is an exponential curve in which concentrations fall fastest when they are highest. (C) Plotting the natural logarithm of the concentration (In C) in a first-order reaction against time generates a straight line with slope −k (where k is the rate constant) and the intercept gives the concentration at time zero, C0.
First-order reactions
In first-order reactions the change in concentration at any time (dC/dt) is proportional to the concentration present at that time:

The rate of change will be high at high drug concentrations but low at low concentrations (Fig. 2.14B), and a graph of concentration against time will produce an exponential decrease. Such a curve can be described by an exponential equation:

where C is the concentration at time t and C0 is the initial concentration (when time = 0). This equation may be written more simply by taking natural logarithms:
and a graph of lnC against time will produce a straight line with a slope of −k and an intercept of lnC0 (Fig. 2.14C).
The units of the rate constant k (time−1, e.g. h−1) may be regarded as the proportional change per unit of time but are difficult to use practically, so the rate of a first-order reaction is usually described in terms of its half-life (t1/2), which is the time taken for a concentration to decrease by one-half. In the next half-life, the drug concentration falls again by one-half, to a quarter of the original concentration, and then to one-eighth in the next half-life, and so on. The half-life is therefore independent of concentration and is a characteristic for a particular first-order process and a particular drug. The intravenous drug shown in Figure 2.15 has a t1/2 of 1 h.
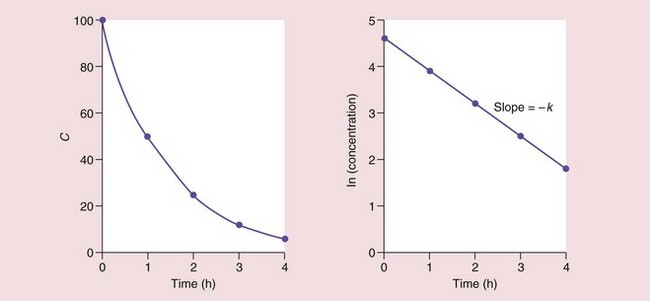
Fig. 2.15 The elimination half-life of a drug in plasma.
Here the concentration C decreases by 50% every hour, i.e. the half-life is 1 h.
The relationship between the half-life and the rate constant is derived by substituting C0 = 2 and C = 1 into the above equation, when the time interval t will be one half-life (t1/2), giving:
(Note: 0.693 = ln2)
A half-life can be calculated for any first-order process (e.g. for absorption, distribution or elimination). In practice, the ‘half-life’ normally reported for a drug is the half-life for the elimination rate from plasma (the slowest, terminal phase of the plasma concentration–time curve; see below).
Absorption
The mathematics of absorption apply to all non-intravenous routes (e.g. oral, inhalation, percutaneous, etc) and are illustrated by absorption from the gut lumen.
Rate of absorption
The rate of absorption after oral administration is determined by the rate at which the drug is able to pass from the gut lumen into the systemic circulation. Following oral doses of some drugs, particularly lipid-soluble drugs with very rapid absorption, it may be possible to see three distinct phases in the plasma concentration–time curve, which reflect distinct phases of absorption, distribution and elimination (Fig. 2.16A). However, for most drugs slow absorption masks the distribution phase (Fig. 2.16B). A number of factors can influence this pattern.
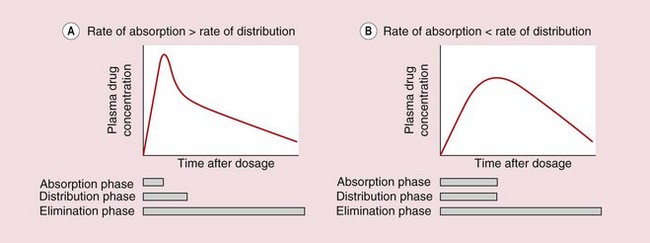
Fig. 2.16 Plasma concentration–time profiles after oral administration of drugs with different rates of absorption.
The processes of distribution and elimination start as soon as some of the drug has entered the general circulation. (A) A clear distribution phase is seen if the rate of absorption is so rapid as to be essentially complete before distribution is finished. (B) For most drugs, the rate of absorption is slower and masks the distribution phase.
Gastric emptying. Basic drugs undergo negligible absorption from the stomach, so there can be a delay of up to an hour between drug administration and the detection of drug in the general circulation.
Food. Food in the stomach slows drug absorption and also slows gastric emptying.
Decomposition or first-pass metabolism before or during absorption. This will reduce the amount of drug that reaches the general circulation but will not affect the rate of absorption, which is usually determined by lipid solubility.
Modified-release formulation. If a drug is eliminated rapidly, the plasma concentrations will show rapid fluctuations during regular oral dosing, and it may be necessary to take the drug at very frequent intervals to maintain a therapeutic plasma concentration. The frequency with which a drug is taken can be reduced by giving a modified-release formulation that releases drug at a slower rate. The plasma concentration then becomes more dependent on the rate of absorption than the rate of elimination.
Extent of absorption
Bioavailability (F) is defined as the fraction of the administered dose that reaches the systemic circulation as the parent drug (not as metabolites). For oral administration, incomplete bioavailability (F < 1) may result from:
incomplete absorption and loss in the faeces, because either the molecule is too polar to be absorbed or the tablet did not release all of its contents,
first-pass metabolism in the gut lumen, during passage across the gut wall or by the liver before the drug reaches the systemic circulation.
The bioavailability of a drug has important therapeutic implications, because it is the major factor determining the drug dosage for different routes of administration. For example, if a drug has an oral bioavailability of 0.1, the oral dose needed for therapeutic effectiveness will need to be 10 times higher than the corresponding intravenous dose.
The bioavailability is a characteristic of the drug and independent of dose, providing that absorption and elimination are not saturated. Bioavailability is normally determined by comparison of plasma concentration data obtained after oral administration (when the fraction F of the parent drug enters the general circulation) with data following intravenous administration (when, by definition, F = 1, as 100% of the parent drug enters the general circulation). The amount in the circulation cannot be compared at a single time point, because intravenous and oral dosing show different concentration–time profiles, so instead the total area under the plasma concentration–time curve (AUC) from t = 0 to t = infinity is used, as this reflects the total amount of drug that has entered the general circulation. If the oral and intravenous (iv) doses administered are equal:

or if different doses are used:
This calculation assumes that the elimination is first-order.
An alternative method to calculate F is to measure the total urinary excretion of the parent drug (Aex) following oral and intravenous administration of identical doses:

Distribution
Distribution concerns the rate and extent of movement of the parent drug from the blood into the tissues after administration and its return from the tissues into the blood during elimination.
Rate of distribution
Because a distinct distribution phase is not usually seen when a drug is taken orally (Fig. 2.16B), the rate of distribution is normally measured following an intravenous bolus dose. Some intravenous drugs reach equilibrium between blood and tissues very rapidly and a distinct distribution phase is not apparent. In Figure 2.17A the slope of plasma concentration against time therefore mainly reflects elimination of the drug; this is described as a one-compartment model.
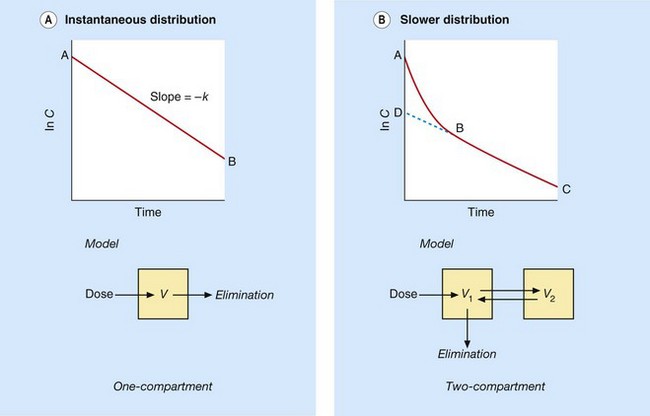
Fig. 2.17 Plasma concentration–time curves for the distribution of intravenous drugs into one- and two-compartment models.
(A) When distribution of an intravenous drug bolus into tissues is so rapid as to be essentially instantaneous, the slope of the plasma concentration–time curve mainly reflects the rate of elimination (one-compartment model. (B) When distribution is slower, the initial fall in concentration (slope A–B) is due to simultaneous distribution and elimination followed by the terminal elimination phase (two-compartment model; slope B–C). Back-extrapolating to D at time zero allows the contribution of distribution during A–B to be distinguished from the underlying contribution of elimination.
Most intravenous drugs, however, take a finite time to distribute into the tissues; the initial distribution out of the plasma, combined with underlying elimination, produces a steep initial slope (slope A–B in Fig. 2.17B), followed by a slower terminal phase (B–C) in which distribution has been largely completed and elimination predominates. Back-extrapolation of this terminal phase to time zero gives an initial value D, which is the theoretical concentration that would have been obtained if distribution had been instantaneous. The actual rate of distribution can therefore be estimated by the difference between the rapid initial fall in concentration (distribution plus elimination, A–B) and the underlying rate of elimination alone (D–B). In practice, knowing the rate of drug distribution is rarely of clinical importance.
Such a two-compartment model in which the drug in one compartment (e.g. blood) equilibrates more slowly with a second compartment (e.g. poorly perfused tissues; or a fetus) is also shown in Figure 2.18. The rate of distribution into the second compartment is dependent on the solubility of the drug:
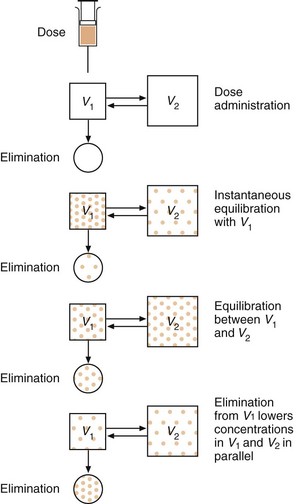
Fig. 2.18 Schematic diagram of drug distribution.
Distribution from the circulation into tissues is reversed as the drug in the circulation is gradually eliminated. At equilibrium, the free drug concentrations are transiently the same in volumes V1 and V2; the total drug concentrations may nevertheless be different due to drug binding to proteins in the plasma or accumulation in tissue fat.
for water-soluble drugs, the rate of distribution depends on the rate of passage across membranes, i.e. the diffusion characteristics of the drug,
for lipid-soluble drugs, the rate of distribution depends on the rate of delivery (the blood flow) to those tissues, such as adipose tissue, that accumulate the drug.
The plasma concentration–time curves of some drugs show three distinct phases; such three-compartment models are of limited practical value.
Extent of distribution
The extent of distribution of a drug from plasma into tissues is more important clinically than the rate because it determines the total amount of a drug that has to be administered to produce a particular plasma concentration (and therapeutic effect). In humans only the concentration in blood or plasma can be measured easily, so the extent of distribution has to be estimated from the amount remaining in blood, or more usually plasma, after completion of distribution.
The parameter that describes the extent of distribution is the apparent volume of distribution (Vd). In general terms, the concentration of a drug solution is the amount (or dose) of drug dissolved in a volume; rearranging this gives:
If an intravenous dose of 50 mg of a particular drug is injected, and, after an appropriate interval to allow time for distribution to reach equilibrium, the total concentration of the drug in plasma is found to be 1 mg⋅L−1, then the apparent volume of distribution (Vd) is:
In other words, after giving the dose, it appears that the drug has been dissolved in 50 L of plasma. However, the plasma volume in adult humans is only about 3 L, so much of the drug must have left the plasma and entered tissues in order to give the low concentration remaining in the plasma (1 mg⋅L−1).
Vd is a characteristic of a particular drug and is independent of dose; its clinical usefulness becomes apparent when a physician needs to calculate how much of the drug should be given to a patient to produce a desired plasma concentration. If an initial plasma concentration of 2.5 mg⋅L−1 of the drug is needed for a clinical effect, this could be produced by giving an intravenous dose of (the known Vd × the desired plasma concentration) or (50 L × 2.5 mg⋅L−1); that is, a dose of 125 mg.
In practice, in measuring the Vd value of a drug it has to be remembered that distribution usually takes time to reach equilibrium, and also that during this time elimination is steadily reducing the total amount of drug in the body. In calculating Vd, therefore, it is usual to extrapolate the plasma-concentration curve back to time zero (as illustrated in Fig. 2.17b) to find the theoretical concentration as if the drug has distributed instantaneously and significant elimination has not yet occurred:
It is important to recognise that Vd may not be a true physiological volume. If the Vd calculated for a drug is 2.5–3 L, this might indicate that it has been confined within the circulatory volume, while a Vd value of about 40 L might mean it has been able to pass into tissues and is distributed uniformly into the total volume of body water, which is about 40 L in adults. However, Vd is only a theoretical measure based on how much the concentration of drug remaining in the plasma has been diluted by its distribution in the body. While a large Vd may indeed occur when the drug is distributed at uniform concentrations into a large body compartment (such as total body water), the same high Vd may also occur if the drug has been highly bound or sequestered by a tissue component within one or more smaller compartments. For example, binding tightly to tissue proteins in a single organ, or sequestration of a lipophilic drug at high concentrations into adipose (fat) cells, may reduce the plasma drug concentration to the same extent (and produce the same large Vd). Identifying such effects can be achieved only by measuring drug concentrations in tissues, which is rarely practicable in humans.
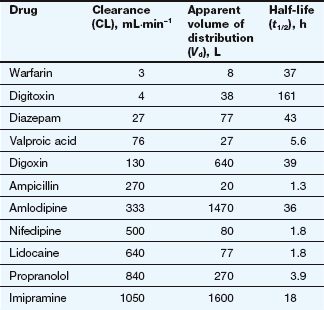
The Vd of a drug is nevertheless an important concept. It indicates the theoretical volume that has to be cleared of the drug by the organs of elimination, such as the liver and kidneys, which extract the drug from the plasma for metabolism and excretion. Together with clearance (the volume of plasma from which the drug can be cleared in a certain time), it determines the overall rate of elimination and therefore the half-life of the drug. In turn, the half-life determines the duration of action of a single dose and hence the optimal interval between repeated doses of the drug (see below).
Elimination
The rate at which the drug is eliminated is important because it usually determines the duration of response, the time interval between doses and the time to reach equilibrium during repeated dosing.
Rate of elimination
The rate of elimination of a drug from the circulation (and its associated plasma half-life) is usually indicated by the terminal slope of the plasma concentration–time curve (slope B–C in Fig. 2.17B). The elimination half-lives of drugs range from a few minutes to many days (and, in rare cases, weeks).
The activity of the organ of elimination
The main organs of elimination (the liver and kidneys) can only remove drug delivered to them via the blood. The first key concept in understanding drug elimination is that as long as the elimination process is not saturated, a constant proportion (not a constant amount) of the drug carried in the blood will be removed on each passage through the organ of elimination, whatever the drug concentration in the blood. In effect, this is equivalent to saying that a constant proportion of the blood flow to the organ is cleared of drug. For example, if 10% of the drug carried to the liver by the plasma (at a flow rate of 1000 mL⋅min−1) is cleared by uptake and metabolism, this is equivalent to a clearance of 10% of the plasma flow (100 mL⋅min−1); if the drug is metabolised more efficiently such that 20% of the drug is cleared, this gives a clearance of 200 mL⋅min−1.
Clearance is therefore the volume of blood cleared of drug per unit time, not the amount of drug cleared in that time, which will vary depending on the drug concentration in the blood. If the drug concentration in the blood is high there will be a greater amount of the drug in the volume that is cleared per unit time, resulting in a greater rate of elimination; if the drug concentration is low the same clearance will eliminate a smaller amount of the drug per unit time. Overall, the rate of drug elimination from the body is therefore the product of plasma concentration of the drug and its plasma clearance (CL), a relationship which can be rearranged to:

The plasma clearance is a characteristic value for a particular drug (see Table 2.8); it is a constant for first-order reactions and is independent of dose or concentration.
Reversible passage of drug from the blood into tissues
The organs of elimination can only act on drug that is delivered to them via the blood supply, and the amount of drug eliminated depends on its concentration within the volume of plasma being cleared per unit time. By definition, a drug that is distributed at equilibrium into a large apparent volume of distribution has a low plasma concentration; hence the rate of elimination is inversely proportional to apparent Vd:
The overall rate constant of elimination (k) can therefore be related directly to the volume of plasma cleared per minute (CL) and inversely to the total apparent volume of plasma that has to be cleared (Vd):

Since also (equation 2.6):

Therefore:
The relationship between elimination, volume of distribution and clearance is illustrated in Figure 2.19. The elimination rate constant (k) or half-life (t1/2) are the best indicators of a fall in drug concentration with time, and for most drugs this will be accompanied by a decrease in therapeutic activity.
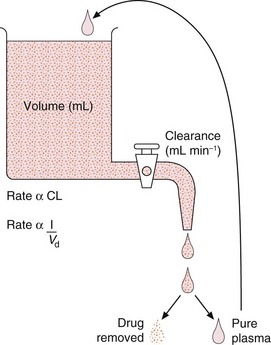
Fig. 2.19 The relationship between clearance, apparent volume of distribution and overall elimination rate.
The drug is eliminated by the clearance process, which removes whatever amount of the drug is present in a fixed volume of plasma, per unit time. The drug is then separated and the pure plasma added back to the reservoir to maintain a constant volume (the apparent volume of distribution, Vd). The fluid, therefore, continuously recycles via the clearance process and the concentration of drug decreases exponentially.
Clearance is the best measurement of the ability of the organs of elimination to remove the drug and determines the average plasma concentrations (and therefore therapeutic activity) at steady-state (see below). Clearance is usually determined using the area under the plasma concentration–time curve (AUC) extrapolated to infinity after an intravenous dose. Clearance and the AUC of a given dose of drug are inversely related; if clearance was zero, the drug would not be eliminated and its plasma concentration would remain at equilibrium indefinitely (the AUC would be infinitely large). Conversely, if the clearance was infinite, the AUC would be zero, as the drug would be eliminated instantly. The ratio of an intravenous drug dose to the area under its plasma concentration–time curve (note: not the logarithm of plasma concentration) is therefore a measure of clearance:

If an oral drug is used instead, the dose in this equation would be corrected by its bioavailability (i.e. F × Dose).
The two equations for clearance (2.14 and 2.15) can be combined to derive equation 2.16, which is used to calculate Vd more reliably than the extrapolation method given in equation 2.11 and Figure 2.17b:
The plasma clearance of a drug is the sum of all possible clearance processes (metabolism + renal excretion + biliary excretion + exhalation + etc.). Measurement of its component processes is only really possible for renal clearance, performed by relating the rate of urinary excretion to the mid-point plasma concentration. Subtracting renal clearance from the total plasma clearance gives a reasonable estimate of metabolic (mainly hepatic) clearance, which cannot be measured directly. Being able to estimate both renal and hepatic clearance values can be useful in predicting the impact of renal or liver disease.
Chronic administration
Repeated drug doses are used to maintain a constant concentration of the drug in the blood and at the site of action for a persistent therapeutic effect. In practice, a perfectly stable concentration can only be achieved by maintaining a constant intravenous infusion that has reached a steady-state balance between drug input and drug elimination (Fig. 2.20).
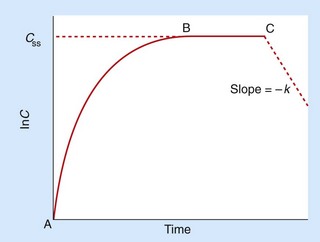
Fig. 2.20 Constant intravenous infusion (between points A and C).
A steady-state concentration (Css) is reached at point B and can be used to calculate clearance (CL = rate of infusion/Css). Clearance can also be calculated from the total dose infused between A and C and the area under the total curve (AUC). The negative slope after ending the infusion gives the terminal elimination phase (k). The rate of elimination determines the time taken to reach Css, approximately four to five half-lives.
Time to reach steady-state
During constant infusion, the time to reach steady-state is dependent on the elimination half-life; as a rule of thumb, steady-state is approached after four or five times the elimination half-life. A drug with slow elimination takes a long time to reach its steady-state as it will accumulate to high plasma concentrations before its elimination rate rises to match the rate of drug infusion (because the elimination rate depends on plasma concentration) (equation 2.12). Since the elimination half-life is also dependent on volume of distribution (equation 2.14), a high Vd can also contribute to delay in achieving steady-state. It is easy to envisage the slow ‘filling’ of such a high volume of distribution during regular administration.
Plasma concentration at steady-state
Once steady-state has been reached, the plasma and tissues are in equilibrium, and the distribution rate and Vd will no longer affect the plasma concentration. The key insight is that a steady-state concentration (Css) is achieved when the rate of elimination equals the rate of infusion. From equation 2.12 the rate of elimination equals CL × Css, so at steady-state the rate of infusion also equals CL × Css, or:
Alternatively, the rate of an intravenous infusion and the Css achieved can be used to calculate plasma clearance:
Clearance and volume of distribution can also be calculated using the AUC between zero and infinity and the terminal slope after cessation of the infusion (see Fig. 2.20).
Oral administration
Most chronic administration of drugs is by the oral route, and the rate and extent of absorption affect the shape of the plasma concentration–time curves. Because oral therapy is by intermittent doses there will be a series of peaks and troughs matching the intervals between repeated doses (Fig. 2.21). The rate of absorption will influence the profile, since very rapid absorption will exaggerate fluctuations, while slow absorption will dampen down the peaks. As not all the administered dose (D) will be absorbed, the rate of dosage during chronic oral therapy is corrected for bioavailability (F):

where t is the interval between doses. When steady-state is achieved, the rate of input is equal to the rate of elimination, which is the clearance (CL) multiplied by the drug concentration averaged between the peaks and troughs (Css), so:
Therefore:

This important equation means it is possible to alter plasma Css by altering either the dose (D) or the dose interval (t). The bioavailability (F) depends largely on the drug formulation and clearance (CL) is usually constant unless there is a change in hepatic or renal function.
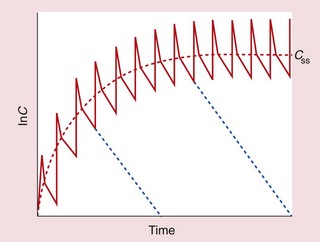
Fig. 2.21 Chronic oral therapy (solid line) compared with intravenous infusion (dashed red line) at the same dosage rate.
Each oral dose shows rapid absorption and distribution to reach a peak, followed by a slower elimination phase in which concentrations fall to a trough. Successive peaks (or successive troughs) align with the dose interval. Cessation of therapy after any dose would produce the lines shown in blue.
Loading dose
A problem may arise when a rapid onset of effect is required for a drug that has a very long half-life; for example, if the half-life of the drug is 24 h, the steady-state conditions will not be reached until 4–5 days, and if the half-life is 1 week, reaching a steady-state will take over 4 or 5 weeks. Increasing the dose rate (by increasing the dose or shortening the dose interval) would accelerate the rise in plasma concentrations, but, if the higher dose-rate were sustained it would lead to a higher steady-state concentration being achieved than desired.
Delay between starting treatment and reaching the steady-state therapeutic concentration can be avoided by administering a loading dose. This is a high initial dose that ‘loads up’ the body to shorten the time to steady-state. The key principle is that the loading dose is the single dose required to produce the desired steady-state concentration in the apparent volume of distribution (i.e. Css = loading dose/Vd; see equation 2.10), so:

The loading dose is equivalent to the total body load of drug that would be achieved more slowly by the chronic dosage regimen (equation 2.21).
In cases where Css or V are not known, the loading dose can be calculated based on the parameters of the proposed maintenance regimen by replacing Css with equation 2.21 and Vd by equation 2.14:
It is clear from this last equation that the magnitude of any loading dose compared with the maintenance dose is proportional to the half-life.
If a drug has a very long half-life such that a very large loading dose is required, it may be given in divided doses over 24–36 h, as local variations in the rate of distribution to different tissues may otherwise cause high localised concentrations and hence toxicity.
Following the loading dose, the steady-state plasma concentration can be sustained indefinitely by the maintenance dosage regimen given by equation 2.21.
Pharmacokinetics of biological drugs
The first recombinant protein drug was human insulin, marketed in 1982, and there are now over 100 biological drugs available, including monoclonal antibodies, cytokines, growth factors and blood products. Such biopharmaceuticals can create special pharmacokinetic problems, mainly due to their protein structures, as follows.
Absorption: pH-dependent and enzymatic breakdown of proteins in the gastrointestinal tract (>99%) precludes oral administration; administration of biopharmaecuticals is by parenteral routes (intravenous, subcutaneous, intramuscular), including – occasionally – intranasal and inhaled routes. Bioavailability of protein drugs may be low due to local proteolysis, such as at subcutaneous or intramuscular injection sites. Larger molecules (>30 kDa) cross the capillary endothelium poorly and may enter the systemic circulation by the lymphatic system.
Distribution: biological drug distribution may be confined to the blood and extracellular tissues. Protein drugs may bind extensively to albumin and other plasma proteins, affecting their distribution and rate of metabolism.
Elimination: biological drugs are not excreted unchanged but undergo extensive proteolysis in the blood, liver, kidneys and other tissues to small peptides and amino acids, which enter the general pool of amino acids used in endogenous protein synthesis. Degradation depends on molecular weight, charge and the extent of glycosylation; recombinant drug molecules may be designed to lack common sites of proteolytic cleavage, or coated with polyethylene glycol (pegylation) to improve solubility and resistance to proteolysis. The elimination kinetics of biopharmaceuticals can be variable and complex; concentrations of monoclonal antibodies in plasma fall initially as they bind tightly to their targets, but their terminal elimination half-life may be as slow as that of endogenous immunoglobulins (14–28 days), enabling long dosing intervals.
Toxicity and clinical use: biopharmaceuticals are often highly species-specific and their toxicity is usually receptor-dependent or immunogenic in origin. Immunogenicity is reduced in drugs based on human protein sequences, but these are more difficult to develop as they may lack efficacy in animal models. The complex tertiary structure of recombinant proteins makes them more vulnerable to degradation by heat, pH effects and shear forces during manufacture, storage and handling.
Genetic variation and drug kinetics
The earliest studies on pharmacogenetics were on enzymes involved in drug metabolism. N-Acetyltransferase (NAT) was one of the first drug metabolism pathways found to show a genetic polymorphism that influenced both the plasma concentrations of a drug (isoniazid) and its therapeutic response. Individuals with low enzyme activity, so-called slow acetylators, had higher blood concentrations and a better response to isoniazid but a greater risk of toxicity than did ‘fast acetylators’.
Because N-acetylation is a minor pathway of drug metabolism, pharmacogenetics remained of largely academic interest until the late 1970s, when it was found that the cytochrome P450 isoenzyme CYP2D6, which is involved in the phase 1 metabolism of 20–25% of all drugs, showed functionally important genetic polymorphisms. Developments in genotyping have allowed the identification of many polymorphisms in a number of cytochrome P450 isoenzymes with consequences for the phase 1 metabolism and elimination of many drugs; examples are listed in Table 2.9. Polymorphisms have also been identified in a number of phase 2 metabolic enzymes; notable is the *28 variant in UDP glucuronyl transferase (UGT1A1*28), which results in impaired metabolism of the topoisomerase inhibitor irinotecan and greater adverse effects when the drug is used for treatment of colon cancer.
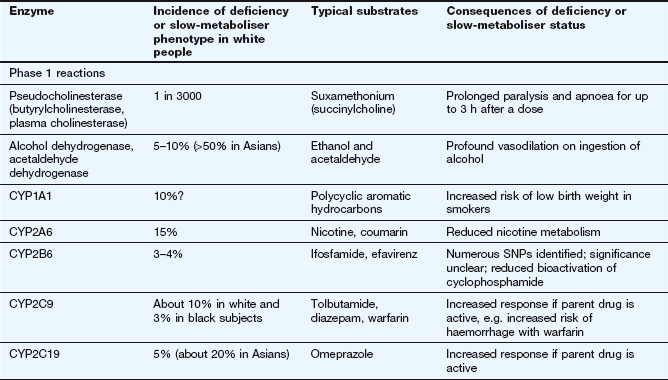
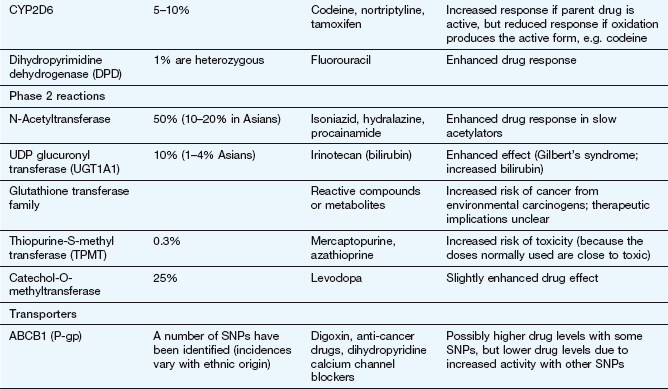
The prevalence of such gene variants may differ between ethnic groups; people from the Indian subcontinent have a lower systemic clearance of nifedipine (a CYP3A4 substrate) compared with white people, and intolerance to alcohol ingestion associated with polymorphisms in alcohol dehydrogenase (ADH) and acetaldehyde dehydrogenase (ALD) is common in people of Chinese and Japanese origin.
Polymorphisms that alter the elimination pathways of drugs may influence their efficacy and safety by altering plasma concentrations of the active drug, or by modifying the amounts of active or toxic metabolites. They may also alter the enzymatic conversion of prodrugs into their active metabolites, or change the distribution of drugs by altering their transport across membranes. There are functional polymorphisms in some ABC transporter proteins, including the MDR1 gene which codes for P-gp, and in OATs in the kidney, although the consequences of these for drug transport are unclear. Genetic polymorphisms are likely to be of greatest clinical significance when the polymorphic protein is in the main pathway affecting bioavailability and/or elimination and when the drug has a narrow therapeutic index (Ch. 53).
The influence of genetic variation must be set against environmental factors, including age, pregnancy, interactions with other drugs (including alcohol and tobacco) and concurrent conditions including impairment of renal or hepatic function, which may be of greater importance in predicting drug efficacy and unwanted effects (Ch. 56). A number of commercial tests have been marketed for specific gene polymorphisms in drug-metabolising enzymes, including some of those listed in Table 2.9. There are nevertheless formidable obstacles to widespread use of genetic testing, including issues of cost and privacy. In most cases, individual gene polymorphisms have limited predictive value, and testing for haplotypes of multiple polymorphisms in the same gene or in other genes within the same metabolic pathways may be more predictive, but also more costly and difficult to interpret. A major hurdle to genetic testing at present is that reliable clinical trial data are not usually available in people with diverse genotypes to guide prescribers in making appropriate alterations in drug regimens.
True/false questions
Are these statements true or false?
1. Un-ionised molecules cross phospholipid membranes more readily than their ionised forms.
2. Weak acidic drugs are mostly ionised in acid solutions.
3. Weak acidic drugs, such as aspirin, are mostly absorbed in the stomach.
4. Basic drugs may bind reversibly to α1-acid glycoprotein in the plasma.
5. The plasma clearance of a drug usually decreases with increases in the dose prescribed.
6. First-pass metabolism may limit the bioavailability of orally administered drugs.
7. Drugs that show high first-pass metabolism in the liver also have a high systemic clearance.
8. The half-life of many drugs is longer in babies than in children or adults.
9. A decrease in renal function affects oral bioavailability.
10. Depot injections of drugs have a prolonged half-life because their renal clearance is reduced.
11. Nifedipine is eliminated more rapidly in cigarette smokers.
12. Chronic treatment with phenobarbital can increase the systemic clearance of co-administered drugs.
13. A loading dose is not necessary for drugs that have short half-lives.
14. An obese person is likely to show an increased volume of distribution of lipid-soluble drugs and would require higher dosage than a non-obese subject during chronic therapy.
15. Alcohol intolerance due to genetic polymorphism is common in some ethnic groups.
One-best-answer (OBA) questions
1. Which of the following statements about cytochrome P450 (CYP) isoenzymes is the least accurate?
A CYP enzymes catalyse drug conjugation reactions.
B CYP isoenzyme activity can be influenced by diet.
C The major site of CYP-mediated drug metabolism is the liver.
2. Which of the following statements regarding apparent volume of distribution (Vd) is the least accurate?
A The Vd will be low if the drug is highly bound to plasma proteins.
B The Vd is the dose of intravenous drug divided by the plasma concentration extrapolated back to time zero.
C The Vd depends on the dose of drug administered.
D The elimination half-life of a drug depends on the Vd and on clearance (CL).
Descriptive question
Figure 2.22 shows the changes in plasma levels of two drugs, A and B, each given as 10 mg doses by both the oral and intravenous routes to an adult man. From the plasma concentration–time curves, describe how the drugs compare for the following properties.
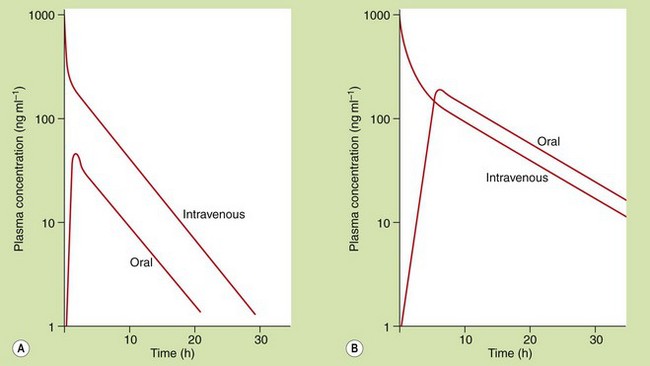
Case-based questions
Treatment with oral theophylline is started in a 7-year-old girl (weighing 31 kg) admitted to the accident and emergency department with asthma. The desired steady-state plasma concentration is 15 µg⋅mL−1. The apparent volume of distribution (Vd) of theophylline is 0.5 L⋅kg−1 and its oral bioavailability is 60% (F = 0.6). Which of the following would be the most appropriate loading dose?
Case 2
A man weighing 70 kg was admitted to hospital with a serious infection and was treated with two antibacterials. Gentamicin is given by intravenous administration, and cefalexin is given orally with bioavailability of 90% (F = 0.9).
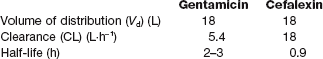
Gentamicin is very toxic and its therapeutic plasma concentrations should not exceed 5 mg⋅L−1, since higher concentrations can lead to ototoxicity and nephrotoxicity.
A You have calculated that you will give him 900 mg of gentamicin by injection as a bolus (single) dose. Is this a safe dose?
B Because of the short half-life of gentamicin you then decide that it will be best to give him a continuous intravenous infusion to maintain a steady-state plasma concentration of 2.5 mg/L. What rate of infusion should be given?
C What maximum plasma concentration would be obtained if a single oral loading dose of 500 mg cefalexin was given?
Case 3
Mrs J (body weight 70 kg) was diagnosed with congestive heart failure and atrial fibrillation. Treatment was started with digoxin, which has an apparent volume of distribution (Vd) of 9 L⋅kg−1 and a half-life (t1/2) of 42 h. The plasma concentrations for therapeutic effectiveness are 0.8–2 ng⋅mL−1, and toxic effects occur above 2 ng⋅mL−1.
1. True. Ionisation reduces lipid solubility and improves solubility in water.
2. False. Weak acids are least ionised in acid solutions and most ionised in basic solutions.
3. False. Although low pH in the stomach renders aspirin into its un-ionised, lipid-soluble form, the low surface area of the stomach wall limits the extent of drug absorption; the bulk of most oral drugs is absorbed across the much larger surface area of the small intestine.
4. True. Basic (or neutral) drugs may bind reversibly to α1-acid glycoprotein, while many acidic drugs bind to albumin.
5. False. Provided the elimination processes are not saturated, clearance (like bioavailability and apparent volume of distribution) is independent of dose and is a characteristic of the drug. The increase in plasma concentration following an increase in drug dose causes an increase in the amount of drug eliminated per unit time, but the volume of plasma cleared of drug per unit time (clearance) is unaltered.
6. True. This statement is true for all ‘pre-systemic’ sites of metabolism of the oral dose, e.g. gut lumen, intestinal wall and liver. Low bioavailability may also arise from poor absorption.
7. True. If the liver is able to clear a high proportion of the drug as it is absorbed from the gastrointestinal tract (on first pass), then the drug fraction that survives to enter the general circulation will experience further rapid clearance on subsequent passes through the liver.
8. True. Infants under 12 months have relatively low hepatic metabolism and renal excretion, so many drugs are cleared more slowly and have longer half-lives than in older children and adults.
9. False. A decrease in renal function could affect systemic clearance, but bioavailability is simply the fraction of the oral dose that reaches the general circulation, and the kidneys are not part of the route between gut lumen and general circulation.
10. False. Using a depot injection of a drug prolongs its apparent elimination half-life due to slower, sustained release from the site of injection. Once absorbed into the blood, the circulating drug is handled by the kidneys as normal; the volume of plasma cleared of the drug per unit time is unaltered.
11. False. From Table 2.7, nifedipine is metabolised by CYP3A4, while smoking induces CYP1A2, so no interaction is likely to occur.
12. False. Phenobarbital is a potent inducer of several cytochrome P450 isoenzymes and this can increase the ability of the liver to metabolise many co-administered drugs.
13. True. Drugs with short elimination half-lives do not accumulate significantly so there is relatively little delay before the drug reaches therapeutic concentrations and a loading dose is unnecessary.
14. False. A lipid-soluble drug would have an increased apparent Vd in an obese person so its half-life would be longer (due to slower elimination). However, clearance (the volume of plasma cleared of drug per unit time) is unaffected, so Css is also unaffected as it depends on CL but not on Vd (see equation 2.21). There would consequently be no need to modify chronic drug dosage because of an increase in Vd in an obese person. It would, however, take longer to achieve the steady-state plasma concentration (Css), and the total body load of drug at steady-state (Css × Vd) would be higher.
15. True. Genetic polymorphisms that alter the activity of alcohol dehydrogenase and acetaldehyde dehydrogenase underlie the alcohol intolerance (facial flushing, etc.) experienced by many people of Chinese and Japanese ancestry.
OBA answers
1. Answer A is the least accurate.
A False. CYP enzymes are involved in many types of oxidation, reduction, hydrolysis and hydration reactions during phase 1 drug metabolism, but phase 2 (conjugation) reactions are catalysed by other enzymes (such as UDPGT and glutathione transferases).
B True. CYP isoenzymes can be inhibited or induced by dietary items such as grapefruit juice and charred meat.
C True. The liver has higher levels of CYP isoenzymes than other tissues.
D True. Pharmacogenetic variation is particularly marked for CYP2C19 and CYP2D9.
E True. For example, ethanol induces CYP2E and is also a substrate for this isoenzyme
2. Answer C is the least accurate.
A True. Drugs confined within the circulation (e.g. by plasma protein binding) have a low apparent Vd. (The total drug concentration in plasma, both free and bound, is used when calculating Vd. Extensive binding of the drug to proteins in tissues outside the circulation could inflate the apparent Vd.)
B True. Extrapolation of the plasma concentration to time zero estimates the apparent Vd before elimination reduces the total amount of drug in the body.
C False. Apparent Vd is a characteristic of a particular drug, but is independent of dose.
D True. The half-life is proportional to Vd and inversely proportional to clearance.
Descriptive answers
A The rate of absorption is determined by the rate of increase after oral dosing. Drug A is absorbed rapidly, while drug B takes about 6 h to reach a peak concentration.
B Bioavailability (F) is determined by the ratio of the area under the oral and intravenous curves (AUCoral/AUCiv). For drug A, bioavailability (F) is visibly much less than 1, while for drug B the AUCoral approximately equals the AUCiv, so F is approximately 1.
C The rates of distribution are given by the slopes of the intravenous drug curves from time zero to the establishment of the terminal elimination phase, which is at about 1 h for drug A and at 4 h for drug B, so drug A distributes more rapidly. Extrapolating the slope of the terminal phase back to time zero gives similar intercepts (apparent Vd), indicating the drugs have a similar extent of distribution.
D The slope of the elimination phase (k) is greater for drug A than for B, so its elimination is faster and half-life is shorter (t1/2 = 0.693/k). This must be due to a lower clearance (CL) of drug B, since it was shown above that the volume of distribution is similar for both drugs. This is also apparent from the greater AUC for intravenous drug B, as the doses were the same (10 mg).
E The potential for accumulation depends on the difference between half-life and dose interval (once-daily = 24 h). It is clear that after 24 h nearly all of drug A has been removed from the plasma but considerable amounts of B remain, so drug B would show significant accumulation.
Case-based answers
Answer C is correct. Note that the apparent Vd is given as 0.5 L per kilogram of the child's bodyweight (31 kg), and also that the plasma concentration (15 µg⋅mL−1) should be converted to 15 mg⋅L−1. Loading dose is given by Css × Vd, so:
Loading dose = 15 mg⋅L −1 × (0.5 L⋅kg−1 × 31 kg) = 232 mg
However, 232 mg is the dose required to be absorbed; as the bioavailability (F) of theophylline is only 0.6, the administered dose needs to be 232/0.6 = 387 mg (Answer C).
Case 2
A The maximal recommended dose is given by maximal plasma concentration (Css) × volume of distribution (Vd) so 5 mg⋅L−1 × 18 L = 90 mg. Your calculation of a bolus dose of 900 mg is therefore not safe, as it would give a plasma concentration 10 times higher than recommended.
B At steady-state, the rate of infusion = the rate of elimination = CL (clearance) × Css (equation 2.17), so for a plasma concentration of 2.5 mg⋅L−1 you will need to give an infusion rate of 5.4 L⋅h−1 × 2.5 mg⋅L−1 = 13.5 mg⋅h−1.
C For a single oral dose the peak concentration is approximately equal to the absorbed dose divided by the apparent volume of distribution (Vd) (equation 2.10). Including a correction for the bioavailability (F = 0.9) of the oral dose (D = 500 mg), the concentration is:
C = (D × F)/Vd = (500 mg × 0.9) /18 L = 25 mg L−1
Due to some elimination occurring before the peak concentration is reached, the peak concentration achieved would be lower than 25 mg⋅L−1, but this could be ignored in clinical practice.
Case 3
A Drugs take about four to five times their elimination half-life to reach a steady-state. For digoxin (t1/2 = 42 h) this is 168–210 h, or about 7–9 days, hence the need for a loading dose.
B Using equation 2.22, and correcting Vd (9 L⋅kg−1) for the patient's body weight (70 kg) gives:
Loading dose = Css × Vd = 0.8 µg⋅L−1 × (9 L⋅kg−1 × 70 kg) = 504 µg
Baumann, A. Early development of therapeutic biologics – pharmacokinetics. Curr Drug Metab. 2006;7:15–21.
Choudhuri, S, Klaassen, CD. Structure, function, expression, genomic organization, and single nucleotide polymorphisms of human ABCB1 (MDR1), ABCC (MRP), and ABCG2 (BCRP) efflux transporters. Int J Toxicol. 2006;25:231–259.
Cole, SPC, Deeley, RG. Transport of glutathione and glutathione conjugates by MRP1. Trends Pharmacol Sci. 2006;27:438–446.
Daly, AK. Pharmacogenetics and human genetic polymorphisms. Biochem J. 2010;429:435–449.
De Boer, AG, van der Sandt, ICJ, Gaillard, PJ. The role of drug transporters at the blood–brain barrier. Annu Rev Pharmacol Toxicol. 2003;43:629–656.
Evans, WE, McLeod, HL. Pharmacogenomics – drug disposition, drug targets, and side effects. N Engl J Med. 2003;348:538–549.
Feero, WG, Guttmacher, AE, Collins, FS. Genomic medicine — an updated primer. N Engl J Med. 2010;362:2001–2011.
Fromm, MF. Importance of P-glycoprotein at blood–tissue barriers. Trends Pharmacol Sci. 2004;25:423–429.
Gabrielsson, J, Green, AR. Quantitative pharmacology or pharmacokinetic-pharmacodynamic integration should be a vital component in integrative pharmacology. J Pharmacol Exp Ther. 2009;331:767–774.
Handschin, C, Meyer, UA. Induction of drug metabolism: the role of nuclear receptors. Pharmacol Rev. 2003;55:649–673.
Kirchheiner, J, Seeringer, A. Clinical implications of pharmacogenetics of cytochrome P450 drug metabolizing enzymes. Biochim Biophys Acta. 2007;1770:489–494.
Koepsell, H. Polyspecific organic cation transporters: their functions and interactions with drugs. Trends Pharmacol Sci. 2004;25:375–381.
Lee, G, Dallas, S, Hong, M, Bendayan, R. Drug transporters in the central nervous system: brain barriers and brain parenchyma considerations. Pharmacol Rev. 2001;53:569–596.
Lee, W, Kim, RB. Transporters and renal drug elimination. Annu Rev Pharmacol Toxicol. 2004;44:137–166.
Miyazaki, H, Sekine, T, Endou, H. The multispecific organic anion transporter family: properties and pharmacological significance. Trends Pharmacol Sci. 2004;25:654–662.
Nebert, DW, Vesell, ES. Can personalised drug therapy be achieved? A closer look at pharmaco-metabonomics. Trends Pharmacol Sci. 2007;27:581–586.
Pelkonen, O, Turpeinen, M, Hakkola, J, Honkakoski, P, Hukkanen, J, Raunio, H. Inhibition and induction of human cytochrome P450 enzymes: current status. Arch Toxicol. 2008;82:667–715.
Pirmohamed, M. Pharmacogenetics: past, present and future. Drug Discov Today. 2011;16:852–861.
Rees, DC, Johnson, E, Lewinson, O. ABC transporters: the power to change. Nat Rev Mol Cell Biol. 2009;10:218–227.
Szakacs, G, Varadi, A, Ozvegy-Laczka, C, Sarkadi, B. The role of ABC transporters in drug absorption, distribution, metabolism, excretion and toxicity (ADME-Tox). Drug Discov Today. 2008;13:379–393.
Tukey, RH, Strassburg, CP. Human UDP-glucuronosyltransferases: metabolism, expression, and disease. Annu Rev Pharmacol Toxicol. 2000;40:581–616.
Verkmann, AS. Aquaporins: translating bench research to human disease. J Exp Biol. 2009;212:1707–1715.
Wang, L, McLeod, HL, Weinshilboum, RM. Genomics and drug response. N Engl J Med. 2011;364:1144–1153.
Weinshilboum, RM, Wang, L. Pharmacogenetics and pharmacogenomics: development, science, and translation. Annu Rev Genom Hum Gen. 2006;7:223–245.
Xie, H-G, Kim, RB, Wood, AJJ, Stein, MC. Molecular basis of ethnic differences in drug disposition and response. Annu Rev Pharmacol Toxicol. 2001;41:815–850.