Principles of pharmacology and mechanisms of drug action
Studying pharmacology
Pharmacology is the study of the effects of drugs on biological systems. A drug is an active substance administered in an attempt to prevent, diagnose or treat disease, to alleviate pain and suffering, or to extend life. Drugs may be chemically synthesised, or purified from natural sources with or without further modification, but their development and use are based on rational evidence of efficacy and safety derived from controlled experiments and randomised clinical trials. Drugs can be contrasted with placebos (placebo is Latin for ‘I will please’), defined as inactive substances administered as though they are drugs, but which have no therapeutic effects other than pleasing the patient. Pharmacology evolved on the principle of studying known quantities of purified, active substances to identify their specific mechanisms of action and to quantify their effects in a reproducible manner compared to a placebo or other control.
Much of the success of modern medicine is based on pharmacological science, and this book is confined to pharmacology as it relates to human medicine. Some of the objectives of learning about medical (or clinical) pharmacology are:
 to understand the ways that drugs work to affect biological systems, as a basis for safe and effective prescribing,
to appreciate that pharmacology cannot be fully understood without a parallel understanding of related biological and clinical sciences, including biochemistry, physiology and pathology,
to develop numeracy skills for calculating drug doses and dilutions, and to enable accurate comparison of the relative benefits and risks of different drugs,
to be able to comprehend and participate in research studies advancing knowledge of better treatment of patients.
The answer to the frequently asked question ‘What do I need to know?’ will depend upon the individual requirements of the course you are studying, your year of study and the examinations you will be taking. The depth and type of knowledge required in different areas and topics may vary as you progress through your studies; for example, early in the course you might not be required to have detailed knowledge of drug monitoring, but you should know whether a drug has a narrow safety margin between its wanted and unwanted effects. Your personal enthusiasm for pharmacology is important and should be driven by the recognition that prescribing medicines is the commonest intervention that most doctors (and, increasingly, other health professionals) make to improve the health of their patients.
Learning about pharmacology is best approached using a variety of resources, in a range of learning scenarios and preferably in the context of clinical care, not from memorising lists of drug facts. We suggest that the following items cover the types of information that you should aim to encounter:
the non-proprietary (generic) drug name (not the proprietary or trade name),
the class to which the drug belongs,
the way the drug works (its mechanism of action and its clinical effects) and whether these vary significantly among patients,
the main reasons for using the drug (its indications),
any reasons why the drug should not be used in a particular case (its contra-indications),
whether the drug is available without prescription,
how the drug is given (route, drug monitoring),
the absorption, distribution, metabolism and excretion (‘ADME’) of the drug (its pharmacokinetics), particularly where these show unusual characteristics,
the drug's unwanted effects, including its propensity to cause interactions with other drugs or foods,
whether there are non-pharmacological treatments that are effective alternatives to drug treatment or will complement the effect of the drug.
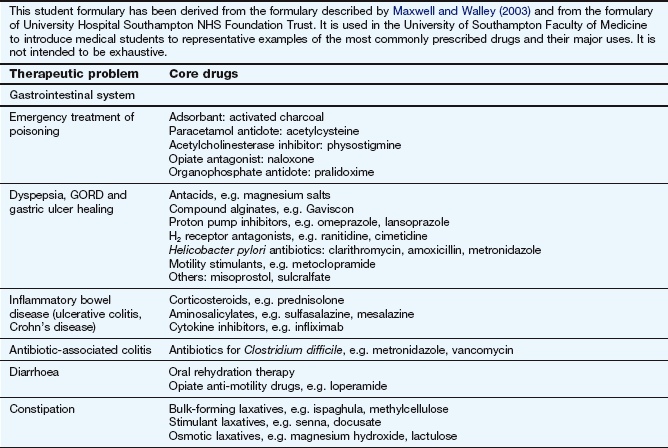
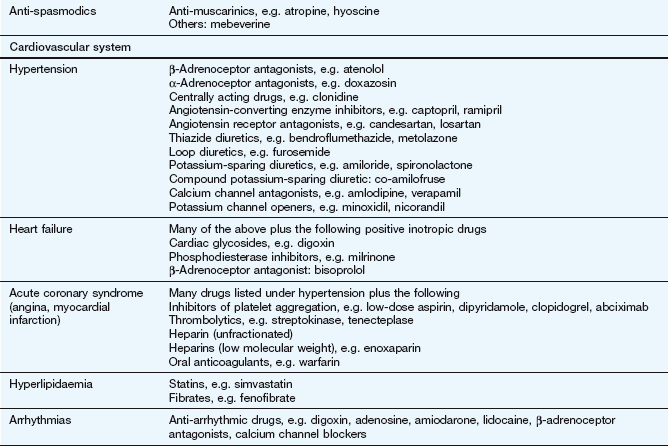
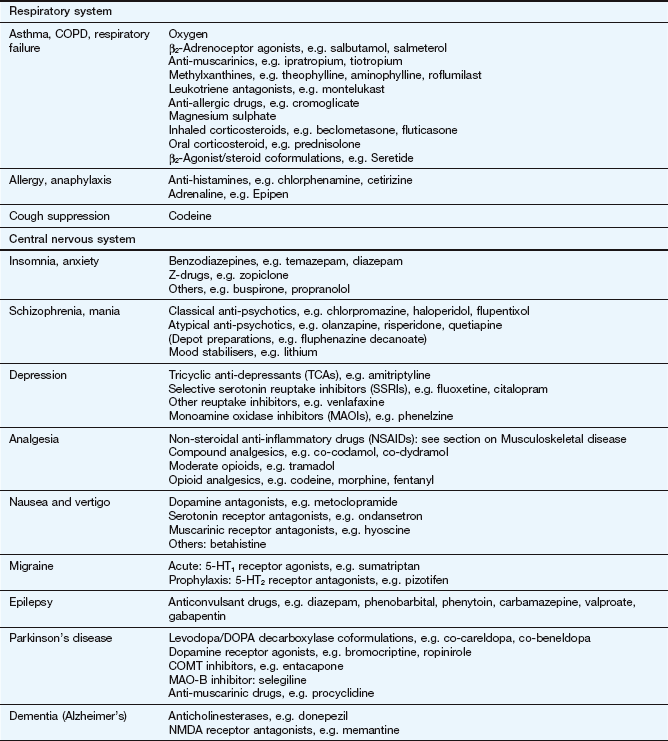
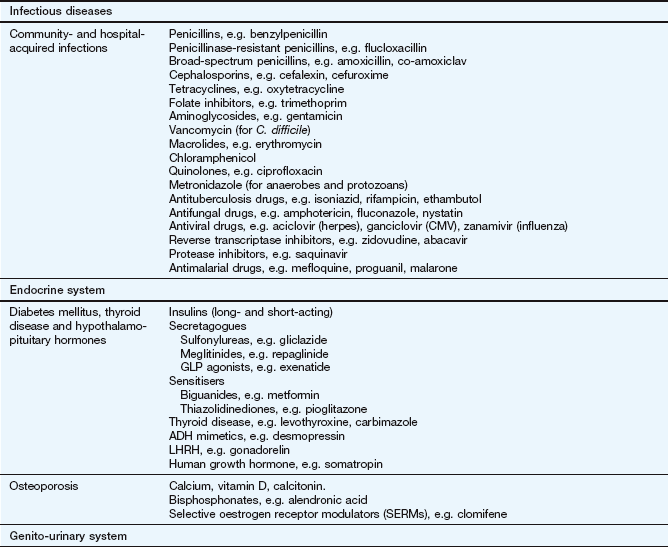
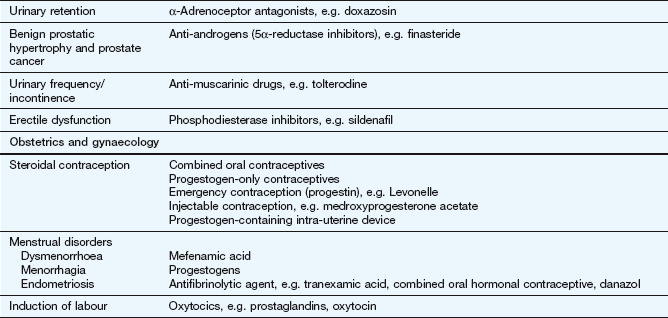
The key reference for prescribers in the UK is the British National Formulary (BNF), available online at www.bnf.org/bnf/index.htm, which contains monographs for nearly all drugs licensed for use in the UK. The Appendix at the end of this chapter provides a formulary of core drugs in each drug class, which gives students in the early stages of training a manageable list of the drugs they are most likely to encounter in clinical practice.
Receptors and receptor-mediated mechanisms
Pharmacology is a materialist science in the sense that it describes how the material (physical) interaction of drug molecules with their macromolecular targets (‘receptors’) in the body modifies cellular processes to generate a desired effect. Drugs have been designed to interact with many different types of macromolecules, which evolved to facilitate endogenous signalling between cells, tissue and organs. The activities of most cellular processes are closely controlled to optimise homeostatic conditions in relation to physiological and metabolic requirements. Control can be divided typically into three main stages.
1. The generation of a biological signal. Homeostasis is maintained by communication between cells, tissues and organs to optimise bodily functions and responses to external changes. Communication is usually by signals in the form of chemical messengers, such as neurotransmitters, local mediators or endocrine hormones. The chemical signal is termed a ligand, because it ligates (ties) to the specialised cellular macromolecule. The cellular macromolecule is a receptor because it receives the ligand.
2. Cellular recognition sites (receptors). The signal is recognised by responding cells by interaction of the signal with a site of action, binding site or receptor, which may be in the cell membrane, the cytoplasm or the nucleus. Receptors in the cell membrane react with extracellular ligands that cannot readily cross the cell membrane (such as peptides). Receptors in the cytoplasm often react with lipid-soluble ligands that can cross the cell membrane.
3. Cellular changes. Interaction of the signal and its site of action in responding cells results in functional changes within the cell that give rise to an appropriate biochemical or physiological response to the original homeostatic stimulus.
Each of these three stages provides important targets for drug action and this chapter will outline the principles underlying drug action mainly in stages 2 and 3.
Actions of drugs at binding sites (receptors)
For very many drugs the first step in producing a biological effect is by interaction of the drug with a receptor, either on the cell membrane or inside the cell, and it is this binding that triggers the cellular response. Drugs may be designed to mimic, modify or block the actions of endogenous ligands at that receptor. The receptor table at the end of this chapter shows that cell-membrane and cytosolic receptors tend to occur in different families (receptor types), reflecting their evolution from common ancestral receptors. Within any one family of receptors, different receptor subtypes have evolved divergently to facilitate increasingly specific signalling and distinct biological effects. As might be expected, different receptor families have different characteristics, but subtypes within each family retain common family traits.
In pharmacology, the perfect drug would be one that binds only to one type or subtype of receptor and consistently produces only the desired biological effect, without the unwanted effects that can occur when drugs bind ‘off target’. Although this ideal is impossible to attain, it has proved possible to develop drugs that bind avidly to their target receptor to produce their desired effect and have very much less (but not zero) ability to bind to other receptors, even ones within the same family, which might produce unwanted effects.
Where a drug binds to one type of receptor in preference to another it is said to show selectivity of binding or selectivity of drug action. Selectivity is never absolute but is high with some drugs and low with others. A drug with a high degree of selectivity is likely to show a greater difference between the dose required for its biological action and the dose that produces an unwanted or toxic action.
Major types of receptors
Despite the great structural diversity of drug molecules, most act on the following major types of receptors to bring about biological change.
Transmembrane ion channels. These control the passage of ions across membranes and are widely distributed.
Seven-transmembrane (heptahelical) receptors. This is a large family of receptors, most of which signal via guanine nucleotide-binding proteins (G-proteins). Following activation by a ligand, second messenger substances are formed which can bring about cellular molecular changes, including the opening of transmembrane ion channels.
Enzyme-linked transmembrane receptors. This is a family of transmembrane receptors with an integral or associated enzymic component, such as a kinase or phosphatase. They signal changes in cells by phosphorylating or dephosphorylating intracellular proteins, thereby altering their activity.
Intracellular (nuclear) receptors. These receptors are found in the nucleus or translocate to the nucleus from the cytosol to modify gene transcription and the expression of specific cellular proteins.
It should be noted that some mechanisms, such as the opening of ion channels, can be operated by direct interactions of drugs with the channel, or by G-protein-coupled mechanisms occurring as a first step with subsequent intracellular events activating the ion channels.
Transmembrane ion channels
Transmembrane ion channels that create pores across phospholipid membranes are ubiquitous and allow the transport of ions into and out of cells. The intracellular concentrations of ions are controlled by a combination of ion pumps and transporters, which transport specific ions from one side of the membrane to the other in an energy-dependent manner, and ion channels, which open to allow the selective, passive transfer of ions down their concentration gradients. Based on concentration gradients across the cell membrane:
both Na+ and Ca2+ ions will diffuse into the cell if the channels are open, making the electrical potential of the cytosol more positive and causing depolarisation of excitable tissues,
K+ ions will diffuse out of the cell, making the electrical potential of the cytosol more negative and inhibiting depolarisation,
Cl− ions will diffuse into the cell, making the cytosol more negative and inhibiting depolarisation.
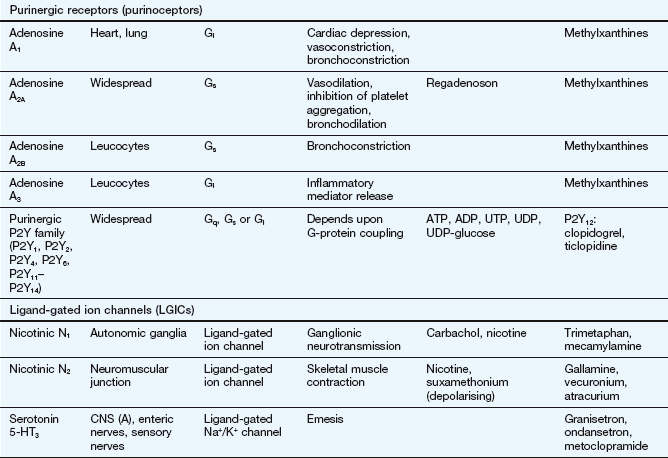
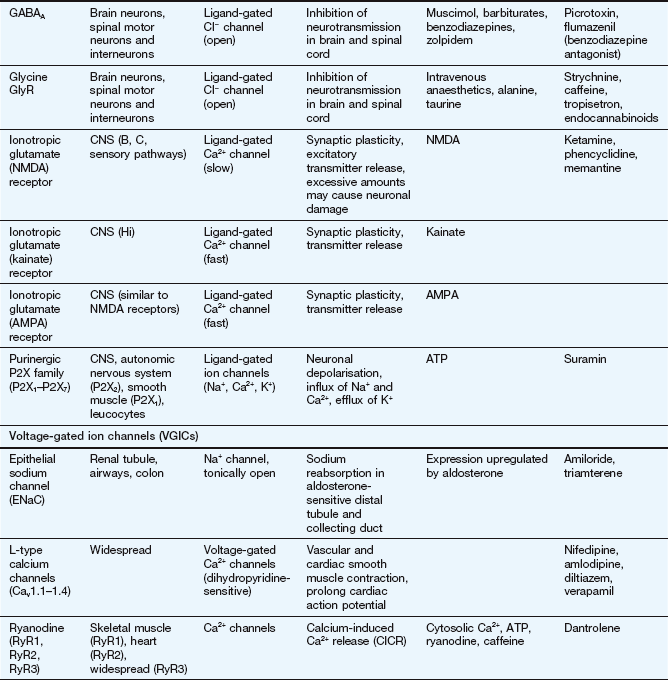
The two major families of channel are the ligand-gated ion channels (LGICs) and the voltage-gated ion channels (VGICs; also called ionotropic receptors). LGICs are opened by the binding of a ligand, such as acetylcholine, to an extracellular part of the channel. VGICs are opened at particular membrane potentials by voltage-sensing segments of the channel. Both channel types can be targets for drug action. Both LGICs and VGICs can control the transport of a specific ion, but a single type of ion may be transported by more than one type of channel, including both LGIC and VGIC types. The complexity that has evolved can be seen in the example of the multiple types of K+ channel listed in Table 8.1.
LGICs include nicotinic acetylcholine receptors, γ-aminobutyric acid (GABA) receptors, glycine receptors and serotonin (5-hydroxytryptamine) 5-HT3 receptors. They are typically pentamers, with each subunit comprising four transmembrane helices clustering around a central channel or pore. Each peptide subunit is orientated so that hydrophilic chains face towards the channel and hydrophobic chains towards the membrane lipid bilayer. Binding of an agonist to the receptor causes a conformational change in the protein and results in extremely fast opening of the ion channel. The nicotinic acetylcholine receptor is a good example of this type of structure (Fig. 1.1). It requires the binding of two molecules of acetylcholine for channel opening. Channel opening lasts only milliseconds because the ligand rapidly dissociates and is inactivated. Drugs may modulate LGIC activity by binding directly to the channel, or indirectly by acting on G-protein-coupled receptors (see below) with the subsequent intracellular events then affecting the status of the LGIC.
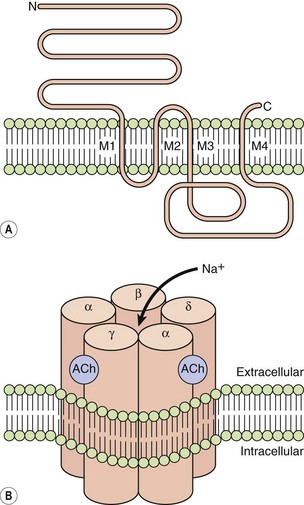
Fig. 1.1 The acetylcholine nicotinic receptor, a typical ligand-gated transmembrane ion channel.
(A) The receptor is constructed from subunits with four transmembrane regions (M1–M4). (B) Five subunits are assembled into the ion channel, which has two sites for acetylcholine binding, each formed by the extracellular domains of two adjacent subunits. On acetylcholine binding, the central pore undergoes conformational change that allows selective Na+ ion flow down its concentration gradient into the cell. N, amino terminus; C, carboxyl terminus.
VGICs include Ca2+, Na+ and K+ channels. The latter consist of four peptide subunits, each of which has between two and six transmembrane helices; in Ca2+ and Na+ channels there are four domains, each with six transmembrane helices, in a single large protein. The pore-forming regions of the transmembrane helices are largely responsible for the selectivity of the channel for a particular ion. Both Na+ and K+ channels are inactivated after opening; this is produced by an intracellular loop of the channel, which blocks the open channel from the intracellular end. The activity of VGICs may thus be modulated by drugs acting directly on the channel, such as local anaesthetics which maintain Na+ channels in the inactivated site by binding at the intracellular site (Ch. 18). Drugs may also modulate VGICs indirectly via intracellular signals from other receptors. For example, L-type Ca2+ channels are inactivated directly by calcium channel blockers, but also indirectly by drugs which reduce intracellular signalling from β1-adrenoceptors (see Fig. 5.5).
The ability of highly variable transmembrane subunits to assemble in a number of configurations leads to the existence of many different subtypes of channel for a single ion. For example, there are many different voltage-gated Ca2+ channels (L, N, P/Q, R and T types).
Seven-transmembrane receptors
Also known as 7TM receptors or the heptahelical receptor family, this is an extremely important group of receptors since the human genome has about 800 sequences for 7TM receptors and they are the targets of about 40% of modern drugs. The structure of a hypothetical 7TM receptor is shown in Figure 1.2; the N-terminal region of the polypeptide chain is on the extracellular side of the membrane and the polypeptide traverses the membrane seven times with helical regions, so that the C terminus is on the inside of the cell. The extracellular loops provide the receptor site for an appropriate agonist (a natural ligand or a drug), the binding of which alters the three-dimensional conformation of the receptor protein. The intracellular loops are involved in coupling this conformational change to the second messenger system, usually via a heterotrimeric G-protein, giving rise to the term G-protein-coupled receptor (GPCR).
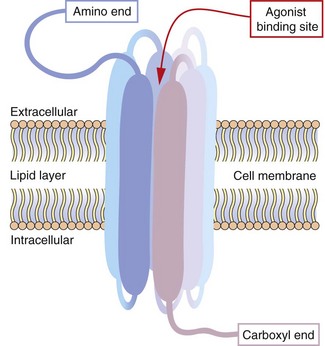
Fig. 1.2 Hypothetical seven-transmembrane (7TM) receptor.
The 7TM receptor is a single polypeptide chain with its amino (N-) terminus outside the cell membrane and its carboxyl (C-) terminus inside the cell. The chain is folded such that it crosses the membrane seven times, with each hydrophobic transmembrane region shown here as a thickened segment. The hydrophilic extracellular loops create a confined three-dimensional environment in which only the appropriate ligand can bind. Other potential ligands may be too large for the site or show much weaker binding characteristics. Selective ligand binding causes conformational change in the three-dimensional form of the receptor, which activates signalling proteins and enzymes associated with the intracellular loops, such as G-proteins and nucleotide cyclases.
The G-protein system: The heterotrimeric G-protein system (Fig. 1.3) consists of α, β and γ subunits.
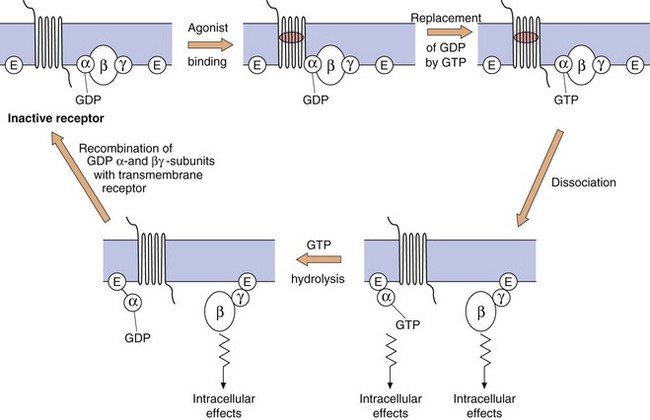
Fig. 1.3 The functioning of G-protein subunits.
Ligand (agonist) binding results in replacement of GDP on the α-subunit by GTP and the dissociation of the α- and βγ-subunits, each of which can affect a range of intracellular systems (shown as E on the figure) such as second messengers (e.g. adenylyl cyclase and phospholipase C), or other enzymes and ion channels (see Figs 1.4 and 1.5). Hydrolysis of GTP to GDP inactivates the α-subunit, which then recombines with the βγ-dimer to reform the inactive receptor.
The α-subunit. More than 20 different types have been identified, belonging to four families (αs, αi, αq and α12/13). The α-subunit is important because it binds GDP and GTP in its inactive and active states, respectively; it also has GTPase activity, which is involved in terminating its own activity. When an agonist binds to the receptor, GDP (which is normally present on the α-subunit) is replaced by GTP. The active α-subunit–GTP dissociates from the βγ-subunits and can activate enzymes such as adenylyl cyclase. The α-subunit–GTP complex is inactivated when the GTP is hydrolysed back to GDP by the GTPase.
The βγ-complex. There are many different isoforms of β- and γ-subunits that can combine into dimers, the normal function of which is to inhibit the α-subunit when the receptor is unoccupied. When the receptor is occupied by a ligand, the βγ-complex dissociates from the α-subunit and can itself activate cellular enzymes, such as phospholipase C. The α-subunit–GDP and βγ-subunit then recombine with the receptor protein to give the inactive form of the receptor–G-protein complex.
Second messenger systems: Second messengers are the key distributors of an external signal, as they are released into the cytosol and are responsible for affecting a wide variety of intracellular enzymes, ion channels and transporters. There are two complementary second messenger systems (Fig. 1.4).
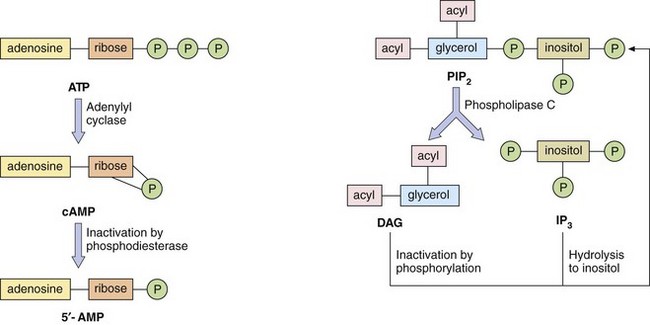
Fig. 1.4 Second messenger systems.
Stimulation of GPCRs produces intracellular changes by activating or inhibiting cascades of second messengers. Examples are cyclic adenosine monophosphate (cAMP), diacylglycerol (DAG) and inositol triphosphate (IP3) formed from phosphatidylinositol 4,5-bisphosphate (PIP2). See also Figure 1.5.
Cyclic nucleotide system: One system is based on cyclic nucleotides, such as:
cyclic adenosine monophosphate (cAMP), which is synthesised from adenosine triphosphate (ATP) by adenylyl cyclase; cAMP induces numerous cellular responses by activating protein kinase A (PKA), which phosphorylates proteins, many of which are enzymes; phosphorylation can either activate or suppress cell activity;
cyclic guanosine monophosphate (cGMP), which is synthesised from guanosine triphosphate (GTP) via guanylyl cyclase; cGMP exerts most of its actions through protein kinase G, which, when activated by cGMP, phosphorylates target proteins.
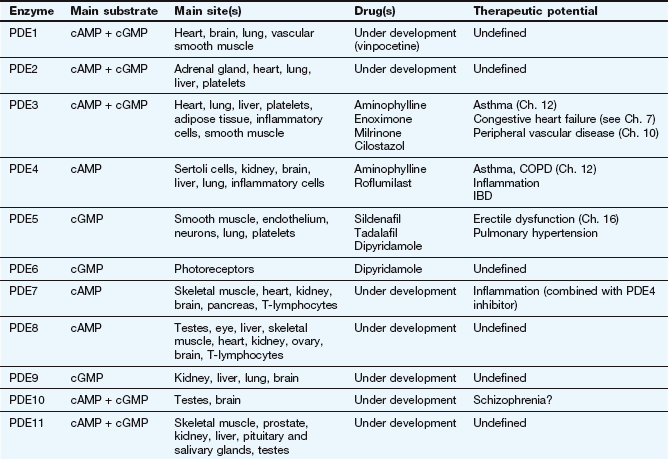
There are many isoforms of adenylyl cyclase; these show different tissue distributions and could be important sites of selective drug action in the future. The cyclic nucleotide second messenger (cAMP or cGMP) is inactivated by hydrolysis by phosphodiesterase (or PDE) isoenzymes to give AMP or GMP. There are 11 different families of phosphodiesterase isoenzymes, some of which are currently the targets of important drug groups (Table 1.1).
The phosphatidylinositol system: The other second messenger system is based on inositol 1,4,5-triphosphate (IP3) and diacylglycerol (DAG), which are synthesised from the membrane phospholipid phosphatidylinositol 4,5-bisphosphate (PIP2) by phospholipase C (Fig. 1.4). There are a number of isoenzymes of phospholipase C, which may be activated by the α-subunit–GTP or βγ-subunits of G-proteins. The main function of IP3 is to mobilise Ca2+ in cells. With the increase in Ca2+ brought about by IP3, DAG is able to activate protein kinase C (PKC) and phosphorylate target proteins. IP3 and DAG are then inactivated and converted back to PIP2.
Which second messenger systems are activated when a GPCR binds a selective ligand depends primarily on the nature of the Gα-subunit, as illustrated in Figure 1.5:
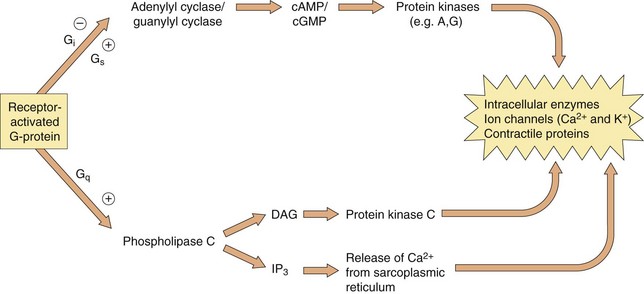
Fig. 1.5 The intracellular consequences of receptor activation.
The second messengers cAMP, cGMP, DAG and IP3 produce a number of intracellular changes, either directly, or indirectly via actions on protein kinases (which phosphorylate other proteins) or by actions on ion channels. The pathways can be activated or inhibited depending upon the type of receptor and G-protein and the particular ligand stimulating the receptor. The effect of the same second messenger can vary depending upon the biochemical functioning of cells in different tissues.
Gs: stimulation of adenylyl cyclase (increases cAMP), activation of Ca2+ channels,
Gi/o: inhibition of adenylyl cyclase (reduces cAMP), inhibition of Ca2+ channels, activation of K+ channels,
Gq/11: activation of phospholipase C, leading to DAG and IP3 signalling,
G12/13: activation of cytoskeletal and other proteins via the Rho family of GTPases, which influence smooth muscle contraction and proliferation.
The βγ-complex also has signalling activity: it can activate phospholipases and modulate some types of K+ and Ca2+ channels.
Activation of these second messenger systems by G-protein subunits thus affects many cellular processes such as enzyme activity (either directly or by altering gene transcription), contractile proteins, ion channels (affecting depolarisation of the cell) and cytokine production. The many different isoforms of Gα, Gβ and Gγ proteins may represent important future targets for selective drugs.
It is increasingly recognised that GPCRs may assemble into dimers of identical 7TM proteins (homodimers) or into heterodimers of different receptor proteins; the functional consequences of GPCR dimerisation and its implications for drug therapy are unclear.
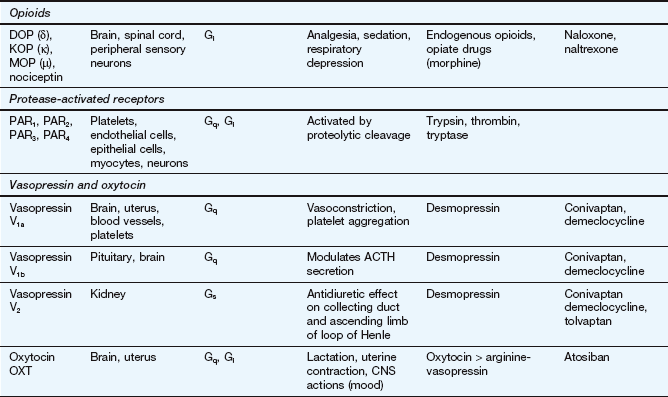
Protease-activated receptors: Protease-activated receptors (PARs) are GPCRs stimulated unusually by a ‘tethered ligand’ located within the N terminus of the receptor itself, rather than by an independent ligand. Proteolysis of the N-terminal sequence by serine proteases such as thrombin, trypsin and tryptase enables the residual tethered ligand to bind to the receptor within the second extracellular loop (Fig. 1.6). To date, four protease-activated receptors (PAR 1–4) have been identified, each with distinct N-terminal cleavage sites and different tethered ligands. The receptors appear to play roles in platelet activation and clotting (Ch. 11), and in inflammation and tissue repair. Most of the actions of PAR are mediated by Gi, Gq and G12/13.
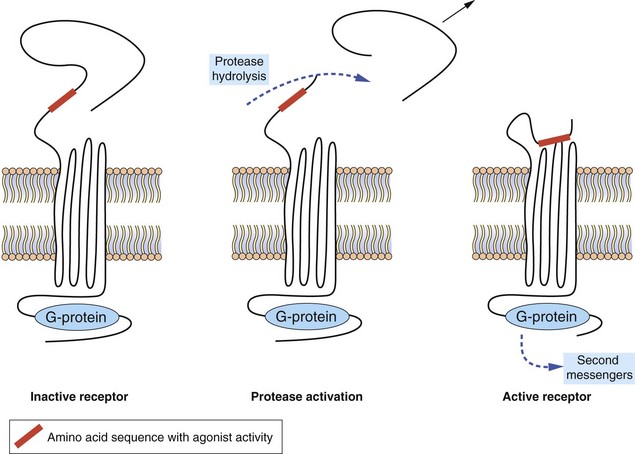
Fig. 1.6 Protease-activated receptors (PARs).
These GPCRs are activated by proteases such as thrombin which hydrolyse the extracellular peptide chain to expose a segment that acts as a tethered ligand (shown in red) and activates the receptor. The receptor is inactivated by phosphorylation of the intracellular (C-terminal) part of the receptor protein.
Enzyme-linked transmembrane receptors
Enzyme-linked receptors, most notably the receptor tyrosine kinases, are similar to the GPCRs in that they have a ligand-binding domain (or LBD) on the surface of the cell membrane, they traverse the membrane and they have an intracellular effector region (Fig. 1.7). They differ from GPCRs in their extracellular ligand-binding site, which is very large to accommodate their polypeptide ligands (including hormones, growth factors and cytokines), and in having only one transmembrane helical region. Importantly, their intracellular action requires a linked enzymic domain, most commonly an integral kinase domain which activates the receptor itself or other proteins by phosphorylation. Activation of enzyme-linked receptors enables binding and activation of many intracellular signalling proteins, leading to changes in gene transcription and in many cellular functions. There are five families of enzyme-linked transmembrane receptors.
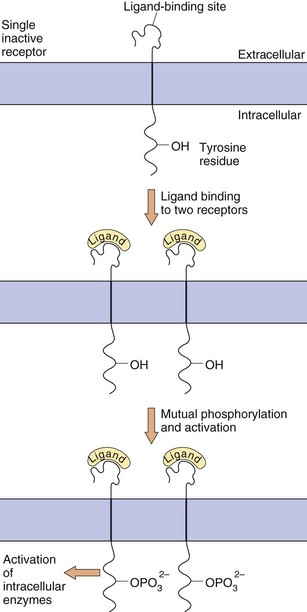
Fig. 1.7 Enzyme-linked transmembrane receptors.
This receptor tyrosine kinase has a large extracellular domain, a single transmembrane segment and an integral kinase domain. Ligand binding causes phosphorylation of tyrosine residues on the receptor and on other target proteins, leading to intracellular changes in cell behaviour. Other enzyme-linked receptors have tyrosine phosphatase, serine-threonine kinase or guanylyl cyclase enzymic activity.
Receptor tyrosine kinase (RTK) family: ligand binding causes receptor dimerisation and transphosphorylation of tyrosine residues within the receptor itself and sometimes in associated cytoplasmic proteins. Up to 20 classes of RTK include receptors for growth factors, many of which signal via proteins of the mitogen-activated protein (MAP) kinase cascade, leading to effects on gene transcription, apoptosis and cell division. Constitutive over-activity of an RTK called Bcr-Abl causes leucocyte proliferation in chronic myeloid leukaemia, which is treated with imatinib, a drug that blocks the uncontrolled RTK activity.
Tyrosine phosphatase receptor family: they dephosphorylate tyrosines on other transmembrane receptors or cytoplasmic proteins; they are particularly common in immune cells.
Tyrosine kinase-associated receptor family (or non-receptor tyrosine kinases): these lack integral kinase activity but activate separate kinases associated with the receptor; examples include inflammatory cytokine receptors and signalling via the Jak/Stat pathways to affect inflammatory gene expression.
Receptor serine-threonine kinase family: activation of these phosphorylates serine and threonine residues in target cytosolic proteins; everolimus is a serine-threonine kinase inhibitor used in renal and pancreatic cancer.
Receptor guanylyl cyclase family: members of this family catalyse the formation of cGMP from GTP via a cytosolic domain.
Intracellular (nuclear) receptors
Many hormones act at intracellular receptors to produce long-term changes in cellular activity by altering the genetic expression of enzymes, cytokines or receptor proteins. Such hormones are lipophilic to facilitate their movement across the cell membrane. Examples include the thyroid hormones and the large group of steroid hormones, including glucocorticoids, mineralocorticoids and the sex steroid hormones. Their actions on DNA transcription are mediated by interactions with intracellular receptors (Table 1.2) located either in the cytoplasm (type 1) or the nucleus (type 2).
Table 1.2
Some families of intracellular receptors
| Type 1 (cytoplasmic) | |
| Oestrogen receptors | ER (α, β) |
| Progesterone receptors | PR (A, B) |
| Androgen receptor | AR |
| Glucocorticoid receptor | GR |
| Mineralocorticoid receptor | MR |
| Type 2 (nuclear) | |
| Thyroid hormone receptors | TR (α, β) |
| Vitamin D receptor | VDR |
| Retinoic acid receptors | RAR (α, β, γ) |
| Retinoid X receptors | RXR (α, β, γ) |
| Liver X (oxysterol) receptors | LXR (α, β) |
| Peroxisome proliferator-activated receptors | PPAR (α, γ, δ) |
The intracellular receptor typically includes a highly conserved DNA-binding region with zinc-containing loops and a variable LBD (Table 1.3). The sequence of hormone binding and action for type 1 intracellular receptors is shown in Figure 1.8. Type 1 receptors are typically found in an inactive form in the cytoplasm linked to chaperone proteins such as heat-shock proteins (HSPs). Binding of the hormone induces conformational change in the receptor; this causes dissociation of the HSP and reveals a nuclear localisation sequence (or NLS) which enables the hormone–receptor complex to pass through nuclear membrane pores into the nucleus. Via their DNA-binding domain, the active hormone–receptor complexes can interact with hormone response elements (HRE) at numerous sites in the genome. Binding to the HRE usually activates gene transcription, but sometimes it silences gene expression and decreases mRNA synthesis.
Table 1.3
The structure of steroid hormone receptor proteins
| Section of protein | Domain | Role |
| A/B | N-terminal regulatory domain | Regulates transcriptional activity |
| C | DNA-binding domain | Highly conserved; binds receptor to DNA by two zinc-containing regions |
| D | Hinge region | Enables intracellular translocation |
| E | Ligand-binding domain | Enables specific ligand binding; also binds chaperone proteins and facilitates receptor dimerisation |
| F | C-terminal domain | Highly variable; unknown function |
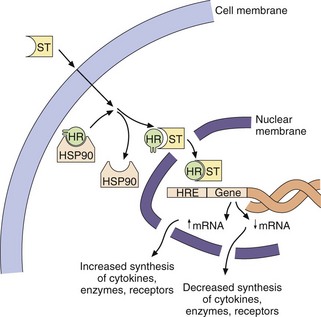
Fig. 1.8 The activation of intracellular hormone receptors.
Steroid hormones (ST) are lipid-soluble compounds which readily cross cell membranes and bind to their intracellular receptors (HR). This binding displaces a chaperone protein called heat-shock protein (HSP90) and the hormone–receptor complex enters the nucleus, where it can increase or decrease gene expression by binding to hormone response elements (HRE) on DNA. Intracellular receptors for many other ligands are activated in the nucleus itself.
Translocation and binding to DNA involves a variety of different chaperone, co-activator and co-repressor proteins, and the system is considerably more complex than indicated in Figure 1.8. Co-activators are transcriptional cofactors that also bind to the receptor and increase the level of gene induction; an example is histone acetylase, which facilitates transcription by increasing the ease of unravelling of DNA from histone proteins. Co-repressors also bind to the receptor and repress gene activation; an example is histone deacetylase, which prevents further transcription by tightening histone interaction with the DNA.
Type 2 intracellular receptors, such as the thyroid hormone receptors (TR) and the peroxisome proliferator-activated receptor (PPAR) family (Table 1.2), are found within the nucleus bound to co-repressor proteins, which are liberated by ligand binding without a receptor translocation step from the cytoplasm. PPAR nuclear receptors function as sensors for endogenous fatty acids, including eicosanoids (Ch. 29), and regulate the expression of genes that influence metabolic events.
Intracellular receptors are the molecular targets of 10–15% of marketed drugs, including steroid drugs acting at type 1 receptors and other drugs acting at type 2 receptors. Steroids show selectivity for different type 1 intracellular receptors (ER, PR, AR, GR, MR; see Table 1.2 for a list of abbreviations), which determine the spectrum of gene expression that is affected (Chs 14, 44, 45 and 46). Steroid effects are also determined by differential expression of these receptors in different tissues. Intracellular hormone–receptor complexes typically dimerise to bind to their HRE sites on DNA. Steroid receptors form homodimers (e.g. ER–ER) while most type 2 receptors form heterodimers, usually with RXR (e.g. RAR–RXR). The thiazolidinedione drugs used in diabetes mellitus (Ch. 40) and the fibrate class of lipid-lowering drugs (Ch. 48) act on specific members of the PPAR family of type 2 receptors.
Other sites of drug action
Probably every protein in the human body has the potential to have its structure or activity altered by foreign compounds. Traditionally, all drug targets were described pharmacologically as ‘receptors’, although many drug targets would not be defined as receptors in biochemical terms; in addition to the receptor types discussed above, drugs may act at numerous other sites.
Cell-membrane ion pumps. In contrast to passive diffusion, primary active transport of ions against their concentration gradients occurs via ATP-dependent ion pumps, which may be drug targets. For example, Na+/K+-ATPase in the brain is activated by the anticonvulsant drug phenytoin whereas that in cardiac tissue is inhibited by digoxin; K+/H+-ATPase in gastric parietal cells is inhibited by proton pump inhibitors (Ch. 33).
Transporter (carrier) proteins. Secondary active transport involves carrier proteins which transport a specific ion or organic molecule across a membrane; the energy for the transport derives not from a coupled ATPase but from the co-transport of another molecule down its concentration gradient, either in the same direction (symport) or the opposite direction (antiport). Examples are:
Na+/Cl− co-transport in the renal tubule, which is blocked by thiazide diuretics (Ch. 14),
the reuptake of neurotransmitters into nerve terminals by a number of transporters selectively blocked by classes of antidepressant drugs (Ch. 22).
Enzymes. Many drugs act on the intracellular or extracellular enzymes that synthesise or degrade the endogenous ligands for extracellular or intracellular receptors, or which are required for growth of bacterial, viral or tumour cells. Table 1.4 gives examples of drug groups that act on enzyme targets. The family of phosphodiesterase isoenzymes that regulate second messenger molecules are important drug targets and are listed in Table 1.1. As well as being sites of drug action, enzymes are involved in inactivating many drugs, while some drugs are administered as inactive precursors (pro-drugs) that are enzymatically activated (Ch. 2).
Table 1.4
Examples of enzymes as drug targets
| Enzyme | Drug class or use | Examples |
| Acetylcholinesterase (AChE) | AChE inhibitors (Ch. 27) | Neostigmine, edrophonium, organophosphates |
| Angiotensin-converting enzyme (ACE) | ACE inhibitors (Ch. 6) | Captopril, perindopril, ramipril |
| Carbonic anhydrase | Carbonic anhydrase inhibitors (Chs 14, 50) | Acetazolamide |
| Cyclo-oxygenase (COX)-1 | Non-steroidal anti-inflammatory drugs (NSAIDs) (Ch. 29) | Aspirin, ibuprofen, indometacin, naproxen |
| Cyclo-oxygenase (COX)-2 | Selective COX-2 inhibitors (Ch. 29) | Celecoxib, etoricoxib |
| Dihydrofolate reductase | Folate antagonists (Chs 51, 52) | Trimethoprim, methotrexate |
| DOPA decarboxylase | Peripheral decarboxylase inhibitors (PDIs) (Ch. 24) | Carbidopa, benserazide |
| HMG-CoA reductase | Statins (Ch. 48) | Atorvastatin, simvastatin |
| Monoamine oxidases (MAOs) A and B | MAO inhibitors (Chs 22, 24) | Moclobemide, selegiline |
| Phosphodiesterase (PDE) isoenzymes | PDE inhibitors (Chs 12, 16) | Theophylline, sildenafil (see Table 1.1) |
| Reverse transcriptase (RT) | Nucleoside RT inhibitors (Ch. 51) | Zidovudine |
| Thrombin | Direct thrombin inhibitors (Ch. 11) | Dabigatran |
| Viral proteases | HIV/hepatitis protease inhibitors (Ch. 51) | Saquinavir, boceprevir |
| Vitamin K epoxide reductase | Coumarin anticoagulants (Ch. 11) | Warfarin |
| Xanthine oxidase | Xanthine oxidase inhibitors (Ch. 31) | Allopurinol |
Adhesion molecules. These regulate the cell-surface interactions of immune cells with endothelial and other cells. Natalizumab is a monoclonal antibody directed against the α4-integrin component of vascular cell adhesion molecule (VCAM)-1 and is used to inhibit the autoimmune activity of lymphocytes in acute relapsing multiple sclerosis. Other monoclonal antibody-based therapies are targeted at cellular and humoral proteins including cytokines and intracellular signalling proteins to suppress inflammatory cell proliferation, activity and recruitment in immune disease.
Organelles and structural proteins. Examples include some antimicrobials that interfere with the functioning of ribosomal proteins in bacteria, and some types of anti-cancer drug that interrupt mitotic cell division by blocking microtubule formation.
The sites of action of some drugs remain unknown or poorly understood. Conversely, many orphan receptors have been discovered, the natural ligands of which are not yet recognised; these receptors may represent targets for novel drugs when their pharmacology is better understood.
Properties of receptors
The binding of a ligand to its receptor is normally reversible; consequently, the intensity and duration of the intracellular changes are dependent on repeated drug–receptor interactions that persist as long as the drug molecules remain in the local environment of the receptors. The duration of activity of a reversible drug therefore depends mainly on its distribution and elimination from the body (pharmacokinetics), not on the duration of binding of a drug molecule to a receptor. For a reversible drug, the extent of drug binding to the receptor (receptor occupancy) is proportional to the drug concentration; the higher the concentration, the greater the occupancy. The interaction between a reversible ligand and its receptor does not involve covalent chemical bonds but weaker, reversible forces such as:
ionic bonding between ionisable groups in the ligand (e.g. NH3+) and the receptor (e.g. COO−),
hydrogen bonding between amino-, hydroxyl-, keto- and other groups in the ligand and the receptor,
hydrophobic interactions between lipid-soluble sites in the ligand and receptor,
van der Waals forces, which are very weak inter-atomic attractions.
The receptor protein is not a rigid structure: binding of the ligand alters the conformation and biological properties of the protein.
Receptor selectivity
There are numerous possible extracellular and intracellular chemical signals produced in the body, which can affect many different processes. Therefore, a fundamental property of a ligand–receptor interaction is its selectivity; that is, the extent to which the receptor can recognise and respond to the correct signals, represented by one ligand or group of related ligands. Some receptors show high selectivity and bind a single endogenous ligand (e.g. acetylcholine is the only endogenous ligand that binds to N1 nicotinic receptors; see Ch. 4), whereas other receptors are less selective and will bind a number of related endogenous ligands (e.g. the β1-adrenoceptors on the heart will bind noradrenaline, adrenaline and to some extent dopamine, all of which are catecholamines).
The ability of receptors to recognise and bind the appropriate ligand depends on the intrinsic characteristics of the chemical structure of the ligand. The formulae of a few ligand families that bind to different receptors are shown in Figure 1.9; differences in structure that determine selectivity of action between receptors may be subtle, such as the differences illustrated between the structures of testosterone and progesterone, which nevertheless have markedly different hormonal effects on the body due to their receptor selectivity. Receptors are protein chains folded into tertiary and quaternary structures such that the necessary arrangement of specific bonding centres is brought together in a small volume: the receptor site (Fig. 1.10). Receptor selectivity occurs because the three-dimensional organisation of the different sites for reversible binding (such as anion and cation sites, lipid centres and hydrogen-bonding sites) corresponds better to the three-dimensional structure of the endogenous ligand than to that of other ligands.
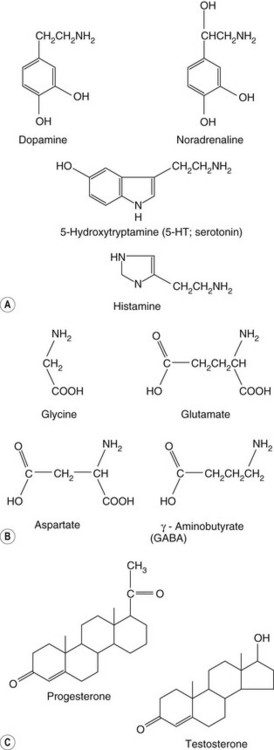
Fig. 1.9 Groups of related chemicals that show selectivity for different receptor subtypes in spite of similar structure.
(A) Biogenic amines; (B) amino acids; (C) steroids.
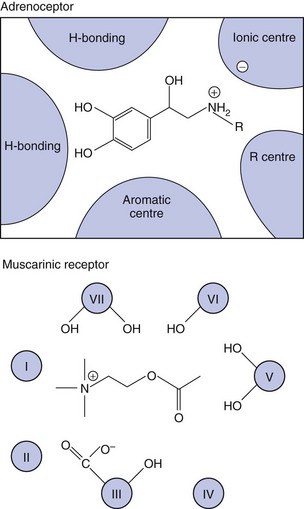
Fig. 1.10 Receptor ligand-binding sites.
The coloured areas are schematic representations of the regions of the adrenoceptor (top) and muscarinic receptor (bottom) responsible for binding their respective catecholamine and acetylcholine ligands. In the muscarinic receptor, cross-sections of the seven transmembrane segments are labelled I–VII. Different segments provide different properties (hydrogen bonding, anionic site, etc.) to make up the active binding site.
There may be a number of subtypes of a receptor, all of which can bind the same common ligand but which differ in their ability to recognise particular variants or derivatives of that ligand. For example, α1-, α2-, β1-, β2- and β3-adrenoceptors all bind adrenaline, but isoprenaline, a synthetic derivative of adrenaline, binds selectively to the three β-adrenoceptor subtypes rather than the two α-adrenoceptor subtypes (Ch. 4). As the adrenoceptor subtypes occur to a different extent in different tissues, and produce different intracellular changes when stimulated or blocked, drugs can be designed with highly selective and localised actions. The cardioselective β-adrenoceptor antagonists such as atenolol are selective blockers of the β1-adrenoceptor subtype that predominates on cardiac smooth muscle, with much less binding to the β2-adrenoceptors that predominate on bronchial smooth muscle. The different characteristics of the receptor subtypes therefore allow a drug (or natural ligand) with a particular three-dimensional structure to show selective actions by recognising one receptor preferentially, with fewer unwanted effects from stimulation or blockade of related receptors. Although ligands may have a much higher affinity for one receptor subtype over another, this is never absolute, so the term selective is preferred to specific.
Traditionally, receptor subtypes were discovered pharmacologically when a new agonist or antagonist compound was found to alter some, but not all, of the activities of a currently known receptor class. Developments in molecular biology, including the Human Genome Project, have accelerated the recognition and cloning of new receptors and receptor subtypes, including orphan receptors for which the natural ligands are unknown, and these developments are important in developing new drugs with greater selectivity and fewer unwanted effects. Based on such information it is recognised that there are multiple types of most receptors, and that there is genetic variation among individuals in the structures, properties and abundance of these receptors, which can lead to differences in drug response (pharmacogenetic variation; see end of this chapter and of Ch. 2). Greater understanding of genetic differences underlying human variability in drug responses offers the potential for individualisation of the mode of treatment and selection of the optimal drug and dosage.
Drug stereochemistry and activity
Receptors have a three-dimensional spatial organisation so the ligand has to have the correct configuration to fit the receptor, analogous to fitting a right hand into a right-handed glove. Drugs and other organic molecules show stereoisomerism when they contain four different chemical groups attached to a single carbon atom, or one or more double bonds, with the result that molecules with the same molecular formula have different three-dimensional configurations. If a drug is an equal (racemic) mixture of two stereoisomers, the stereoisomers may show different binding characteristics and biological properties. Most often, one stereoisomer is pharmacologically active while the other is inactive, but in some cases the inactive isomer may be responsible for the unwanted effects of the racemic mixture. Alternatively the two isomers may be active at different receptor subtypes and have synergistic or even opposing actions. The different isomers may also show different rates of metabolism (see Ch. 2). In consequence, there has been a trend for the development of single stereoisomers of drugs for therapeutic use; one of the earliest examples was the use of levodopa (the levo-isomer of DOPA) in Parkinson's disease (Ch. 24).
Receptor numbers
The number of receptors present in a cell is not static. There is usually a high turnover of receptors being formed and removed continuously. Cell-membrane receptor proteins are synthesised in the endoplasmic reticulum and transported to the plasma membrane; regulation of functional receptor numbers in the membrane occurs both by transport to the membrane (often as homo- or heterodimers) and by removal by internalisation. The number of receptors within the cell membrane may be altered by the drug being used for treatment, with either an increase (upregulation) or a decrease (downregulation) in receptor number and a consequent change in the ability of the drug to effect the desired theraputic response. This change may be an unwanted loss of drug activity contributing to tolerance to the effects of the drug (e.g. opioids, Ch. 19); as a result, increased doses may be needed to maintain the same activity. Alternatively, the change in receptor number may be an important part of the therapeutic response itself. An example is the tricyclic antidepressants (Ch. 22); these produce an immediate increase in the availability of monoamine neurotransmitters but the therapeutic response is associated with a subsequent, adaptive downregulation in monoamine receptor numbers occurring over weeks.
Properties of drug action
Drug actions can show a number of important properties:
Dose–response relationships
Using a pure preparation of a single drug, it is possible to define accurately and reproducibly the relationship between the doses of drug administered (or concentrations applied) and the biological effects (responses) at each dose. The results for an individual drug can be displayed on a dose–response curve. In many biological systems, the typical relationship between increasing drug dose (or concentration) and the response is a hyperbola. Plotting instead the logarithm of the dose or concentration against response (on a linear scale) generates a sigmoid (S-shaped) curve. A sigmoid response curve has a number of advantages: a very wide range of doses can be accommodated easily, the maximal response plateau is illustrated clearly and the central portion of the curve (between about 15 and 85% of maximum) approximates to a straight line, allowing the collection of fewer data points to delineate the relationship accurately.
Figure 1.11 shows the log dose–response relationship between a drug and its responses at two types of adrenoceptors. In each case, the upward slope of the curve to the right reflects the Law of Mass Action, the physical principle that a greater number of reversible molecular interactions of a drug (D) with its receptor (R), due in this case to increasing drug dose, leads to more intracellular signalling by active drug–receptor complexes (DR) and hence a greater response of the cell or tissue (within biological limits). This principle is diametrically opposed to the principle of homeopathy, which argues that serially diluting a drug solution until no drug molecules remain enhances its activity, a belief that is not supported theoretically or experimentally.
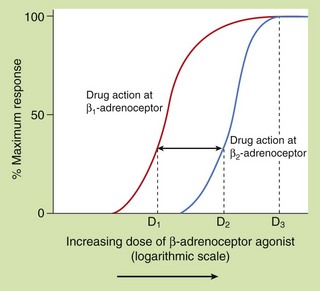
Fig. 1.11 Dose–response relationship and receptor selectivity.
Each curve shows the responses (expressed as percentage of maximum on a linear vertical axis) produced by a hypothetical β-adrenoceptor agonist drug at a range of doses shown on a logarithmic horizontal axis. Plotting the logarithmic dose allows a very wide range of doses to be shown on the same axes and transforms the dose–response relationship from a hyperbolic curve to a sigmoid (S-shaped) curve, in which, conveniently, the central portion is close to a straight line. The two curves illustrate the relative selectivity of the same drug for the β1-adrenoceptor compared to the β2-adrenoceptor. At most doses the drug produces β1-adrenoceptor stimulation with less effect on β2-adrenoceptors. If dose D1 is 10 times lower than dose D2, the selectivity of the drug for the β1-adrenoceptor is 10-fold higher. This selectivity diminishes at the higher end of the log dose–response curve and is completely lost at doses that produce a maximum response on both β1- and β2-adrenoceptors (D3).
Selectivity
As drugs may act preferentially on particular receptor types or subtypes, such as β1- and β2-adrenoceptors, it is important to be able to measure the degree of selectivity of a drug and to express it numerically. For example, it is important in understanding the therapeutic efficacy and unwanted effects of the bronchodilator drug salbutamol to recognise that it is approximately 10 times more effective in stimulating the β2-adrenoceptors in the airway smooth muscle than the β1-adrenoceptors in the heart.
In pharmacological studies this type of experiment is likely to be performed by studying the effects of the drug in vitro on different cells or tissues, each expressing one of the receptors of interest. Comparison of the two log dose–response curves in Figure 1.11 shows that for a given response, smaller doses of the drug being tested are required to stimulate the β1-adrenoceptor compared with those required to stimulate the β2-adrenoceptor; the drug is therefore said to have selectivity of action at the β1-adrenoceptor. The degree of receptor selectivity is given by the ratio of the doses of the drug required to produce a given level of response via each receptor type. It is clear from Figure 1.11 that the ratio is highly dose-dependent and disappears at very high drug doses, when a maximal response is mediated by both receptor subtypes due to the limits of the biological system being tested.
Potency
The potency of a drug in vitro is largely determined by the strength of its binding to the receptor, which is a reflection of the receptor affinity, and the ability of the drug/receptor complex to elicit downstream signalling events. The more potent a drug, the lower will be the concentration needed to bind to the receptor and give a specified response (for an agonist) or to block a response (for an antagonist). In Figure 1.12, drug A1 is more potent than drug A2 because it produces a specified level of response at a lower concentration. It is important to recognise that potencies of different drugs are compared using the doses required to produce (or block) the same response (often chosen arbitrarily as 50% of the maximal response). The straight-line portions of log dose–response curves are usually parallel for drugs that share a common mechanism of action, so the potency ratio is broadly the same at most response values, for example 20, 50 or 80%, but not at 100% response. A drug concentration sufficient to produce half of the greatest response achievable by that drug is described as its EC50 (the effective concentration for 50% of the maximal response). The EC50 (or ED50 if drug dose is considered) is a convenient way to compare the potencies of similar drugs; the lower the EC50 (or ED50) the more potent the drug.
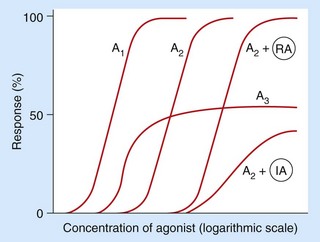
Fig. 1.12 Concentration–response curves for agonists in the absence or presence of reversible (competitive) or irreversible (non-competitive) antagonists.
Responses are plotted at different concentrations of two different full agonists (A1 being more potent than A2) and also a partial agonist (A3), which is unable to produce a maximal response even at high concentrations. Responses are also shown for the full agonist A2 in the presence of a fixed concentration of a reversible antagonist (RA) or a fixed concentration of an irreversible antagonist (IA). The reversible antagonist reduces the potency of A2 (the curve is shifted to the right), but A2 remains able to produce a maximal response at higher concentrations. The irreversible antagonist reduces both the potency and the maximal response achievable by A2.
In vivo, the potency of a drug, defined as the dose of the drug required to produce a desired clinical effect, depends not only on its affinity for the receptor, the receptor number and the efficiency of the stimulus-response mechanism, but also on pharmacokinetic variables that determine the delivery of the drug to its site of receptor action (Ch. 2). Therefore, the potencies of a series of related drugs in vivo may not directly reflect their in vitro receptor-binding properties.
Efficacy
The efficacy of a drug is its ability to produce the maximal response possible for a particular biological system and relates to the extent of functional change that can be imparted to the receptor by the drug. For example, agonists are traditionally divided into two main groups (Fig. 1.12):
full agonists (curves A1 and A2), which give an increase in response with an increase in concentration until the maximum possible response is obtained for that system,
partial agonists (curve A3), which also give an increase in response with increase in concentration but cannot produce the maximum possible response.
A third group, the inverse agonists, are described below. Drug efficacy is arguably of greater clinical importance than potency because a greater therapeutic benefit may be obtained with a more efficacious drug, while switching to a more potent drug may merely allow a smaller dose to be given for the same clinical benefit. In turn, efficacy and potency need to be balanced against drug toxicity to produce the best balance of benefit and risk for the patient. Drug toxicity and safety are discussed in Chs 3 and 53.
Types of drug action
Drugs can be classified by their receptor action as:
Agonists
An agonist, whether a therapeutic drug or an endogenous ligand, binds to the receptor or site of action and changes the conformation of the receptor to its active state, leading to signalling via its second messenger pathways. An agonist shows both affinity (the strength of binding for the receptor) and intrinsic efficacy or activity (the extent of functional change imparted to the receptor). Drugs may differ in their affinity and intrinsic activity at the same receptor as well as between different receptors.
Affinity and intrinsic activity
The affinity of a drug is related to the aggregate strength of the atomic interactions between the drug molecule and its receptor site of action, which determines the relative rates of drug binding and dissociation. The higher the affinity, the lower the drug concentration required to occupy a given fraction of receptors. Affinity therefore determines the drug concentration necessary to produce a certain response and is directly related to the potency of the drug. In Figure 1.12, drug A1 is more potent than drug A2, but both are capable of producing a maximal response (they have the same efficacy).
Intrinsic efficacy or activity describes the ability of the bound drug to induce the conformational changes in the receptor that induce receptor signalling. Although affinity is a prerequisite for binding to a receptor, a drug may bind with high affinity but have low intrinsic activity. A drug with zero intrinsic activity is an antagonist (see below).
It should be noted that the rate of binding and rate of dissociation of a reversible drug at its receptor are of negligible importance in determining its rate of onset or duration of effect in vivo, because these depend mainly on the rates of delivery of the drug to, and removal from, the target organ; that is, on the overall absorption or elimination rates of the drug from the body (Ch. 2).
Spare receptors
For compounds with relatively low intrinsic activity a maximal response may require all of the receptors to be occupied. However, many drugs have sufficient affinity that the maximal response can be produced even though many receptors remain unoccupied; that is, there may be spare receptors. The concept of spare receptors does not imply a distinct pool of permanently redundant receptors, only that a proportion of the receptor population is unoccupied at a particular point in time. Spare receptors may enhance the speed of cellular response, because an excess of available receptors reduces the time and distance that a ligand molecule needs to diffuse to find an unoccupied receptor; an example is the excess of acetylcholine nicotinic N2 receptors that contributes to fast synaptic transmission in the neuromuscular junction (Ch. 27).
The concept of spare receptors is also helpful when considering changes in receptor numbers during chronic treatment, particularly receptor downregulation. As maximal responses are often produced at drug concentrations that do not attain 100% receptor occupancy, the same maximal response may still be produced when receptor numbers are downregulated, but only with higher percentage occupancy of the reduced number of receptors and hence with a higher drug dose or concentration. Receptor downregulation may therefore contribute to drug tolerance.
Antagonists
A competitive antagonist binds to the active site of a receptor, either alone or in competition with a drug agonist or natural ligand, but the antagonist cannot cause the conformational change that converts the receptor to its active state. In other words, it has affinity (which may be as high as that of any agonist), but it has no intrinsic activity. The antagonist will, however, reduce access of an agonist ligand to the receptor-binding site and thereby reduce receptor activation. The antagonist effect may therefore only be detectable when an agonist is present, and the extent of antagonism will depend on the relative amounts of agonist and antagonist. For example, β1-adrenoceptor antagonists lower the heart rate markedly only when it is already elevated by endogenous agonists such as adrenaline and noradrenaline. The binding of most clinically useful competitive antagonists is reversible; in consequence, the receptor blockade can be overcome (surmounted) by an increase in the concentration of an agonist. Therefore, reversible antagonist drugs move the dose–response curve for an agonist to the right but do not alter the maximum possible response (as shown in curve A2 + RA when compared with A2 alone in Fig. 1.12).
Like agonists, antagonists exhibit selectivity of action. For example, propranolol is a non-selective antagonist blocking β1- and β2-adrenoceptors equally, whereas atenolol shows selective antagonism of β1-adrenoceptors.
Irreversible competitive antagonists bind covalently to the receptor site of action so a full response cannot be achieved even by a very large increase in agonist concentration (as shown in curve A2 + IA compared with A2 alone in Fig. 1.12). Irreversible antagonism is therefore insurmountable; an example of irreversible antagonism is the action of phenoxybenzamine at α-adrenoceptors.
Partial agonists
An agonist that is unable to produce a maximal response is a partial agonist (e.g. drug A3 in Fig. 1.12). Even maximal occupancy of all available receptors produces only a submaximal response due to low intrinsic activity of the partial agonist, for example because of incomplete amplification of the receptor signal via the G-proteins. Partial agonists can be considered to have both agonist and antagonist properties depending on the presence and type of other ligands. A partial agonist shows agonist activity in the absence of another ligand, and such partial agonism can be blocked by an antagonist. But, at high concentrations of a full agonist, a partial agonist will behave as an antagonist because it prevents access to the receptor of a molecule with higher intrinsic ability to initiate receptor signalling; this results in a reduced response. Partial agonism is responsible for the therapeutic efficacy of several drugs, including buspirone, buprenorphine, pindolol and salbutamol. These drugs can act as stabilisers of the variable activity of the natural ligand, as they enhance receptor activity when the endogenous ligand levels are low, but block receptor activity when endogenous ligand levels are high.
Inverse agonists
The descriptions above of agonists, partial agonists and antagonists reflect the classic model of drug–receptor interactions, in which an unoccupied receptor has no signalling activity. It is now recognised that many GPCRs show constitutive signalling independently of an agonist. Inverse agonists were first recognised when some compounds were found to show negative intrinsic efficacy: they acted alone on unoccupied receptors to produce a change opposite to that caused by an agonist. Inverse agonists shift the receptor equilibrium towards the inactive state, thereby reducing the level of spontaneous receptor activity. An inverse agonist can be distinguished from the ‘neutral’ antagonists discussed above, which, on their own, bind to the receptor without affecting receptor signalling. The action of a neutral antagonist depends on depriving the access of agonists to the receptor; a neutral antagonist can therefore block the effects of either a positive or inverse agonist at a receptor with spontaneous signalling activity.
The role of inverse agonism in the therapeutic effects of drugs remains to be fully elucidated, but a number of drugs exhibit this type of activity (Table 1.5). The same drug may even show full or partial agonism, inverse agonism or antagonism at different receptors. Some drugs, for example some β-adrenoceptor antagonists, can act as neutral antagonists at a receptor in one tissue and as inverse agonists when the same receptor is expressed in a different tissue, probably due to association of the receptor with different G-proteins.
Table 1.5
Examples of drugs with inverse agonist activity
| Receptor | Drugs |
| α1-Adrenoceptor | Prazosin, terazosin |
| β1-Adrenoceptor | Metoprolol |
| Angiotensin II receptor AT1 | Losartan, candesartan, irbesartan |
| Cannabinoid CB1 | Rimonabant |
| Cysteinyl-leukotriene CysLT1 | Montelukast, zafirlukast |
| Dopamine D2 | Haloperidol, clozapine, olanzapine |
| Histamine H1 | Cetirizine, loratadine |
| Histamine H2 | Cimetidine, ranitidine, famotidine |
| Muscarinic M1 | Pirenzepine |
Allosteric modulators
An allosteric modulator does not compete directly with an agonist for access to receptor active site (also called the orthosteric site), but binds to a different (allosteric) site on the receptor. Binding to the allosteric site can change receptor activity by altering the conformation of the protein so as to affect the normal (orthosteric) binding site and thereby enhance or decrease the binding of the natural ligand or other drugs to the receptor. An example is the benzodiazepine anxiolytic drugs, which allosterically alter the affinity of chloride channels for the neurotransmitter ligand GABA (Ch. 20). Alternatively, allosteric modulators may change the conformation of the receptor protein so that it alters domains required for receptor signalling without affecting the orthosteric site. Allosteric modulators may be reversible or irreversible.
Enzyme inhibitors/activators
Many drugs have a site of action that is an enzyme. Drugs act reversibly or irreversibly either on the catalytic site or at an allosteric site on the enzyme to modulate its catalytic activity; most often the effect is inhibition. Important examples are shown in Table 1.4.
Non-specific actions
A few drugs produce their desired therapeutic outcome without interaction with a specific site of action on a protein; for example, the diuretic mannitol exerts an osmotic effect in the lumen of the kidney tubule which reduces reabsorption of water into the blood (Ch. 14).
Physiological antagonists
Physiological antagonism is said to occur when a drug has a physiological effect opposing that of an agonist but without binding to the same receptor. The increase in heart rate produced by a β1-adrenoceptor agonist, an effect which mimics the action of the sympathetic autonomic nervous system, can be blocked pharmacologically with an antagonist at β1-adrenoceptors or physiologically by a muscarinic receptor agonist, which mimics the opposing (parasympathetic) autonomic nervous system. The site of action of the physiological antagonist may be on a different cell, tissue or organ to that of the agonist.
Tolerance to drug effects
Tolerance to drug effects is defined as a decrease in response with repeated doses. Tolerance may occur through pharmacokinetic changes in the concentrations of drug available at the receptor or through pharmacodynamic changes at the drug receptor. Pharmacokinetic effects are discussed in Chapter 2; some drugs stimulate their own metabolism, so they are eliminated more rapidly on repeated dosage and lower concentrations of drug are available to produce a response.
Most clinically important examples of tolerance arise from pharmacodynamic changes in receptor numbers and in concentration–response relationships. Desensitisation is used to describe both long-term and short-term changes arising from a decrease in response of the receptor. Desensitisation can occur by a number of mechanisms:
decreased receptor numbers (downregulation),
decreased receptor-binding affinity,
modulation of the downstream response to the initial signal.
GPCRs can show rapid desensitisation (within minutes) during continued activation, which occurs through three mechanisms.
Homologous desensitisation. The enzymes activated following selective binding of an agonist to its receptor–G-protein complex include G-protein coupled receptor kinases (GRKs), which interact with the βγ-subunit of the G-protein and inactivate the occupied receptor protein by phosphorylation; a related peptide, β-arrestin, enhances the GRK-mediated desensitisation.
Heterologous desensitisation. Also known as cross-desensitisation, this occurs when an agonist at one receptor causes loss of sensitivity to other agonists. The agonist increases intracellular cAMP which activates protein kinase A or C; these phosphorylate the cross-desensitised receptors (whether occupied or not) and inactivate them by uncoupling their G-proteins. Other mechanisms of heterologous desensitisation exist.
Receptor internalisation. Internalisation can occur within minutes when constant activation of a GPCR makes the receptor unavailable for further agonist action by uncoupling the G-protein from the receptor. The phosphorylated receptor protein is endocytosed and may undergo intracellular dephosphorylation prior to re-entering the cytoplasmic membrane.
Downstream modulation of the signal may also occur through feedback mechanisms or simply through depletion of some essential cofactor. An example of the latter is the depletion of the thiol (-SH; or sulphydryl) groups necessary for the generation of nitric oxide during chronic administration of organic nitrates (Ch. 5).
Genetic variation in drug responses
Biological characteristics, including responses to drug administration, vary among individuals and genetic differences can contribute to these inter-individual variations. For most drugs, the nature of the response is broadly similar in different individuals, but the magnitude of the response to the same dose can differ markedly, at least partly due to genetic factors. Such variability creates the need to individualise drug dosages for different people.
Drug responses may follow a unimodal (Gaussian) distribution, reflecting the sum of many small genetic variations in receptors, enzymes or transporters that respond to or handle the drug (Fig. 1.13A). Genetic variation may also give rise to discrete subpopulations of individuals in which a drug shows distinctly different responses (Fig. 1.13B), such that some individuals may have no response to a standard dose while others show toxicity. Understanding genetic variation is of increasing importance in drug development (see Ch. 3) because it allows the possibility of genetic screening to optimise drug and dosage selection (personalised or individualised medicine).
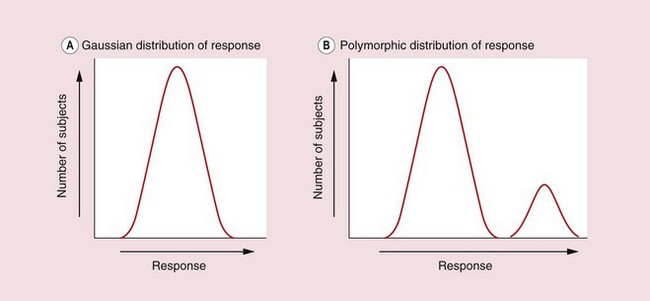
Fig. 1.13 Inter-individual variation in response.
The graphs show the numbers of individual subjects in a population plotted against their varying levels of response to a single dose of a drug. (A) In the unimodal distribution most individuals show a middling response and the overall shape is a normal (Gaussian) distribution. Part of this variability may result from polymorphism in multiple genes encoding drug receptors and proteins involved in the drug's absorption and elimination. (B) The bimodal distribution shows discrete responder and non-responder subgroups, possibly due to a single genetic polymorphism in a drug receptor or drug-metabolising enzyme.
Pharmacogenetics has been defined as the study of genetic variation that results in differing responses to drugs, including those arising due to differences in the metabolic fates of drugs in the body (Ch. 2). Pharmacogenetic research has been undertaken for many decades, largely in relation to variability in vivo, and has often used classic genetic techniques such as studies of patterns of inheritance in twins.
Pharmacogenomics has been defined as the investigation of variation in DNA and RNA characteristics related to drug response, and the term refers mainly to genome-wide approaches that define the presence of single-nucleotide polymorphisms (SNPs) which affect the activity of the gene product. Molecular biological techniques have predicted more than 3 million SNPs in the human genome. SNPs can be:
in the upstream regulatory sequence of a coding gene, which can result in increased or decreased expression of the gene product; this is otherwise identical to the normal or ‘wild-type’ gene product,
in the coding region of the gene resulting in a gene product with an altered amino acid sequence; this may have higher activity (although this is unlikely), similar activity, lower activity or no activity at all, compared to the wild-type protein,
inactive, because they are in non-coding or non-regulatory regions of the genome, or, if in a coding region, because the base change does not alter the amino acid encoded, due to the redundancy of the genetic code.
In consequence, a major challenge is defining the functional consequences of the large numbers of identified SNPs (functional genomics), particularly in the context of combinations of genetic variants (haplotypes). Such studies often require very large numbers of subjects to allow comparison of function in multiple, small haplotype subgroups.
Rapid advances in molecular biology have allowed analysis of inter-individual differences in the sequences of many genes encoding drug receptors and proteins involved in drug metabolism and transport. Polymorphisms in the latter are likely to have the greatest impact on dosage selection, while polymorphisms in drug targets may be more important in determining the optimal drug for a particular condition. For example, genetic variation in angiotensin AT1 receptors, β1-adrenoceptors and calcium ion channels may determine the relative effectiveness of angiotensin II receptor antagonists, β-adrenoceptor antagonists (β-blockers) and calcium channel blockers in the treatment of essential hypertension.
In practice, although genetic polymorphisms have been reported in many receptor types and these have been a major focus of research in relation to the aetiology of disease, relatively few studies to date have demonstrated a clear influence on drug responses. Common polymorphisms have been identified in the human β2-adrenoceptor gene ADRB2 and certain variants have been associated with differences in receptor downregulation and loss of theraeputic response in people with asthma while using β2-adrenoceptor agonist inhalers (Ch. 12). The clinical response in people with asthma to treatment with leukotriene modulator drugs is influenced by genetic polymorphism in enzymes of the leukotriene (5-lipoxygenase) pathway. Variants in the epidermal growth factor receptor (EGFR), a RTK, have been reported to predict tumour response to the EGFR inhibitor gefitinib in individuals with non-small-cell lung cancer. Such examples may support genotyping to target drug treatments to those individuals most likely to respond.
Conversely, pharmacogenetic information may be used to avoid a particular treatment in people likely to experience serious adverse reactions to a specific drug. Variation in human leucocyte antigen (HLA) genes has been associated with adverse skin and liver reactions to several drugs, including abacavir, an antiretroviral drug used in HIV infection.
Compared to pharmacodynamic targets, genetic variation has been more extensively characterised in drug-metabolising enzymes, particularly in cytochrome P450 isoenzymes and others involved in glucuronidation, acetylation and methylation. Gene variations in drug-metabolising enzymes are discussed at the end of Chapter 2. Information on human genotypic variation can be found on the Online Mendelian Inheritance in Man (OMIM) database (Johns Hopkins University; www.ncbi.nlm.nih.gov/omim). Therapeutic exploitation of genotypic differences will require specific information about individuals based on detailed genetic testing. Until such genetic information is available routinely, careful monitoring of clinical response will remain the best guide to successful treatment.
Conclusions
The therapeutic benefits of drugs arise from their ability to interact selectively with target receptors, most of which are regulatory molecules involved in the control of cellular and systemic functions by endogenous ligands. Drugs may also cause unwanted effects; judging the balance of benefit and risk is at the heart of safe and effective prescribing. Increasing knowledge of the complexity of receptor pharmacology and improvements in drug selectivity offer the promise of safer drugs in the future, especially when information on genetic variation is more routinely available.
True/false questions
1. Clinical pharmacology is the study of drugs that doctors use to treat disease.
2. Drugs act at receptors only on the external surface of the cell membrane.
3. Diluting drugs enhances their pharmacological effects.
4. Drugs produce permanent chemical changes in their receptors.
5. Plotting drug dose (or concentration) against response usually produces a sigmoid curve.
6. The EC50 is the concentration of drug that produces a half-maximal response.
7. On a log dose–response plot the drug with a curve to the right is more potent than a drug with its curve on the left.
8. An antagonist has zero affinity for the receptor.
9. A competitive antagonist shifts the log dose–response curve of an agonist to the right, without affecting the maximal response.
10. A partial agonist is one that, even at its highest dose, cannot achieve the same maximal response as a full agonist at the same receptor.
11. A full agonist achieves a maximal response when all its receptors are occupied.
12. Changes in receptor numbers can cause tolerance to drug effects.
1. True. Clinical pharmacology also deals with drugs used in disease prevention and diagnosis and in the alleviation of pain and suffering.
2. False. While many types of receptors are found on the cell membrane, including ion channels, G-protein-coupled receptors and tyrosine kinase receptors, other drug targets, including steroid receptors and many enzymes (e.g. cyclo-oxygenase, phosphodiesterase), are intracellular.
3. False. Drug effects depend on the number of interactions between drug molecules and their molecular targets (Law of Mass Action), so are usually greater at higher drug concentrations.
4. False. Molecular interactions between most drugs and their receptors are weak and transient and the conformational changes induced in the receptor are reversible; irreversible drugs may act by covalent chemical bonding.
5. False. Plotting drug dose or concentration against dose typically produces a hyperbola; a sigmoid (S-shaped) curve is produced by plotting the logarithm of dose or concentration against response.
6. True. The EC50 (or ED50) is the concentration (or dose) effective in producing 50% of the maximal response and is a convenient way of comparing drug potencies.
7. False. A drug with its log dose–reponse curve to the left is the more potent as it produces the same response at lower concentrations.
8. False. An antagonist must have affinity to bind to its receptor, but it has zero intrinsic ability to activate the receptor.
9. True. A fixed dose of a competitive antagonist can be surmounted by increasing the dose of agonist, so that the same maximal response can be achieved.
10. True. A partial agonist has low intrinsic ability to induce conformational change in the receptor so does not elicit a maximal response even with full receptor occupancy.
11. False. Many full agonists are able to elicit a maximal response when less than 100% of receptors are occupied; the unoccupied receptors are termed ‘spare receptors’.
12. True. Tolerance may be caused by downregulation or desensitisation of receptors, or by pharmacokinetic changes in drug concentrations available to interact with the receptor.
Examples of cell surface receptor families and their properties
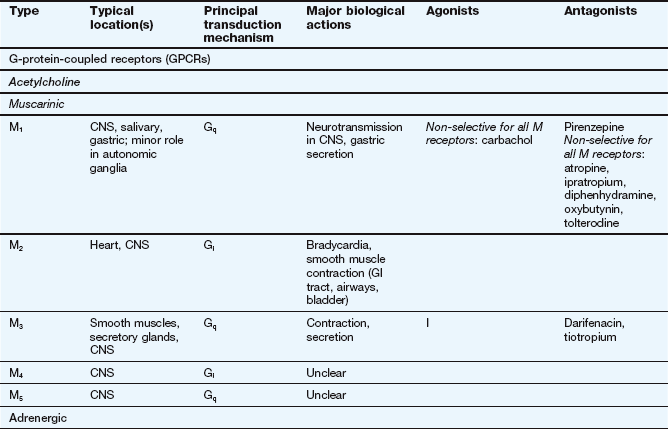
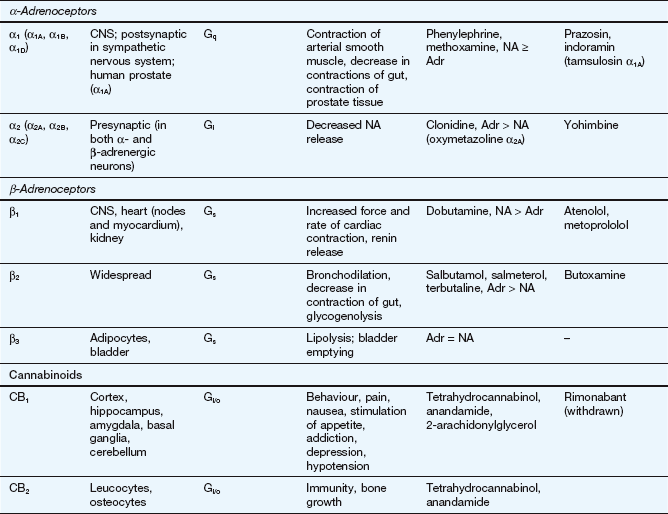
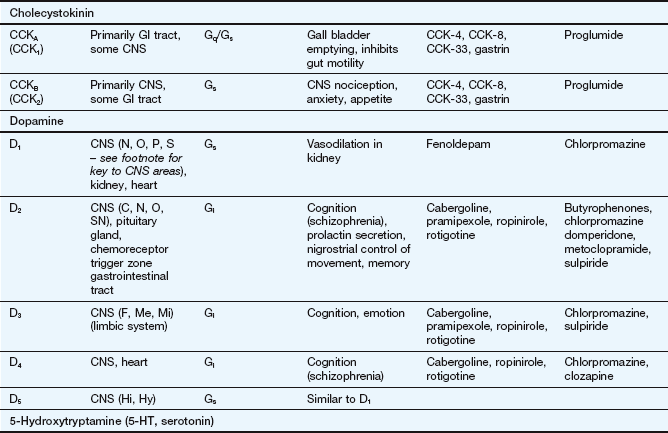
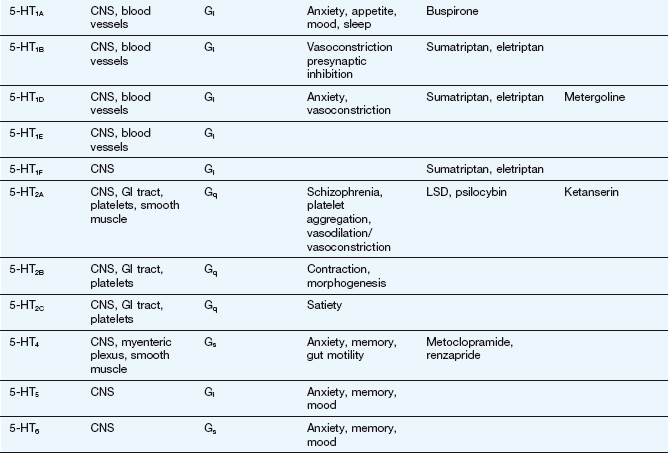
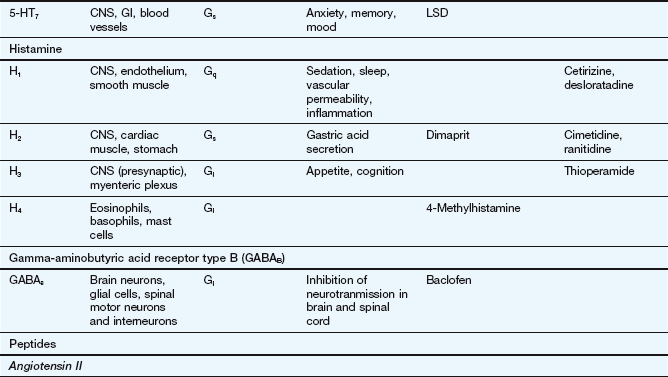
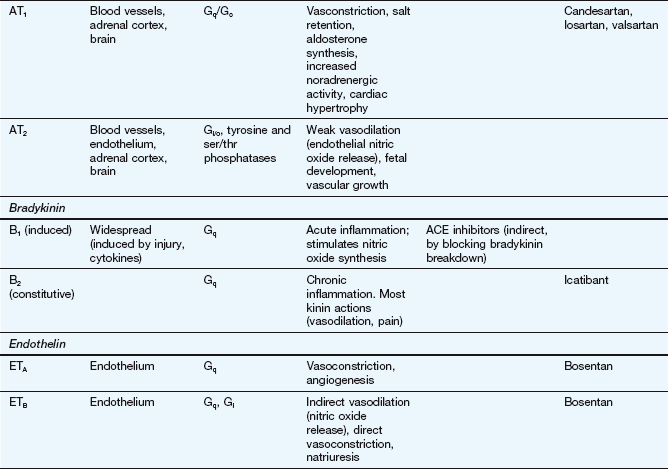
This table lists some important families of G-protein-coupled receptors, ligand-gated ion channels and voltage-gated ion channels, many of which are drug targets. See Tables 1.2 and 1.4 for examples of important intracellular receptors and enzymes targeted by therapeutic drugs. For further information see Alexander et al. (2011).
Abbreviations: ACE, angiotensin-converting enzyme; ACTH, adrenocorticotropic hormone (corticotropin); Adr, adrenaline; AMPA, α-amino-3-hydroxy-5-methyl-4-isoxazole propionic acid; CNS, central nervous system; GI, gastrointestinal; LSD, lysergic acid diethylamide; NA, noradrenaline; NMDA, N-methyl D-aspartate.
Key to CNS areas: A, Area postrema; B, basal ganglia; C, caudate putamen; F, frontal cortex; Hi, hippocampus; Hy, hypothalamus; Me, medulla; Mi, midbrain: N, nucleus accumbens; O, olfactory tubercle; P, putamen; S, striatum; SN, substantia nigra.
Ackerman, MJ, Clapham, DE. Ion-channels – basic science and clinical disease. N Engl J Med. 1997;336:1575–1586.
Alexander, SPH, Mathie, A, Peters, JA. Guide to receptors and channels (GRAC), 5th edition. Br J Pharmacol. 2011;164:S1–S324.
Bender, AT, Beavo, JA. Cyclic nucleotide phosphodiesterases: molecular regulation to clinical use. Pharmacol Rev. 2006;58:488–520.
Berger, JP, Akiyama, TE, Meinke, PT. PPARs: therapeutic targets for metabolic disease. Trends Pharmacol Sci. 2005;26:244–251.
Boswell-Smith, V, Spina, D, Page, CP. Phosphodiesterase inhibitors. Br J Pharmacol. 2006;147:S252–S257.
Costa, T, Cotecchia, S. Historical review: negative efficacy and the constitutive activity of G-protein coupled receptors. Trends Pharmacol Sci. 2005;26:618–624.
Hall, IP. Pharmacogenetics of asthma. Chest. 2006;130:1873–1878.
Hirano, K, Yufu, T, Hirano, M, Nishimura, J, Kanaide, H. Physiology and pathophysiology of proteinase-activated receptors (PARs): regulation of the expression of PARs. J Pharmacol Sci. 2005;97:31–37.
Katritch, V, Cherezov, V, Stevens, RC. Diversity and modularity of G protein-coupled receptor structures. Trends Pharmacol Sci. 2012;33:17–27.
Kenakin, T. Principles: receptor theory in pharmacology. Trends Pharmacol Sci. 2004;25:186–192.
Kobilka, BK, Deupi, X. Conformational complexity of G-protein-coupled receptors. Trends Pharmacol Sci. 2007;28:397–406.
Maxwell, S, Walley, T. Teaching safe and effective prescribing in UK medical schools: a core curriculum for tomorrow's doctors. Br J Clin Pharmacol. 2003;55:496–503.
Privalsky, ML. The role of corepressors in transcriptional regulation by nuclear hormone receptors. Annu Rev Physiol. 2004;66:315–360.
Rosenbaum, DM, Rasmussen, SGF, Kobilka, BK. The structure and function of G-protein-coupled receptors. Nature. 2009;459:356–363.
Shi, Y. Orphan nuclear receptors in drug discovery. Drug Discov Today. 2007;12:440–445.
Strange, PG. Mechanisms of inverse agonism at G-protein-coupled receptors. Trends Pharmacol Sci. 2003;23:89–95.
Traynelis, SF, Trejo, J. Protease-activated receptor signaling: new roles and regulatory mechanisms. Curr Opin Hematol. 2007;14:230–235.
Violin, JD, Lefkowitz, RJ. β-Arrestin-biased ligands at seven-transmembrane receptors. Trends Pharmacol Sci. 2007;28:416–422.
Wang, L, McLeod, HL, Weinshilboum, RM. Genomics and drug response. N Engl J Med. 2011;364:1144–1153.